Abstract
Existing inspection systems for railway point machines often suffer from high latency and poor interpretability, which impedes the real-time detection of critical mechanical anomalies, thereby increasing the risks of derailment and leading to cascading schedule delays. Addressing these challenges, this study proposes a lightweight computer vision-based detection framework deployed on the RK3588S edge platform. First, to overcome the accuracy degradation of segmentation networks on constrained edge NPUs, a Sensitivity-Aware Mixed-Precision Quantization and Heterogeneous Scheduling (SMPQ-HS) strategy is proposed. Second, a Multimodal Semantic Diagnostic Framework is constructed. By integrating geometric engagement depths—calculated via perspective rectification—with visual features, a Hard-Constrained Knowledge Embedding Paradigm is designed for the Qwen2.5-VL model. This approach constrains the stochastic reasoning of the Qwen2.5-VL model into standardized diagnostic conclusions. Experimental results demonstrate that the optimized model achieves an inference speed of 38.5 FPS and an mIoU of 0.849 on the RK3588S, significantly outperforming standard segmentation models in inference speed while maintaining high precision. Furthermore, the average depth-estimation error remains approximately 3%, and the VLM-based fault identification accuracy reaches 88%. Overall, this work provides a low-cost, deployable, and interpretable solution for intelligent point machine maintenance under edge-computing constraints.
1. Introduction
1.1. Research Background and Motivation
Railway and urban rail transit equipment are gradually transitioning towards digitalization and intelligent operation and maintenance. As a critical device ensuring train safety, the operational status of point machines directly impacts both operational safety and transport efficiency [1]. Due to their long-term exposure to complex outdoor environments, point machines are susceptible to influences such as vibration, oil contamination, and temperature fluctuations. These factors frequently lead to mechanical failures such as insufficient contact distance or jamming. Crucially, the failure of a point machine does not merely cause local equipment downtime; it triggers severe systemic consequences. Minor anomalies can lead to signal misinterpretation and forced speed reductions, while critical failures may result in turnout locking or even catastrophic derailment incidents [2]. Research regarding the Swedish Railway Network explicitly demonstrates that infrastructure incidents are a primary driver of unpunctuality [3,4,5]. These failures frequently trigger a cascade of “knock-on” delays, where a single-point failure propagates across the network, causing extensive traffic disruptions far exceeding the initial repair time. Therefore, achieving frequent, precise, and traceable state monitoring is not just an engineering requirement but a necessity for controlling operational costs and ensuring passenger safety.
1.2. Review of Existing Methods and Limitations
Traditional maintenance strategies for point machines generally rely heavily on manual inspection and periodic disassembly, alongside basic contact sensors. Although signal-based sensor technologies have been employed to mitigate these issues, they still face significant hurdles. Vibration sensors, though useful for monitoring operating conditions, are prone to external interference in high-noise environments and lack the sensitivity to detect incipient mechanical faults [6]. Similarly, current sensors can indicate equipment health, but they are susceptible to environmental changes and equipment aging, which often invalidate threshold settings and lead to false alarms [7]. Furthermore, although contact sensors offer continuous monitoring, their installation in the confined spaces of point machines introduces risks of mechanical interference and is restricted by stringent railway safety regulations.
Computer vision has emerged as a robust non-contact alternative, offering superior adaptability and precision in detecting minute defects compared to traditional methods. Despite these advantages, practical application is hindered by environmental and computational bottlenecks. Specifically, variable lighting in tunnels and high hardware requirements often compromise reliability [8,9,10]. Moreover, a critical ‘Accuracy-Latency’ paradox exists: computationally heavy models struggle on edge devices, while lightweight alternatives fail to meet safety-grade precision [11].
Furthermore, a significant “Data-Semantics” gap remains in current research. Existing studies predominantly focus on “detection” while neglecting “diagnosis”. Mere bounding boxes or numerical depth values are insufficient for O&M personnel to make immediate, actionable decisions [12]. There is a distinct lack of closed-loop systems capable of autonomously translating visual features into standardized, interpretable maintenance advice without relying on cloud-based post-processing. Consequently, there is an urgent need for a unified framework that can achieve real-time, high-precision geometric measurement on low-power edge chips while providing expert-level semantic diagnosis.
1.3. Contributions
To address the limited real-time performance and insufficient interpretability of current point machine inspection methods, this paper proposes an integrated “edge perception–geometric measurement–semantic diagnosis” framework. Validated on a self-collected dataset of 1600 images and deployed on the RK3588S embedded platform, the major contributions are summarized as follows:
- A Hardware-Aware Optimization Strategy for Real-Time Edge Deployment;
To resolve the conflict between high-accuracy segmentation demands and limited edge resources, we propose a Sensitivity-Aware Mixed-Precision Quantization (SMPQ) strategy combined with heterogeneous scheduling. Unlike standard uniform quantization, this method theoretically identifies the precision sensitivity of segmentation heads versus backbones, applying INT8 acceleration to the latter while retaining FP16 for the former. Experimental results demonstrate a speedup of approximately 6.1× (reaching 38.5 FPS) compared to the ONNX Runtime baseline, while maintaining a segmentation accuracy (mAP@0.5) of 92.9%, satisfying strict real-time railway maintenance requirements.
- 2.
- Multimodal Diagnostic Paradigm via Hard-Constrained Knowledge Embedding.
To overcome the “black box” limitation of numerical detection, we propose an interpretable Vision-Language Diagnostic Paradigm. This framework fuses visual features with geometric priors to construct a multimodal input space. Crucially, to mitigate the stochastic nature of generative AI in safety-critical contexts, we design a Hard-Constrained Knowledge Embedding (Role-Rule-Format) mechanism. This framework achieves a measurement error of less than 3% and provides semantic diagnostic reports with a classification accuracy of 88.0%, significantly improving the practical utility for field operators.
2. Related Work
In railway point machine fault diagnosis and condition monitoring, manual inspection remains the dominant approach, while recent studies have shifted toward data-driven intelligent perception. Existing methods can be broadly classified into signal-based diagnostics and computer vision-based inspection. To summarize this evolution and highlight the unique position of the proposed framework, Table 1 provides a comparative overview of existing maintenance methods.

Table 1.
Comparison of mainstream methods for point machine inspection.
2.1. Signal-Based Fault Diagnosis
Signal processing methods primarily utilize 1D time-series data such as electrical current, vibration, and acoustic signals to identify internal mechanical or electrical faults. Early studies relied on threshold comparisons and dynamic time warping, which lacked adaptability. Recently, deep learning has been widely adopted to extract high-dimensional features. Shi et al. [13] proposed an improved Deep Convolutional Neural Network combined with Support Vector Data Description to address the sample imbalance problem in current curves, effectively identifying minor faults. Moving beyond current signals, Sun et al. [14] utilized vibration signals, arguing they are more sensitive to mechanical degradation. They proposed a hybrid approach using Variational Mode Decomposition and Multi-scale Permutation Entropy, which significantly reduced noise interference compared to traditional Empirical Mode Decomposition. Similarly, Li et al. [15] introduced LD-RPMNet, a lightweight framework combining CNN and Transformers for near-sensor acoustic diagnosis, emphasizing the importance of edge computing efficiency. While signal-based methods are effective for internal state analysis, they suffer from “non-visual interpretability.” For instance, they can detect increased resistance but cannot distinguish whether it is caused by a foreign object or lack of lubrication. Furthermore, signal quality is easily compromised by electromagnetic interference in the railway environment.
Despite extensive research on sensor-based signal processing, existing methods remain constrained by significant environmental vulnerabilities and perceptual blind spots in real-world applications. Specifically, the harsh high-voltage electromagnetic environment along railway lines, combined with equipment aging effects, frequently induces signal distortion or drift, rendering preset detection thresholds ineffective under dynamic operating conditions. Furthermore, approaches relying on one-dimensional signals face an inherent “non-visual interpretability” barrier; while capable of quantitatively characterizing fluctuations in physical parameters, they lack the capacity to qualitatively identify the specific physical root causes of faults. Consequently, the integration of computer vision—leveraging its rich semantic information—has emerged as a pivotal research direction for overcoming these monitoring bottlenecks.
2.2. Computer Vision-Based Inspection
With the advancement of deep learning, computer vision has become a mainstream solution for detecting external structural anomalies. Early researchers adopted two-stage or heavy segmentation networks to ensure precision. For instance, Wei et al. [16] proposed RTINet based on DeepLabv3+ for semantic segmentation of turnout areas, achieving high pixel-level accuracy. However, such architectures typically require substantial computational resources and memory bandwidth, limiting their frame rates on edge devices. To address real-time requirements, single-stage detectors have gained popularity. Cao et al. [17] developed an improved YOLOv7 model with an integrated CBAM attention mechanism for state identification of sliding chairs in railway turnout systems under complex lighting conditions. Compared with two-stage networks such as Mask R-CNN, the YOLO family significantly optimizes the trade-off between precision and inference latency. Furthermore, current studies often focus on model architecture improvements on high-performance GPUs, lacking sufficient adaptation strategies for low-power edge platforms where NPU constraints are strict. To achieve embedded real-time inference, researchers have explored model compression and quantization techniques. Integer quantization, pruning, and weight sharing significantly reduce model size and latency. Modern edge processors—such as RK3588S—provide dedicated NPUs, enabling INT8/FP16 acceleration via toolchains such as RKNN Toolkit [18,19]. Nevertheless, hardware support for heterogeneous operators remains incomplete, and scheduling inefficiencies may hinder performance.
Although existing computer vision methods have significantly improved visual perception capabilities, they are primarily discriminative rather than reasoning-oriented. These approaches can effectively output bounding boxes or segmentation masks, yet they lack semantic reasoning abilities to generate actionable and interpretable maintenance descriptions.
2.3. From Visual Perception to Semantic Reasoning
To bridge the gap between visual perception and semantic understanding, Vision-Language Models have emerged as a powerful paradigm. VLMs can align visual features with textual descriptions, enabling open-set recognition and complex reasoning. Models such as BLIP-2 and Qwen2.5-VL can integrate visual and textual information to generate structured diagnostic descriptions, offering a promising paradigm for interpretable prediction in industrial maintenance [20,21,22]. However, most VLM-based systems assume ideal cloud computing environments, often overlooking the constraints of edge-side deployment and the specialized nature of railway maintenance knowledge.
To address the deployment challenges of large models in resource-constrained networks, Lyu et al. [23] investigated a pruning-aware co-inference scheme. Their theoretical analysis demonstrates that partitioning large models between edge devices and servers, combined with model pruning, effectively optimizes the trade-off between inference distortion and system latency. Similarly, to manage the dynamic computational loads in such heterogeneous architectures, He et al. [24] proposed an active inference-based task offloading approach. By utilizing rewardless guidance strategies, this method achieves superior latency control compared to traditional reinforcement learning. These studies provide strong theoretical support for adopting an edge-cloud collaborative architecture, where lightweight perception is handled at the edge while computationally intensive semantic reasoning is offloaded to the cloud.
Furthermore, applying general-purpose VLMs to specific railway scenarios requires bridging the domain knowledge gap. Peng et al. [2] proposed a Railway Fault Diagnosis LLM using a two-stage adaptation strategy combining LoRA and instruction tuning. Their work proves that aligning semantic representations with specific industrial rules is crucial for accurate diagnosis. Inspired by this, but differing from their heavy fine-tuning approach, our system leverages the strong zero-shot instruction-following capability of Qwen2.5-VL. We employ a lightweight, structured prompt engineering strategy to inject railway domain knowledge, enabling the VLM to perform standardized diagnostic reasoning without the high cost of retraining.
3. System Design
3.1. Overall System Architecture
The system adopts a layered architecture of “Edge Perception—Cloud Diagnosis—Client Interaction,” aiming to balance the real-time performance and semantic understanding of point machine detection. The system uses the RK3588S as the edge computing core, in collaboration with cloud-based large models and remote clients, achieving edge-cloud data communication through a virtual local area network. The overall architecture is shown in Figure 1.
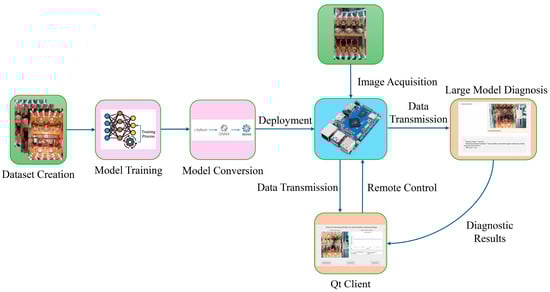
Figure 1.
Schematic diagram of the overall system architecture. Colors denote: data preparation (green), model development (pink), edge deployment (blue), and interaction layers (orange).
- Edge Perception Layer;
Deployed on the RK3588S embedded platform, this layer is responsible for real-time processing of high-frequency data. It utilizes the YOLO11-seg model accelerated by RKNN to perform moving contact segmentation and combines perspective correction algorithms to locally calculate engagement depths. The processed structured data and corrected images are uploaded in real-time, while H.264 video streams are pushed through FFmpeg.
- 2.
- Cloud Semantic Layer;
Deployed on a high-performance GPU server, this layer carries out the system’s “cognitive” function. It receives the images and depth data uploaded from the edge, using the Qwen2.5-VL-7B visual language model for cross-modal inference. The output includes semantic diagnostic reports containing detection status, maintenance suggestions, and risk levels.
- 3.
- Client Interaction Layer.
A visual client developed based on Qt. This layer pulls real-time monitoring videos via the RTMP protocol, synchronously renders depth trend graphs and diagnostic conclusions sent from the cloud, and supports anomaly alerts and historical data tracing, providing intuitive decision-making support for O&M personnel.
3.2. Deployment Optimization of YOLO11-Seg on the RK3588S Platform
3.2.1. Model Conversion and Quantization
When trained in the PyTorch (v2.4.1) environment, the original YOLO11-seg model contains a large number of floating-point parameters. Direct deployment on the RK3588S platform would result in high inference latency, excessive storage demand, and increased power consumption. To address these challenges, this study develops a three-stage conversion and mixed-precision quantization pipeline—PyTorch → ONNX → RKNN—to enable efficient migration from the training framework to edge-side inference, as illustrated in Figure 2.
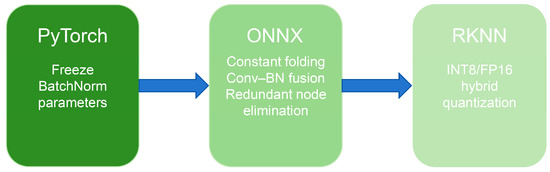
Figure 2.
Model conversion and quantization workflow.
First, the model weights are exported from PyTorch, and all BatchNorm layers are frozen to avoid unstable statistical shifts during quantization. The model is then converted into the ONNX format as an intermediate representation, ensuring cross-platform operator compatibility and facilitating downstream deployment. To further improve structural compactness and computational efficiency, standard ONNX graph optimizations were applied, including constant folding, subgraph fusion, and redundant node elimination, to streamline the computational graph.
During quantization, RKNN Toolkit 1.6 is employed to perform mixed INT8/FP16 quantization. Based on the sensitivity of different network components to precision loss, the following strategy is adopted:
- The backbone and selected neck layers are quantized to INT8 to maximize NPU parallel acceleration;
- Key detection and segmentation head layers retain FP16 precision to mitigate boundary degradation caused by aggressive quantization.
A calibration set consisting of 100 representative point machine images—including normal, shallow, deep, and non-contact cases—is selected from the self-built dataset to ensure robustness and diverse activation distribution. Kullback–Leibler divergence is used to determine optimal activation thresholds, and per-channel calibration is applied to quantization-sensitive layers to suppress accuracy loss.
Through this conversion pipeline, the model maintains high segmentation accuracy while achieving a lightweight architecture suitable for real-time edge deployment. To explicitly elucidate the algorithmic logic behind the layer-wise precision assignment, the detailed execution flow of the SMPQ strategy is outlined in Algorithm 1.
| Algorithm 1: Sensitivity-Aware Mixed-Precision Quantization (SMPQ) |
| Input: M_float: Pre-trained floating-point model D_cal: Calibration dataset T_sens: Sensitivity threshold for precision selection Output: M_quant: Optimized mixed-precision model for RK3588S Procedure SMPQ(M_float, D_cal, T_sens):
|
Algorithm 1 formalizes the decision-making process for mixed-precision quantization. It iterates through the network layers, evaluating the feature distortion caused by quantization using Cosine Similarity. Layers exhibiting high sensitivity to precision loss—or those belonging to critical segmentation heads—are retained in FP16 to prevent boundary degradation. Conversely, robust backbone layers are quantized to INT8, optimizing the inference throughput on the edge NPU.
3.2.2. Heterogeneous Task Scheduling
While model quantization reduces computational complexity, fully exploiting the SoC’s potential requires matching operators to the most suitable hardware units. To ensure the system’s deployability across various edge environments, we designed a generic resource-aware scheduling paradigm adaptable to modern asymmetric multi-core SoCs. In this framework, edge computing resources are abstracted into three functional tiers: an I/O and Control Tier for high-frequency, low-load tasks such as image acquisition; a Tensor Acceleration Tier dedicated to parallel matrix computations like backbone inference; and a Logic Processing Tier for complex non-linear post-processing. In this study, we instantiate this generic paradigm on the RK3588S platform. Specifically, the I/O Tier is mapped to the low-power Cortex-A55 cores, the Tensor Tier to the 6-TOPS NPU, and the Logic Tier to the high-performance Cortex-A76 cores, as illustrated in Figure 3 and detailed below:
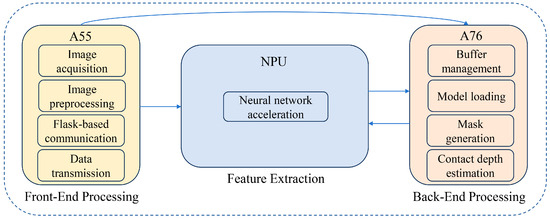
Figure 3.
Schematic diagram of the heterogeneous task scheduling strategy.
- Preprocessing tasks: Image acquisition, preprocessing, Flask communication, and ZeroTier networking operations are executed on low-power A55 cores due to low computational intensity and high I/O frequency, thereby reserving high-performance cores for inference tasks;
- Feature-extraction tasks: The backbone and selected neck layers are mapped to the NPU, leveraging quantized tensor computation to accelerate convolution, BatchNorm, and activation operations;
- Postprocessing tasks: Decoding and mask generation—including feature map decoding, threshold filtering, non-maximum suppression, mask binarization, and depth estimation—are executed on A76 CPU cores using parallel threading to efficiently process non-linear and branching operations unsuitable for NPU execution.
At the software level, the Linux Completely Fair Scheduler is employed to maintain load balance. When NPU queue congestion is detected, low-priority operators dynamically fall back to CPU execution, preventing inference stalls and ensuring pipeline continuity. A shared-memory mechanism is adopted for intermediate tensor transfer between CPU and NPU, eliminating repeated memory copying. Lightweight mutexes and semaphore-based synchronization enable concurrent execution of inference and data transmission.
Through coordinated multi-core execution and resource-aware task assignment, the proposed scheduling strategy reduces end-to-end latency and significantly improves throughput stability, enabling real-time segmentation performance under edge-computing constraints.
3.3. Geometric Prior-Based Depth Estimation and Large-Model-Based Diagnosis
To overcome the limitations of traditional vision-based detection systems, which “only output numerical values and lack semantic interpretation,” and to address the errors introduced by varying shooting angles in non-contact measurements, this study develops an integrated processing pipeline of “Geometric Correction—Depth Quantification—Semantic Diagnosis.” This module employs a geometric prior-based approach to perform engagement depth calculation, fusing it with visual features and inputting the data into the Qwen2.5-VL visual language model, ultimately outputting structured maintenance recommendations.
3.3.1. Depth Calculation Based on Geometric Priors
The four fixed bolts (A, B, C, D) of the static contacts in the point machines’ automatic open–close device exhibit mechanical stability, with their relative spatial positions remaining constant. To address image perspective distortions caused by device vibration during operation, this study uses these four bolt pairs as geometric constraint references. The homography matrix H is solved to establish a pixel mapping relationship between the distorted image and the standard front view. Perspective transformation techniques are then applied to restore the tilted images to the standard front view, as shown in Figure 4, in order to eliminate the interference of angle shifts on the measurement.
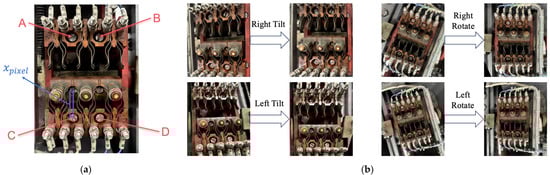
Figure 4.
Geometric constraint definition and perspective rectification. (a) Illustration of the static contact bolts (marked as A, B, C, D) used as reference points and the definition of the relative pixel distance for depth estimation; (b) Visual comparison of point machine images before and after perspective correction under different viewing angles.
Following image rectification, quantifying the engagement depth requires a precise mapping between the pixel coordinate () and the physical distance (d). Drawing upon our previous research [25], the cubic polynomial was selected as the optimal regressor to balance fitting precision and numerical stability. The relationship is defined as follows:
where d is the engagement depth (mm), and is the relative pixel position of the moving contact in the corrected image.
Through experimental calibration and least squares fitting, this non-linear model effectively compensates for the edge errors caused by lens distortion, enabling millimeter-level depth quantification without the need for a scale.
3.3.2. Intelligent Diagnosis Based on Vision-Language Models
To overcome the limitations of traditional vision-based detection systems, which “only output numerical values and lack semantic interpretation,” this study introduces the Qwen2.5-VL-7B visual language model to construct an intelligent diagnostic module for the point machines. Specifically, Qwen2.5-VL is selected over other mainstream models (e.g., GPT-4V or LLaVA) to balance reasoning performance with industrial constraints. Unlike commercial closed-source models that pose data leakage risks, Qwen2.5-VL supports private offline deployment, strictly complying with railway data sovereignty regulations. Furthermore, it exhibits superior zero-shot instruction-following capabilities compared to earlier open-source alternatives, ensuring the reliable generation of the structured JSON outputs required by the control system. Distinct from parameter-efficient fine-tuning (PEFT) methods like LoRA, this study explicitly adopts a “Frozen-Parameter” strategy based on In-Context Learning (ICL). This approach leverages the model’s native reasoning capabilities to avoid overfitting risks on limited railway datasets and reduces the maintenance complexity of edge-cloud deployment. Consequently, the desired diagnostic standardization is achieved solely through structured prompt constraints without modifying model weights.
By integrating “image-text” cross-modal information, the system enables an upgrade from “feature recognition” to “fault understanding,” providing structured and actionable diagnostic results to offer direct decision-making support for O&M personnel. The input to the VLM module must balance “visual feature integrity” with “numerical accuracy.” The core inputs consist of two types of data transmitted from the edge processing layer: the corrected images of the point machines and the engagement depth values. Both types of data are preprocessed to form a standardized input format.
To guide the large model in accurately focusing on the point machine diagnostic task and avoid generalization errors, this study designs a structured prompt template embedded with railway industry rules. Unlike general dialogue instructions, this prompt template employs a three-layer architecture of “role definition + rule constraints + format locking,” as shown in Table 2.
Table 2.
Qwen2.5-VL visual language model prompt structure design.
The core optimization points of this prompt template are as follows: (1) converting the ambiguous “fault judgment” into a quantifiable threshold standard to avoid subjective interpretation biases in the VLM; (2) limiting the output to a JSON-structured format, facilitating automatic parsing by subsequent programs and reducing text processing complexity; (3) defining the “component recognition priority” logic, which directly terminates the diagnosis if the image quality does not meet the standard, thereby improving the reliability of the results.
The inference process of Qwen2.5-VL-7B adopts a “visual encoding + text encoding + cross-modal attention fusion” architecture, as shown in Figure 5. The specific implementation process is as follows: First, the image is processed by the model’s visual encoder to extract pixel-level features, producing a 1024-dimensional visual feature vector. The engagement depth values and prompt text are then transformed into a 512-dimensional text feature vector by the Transformer-based text encoder. Subsequently, the cross-modal attention layer associates and fuses these two feature types, capturing the mapping relationship between “depth values” and “visual component states.” Finally, the decoder generates the diagnostic results in the specified prompt format.

Figure 5.
Architecture of Qwen2.5-VL.
To ensure engineering usability, the VLM output undergoes a two-stage verification process.
Stage 1: Format validation checks whether all required fields—“detection_status,” “maintenance_advice,” and “risk_level”—are present and syntactically valid in the JSON output. Missing or malformed fields trigger a “retry” status.
Stage 2: Logical consistency checking ensures coherence between fields. For example, if “detection_status” is “normal,” then “maintenance_advice” must not recommend shutdown-level interventions, and “risk_level” must be “low.” Any detected inconsistencies are automatically corrected to “medium risk,” and the adjustment is logged to prevent misleading outputs.
4. Experiments and Results Analysis
4.1. Experimental Environment
4.1.1. Hardware and Software Platform
Model training was carried out on a workstation equipped with a 13th-generation Intel(R) Core(TM) i9-13400F CPU, 32 GB of RAM, and an NVIDIA GeForce RTX 4060 GPU with 8 GB of memory. The system operated under Ubuntu 20.04 LTS. The deep learning framework was implemented using Python 3.8 and PyTorch 2.4.1, accelerated by CUDA 11.8 and cuDNN 8.9.2. OpenCV 4.8.0 was employed for image processing operations.
For model training, the batch size was set to 32 with 8 worker threads, and the maximum number of training epochs was 300. The Stochastic Gradient Descent (SGD) optimizer was adopted, with a momentum of 0.937 and a weight decay of 0.0005. The initial learning rate was fixed at 0.01. A linear warm-up strategy was applied during the first three epochs, after which a cosine annealing learning rate schedule was employed. To alleviate overfitting, early stopping was implemented with a patience of 50 epochs. The model checkpoint yielding the highest mean Average Precision (mAP) on the validation set was selected for final evaluation. The configuration of the testing platform is summarized in Table 3.
Table 3.
Hardware and software configuration of the experimental platforms.
4.1.2. Experimental Dataset
In this study, a self-constructed dataset of point machines was employed. A comprehensive dataset focusing on the contact status of ZD6 electric point machines was constructed at the Rail Transit Training Base of Shanghai University of Engineering Science. The dataset comprises 800 original images with a resolution of 1280 × 960 pixels, capturing diverse environmental conditions such as standard illumination, low-light tunnel simulations, and complex scenarios with dust interference.
The dataset annotation strictly followed two dimensions: visual segmentation and geometric diagnosis. For the segmentation task, the LabelMe tool was employed to generate pixel-level masks for three key components: the Moving Contact, the Static Contact, and the Reference Bolts used for perspective rectification. For the diagnostic task, the Ground Truth for engagement depth was acquired using a high-precision digital micrometer to physically measure the gap distance at the moment of image capture. Based on railway maintenance standards, the samples were classified into four diagnostic categories: Normal Engagement for depths within the standard range, Shallow Engagement for insufficient depth, Deep Engagement for excessive depth, and No Contact. As illustrated in Figure 6a, these states exhibit distinct visual characteristics in the contact area.
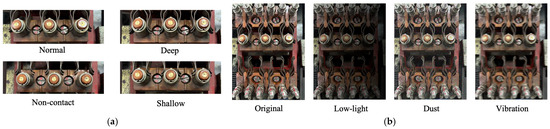
Figure 6.
Visualization of the experimental dataset samples. (a) The four labeled contact states; (b) Data augmentation samples simulating complex environmental interference.
To minimize subjective errors and ensure label accuracy, a multi-stage quality control process was implemented. This process consisted of initial annotation by trained researchers, a cross-validation phase where 20% of samples were exchanged for consistency checks, and a final review where senior maintenance engineers verified hard samples with severe occlusion or extreme angles. To mitigate data imbalance resulting from the scarcity of fault samples in real-world operations, we implemented a composite augmentation pipeline simulating complex railway environments. Specifically, Gaussian noise injection and HSV brightness scaling were employed to mimic environmental interference, while directional motion blur and linear gradient masks were applied to reproduce sensor instability and uneven lighting conditions. This strategy expanded the total dataset to 1600 samples. The effects of data augmentation are illustrated in Figure 6b. Despite the constrained scale compared to open-world datasets, this configuration is tailored to the specific attributes of the ZD6 point machine. Unlike natural scenes, point machines are standardized industrial components with fixed structures and highly constrained visual patterns, ensuring that samples from a single site remain representative. Furthermore, due to strict railway safety regulations, reproducing critical faults on active lines is prohibited; thus, the high-fidelity simulation platform serves as the essential source for these rare samples. Therefore, this study prioritizes annotation precision over raw quantity, aiming to validate the feasibility of the proposed framework under controlled variables rather than claiming full generalization at this stage. Finally, the dataset was divided into training, validation, and test sets with a ratio of 7:1:2. The detailed distribution of the augmented dataset across different fault types and environmental conditions is summarized in Table 4.
Table 4.
Detailed statistics of the augmented dataset.
4.1.3. Evaluation Metrics
To comprehensively assess the performance of each module in the proposed system, this study establishes corresponding evaluation metrics from three perspectives: semantic segmentation accuracy, diagnostic recognition capability, and system real-time efficiency.
For the key component segmentation task, mean Average Precision (mAP@0.5), mean Intersection over Union (mIoU), and frame rate (FPS) are adopted. Since the dataset primarily targets specific component classes, mAP@0.5 measures the precision of detection at an intersection over union threshold of 0.5. mIoU quantifies the overlap between the predicted segmentation mask and the ground truth. FPS is used to evaluate the real-time inference speed of the model on the RK3588S edge platform.
The VLM-based diagnostic module classifies results into five categories. Given the potential class imbalance in fault scenarios, Classification Accuracy and the Macro-averaged F1 Score are employed. Accuracy measures the overall correctness of the predictions, while Macro-F1 calculates the arithmetic mean of the F1 scores for each class, ensuring that the performance on minority defect classes is adequately represented in the evaluation. To ensure a rigorous evaluation of system reliability, any sample for which the VLM fails to generate a valid structured JSON output is categorized as a ‘Detection Failure’ and is explicitly counted as an incorrect prediction in the calculation of overall accuracy.
System Efficiency and Robustness Metrics To rigorously assess the practical feasibility of the proposed edge-cloud collaborative architecture, we introduce two system-level metrics. End-to-End Latency (): defined as the total time elapsed from image acquisition at the edge to the display of the diagnostic report on the client. It is decomposed as , where , , and represent the edge processing time, data transmission time, and cloud inference time, respectively. Diagnostic Success Rate under Weak Networks is defined as the ratio of successfully generated diagnostic reports to the total number of requests under varying network conditions. This metric evaluates the system’s reliability in unstable railway network environments.
4.2. Performance Evaluation of the Optimized YOLO11-Seg
4.2.1. Ablation Study
To validate the contributions of each design component within the proposed “three-stage quantization + heterogeneous scheduling” strategy to model size, inference speed, and segmentation accuracy, a comprehensive ablation study is conducted. All experiments are repeated five times under the same test set and hardware environment, and the mean and standard deviation are reported. The ablation factors include model format and quantization schemes, as well as the heterogeneous scheduling strategy.
The experimental results are presented in Table 5 and Table 6. As shown in the tables: (1) After exporting the trained FP32 model to the ONNX format, the model size increases slightly while the inference latency decreases marginally, indicating that ONNX export and operator fusion provide moderate performance gains on CPU platforms. (2) When the model is converted to RKNN with INT8 quantization, the model size is reduced from 6.5 MB to 3.2 MB, and the average inference time on the RK3588S decreases from 180 ms to 22 ms. The frame rate is significantly improved, demonstrating the substantial hardware-level parallel acceleration enabled by quantization. (3) Under the hybrid quantization strategy, retaining FP16 precision for the detection/segmentation head while applying INT8 to the backbone helps recover part of the accuracy with only a minor loss in inference speed. This indicates that hybrid quantization provides a more practical balance between accuracy and efficiency. (4) The NPU-priority strategy achieves a clear advantage in inference speed, with an average frame rate of 45.3 FPS. However, because all operators are forcibly mapped to the NPU, certain marginal operators experience precision degradation, resulting in a slightly lower mAP compared with the hybrid strategy. The NPU + A76 co-execution scheme recovers part of the accuracy with only a slight reduction in speed, making it suitable for final deployment. In contrast, the NPU-fallback-to-CPU strategy, although compatible, incurs significantly higher latency and is not appropriate for real-time detection scenarios. A comparison of the INT8-quantized model under different scheduling strategies is shown in Figure 7.
Table 5.
Comparison of model size and inference speed.
Table 6.
Performance comparison of models under different heterogeneous scheduling strategies.
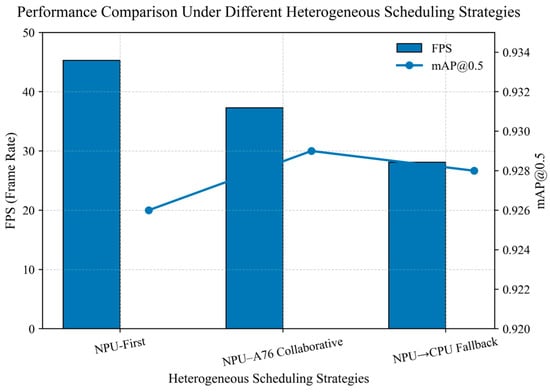
Figure 7.
Performance comparison of scheduling strategies.
To assess the statistical significance of accuracy differences before and after quantization, a paired t-test (α = 0.05) was conducted on the mAP values. The results indicate that the difference between the RKNN-INT8 model and the FP32 model is statistically significant (p < 0.05). However, under the hybrid quantization scheme, the difference is not statistically significant (p ≥ 0.05), further supporting the effectiveness of the hybrid approach. In summary, the ablation experiments validate that the proposed quantization and scheduling strategies effectively balance real-time performance and segmentation accuracy.
4.2.2. Model Comparison Experiments
To further validate the overall performance of the proposed “three-stage conversion and hybrid quantization strategy,” this section selects several state-of-the-art object detection and instance/semantic segmentation models as baselines, including YOLOv5-Seg, YOLOv8-Seg, Mask R-CNN, and DeepLabV3+. The YOLO-series models represent lightweight one-stage detection frameworks, whereas Mask R-CNN and DeepLabV3+ correspond to two-stage detection and semantic segmentation paradigms, respectively. All models are trained and evaluated on the same dataset with identical training settings. The input resolution is uniformly set to 640 × 640, and the test set proportion is fixed at 0.2.
It is worth noting that the architectures of Mask R-CNN and DeepLabV3+ are relatively complex, and several operators in these networks are not fully supported by the RKNN toolchain or the NPU hardware. Experimental verification indicates that these models can only run on the RK3588 platform via ONNX Runtime in CPU mode, making it difficult to achieve real-time inference on edge devices.
To highlight the performance advantages of the proposed method on edge platforms, all baseline models are exported to ONNX FP32 format and executed using ONNX Runtime without quantization or graph-level optimization. In contrast, the proposed method applies the full three-stage conversion and hybrid quantization pipeline and leverages NPU-priority or NPU–A76 co-scheduling strategies for deployment on the RK3588S platform. This allows for a comprehensive evaluation of its overall performance in terms of both accuracy and real-time efficiency.
As shown in Table 7, when the baseline models are executed on the RK3588 platform via ONNX Runtime, they retain the original accuracy of their FP32 formats. However, due to the absence of operator fusion and hardware acceleration, their average inference latency generally exceeds 100 ms, resulting in poor real-time performance. Among them, Mask R-CNN and DeepLabV3+ exhibit the highest latency, reaching 382.6 ms and 309.4 ms, respectively, making them unsuitable for real-time embedded applications.
Table 7.
Deployment performance comparison of different models on the RK3588 platform.
In contrast, the proposed model, after undergoing the three-stage conversion and hybrid quantization process, achieves a model size of only 3.6 MB, with an average inference latency reduced to 26 ms and a frame rate of 38.5 FPS. This demonstrates efficient on-device deployment with negligible accuracy loss. Moreover, migrating the model from the ONNX inference path to the RKNN inference path yields a speedup of approximately 6.1×, while the mAP and mIoU decrease by only 0.002, respectively. This confirms that the proposed “conversion + hybrid quantization + scheduling” pipeline offers significant advantages in balancing accuracy and computational efficiency.
These results indicate that the proposed method not only optimizes the model architecture and data flow but also fully exploits the parallel computing capability of the RK3588 NPU.
4.2.3. Visualization Analysis
To provide an intuitive demonstration of the detection performance on edge devices, this study visualizes and compares the segmentation results of different models on representative point-machine samples, as shown in Figure 8. Due to incomplete operator support in the RKNN Toolchain and the NPU hardware, the YOLOv5-Seg, YOLOv8-Seg, Mask R-CNN, and DeepLabV3+ models can only be executed on the RK3588S platform via ONNX Runtime for result generation. In contrast, the proposed YOLO11-seg model, equipped with the three-stage conversion and hybrid quantization strategy, is successfully deployed for real-time inference on the RK3588S NPU, delivering higher computational efficiency and better deployment adaptability.
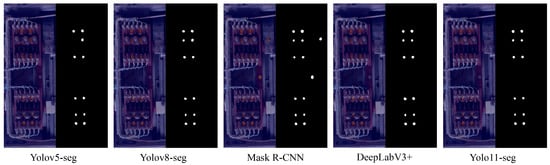
Figure 8.
Visual comparison of segmentation results across different models (YOLOv5, YOLOv8, Mask R-CNN, DeepLabV3+, and the proposed YOLO11). The white regions in the binary masks represent the segmented key components, while the black background represents non-target areas.
As shown in Figure 8, YOLOv5-Seg and YOLOv8-Seg can identify the key components of the point machines; however, their segmentation results exhibit jagged boundaries and local missing regions. Mask R-CNN produces relatively smooth mask contours but is prone to false detections in complex backgrounds. DeepLabV3+ demonstrates stable performance in recognizing large regions but lacks the ability to capture small objects and fine details. In contrast, the proposed method achieves higher mask accuracy and better boundary adherence in on-device inference, producing clearer segmentation maps with significantly reduced background interference.
These results indicate that the proposed quantization and operator-fusion strategy effectively compresses model size and reduces inference latency while maintaining strong feature representation and visual consistency. This ensures high-quality visual inputs for subsequent depth estimation and intelligent diagnostic modules.
4.3. Accuracy Evaluation of Depth Estimation
Quantitative Analysis To validate the effectiveness of the proposed cubic polynomial model in real-world scenarios, a quantitative evaluation was conducted using 120 representative samples from the self-constructed dataset. We employed Mean Absolute Error (MAE) and Root Mean Square Error (RMSE) as evaluation metrics. The results are summarized in Table 8.
Table 8.
Depth estimation accuracy under different operating conditions.
As shown in Table 8, the proposed method achieves an average MAE of 0.21 mm and an RMSE of 0.34 mm across all samples. In the “normal” and “shallow” regions—where the contact point is near the optical center—the MAE is minimized. The error slightly increases in “deep engagement” and “no contact” scenarios as the measuring point approaches the image boundary where lens distortion is more pronounced. However, the cubic model effectively suppresses these boundary residuals, maintaining the maximum relative error below 3.1%. This performance strictly satisfies the engineering tolerance used in our maintenance practice, confirming the validity of the selected model order.
4.4. Evaluation of VLM-Based Diagnostic Effectiveness
To validate the diagnostic performance of the vision-language model under practical operating conditions, 200 sample sets not used during training were selected for testing. The samples cover five scenarios: normal engagement, shallow engagement, deep engagement, no contact, and recognition failure. The class distribution approximates real-world rail transit conditions, with normal cases dominating and abnormal cases following a long-tail distribution.
As a baseline, a numerical method based solely on depth interval thresholds was used, corresponding to the system’s decision-making approach prior to the integration of the VLM. The comparison results are presented in Table 9.
Table 9.
Comparison between VLM-based diagnostics and numerical baseline.
As shown in Table 9, with the evaluation metrics held constant, the overall diagnostic accuracy improves from 86.5% to 88.0% after integrating the VLM, representing an increase of 1.5 percentage points. Under the imbalanced class distribution, the macro-averaged F1 score rises from 0.821 to 0.842, indicating that the VLM provides better coverage for minority abnormal samples. The structured usability is below 100% for reasons explained in Section 3.3.2: as the VLM generates outputs in a generative manner, an additional format and semantic consistency check on the cloud is required, resulting in approximately 7.5% of samples being reverted to “recognition failed, please re-acquire.”
As illustrated in Figure 9, the “normal” and “shallow engagement” categories—most susceptible to minor depth fluctuations—remain at high levels along the diagonal elements, indicating that the introduction of the VLM does not disrupt the original depth-based primary decision logic. The recognition rate for the “no contact” category reaches 0.80, significantly higher than that of the purely numerical baseline, demonstrating that the model can leverage image semantics to detect cases where the depth values appear acceptable, but the contacts are actually not engaged.
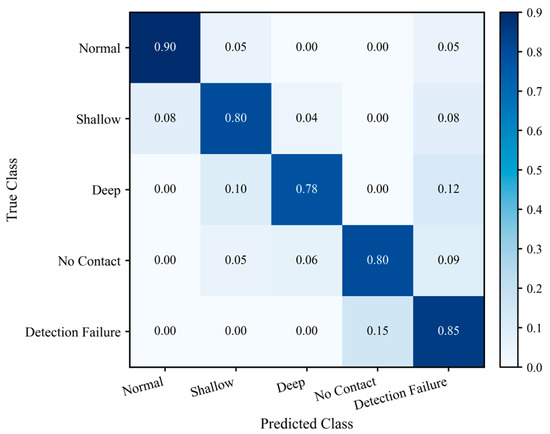
Figure 9.
Normalized confusion matrix of VLM diagnostic results.
4.5. System Latency and Network Robustness Analysis
To evaluate the feasibility of the proposed “Edge-Cloud” collaborative architecture in real-world railway scenarios, this section quantifies the end-to-end latency of the system and analyzes its robustness under varying network conditions.
We recorded the time consumption of each stage for 100 consecutive diagnostic tasks under a standard 4G network environment. The statistical results of the end-to-end latency and its components are presented in Table 10.
Table 10.
End-to-end latency breakdown of a single diagnostic task.
As shown in Table 10, the total diagnostic latency is approximately 1.35 s. Notably, while the pure inference speed of the quantized YOLO11-seg reaches 38.5 FPS, the overall system loop—including image capture, preprocessing, and geometric depth calculation—operates at approximately 22 FPS. This frame rate effectively balances computational load and monitoring continuity, ensuring that critical geometric data is captured continuously without blocking. The primary latency contribution stems from the Cloud Reasoning stage, accounting for ~85% of the total time. Thanks to the asynchronous decoupling of edge perception and cloud diagnosis, the long latency of the VLM does not block the real-time monitoring loop at the edge. However, considering that the mechanical state of point machines changes relatively slowly, and maintenance decisions do not require millisecond-level reaction, a 1.35-s diagnostic delay is well within the acceptable range for intelligent maintenance support.
To verify robustness, we utilized the Linux tc (Traffic Control) tool to inject artificial packet loss (ranging from 0% to 20%) into the communication link. The changes in Diagnostic Success Rate (DSR) and average latency are illustrated in Figure 10.
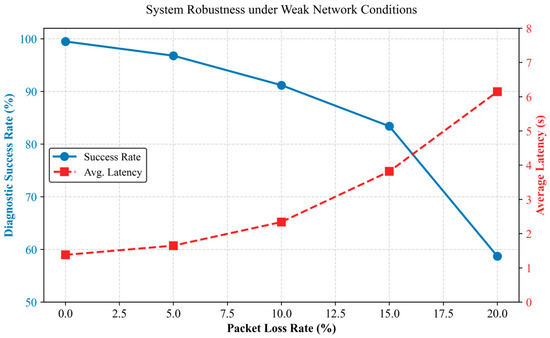
Figure 10.
Quantitative impact of network jitter on system performance.
It is observed that under ideal network conditions, the system achieves a diagnostic success rate of 99.5%, with the remaining 0.5% attributed to random timeouts during the initial connection handshake. When the packet loss rate increases to 10%—a typical threshold for poor signal coverage in tunnels—the success rate declines to 91.2%, and the average latency extends to 2.34 s. This indicates that while TCP retransmission effectively guarantees data integrity, it introduces a noticeable but acceptable delay penalty. However, under severe network degradation, the system exhibits a significant performance drop, with the success rate falling below 60% at 20% packet loss. Crucially, despite the failure of cloud-based semantic diagnosis in these extreme cases, the edge-side geometric monitoring continued to operate without interruption. This result validates the “Graceful Degradation” capability of the proposed decoupled architecture, guaranteeing that basic safety supervision remains functional even in tunnel environments with intermittent connectivity.
5. Discussion
This section discusses the practical limitations and deployment boundaries of the proposed edge-cloud framework, focusing on generalization, environmental robustness, measurement reliability, communication latency, and typical failure modes.
5.1. Applicability and Generalization
The current evaluation is conducted on a ZD6 point-machine dataset built under a constrained setting, where the device structure and camera configuration are relatively stable. While such standardization helps validate feasibility, the generalization to other point-machine types, different installation geometries, or other railway lines has not been fully verified. In practice, transferring the system may require recalibration of the homography references and refitting of the pixel-to-depth mapping, and potentially light model adaptation if visual textures differ significantly.
Regarding hardware generalization, although validated on RK3588S, the proposed heterogeneous scheduling strategy is theoretically transferable to other edge platforms (like NVIDIA Jetson) by re-mapping the ‘Control-Tensor-Logic’ abstraction to their respective CPU/GPU/NPU components, demonstrating the versatility of the proposed heterogeneous scheduling architecture. In terms of model selection, we acknowledge the value of evaluating emerging lightweight backbones, yet their deployment is currently constrained by limited NPU toolchain support for specialized operators, which leads to inefficient CPU fallback. Consequently, we prioritized the current architecture to ensure full hardware-level acceleration, with plans to expand the benchmark as toolchain support matures.
5.2. Robustness Under Environmental Variations
Beyond hardware scalability, the system’s reliability is equally dependent on its resilience to external visual perturbations. To approximate operational disturbances, the dataset includes low-light, dust, and vibration-interference cases, and augmentation further simulates uneven lighting and motion blur. However, extreme field conditions (e.g., rain/snow/fog, strong glare, lens droplets, and long-term contamination or wear) may introduce distribution shifts beyond the current coverage. Therefore, a conservative strategy is preferable in deployment: when visual quality is insufficient, the system should reject uncertain frames and request re-acquisition rather than forcing a potentially misleading diagnosis.
5.3. Impact of Acquisition Conditions on Measurement Precision
The depth estimation module relies on accurate bolt localization and stable perspective rectification, followed by a fitted pixel-to-depth mapping. Under strong vibration, motion blur, or partial occlusion, bolt localization errors may propagate through rectification and amplify measurement uncertainty, especially near decision thresholds. A practical improvement is to incorporate temporal smoothing (multi-frame fusion) and confidence-aware reporting to make the depth output more robust in non-ideal conditions.
5.4. Performance Trade-Offs and Diagnostic Paradigm Analysis
The proposed “Edge-Cloud” architecture involves a strategic trade-off between computational efficiency and semantic intelligence. While the three-stage quantization on the RK3588S significantly improves throughput, it introduces a minor degradation in segmentation boundary precision, which is acceptable given the substantial gain in real-time monitoring capability. While the edge layer prioritizes varying perception speed, the cloud layer focuses on reasoning depth. Critically, the integration of the Qwen2.5-VL model introduces a fundamental paradigm shift compared to traditional numerical diagnostics.
The primary benefit is the transition from “threshold-based detection” to “semantic understanding.” Traditional depth sensors fail to detect “No Contact” scenarios where gap distances appear normal, but the mechanical state is compromised (e.g., foreign object obstruction). As evidenced in the experiments, the VLM effectively identifies these long-tail faults and provides interpretable maintenance advice, reducing the cognitive load on operators. The cost of this intelligence is twofold: latency and stochasticity. The cloud-based VLM inference adds approximately 1.15 s to the system loop, and the generative nature of the model results in a ~7.5% format error rate.
However, since railway point machine maintenance requires high-confidence decision support rather than millisecond-level kinematic control, the system prioritizes the interpretability and robustness offered by the VLM over the raw speed of traditional algorithms. The “Retry” mechanism effectively mitigates the probabilistic instability, ensuring safety-grade reliability.
6. Conclusions
This paper presents a visual detection system for point machines based on the RK3588S edge platform, aiming to address the limitations of existing methods in terms of real-time performance and explainability. By integrating the YOLO11-seg model, a three-stage quantization strategy, and heterogeneous task scheduling, the deployment of deep learning models on edge devices is optimized, significantly improving inference speed and accuracy. This hardware-aware scheduling strategy not only maximizes the efficiency of the RK3588S but also provides a reference paradigm for deploying deep learning pipelines on other resource-constrained heterogeneous edge SoCs. Building upon this foundation of efficient edge perception to enhance system intelligence, this paper introduces the Qwen2.5-VL-7B visual language model, which converts visual information into semantic fault diagnosis and maintenance recommendations through a structured prompt template. Experimental results indicate that the proposed system effectively improves the real-time performance, accuracy, and intelligence of point machine detection, providing an efficient solution for the intelligent maintenance of railway equipment.
Author Contributions
Conceptualization, Y.Z.; Methodology, Y.Z.; Software, Y.Z.; Investigation, L.W.; Resources, L.W.; Data curation, L.W.; Writing—original draft, Y.Z.; Writing—review & editing, Y.Z.; Supervision, L.W.; Project administration, L.W. All authors have read and agreed to the published version of the manuscript.
Funding
This research received no external funding.
Data Availability Statement
The datasets presented in this article are not readily available because the data are part of an ongoing study. Requests to access the datasets should be directed to corresponding author.
Conflicts of Interest
The authors declare no conflict of interest.
References
- Hu, X.; Cao, Y.; Tang, T.; Sun, Y. Data-driven technology of fault diagnosis in railway point machines: Review and challenges. Transp. Saf. Environ. 2022, 4, tdac036. [Google Scholar] [CrossRef]
- Peng, C.; Peng, J.; Wang, Z.; Wang, Z.; Chen, J.; Xuan, J.; Shi, T. Adaptive fault diagnosis of railway vehicle on-board controller with large language models. Appl. Soft Comput. 2025, 185, 113919. [Google Scholar] [CrossRef]
- Mukunzi, G.; Palmqvist, C.-W. The impact of railway incidents on train delays: A case of the Swedish Railway Network. J. Rail Transp. Plan. Manag. 2024, 30, 100445. [Google Scholar] [CrossRef]
- Mukunzi, G.; Palmqvist, C.-W. The Impact of Switch Faults on Train Delays: A Case Study of the Swedish Railway Network. Transp. Res. Procedia 2025, 82, 390–403. [Google Scholar] [CrossRef]
- Jansson, E.; Olsson, N.O.; Fröidh, O. Challenges of replacing train drivers in driverless and unattended railway mainline systems—A Swedish case study on delay logs descriptions. Transp. Res. Interdiscip. Perspect. 2023, 21, 100875. [Google Scholar] [CrossRef]
- Chen, X.; Hu, X.; Wen, T.; Cao, Y. Vibration signal-based fault diagnosis of railway point machines via double-scale CNN. Chin. J. Electron. 2023, 32, 972–981. [Google Scholar] [CrossRef]
- Durazo-Cardenas, I.; Namoano, B.; Starr, A.; Sala, R.D.; Lai, J. False alarm reduction in railway track quality inspections using machine learning. In Proceedings of the PHM Society European Conference, Prague, Czech Republic, 3–5 July 2024; p. 8. [Google Scholar]
- Olivier, B.; Guo, F.; Qian, Y.; Connolly, D.P. A Review of Computer Vision for Railways. IEEE Trans. Intell. Transp. Syst. 2025, 26, 11034–11065. [Google Scholar] [CrossRef]
- Cao, Z.; Qin, Y.; Jia, L.; Xie, Z.; Gao, Y.; Wang, Y.; Li, P.; Yu, Z. Railway intrusion detection based on machine vision: A survey, challenges, and perspectives. IEEE Trans. Intell. Transp. Syst. 2024, 25, 6427–6448. [Google Scholar] [CrossRef]
- Kumar, A.; Harsha, S. A systematic literature review of defect detection in railways using machine vision-based inspection methods. Int. J. Transp. Sci. Technol. 2024, 18, 207–226. [Google Scholar] [CrossRef]
- Wang, Y.; Yu, H.; Guo, B.; Shi, H.; Yu, Z. State Key Laboratory of Advanced Rail Autonomous Operation and Key Laboratory of Vehicle Advanced Manufacturing, Measuring and Control Technology, Ministry of Education, Beijing Jiaotong University, Beijing, China. Research on real-time detection system of rail surface defects based on deep learning. IEEE Sens. J. 2024, 24, 21157–21167. [Google Scholar]
- Sharma, J.; Lal Mittal, M.; Soni, G.; Keprate, A. Explainable artificial intelligence (XAI) approaches in predictive maintenance: A review. Recent Pat. Eng. 2024, 18, 18–26. [Google Scholar] [CrossRef]
- Shi, Z.; Du, Y.; Yao, X. Fault diagnosis of ZDJ7 railway point machine based on improved DCNN and SVDD classification. IET Intell. Transp. Syst. 2023, 17, 1649–1674. [Google Scholar] [CrossRef]
- Sun, Y.; Cao, Y.; Li, P. Fault diagnosis for railway point machines using VMD multi-scale permutation entropy and reliefF based on vibration signals. Chin. J. Electron. 2025, 34, 204–211. [Google Scholar] [CrossRef]
- Li, W.; Wu, X.; Hu, X.; Zhang, Y.; Bader, S.; Huang, Y. LD-RPMNet: Near-Sensor Diagnosis for Railway Point Machines. arXiv 2025, arXiv:2506.06346. [Google Scholar]
- Wei, D.; Zhang, W.; Li, H.; Jiang, Y.; Xian, Y.; Deng, J. RTINet: A Lightweight and High-Performance Railway Turnout Identification Network Based on Semantic Segmentation. Entropy 2024, 26, 878. [Google Scholar] [CrossRef] [PubMed]
- Cao, Y.; Liu, Z.; Wang, F.; Su, S.; Sun, Y.; Wang, W. An improved YOLOv7 for the state identification of sliding chairs in railway turnout. High Speed Railw. 2024, 2, 71–76. [Google Scholar] [CrossRef]
- Gholami, A.; Kim, S.; Dong, Z.; Yao, Z.; Mahoney, M.W.; Keutzer, K. A survey of quantization methods for efficient neural network inference. In Low-Power Computer Vision; Chapman and Hall/CRC: New York, NY, USA, 2022; pp. 291–326. [Google Scholar]
- Zhao, X.; Xu, R.; Gao, Y.; Verma, V.; Stan, M.R.; Guo, X. Edge-mpq: Layer-wise mixed-precision quantization with tightly integrated versatile inference units for edge computing. IEEE Trans. Comput. 2024, 73, 2504–2519. [Google Scholar] [CrossRef]
- Wang, P.; Bai, S.; Tan, S.; Wang, S.; Fan, Z.; Bai, J.; Chen, K.; Liu, X.; Wang, J.; Ge, W. Qwen2-vl: Enhancing vision-language model’s perception of the world at any resolution. arXiv 2024, arXiv:2409.12191. [Google Scholar]
- Liu, X.; Zhang, L.; Song, Z.; Zhang, R.; Wang, J.; Wang, C.; Liang, W. An Exploratory Study on Workover Scenario Understanding Using Prompt-Enhanced Vision-Language Models. Mathematics 2025, 13, 1622. [Google Scholar] [CrossRef]
- Li, J.; Li, D.; Savarese, S.; Hoi, S. Blip-2: Bootstrapping language-image pre-training with frozen image encoders and large language models. In Proceedings of the International Conference on Machine Learning, Honolulu, HI, USA, 23–29 July 2023; pp. 19730–19742. [Google Scholar]
- Lyu, Z.; Xiao, M.; Xu, J.; Skoglund, M.; Di Renzo, M. The larger the merrier? Efficient large AI model inference in wireless edge networks. arXiv 2025, arXiv:2505.09214. [Google Scholar] [CrossRef]
- He, Y.; Fang, J.; Yu, F.R.; Leung, V.C. Large language models (LLMs) inference offloading and resource allocation in cloud-edge computing: An active inference approach. IEEE Trans. Mob. Comput. 2024, 23, 11253–11264. [Google Scholar] [CrossRef]
- Wei, L.; Kong, L.; Liu, Z.; Yang, Z.; Zhang, H. A Low-Complexity Accurate Ranging Algorithm for a Switch Machine Working Component Based on the Mask RCNN. Appl. Sci. 2023, 13, 9424. [Google Scholar] [CrossRef]
Disclaimer/Publisher’s Note: The statements, opinions and data contained in all publications are solely those of the individual author(s) and contributor(s) and not of MDPI and/or the editor(s). MDPI and/or the editor(s) disclaim responsibility for any injury to people or property resulting from any ideas, methods, instructions or products referred to in the content. |
© 2026 by the authors. Licensee MDPI, Basel, Switzerland. This article is an open access article distributed under the terms and conditions of the Creative Commons Attribution (CC BY) license.