Abstract
A dual-resonant ultrasonic motor is designed with an independent dual-oscillator configuration. The performance of this motor depends on both the structural parameters of the dual oscillators and the vibration mode combinations (i.e., vibration mode matching) between the stator and rotor. However, due to the relatively complex theoretical model of the dual-oscillator ultrasonic motor, two key performance indicators—maximum output torque and maximum speed—exhibit a mutually exclusive relationship. This poses significant challenges to the accurate characterization and optimization of the motor’s performance. To address this issue, this study first adopts a back propagation (BP) neural network fitting approach to establish the complex functional relationship between the optimization parameters and performance objectives, thereby achieving a scientific fitting of the motor’s theoretical model. Subsequently, the Non-dominated Sorting Genetic Algorithm II (NSGA-II)—well-suited for handling mutually exclusive multi-objective optimization problems—is employed to optimize the motor’s performance. Finally, based on the obtained Pareto optimal solution set, the oscillator’s structural parameters that meet the performance requirements are determined.
1. Introduction
The annular traveling wave ultrasonic motor (ATWUM) is currently the most widely utilized, maturely developed, and representative type of ultrasonic motor in the market. Its external configuration and output mode are relatively analogous to those of conventional electromagnetic motors. Furthermore, owing to its distinctive performance advantages—including low-speed high-torque operation, high energy density, compact structure, superior controllability, power-off self-locking capability, and immunity to electromagnetic interference—it has garnered significant attention from researchers in the field. Drawing on extensive research findings related to ultrasonic motor performance enhancement, this study takes the performance improvement of a dual-resonant annular traveling wave ultrasonic motor as the core objective, and conducts systematic research on the optimization method for its structural parameters.
The existing achievements in the optimization of ultrasonic motor structure parameters are as follows. For example, Li [1] used a method combining particle swarm optimization and finite element method (PSO-FEM) to optimize the structural dimensions of a rectangular plate motor. Due to fewer optimization targets, this method achieved certain results. Shi Yunlai [2] and others proposed an optimization design method for linear ultrasonic motors based on the response surface method by combining the response surface approximate fitting model and then using an optimization algorithm for parameter optimization, but the empirical parameter extraction had a certain impact on the optimization accuracy. Yang Mojian [3] and others used finite element analysis to analyze the influence of the key structural parameters of the V-shaped stator on the consistency of the two-phase modal frequencies. They screened out the structural parameters that are more sensitive to the frequency consistency and found a more reasonable structural parameter size through trial selection. Due to the functional relationship construction problem, this method is relatively complicated to operate. Zhang [4] and others proposed an algorithm combining quadratic programming and the finite element method to optimize the structure of a rod-type ultrasonic motor. The finite element method provides modal analysis and harmonic response analysis data and verifies the algorithm accuracy for the optimization algorithm. The quadratic programming algorithm makes the optimal strategy selection. However, the iterative parameter optimization method affects the optimization efficiency. In addition, Markus Flueckiger [5] and others proposed using sensitivity analysis to select optimization parameters and then combine the finite element method to optimize the motor structure parameters; Karl-Robert Deibel [6] and others used an algorithm combining the genetic algorithm and simplex method to optimize transducer parameters; Seung-Ki Hong [7] and others used the Kriging Meta-model assisted by evolutionary algorithms to optimize the structural parameters; Niu Zijie [8] and others proposed a method combining the response surface model and the adaptive genetic algorithm to handle the optimization problem of the flexible rotor structure of the hollow traveling wave ultrasonic motor. However, the optimization of motor structure parameters is an optimization problem with multiple parameters, multiple objectives, nonlinearity, and complex function relationships. Some studies, due to their failure to reasonably screen parameters, lead to a complex optimization process which can even interfere with the expression of main influencing factors; some studies, due to their inability to handle multi-objective problems, optimize only some of the objectives, resulting in insufficient optimization; some studies, when solving the complex nonlinear relationship between optimization parameters and optimization goals, simplify the function relationship to a certain extent, thus affecting the optimization accuracy. Facing such a complex optimization problem, researching a comprehensive method that can reasonably handle multiple parameters, multiple objectives, and complex nonlinear function relationships is the key to solving this optimization problem.
This study aims to develop a theoretical model that is convenient, usable, and easily programmable for correlating the structural parameters and performance of the motor. Firstly, in Section 2, the correlation mechanism between the motor’s output performance and the vibration mode matching of the stator and rotor will be analyzed in depth. Secondly, Section 3 identifies the optimization objectives centered on the maximum no-load speed and maximum stall torque, screens P2, P5, P6, and P7—parameters in the rotor structure that are sensitive to vibration modes—as the optimization variables, and clarifies their value ranges. Furthermore, it elaborates on the principle of integrating Latin Hypercube Sampling (LHS), BP neural network fitting, and NSGA-II algorithm to find the optimal balanced solution. Subsequently, Section 4 verifies the effectiveness of the model and algorithm: on one hand, it validates the fitting accuracy of the BP neural network using the mean square error and coefficient of determination (R2 > 0.99); on the other hand, it analyzes the distribution characteristics of the Pareto optimal solution obtained by the NSGA-II (Non-dominated Sorting Genetic Algorithm II) algorithm, compares the parameter and performance differences between representative solutions in different regions and the optimal balanced solution, and verifies the optimization results through a mathematical model (relative error: 0–10%), thereby proving the reliability of the proposed method. Finally, Section 5 summarizes the research findings of the entire paper, condenses the advantages of the multi-objective optimization method integrating LHS, BP neural network, and NSGA-II, and points out the reference value of the Pareto optimal solution set for the serialized design of motors and the adaptation to application scenarios.
2. Analysis of Output Performance Model of Dual-Oscillator Ultrasonic Motor
The output performance model of the dual-oscillator ultrasonic motor differs from that of traditional ultrasonic motors. Its performance hinges on the matching of the vibration modes of the dual oscillators. With the traveling wave vibration mode of the stator as a reference, if the wavelength of the traveling wave of the stator is λ and the maximum longitudinal vibration amplitude of the particle is , under the known conditions such as vibration mode, vibration frequency, stator structure parameters, and stator material properties, the vibration mode function of the stator can be obtained. When the rotor that is “matched” with it is combined with the stator in different traveling wave vibration modes, it will inevitably form multiple different vibration mode combination ways, that is, different contact states. As illustrated in Figure 1, different performance outputs will ultimately be generated by the motor. This is the correlation between vibration mode matching and motor output performance.
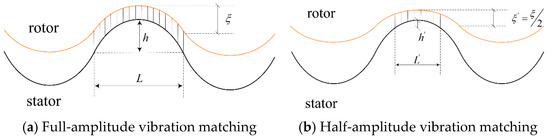
Figure 1.
Different matching of vibration modes.
When the rotor amplitude is , the contact length achieved in coordination with the stator is , and the contact height is , as depicted in Figure 1a. Whereas, when the rotor amplitude is , the contact length achieved in coordination with the stator is , and the contact height is , as shown in Figure 1b. This gives rise to two distinct vibration mode combination modalities.
Diverse vibration mode combinations engender different contact regions between the stator and rotor. The contact region is determined by two parameters, namely, contact length and contact height. Since both the contact length and contact height are simultaneously subsumed under the waveform function, different vibration mode combinations can be directly parameterized as different contact lengths or different contact heights. Herein, different contact lengths are employed to characterize different vibration mode combinations.
According to the Hertzian [9] contact model, the motor driving force can be expressed as:
Among them, is the vibration mode function, is the friction coefficient, and is the positive contact stress.
From this, it can be known that the driving force is a function of and . represents the contact length, and is the position of the isovelocity adhesion point. And the rotational speed of the motor is precisely determined by the tangential velocity of the particle at the isovelocity adhesion point . Moreover, according to the elliptical distribution law of particle velocity, it can be known that
and
Among them, is the maximum tangential velocity of the stator particle, which is related to the stator amplitude .
where is the maximum contact height (i.e., the distance from the vibration point of the surface wave to the neutral line). Formula (3) is further reduced to
The driving force ultimately becomes a function of contact length , motor speed , and stator amplitude . And due to the relationship between torque and driving force , that means torque is also a function of , , :
Therefore, under the premise of fixing the stator amplitude , the motor performance and are load characteristic curves that change with . Since the traveling wave waveform is a strict periodic function, , , , and , are taken as examples, respectively, to analyze the change in motor load characteristics under different contact lengths (some parameters of the stator are assumed: for example, the amplitude is taken as 1.5 μm, the working frequency is taken as 47.5 kHz, the distance from the end face to the neutral layer is taken as 1.5 mm, and the preload is taken as 150 N). The simulation results are shown in Figure 2.
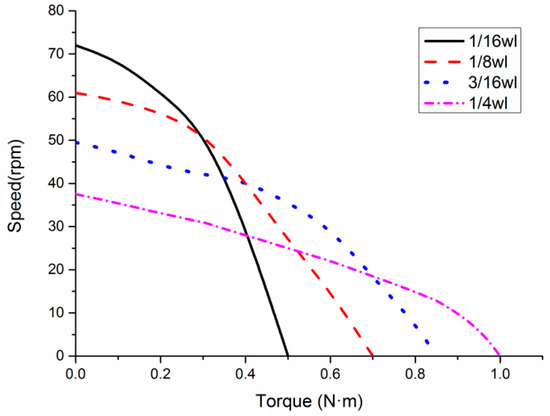
Figure 2.
Motor output under different contact conditions.
In Figure 2, represents the stator wavelength, and is equal to the parameter . As can be seen from the figure, when the contact state between the stator and rotor is different (that is, the contact length is different), the motor can obtain different performance outputs. Through the comparison of several states, it can be known that when the contact length between the stator and rotor is , the motor obtains a better speed, but the torque is not ideal, and when the contact length between the stator and rotor is , the motor obtains a better torque, but the speed is poor.
The most essential factor in forming different contact states (or different vibration mode combinations) is the structural parameters of the stator and rotor. Therefore, whether from the analysis of stator vibration characteristics or from the analysis of stator-rotor contact characteristics, the stator structure parameters and rotor structure parameters are the decisive factors affecting motor performance, as shown in Figure 3.
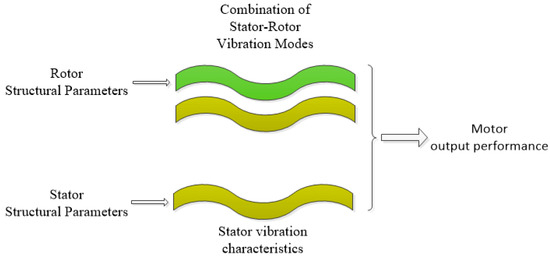
Figure 3.
Determining factors for motor performance.
3. Parameter Optimization
The performance of the dual-oscillator annular traveling wave ultrasonic motor is directly correlated with the vibration mode combination of the stator and rotor. The vibration mode combination is determined by the respective vibration characteristics of the stator and rotor, and the vibration characteristics of the stator and rotor are the outcome of the design of the structural parameters of the stator and rotor. Consequently, the most fundamental factor influencing the performance of the dual-resonant motor is the structural parameters of the stator and rotor.
Since the dual-resonant ultrasonic motor is designed with independent dual oscillators and has numerous variable parameters simultaneously, optimizing multiple types of parameters concurrently will affect the expression of the main factors and disrupt the optimization direction. Therefore, to simplify the optimization process and enhance the optimization accuracy, the stator structure parameters and the stator vibration mode characteristics are regarded as known quantities. With the stator vibration mode as a reference, a suitable rotor vibration mode is sought, and then it is deduced to find the optimal rotor structure parameters that conform to the performance requirements. Based on the above analysis, an optimization process with the motor performance as the optimization objective and the rotor structure parameters as the optimization parameters is established, as illustrated in Figure 4.
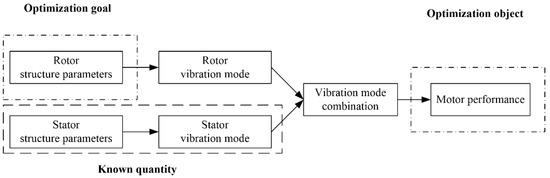
Figure 4.
Introduction of the process of rotor matching design.
3.1. Optimization Objectives and Parameters
- (1)
- Optimization Objectives:
The optimization objective is the performance of the dual-resonant motor. The no-load speed and the stall torque that can reflect the superiority and inferiority of the motor performance are taken as the optimization objectives. The function expressions are as follows:
- :
- b.
- :
- (2)
- Optimization Parameters:
As can be seen from the above Figure 4, the optimization objective (motor performance) is achieved through different vibration mode combinations of the stator and rotor. The most fundamental variable, that is, the optimization parameter, is the structural parameter of the rotor (assuming the stator structure parameter as a known quantity). Several structural parameters that are more sensitive to the oscillator vibration mode as optimization variables. Figure 5 annotates several parameters to be optimized in the rotor structure, and Table 1 gives the value range of the optimization parameters.
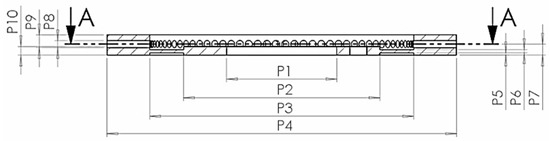
Figure 5.
Schematic of optimization parameters P2, P5, P6, P7.

Table 1.
The range of optimization variables.
Considering that most optimization problems are processes of finding the minimum value, the optimization objective is adjusted as shown in Equation (9). In this way, obtaining the minimum value of the optimization objective is also obtaining the solution that maximizes the motor output performance.
3.2. Optimization Solution Procedure
The optimization design process includes: applying the experimental design method to generate design point data within the feasible domain space of optimization parameters; sample data screening; simulating the objective value corresponding to each design point data according to the mathematical model of optimization objectives and optimization parameters to form a sample of optimization parameters and optimization objectives; fitting the response surface between optimization objectives and optimization parameters based on the BP neural network; applying the NSGA-II multi-objective optimization algorithm in the fitted model to search for the Pareto optimal solution set; and using the fuzzy membership method in the obtained Pareto optimal solution set to select the best equilibrium solution. Figure 6 shows the optimization flow:
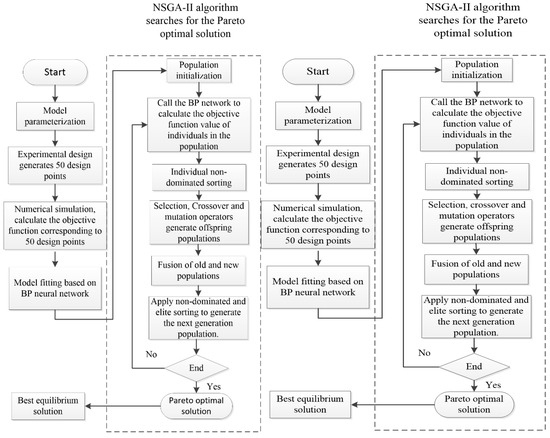
Figure 6.
Optimization flow.
3.2.1. Design of Experiment (DOE)
In order to construct a BP network model that has a good fit for the objective function, it is necessary to conduct experimental design (DOE, Design of Experiment) on the optimized parameter samples before the establishment of the network model. DOE represents an experimental strategy, that is, to maximize the acquisition of information with the least resources. Commonly used methods generally include the central composite design, the Box–Behnken design method, and the LHS.
The specific operation steps of LHS are as follows:
- (1)
- Divide each one-dimensional vector into non-intersecting intervals and ensure that each interval has the same probability (usually a uniform distribution is selected to guarantee that the length of each subinterval is equal).
- (2)
- Randomly pick a data point in each subinterval of each one-dimensional vector.
- (3)
- Then randomly extract the data points selected in (2) from each dimension to form a vector.
To ensure a balance between the computational load and the fitting accuracy, 62 sets of design point data were selected using the LHS method. Then, the rotor design frequencies under these parameters were calculated. According to the rotor design frequency requirements , 50 sets of data that met the design requirements were screened out. Their combinations are illustrated in Figure 7, where each set of broken lines in different colors represents a set of design point data, and the objective function values of the 50 sets of design points were simulated and calculated. Meanwhile, in order to verify the accuracy of the fitted network model, another 20 sets of design points were selected for verification.
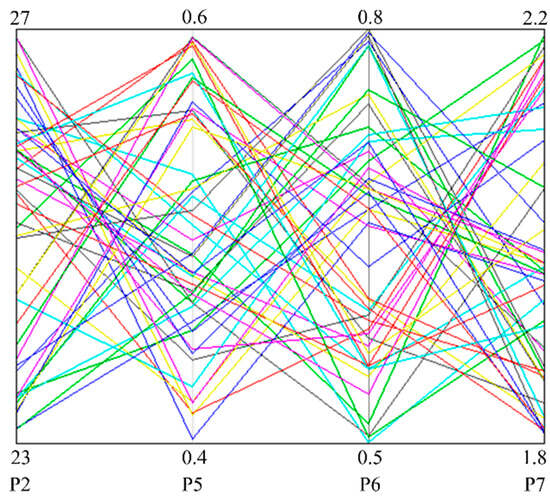
Figure 7.
50 sets of design point data generated by LHS method.
3.2.2. Fitting of BP Neural Network
A BP neural network is a multi-layer feed-forward neural network trained according to the error back propagation algorithm. It is currently the most widely used type of neural network. In terms of the topological structure of the model, the BP network has an input layer, a hidden layer, and an output layer. In essence, the core of its algorithm is to take the square of network error as the objective function and use the principle of gradient descent method to calculate the minimum value of the objective function.
This paper establishes a BP neural network with a three-layer network structure. As shown in Figure 8, the input layer has four neurons, corresponding to four optimization parameters (P2, P5, P6, P7), respectively. The hidden layer is designed with 10 neurons, and the output layer has two neurons, corresponding to two objective functions (). All inputs are input to each neuron in the hidden layer after weighted summation, and the output of the hidden-layer neuron is generated under the action of the activation function. The activation function used is “hyperbolic tangent sigmoid” (tanh), which can linearly scale the input value to the interval [−1, 1] and effectively capture the nonlinear relationships between the optimization parameters and objective functions of the ultrasonic motor. This function is superior to the sigmoid function in avoiding gradient vanishing during training for our dataset. “Hyperbolic tangent sigmoid” is shown as expression (10):
where is the number of neurons in the hidden layer, and and are the output and input of the -th hidden-layer neuron, respectively. has the expression as follows:
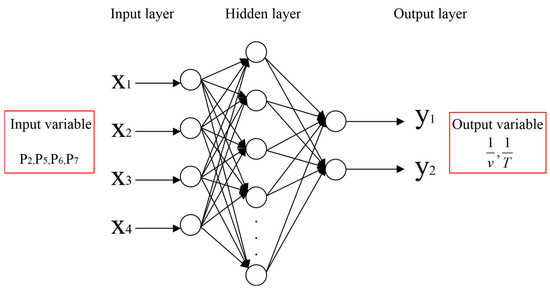
Figure 8.
The structure of BP networks.
In Equation (11), is the weight between the -th hidden-layer neuron and the -th input vector , is the threshold of the -th hidden-layer neuron, and is the number of input variables.
The weighted sum of all the outputs of the hidden-layer neurons is then input into the output-layer neurons and activated by the “pure line” function at the same time. This linear activation function is selected to match the continuous quantitative characteristics of the two objective functions, ensuring accurate prediction of their actual values without scaling distortion. The function expression is as follows:
where is the weight coefficient between the -th output-layer neuron and the -th hidden-layer neuron, and and are the output value and threshold of the -th output-layer neuron, respectively.
At this point, the BP neural network model is completed. The next step is to train the network. Data from 50 design points generated by the experimental design and the simulation calculation results of their corresponding target quantities were imported into Matlab 2018a to fit the BP network model. To ensure training reliability, the Levenberg–Marquardt algorithm was adopted for weight update, and the training stop conditions were set as follows: maximum epochs = 1000, target error = 1 × 10⁻⁵, learning rate = 0.01. The final trained model achieved a fitting R2 of 0.96 and a validation R2 of 0.93, confirming its high accuracy for predicting the two objective functions.
3.2.3. Multi-Objective Optimization Algorithm Based on NSGA-II
The optimization of the structural parameters of the rotor is itself a multi-objective optimization problem. The optimization objectives include motor speed and output torque. However, these two parameters are mutually exclusive. That is, when a certain design parameter is changed to increase the motor speed, it often brings about a decrease in output torque, and vice versa. In this paper, a multi-objective genetic algorithm based on NSGA-II [10] is applied to search for the Pareto optimal solution set in the fitted network model. The NSGA-II algorithm in the optimization tool (Optimization Toolbox) of Matlab 2018a is used to optimize the parameters of the problem to be optimized. The configuration parameters of the algorithm are shown in Table 2:
Table 2.
Parameter configuration of NSGA-II optimization algorithm.
The final result of the NSGA-II algorithm is to obtain the best Pareto solution set of the optimization objective. However, multi-objective optimization often has the solution of conflicting objective quantities. Therefore, the fuzzy membership method is used to select the best-balanced solution from the Pareto solution set [11].
The -th objective function value of the -th solution can be represented by a membership function :
In the formula, and respectively represent the minimum and maximum values of the -th objective function in all Pareto solution sets.
For the -th Pareto solution, the normalized membership function is as follows:
In the formula, is the number of all Pareto solutions, and the best-balanced solution refers to the Pareto solution with the maximum value .
4. Optimization of Result Analysis of BP Neural Network Fitting Results
4.1. BP Neural Network Fitting Results
A surface model based on BP neural network fitting was established using 50 design point data and target function values. This model reflects the mapping relationship between four optimization parameters and two objective functions. Along with 20 validation data points, the data were imported into Matlab 2018a software, and the Neural Network Toolbox was used to model, train, and validate the network model. Figure 9 shows the BP network training process, from which it can be seen that the mean square error tends to stabilize after the 46th training iteration, and the error decreases by more than three orders of magnitude.
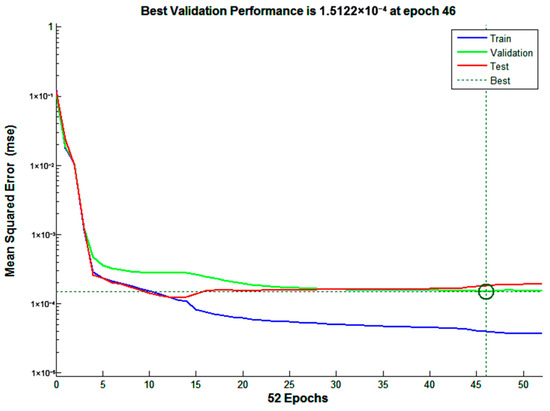
Figure 9.
Training process of BP neural network.
To verify the accuracy of the model fitted by the BP neural network, it is necessary to conduct a goodness-of-fit test. The specific method is to compare the coefficient of determination between the target function simulation values and the BP neural network fitting values, which is expressed as Equation (15).
In the equation, is the target function value corresponding to the -th design for numerical simulation; is the target function value corresponding to the -th design point for neural network simulation; is the arithmetic mean of ; and is the number of design points.
The goodness-of-fit test results are shown in Figure 10. From the figure, it can be observed that the coefficients of determination between the network fitting values and the test values are all above 0.99, indicating that the BP neural network can accurately simulate the functional relationship between the optimized parameters and the target quantity.
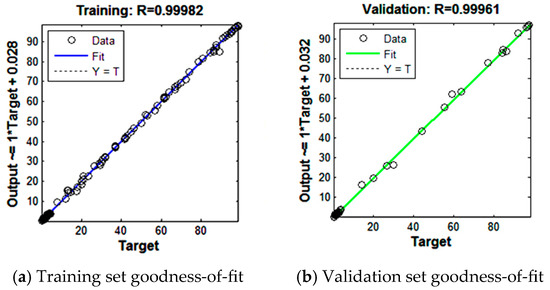
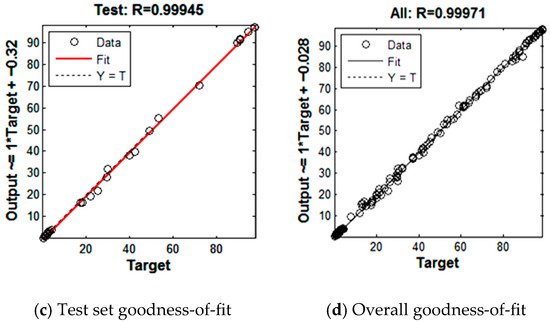
Figure 10.
Goodness-of-fit test.
4.2. Optimization Results of the NSGA-II Algorithm
Using the Matlab 2018a Optimization Toolbox, the BP neural network is introduced to fit the data for multi-objective function optimization search. The Pareto optimal solution set obtained by the NSGA-II algorithm is shown in Figure 11.
Figure 11.
Pareto optimal solution.
From Figure 11, it can be clearly seen that the two optimization objectives (Object1 and Object2) are in conflict with each other, meaning that the actual objective quantities (,) are in conflict. When Object1 increases ( decreases), Object2 gradually decreases ( increases), and vice versa.
Considering that motor performance optimization is a mutually exclusive bi-objective optimization problem, and based on prior knowledge of motor performance, the optimal balanced solution in the Pareto solution set can be found using fuzzy membership functions (expressions (13)). The Pareto solution set can be divided into two regions with the optimal balanced solution as the boundary, as shown in Figure 12. In the figure, point C represents the optimal balanced solution, which is a trade-off between the two objective functions. Region A is identified as the Object1 optimal solution region, and Region B is identified as the Object2 optimal solution region. Due to the inverse relationship between Object1\ and Object2\, Region A is considered the torque-optimal solution region, and Region B is considered the speed-optimal solution region. The specific region selection depends on the design requirements of the decision-maker.
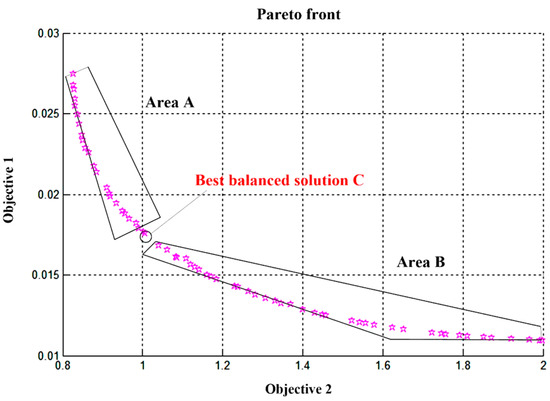
Figure 12.
Pareto optimal solution and optimal equilibrium solution.
A representative solution and the best-balanced solution C are extracted from Area A and Area B, respectively, for comparison, with their optimization parameters and objectives as shown in Table 3.
Table 3.
Comparation of representative solution and best-balanced solution in Pareto optimal solution.
As can be seen from the analysis in Table 3, the best-balanced solution C is not the optimal solution that has absolute dominance in both objective quantities. The value of Object1 is not even as good as that of the representative solution in Region A, but the value of Object2 is better than that of the representative solution in Region A. The same reasoning applies to the comparison with the representative solution in Region B. Although the best-balanced solution C is not an absolutely dominant solution, it is the solution that is most balanced in the values of the two objectives and also the solution with the largest value of the fuzzy membership function. Therefore, this best-balanced solution can be used as the best value for motor performance optimization.
The Pareto optimal solution set is the result of network fitting and algorithm optimization. To verify the accuracy of the algorithm, the optimization results are verified by using the mathematical model of motor performance. As in Table 3, the representative solutions in Region A, the representative solutions in Region B, and the best-balanced solution are taken, respectively, for comparison of prediction and verification. The parameter data are shown in Table 4, Table 5 and Table 6, respectively.
Table 4.
Optimization verification for representative result in A region.
Table 5.
Optimization verification for representative result in B region.
Table 6.
Verification for optimum equilibrium solution.
From the analysis of the above table, it can be seen that the relative error between the two target results obtained by the optimization algorithm and the verification results is between 0% and 10%. This error range meets the accuracy required for guiding design and production [10,11,12,13]. Therefore, the multi-objective optimization algorithm based on BP neural network fitting and NSGA-II can be considered reliable.
4.3. Optimization Results of Rotor Structure Parameters
Optimized by the algorithm, the structure parameters and the best performance that the motor can achieve are shown in Table 7.
Table 7.
Optimization result of structure parameter of rotor.
The vibration characteristics analysis and the amplitude analysis are shown in Figure 13 and Figure 14.
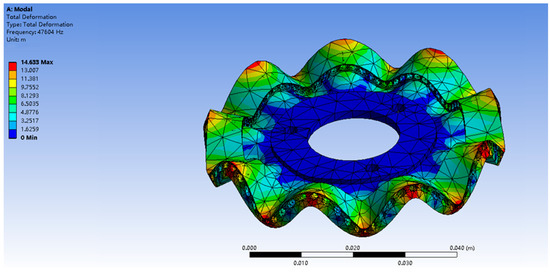
Figure 13.
Modal analysis of rotor.
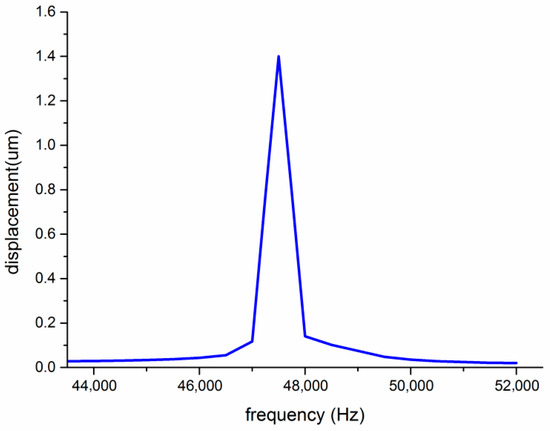
Figure 14.
Amplitude analysis.
In addition, an inspiration of multi-objective optimization is that the Pareto optimal solution set also provides a priori reference for subsequent serialized design of motors and structural adjustments to meet changing application requirements. For example, when the motor performance requirement to be designed is to have the largest possible speed, we can select reasonable design parameters for the rotor according to the parameter guidance of Region B (speed-optimal solution region) in the Pareto optimal solution set. Conversely, when the motor performance requirement is to have the largest possible torque, the rotor structure parameters can be designed according to the parameter guidance of Region A (torque-optimal solution region) in the Pareto optimal solution set. Therefore, with the Pareto optimal solution set of multi-objective optimization, the dual-resonant ultrasonic motor has a priori knowledge for determining structural parameters when facing different application requirements.
4.4. Comparative Analysis with Existing Optimization Methods
To verify the superiority of the proposed LHS-BP-NSGA-II method, a systematic comparison was conducted with four representative baseline methods (SA-FEM [5], GA-Simplex [6], Kriging-EA [7], RSM-AGA [8]) under the same optimization task (rotor parameters P2/P5/P6/P7, speed-torque dual objectives) and hardware configuration (Intel Core i7-10700K (Intel, Santa Clara, CA, USA), 32 GB RAM). Key findings based on Table 8 are as follows:
Table 8.
Comprehensive comparison of different optimization methods.
The comparative analysis confirms that the proposed LHS-BP-NSGA-II method outperforms baseline methods in multi-objective handling, modeling accuracy, solution diversity, efficiency, and applicability.
5. Conclusions
This paper takes the optimization of rotor structure parameters as its content. Taking the optimized stator structure and its vibration characteristics as known quantities and the rotor structure parameters as the optimization object, the optimization process of motor performance is established. In the optimization process, the experimental design based on the LHS is used in turn to achieve the maximum information coverage in the size design space. The BP neural network is used to fit the network model between the optimization objective and the optimization parameters. The multi-objective optimization algorithm NSGA-II is used for optimization search to find the Pareto optimal solution set of the objective function. The Pareto optimal solution set provides multiple decision-making schemes for motor performance. The parameters and objective values under several decision-making schemes are compared and verified. The relative errors between the two objective results obtained by the optimization algorithm and the verification results are all between 0 and 10%, meeting the accuracy requirements for guiding design. Applying the fuzzy membership function in the obtained Pareto optimal solution set to find the best equilibrium solution, that is, the best motor performance parameter, the corresponding design data is the best rotor structure parameter. At the same time, the Pareto solution set also provides a priori reference for the subsequent serialized design of the motor and structural adjustments in response to changing application requirements.
Funding
This research received no external funding.
Data Availability Statement
The original contributions presented in this study are included in the article. Further inquiries can be directed to the author.
Conflicts of Interest
The authors declare no conflict of interest.
References
- Li, S.; Yang, M. Particle swarm optimization combined with finite element method for design of ultrasonic motors. Sens. Ac-tuators A Phys. 2008, 148, 285–289. [Google Scholar] [CrossRef]
- Shi, Y.; Zhao, C. Optimal design of butterfly linear ultrasonic motor. Vib. Test. Diagn. 2012, 32, 883–891. [Google Scholar]
- Yang, M.; Yao, Z.; Li, X.; Yan, X. Structure optimization design of V-type patch linear ultrasonic motor. Vib. Shock. 2017, 36, 213–218. [Google Scholar]
- Zhang, J.-T.; Zhu, H.; Zhou, S.-Q.; Zhao, C.-S. Optimal design of a rod shape ultrasonic motor using sequential quadratic pro-gramming and finite element method. Finite Elem. Anal. Des. 2012, 59, 11–17. [Google Scholar] [CrossRef]
- Flueckiger, M.; Fernandez, J.M.; Perriard, Y. Finite element method based design and optimisation methodology for piezoe-lectric ultrasonic motors. Math. Comput. Simul. 2010, 81, 446–459. [Google Scholar] [CrossRef]
- Deibel, K.-R.; Wegener, K. Methodology for shape optimization of ultrasonic amplifier using genetic algorithms and simplex method. J. Manuf. Syst. 2013, 32, 523–528. [Google Scholar] [CrossRef]
- Hong, S.-K.; Ro, J.-S.; Jung, H.-K. Optimal design of a novel permanent magnetic actuator using evolutionary strategy algorithm and Kriging Meta-model. Electr. Eng. Technol. 2013, 8, 742–746. [Google Scholar] [CrossRef]
- Niu, Z.; Sun, Z.; Chen, C.; Shi, Y.; Zhao, C. Flexible rotor structure optimization of hollow traveling wave ultrasonic motor based on response surface model and adaptive genetic algorithm. Proc. CSEE 2014, 34, 30–34. [Google Scholar]
- Hagood, N.W.; McFarland, A.J. Modeling of a Piezoelectric Rotary Ultrasonic Motor. IEEE Trans. Ultrason. Ferroelectr. Freq. Control 1995, 42, 210–224. [Google Scholar] [CrossRef]
- Zhu, S.; Xu, L.; Goodman, E.D.; Lu, Z. A new many-objective evolutionary algorithm based on generalized Pareto dominance. IEEE Trans. Cybern. 2022, 52, 7776–7790. [Google Scholar] [CrossRef]
- Konak, A.; Coit, D.W.; Smith, A.E. Multi-objective optimization using genetic algorithms: A tutorial. Reliab. Eng. Syst. Saf. 2006, 91, 992–1007. [Google Scholar] [CrossRef]
- Liu, J.; Niu, R.; Zhang, Y.; Zhu, H. Design of Low-Speed and High-Torque Ultrasonic Motor Based on Multi-Objective Optimi-zation. Piezoelectrics Acoustooptics 2024, 46, 894. [Google Scholar]
- Ren, W.; Yang, M.; Chen, L.; Ma, C.; Yang, L. Mechanical optimization of a novel hollow traveling wave rotary ultrasonic motor. J. Mech. Des. 2020, 142, 031009. [Google Scholar] [CrossRef]
Disclaimer/Publisher’s Note: The statements, opinions and data contained in all publications are solely those of the individual author(s) and contributor(s) and not of MDPI and/or the editor(s). MDPI and/or the editor(s) disclaim responsibility for any injury to people or property resulting from any ideas, methods, instructions or products referred to in the content. |
© 2025 by the author. Licensee MDPI, Basel, Switzerland. This article is an open access article distributed under the terms and conditions of the Creative Commons Attribution (CC BY) license (https://creativecommons.org/licenses/by/4.0/).