Abstract
The validation of sensor systems, particularly lidar, is crucial in advancing autonomous vehicle technology. Despite their robust perception capabilities, certain weather conditions and object characteristics can challenge detection performance, leading to potential safety concerns. This study investigates corner cases where object detection may fail due to physical constraints. Utilizing virtual testing environments like Carla and ROS2, simulations analyze how reflection characteristics affect detectability by implementing weather models into a real-time simulation. Results reveal challenges in detecting black objects compared to white ones, particularly in adverse weather conditions. A time-sensitive corner case was analyzed, revealing that while bad weather and wet roads restrict the safe driving speed range, complete deactivation of the driving assistant at certain speeds may be unnecessary despite current manufacturer practices. The study underscores the importance of considering such factors in future safety protocols to mitigate accidents and ensure reliable autonomous driving systems.
Keywords:
lidar; adverse weather; rain; fog; snow; dust; particulate matter; simulation; Carla; Robot Operating System 2 1. Introduction
The primary objective in the development of autonomous vehicles is to create systems that operate more safely and reliably than human drivers. Achieving this requires a perception system capable of building an accurate and comprehensive model of the surrounding environment under all conditions. Consequently, ensuring the performance and reliability of these sensor systems through thorough validation is a critical task. As the autonomization of the global vehicle fleet progresses, lidar systems, which can be seen as a key sensor for autonomous driving, are increasingly being used to achieve SAE level 2 [] and higher. Although this type of sensor is very robust in terms of perception of the driving environment compared to other sensors [], its performance is affected by weather conditions and the reflection characteristics of objects, and situations where the detection performance is not sufficient to assure safe driving might occur. Hence, providing safety for the application of autonomous driving functions is a major engineering challenge, considering the countless variations in weather and traffic scenarios an autonomous vehicle can encounter. It is well known that the probability distribution of driving scenarios is heavily skewed. The main body of the distribution contains common scenarios that occur frequently and therefore can be easily captured and evaluated by the machine learning algorithms of the autonomous driving system. However, from a safety perspective, we are interested in checking robustness against rare events placed in the long tail of the distribution []. Commonly, such events are defined as a combination of conditions, e.g., weather or characteristics of objects in the environment, which are much less common. Such scenarios are referred to as “corner cases” for the safety validation of autonomous driving systems. Due to the fact that these scenarios are very rare, most real-world datasets only contain a small number of such cases and therefore, the training and validation of machine learning (ML) algorithms is often questioned from a robustness perspective against such events [,]. To strengthen the proof of robustness of the ML algorithms, it is important that a sufficient number of corner cases are integrated into the databases. Several approaches have been proposed for the creation of corner cases. For example, Chipengo et al. [] suggested to augment the datasets with constructed and simulated corner cases, whereas Zhao et al. [] proposed to evaluate recorded naturalistic data to identify corner cases and to build a dedicated library. A more comprehensive framework has been introduced, referred to as the Pegasus Method [], with a systematic and rigorous methodology to include different aspects in the identification and generation of corner cases.
A significant source of such corner cases arises from adverse environmental conditions, which in turn define the boundaries for the system’s safe use. The conditions where the vehicle is allowed to drive partially autonomously are defined by the Operational Design Domain (ODD) [] of the vehicle. The car manufacturers commonly restrict the driving assistance functions as soon as situations occur outside the ODD. Currently, any weather effect which could potentially disturb the object detection functions of the autonomous driving system causes a deactivation of these systems, although previous experiments show that the sensor performance can be very robust [,,]. Deactivation is taken as a safety measure to mitigate the lack of knowledge of the system performance during adverse weather.
Previous work suggests to study the performance of lidar systems under adverse weather using simulation. Hahner et al. [,] proposed algorithms to simulate fog and snow by augmenting already-existing point clouds, whereas Kilic et al. [] augmented the Waymo Open Dataset with noise generated by rain and analyzed the detection performance by common ML algorithms. Another aspect of adverse weather during driving is discussed by Schicktanz et al. [] by setting up a framework to analyze corner cases under weather of real-world traffic data of an urban intersection and the transfer of these situations to a simulation database.
This work aims to contribute to the research on advanced simulation-based identification of corner cases for autonomous driving, as well as the definition of driving scenarios that might constitute validation corner cases for safety. We are proposing a systematic approach that includes both the environment factors (as adverse weather conditions) and the characteristics of objects present in the environment in a real-time simulation, which are expected to be robustly detected objects, such as other vehicles present. Our work extends previous approaches [,,] by considering the distance to safety in the simulation and by analyzing additional weather conditions such as dust storms and polluted air. Corner cases are simulated using the virtual test environment Carla [] and ROS2 []. Figure 1 illustrates an exemplary urban scenario during a hazy day. It can be seen that the reflection characteristics of the objects in the environment have a major impact on their detectability. Black objects, in particular, in comparison to white objects, have a very low reflection coefficient, making them difficult to detect by lidar systems under adverse weather conditions, as the number of detected points in the point cloud are significantly reduced. This circumstance was further analyzed by evaluating point clouds with detection algorithms of the OpenPCDet framework []. This showed that objects might be detected very late by the lidar system, and an accident is inevitable. This behavior must be considered in safety considerations. To discuss this matter, a corner case was created where the time to collision for different vehicle speeds, weather conditions, road conditions and vehicle color was calculated and discussed.
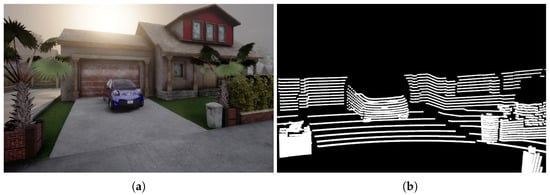
Figure 1.
(a) Front camera view and (b) the raw lidar point cloud of the same urban scenario simulated in Carla.
The primary contribution of this work is a simulation-based methodology and a quantitative dataset for evaluating the performance boundaries of lidar systems for various weather and traffic scenarios. By demonstrating the conditions under which a collision becomes unavoidable due to this specific perception failure, this research provides critical insights for validating the ODD and developing more robust safety concepts for autonomous driving in challenging environments.
The organization of the paper is as follows: The Literature Review establishes the mathematical basis using the lidar equation and highlights the difference in reflectivity between black and white objects under adverse weather. The Methodology details a simulation using Carla and ROS2 to analyze three scenarios: comparing detected points by color and weather, evaluating the detection performance for different-colored vehicles and weather, and calculating safe driving speed thresholds using the Time to Collision (TTC). Then, the results of the three scenarios are presented and discussed.
2. Literature Review
2.1. Mathematical Models for Lidar Applications
Lidar systems perceive their surroundings by emitting a laser beam that scans the environment. Objects that get hit by the beam reflect just partially the laser energy back to the lidar, where the reflected light gets detected by a photonic sensor. The laser beam loses power while traveling, either due to particles in the atmosphere, the surface condition of the object, or the losses of the lidar’s optical system. This relation of detected laser power can be described by Equation (1), where is the initial laser power, stands for the sensor’s internal losses, for the reflection characteristics of the object, and for atmospheric losses in the relation to the distance r.
Equation (1) can be expanded into a more detailed form, known as the lidar equation [], where each single factor which has an impact on the detected laser power can be explained. However, as the sensor loss can be considered as constant and therefore plays a minor role in this work, it will not be discussed further in the following sections.
where denotes the extinction coefficient, which stands for the power loss caused either by absorption or scattering of the laser beam due to air molecules or particles. Although Equation (2) explains the backscattered laser power of a hard object such as a car, this model cannot be used to calculate the backscattered laser power of soft targets, such as fog or rain. Each particle scatters a fraction of light back, which can accumulate to a substantial amount of energy. Depending on the weather condition, this will introduce additional noise in the point cloud. Additionally, Equation (2) does not consider a bistatic beam configuration, where the sending and detection unit are spatially separated. For this reason, an extended equation was proposed by [], which was updated by [] to consider the following soft targets:
Here, Equation (3) calculates the potential reflected power of a soft target with some additional factors, the squared sine function describes the pulsed laser wave, the function is the illumination factor of the bistatic beam configuration. As soft targets are located in between the lidar and a hard target (e.g., rain droplets in the path of the laser beam), the backscattering coefficient describes the scattering behavior of particles. Equation (3) also considers the fact that as soon as the beam reaches the hard target at position , backscattering of the particle ceases to exist, so a Heaviside step function U at the end stands for the spatial response of reflected laser power of a so-called hard target.
2.2. Extinction and Backscattering Coefficient
Environmental conditions commonly encountered in real world driving, have an impact on the effectiveness of lidar, which could be quantified through the influence on the extinction and backscattering coefficients. Recent research [] has introduced a comprehensive set of empirical models for the extinction and backscattering coefficients reflecting the environmental factors that are commonly considered to have significant impact for automotive applications, including rain, fog, snow, dust, and atmospheric particulate matter (PM2.5). This approach yields a fast way to calculate these coefficients in a simulation environment, where there may not be enough computing time available. Table 1 shows the empirical models that were used during this work, covering the most dominant effects on the extinction coefficient . Other effects, such as the Reyleigh scattering of molecules, can be disregarded, as they are effectively several orders of magnitude smaller than the weather models presented here. All models require a factor that characterizes the weather that is commonly accepted. For rain and snowfall, it is the amount of precipitation R in mm/h; for fog and dust storms, it is the visibility V in meters (definition according to the ISO standard []); for PM2.5, it is the total suspended particle mass in µg/m³. In fact, different weather phenomena can occur at the same time, such as during a foggy day with drizzle. The individual coefficients could simply be added together to create such scenarios, but this approach is not pursued further in this paper in order to look at individual weather factors in greater detail.

Table 1.
Overview of used empirical models for extinction and backscattering coefficient during adverse weather.
2.3. Scattering on an Object Surface
Depending on the surface structure, the scattering of incident light can behave very differently. The ideal scattering behaviour is diffuse scattering, which follows the Lambertian law, where all viewing angles in the half-space are equally illuminated:
where I is the measured intensity, the initial intensity, and is the angle of incidence. However, considering that usual objects on the road do not necessarily have ideal scattering behavior, as the surface could have a metallic finish (silver car), which acts like a mirror and scatters the light away from its source, or the color could even absorb the incident light (black car), the reflection characteristics of the object need to be taken into account. Generally, white and light objects have a high reflectivity whereas black and dark objects have a low reflectivity. Several independent analyses show that matt white cars show the best reflectivity of around 80% and, in contrast, black cars just have a reflectivity of around 4% [,,]. This difference will most likely have a substantial difference in the detectability of the object using a lidar system, due to the fact that the detected laser power is linear dependent on the backscatter coefficient, as shown in Equation (2).
3. Methodology
3.1. General Setup of the Simulation
The pipeline of the simulation is depicted in Figure 2. First, the lidar system will be simulated using Carla as a virtual driving environment. It is used to simulate the driving scenarios including objects and weather. Carla then forwards the generated semantic point cloud, where every point is annotated, to ROS2, which contains the sensor model. Here, the lidar equation will then be applied on the point cloud, first calculating the weather-related loss of laser power, before adding noise due to backscattering and finally discarding every point where laser power is below a certain threshold, to cover sensor related losses. The pipeline will generate two types of point cloud: a semantic point cloud, where every point is annotated in the simulation environment (cartesian coordinates, intensity, type of object and simulation id of the object) and a reduced point cloud (cartesian coordinates and intensity). This filtered point cloud is then processed further and evaluated for each experiment. The simulation in this article will use the same validated pipeline as described in [], but it will also integrate an additional detection function. The calibration of the simulated lidar was performed using publicly available sensor performance data and was then validated by direct comparison using real-world experiments as benchmark data [,]. However, this calibration is highly dependent on the lidar configuration; hence, lidar systems of different suppliers will yield different results []. In addition, the primary data necessary to produce uncertainty quantification for the physical experiments is not publicly available, which is beyond the scope of this work.
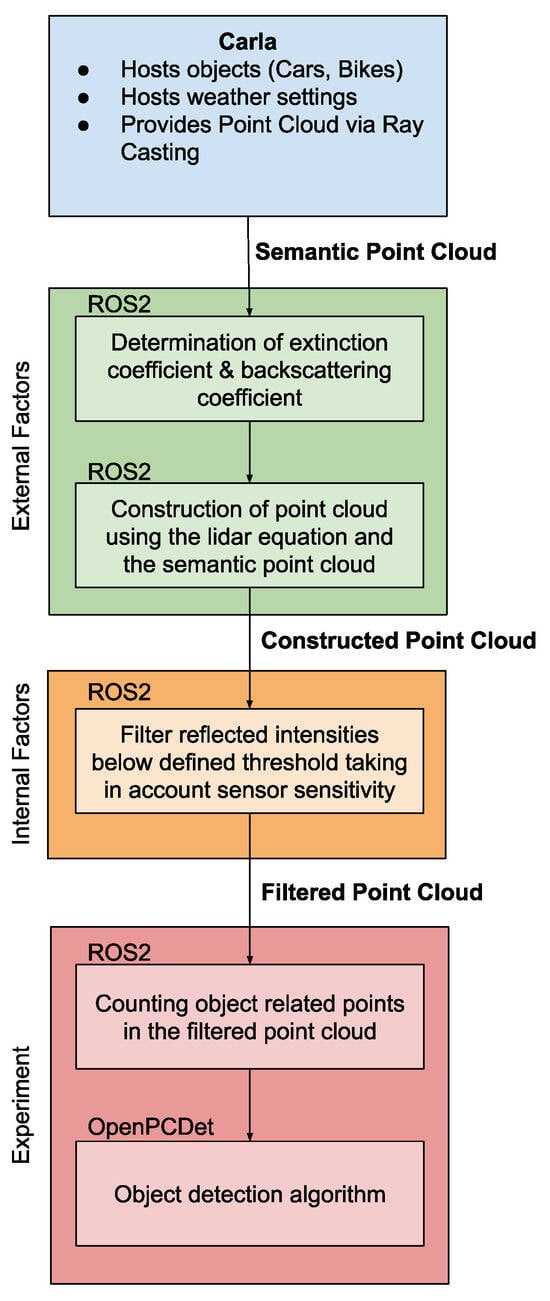
Figure 2.
Setup of the simulation.
3.2. Definition of Used Corner Cases
The corner cases used in this work follow the framework proposed by ref. [] by using a six-layer model to describe the traffic scenario:
- Layer 1: Road Level: Geometry, topology, and condition of the road.
- Layer 2: Traffic Infrastructure: Road furniture, signs, and traffic guidance systems.
- Layer 3: Temporal Modifications: Temporary changes to layers 1 and 2 (e.g., wet surface).
- Layer 4: Moving Objects: Other traffic participants (vehicles, pedestrians, etc.).
- Layer 5: Environmental Conditions: Weather, light conditions.
- Layer 6: Digital Information: Communication between vehicles and infrastructure (V2X) or map data.
Here, the methodology proposes to create a logical scenario within one layer and then introduce variations within this layer. Then, the other layers may be kept static or variations may be introduced to build causal corner case scenarios. These variations can be parameter-driven (which parameter is most sensitive), data-driven (recorded accidents), and/or knowledge-based (system specifications).
3.3. Research Questions
The following research questions were raised for this work:
Research Question 1: As the lidar equation considers the reflection characteristics of an object, the backscattered signal will be affected by it. Commonly, the benchmark tests are performed on objects with a high reflectivity such as a white car. How will the signal change if an object with a low reflectivity (e.g., a black car) shall be detected? The impact of reflection characteristics shall be investigated during this work.
Research Question 2: If a black car backscatters less signals, how are object detection algorithms affected by this behaviour compared to a white car? A second experiment based on the first experiment, introducing different distances of the objects, is performed to evaluate the object detection performance.
Research Question 3: As the lidar is highly relevant for the road safety of an autonomous vehicle, the detectability of objects during adverse weather has a large influence on the operational design domain. If an object is detected too late, a collision might be inevitable. A study of time to collision under adverse weather and different road conditions, considering the previous results of this work, can help to expand the operational design domain of autonomous vehicles in the future.
3.4. Experiment 1: Impact of Reflection Characteristics
The first simulation analysis is set up similar to the real-world experiments by [,], where a white car is placed at a distance of 23 m and different rain and fog conditions were simulated in the Cerema environmental simulation chamber []. This simulation will be slightly changed, as a black or white car will be placed at 23 m distance to the lidar and the weather conditions will be varied, including snowfall, dust storm and polluted air, which were not performed as a real-world experiment. During the simulation of a Valeo lidar system, the number of detected points that are object-related of 100 point cloud frames will be evaluated and compared based on the color of the car.
3.5. Experiment 2: Performance of Detection Algorithm During Simple Corner Case
In this simulation, the distance of the car is also variable and is set to values from 10 m to 150 m. For each weather and object distance configuration, several point cloud frames will be analyzed by the open-source detection algorithm framework OpenPCDet. This is used to determine under which weather conditions and at which distance a sufficient amount of object-related points in the point cloud exist to actually be able to successfully detect a black car. A reflectivity of 4% was assigned to the car, since this is the lowest reflectivity reported in the literature [,,]. For this simulation, a Velodyne HDL-64E lidar system [] was simulated, because the pre-trained models used for this simulation analysis were trained on data collected by such a system. For a single weather scenario, a detailed case study of the detection performance with an additional white car with 80% reflectivity is carried out and the results are compared with the theoretically expected detection ranges resulting from the lidar equation.
3.6. Evaluation of Expected Time to Collision in Corner Cases
The criticality of the scenario requires a benchmark parameter, e.g., time to collision (TTC), for a meaningful evaluation. The calculation of TTC is based on the following scenario: The ego vehicle drives towards a stationary object under a foggy weather condition. This object could, for example, be another vehicle at the end of a traffic jam. Depending on the vehicle speed and weather conditions, the object in front might be detected too late, making a collision unavoidable. For this calculation, the theoretical detection range of a Velodyne HDL-64E, verified by the simulation in Section 3.5, was used. One of the key parameters in automotive object detection is the time to collision (TTC), which defines when the ego vehicle will collide with an object in the field of view while considering the velocities and trajectory of both entities. In this scenario, a crash will become inevitable if the time to collision is smaller than the time the ego vehicle can come to a full stop. The deacceleration of the ego vehicle depends on various parameters; however, the condition of the road is one of the key parameters. For a modern middle-class limousine, a maximum deacceleration of for a dry street and for a wet street can be considered []. Although the legal situation in Germany allows highly automated driving at speeds of up to 130 km/h on the motorway, in a car with an SAE Level 3 driving assistant, the actual maximum speed for a type-approved vehicle is currently 95 km/h. However, according to the manufacturer [], certain restrictions apply to these capabilities and the driving assistant is not available for the following conditions, among others:
- At night;
- During low ambient temperatures;
- During precipitation;
- During fog.
4. Results
4.1. Experiment 1: Impact of Reflection Characteristics
4.1.1. Rain
The result of this simulation is depicted in Figure 3a. In order to be able to classify the amount of precipitation shown, a precipitation of 10 mm/h can already be classified as heavy rain []. As expected, the lidar performance of detecting the black car is very stable throughout the simulated precipitation range, but is slightly reduced compared to the white car. The reason for this behavior is most likely beams that hit the surface at very low angles and hence the reflected laser power is below the detection threshold. Whereas for the white car, the reflected laser power is still sufficient to be detected.
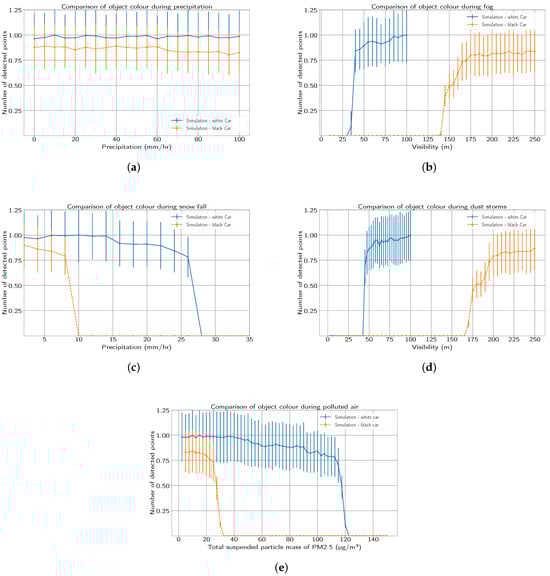
Figure 3.
A comparison of the quality of detection across different colored vehicles in an environment with varying levels of adverse weather: (a) rain, (b) fog, (c) snow, (d) dust, (e) polluted air. The error bars show the standard deviation of all recorded point cloud frames.
4.1.2. Fog
As expected, the number of detected points decreases much earlier for black cars than for white cars, which is illustrated in Figure 3b. At a visibility of below 140 m, no points related to the black car will be detected by the lidar. This result is backed by the experimental findings of [], where another lidar system type fails at a similar visibility for low-reflectivity objects. A visibility between 100 m to 2000 m can be classified as moderate visibility and a visibility below 100 m as a low visibility []. A survey evaluating the occurrence of fog in Japan shows that, on average, 10% of foggy days show a visibility below 100 m and 25% show a visibility above 100 m but below 500 m. This statement can heavily vary depending on the environment of the weather stations. In mountainous areas, a general visibility during foggy weather below 500 m already occurs 80% of the time, whereas in urban areas it occurs just 20% of the time [].
4.1.3. Snow
Figure 3c shows the simulation result of snowfall, where a precipitation of 5 mm/h is already considered as heavy snowfall []. Although the detection of the black car fails much earlier at 10 mm/h instead of at 28 mm/h for the white car, both graphs show the same very steep drop in the number of detected point within a 2 mm/h step.
4.1.4. Dust
Dust storms mainly consist of SiO2 particles which has a higher refractive index and this will lead to less forward scattering compared to water and hence a higher extinction coefficient for the same visibility is expected. Figure 3d shows the simulation result for dust. As anticipated, the number of detected points decreases at higher visibilities than for fog. A heavy dust storm can occur if strong winds with a speed of more than 40 knots stir up dry soil [], affecting areas up to 250 km away from the source of the storm with a visibility below 500 m [].
4.1.5. PM2.5
Polluted air is an anthropogenic condition in metropolitan areas, originating from burning fossil fuels. A study regarding air quality [] shows that in recent years, the highest measured value of PM2.5 was 150 µg/m³. However, even regions that usually do not show obvious air pollution, the concentration of PM2.5 can go up to 40 µg/m³, which was measured during winter 2019 in Stuttgart/Germany [], already affecting the detection of black cars as illustrated in Figure 3e.
4.2. Experiment 2: Performance of Detection Algorithm During Simple Corner Case
4.2.1. Case Study for Fog
Figure 4a shows the theoretical detection range of the Velodyne HDL-64E system by calculating the lidar equation in Equation (2) under the assumption that a single laser beam will hit a surface with a defined reflectivity under an optimal incidence angle of 0° to have the highest reflected laser power as possible. Due to the fact the lidar equation has a relation and a fixed sensor efficiency, the detection range is limited despite the weather conditions depending also on the reflectivity of the object. For a white car, a maximum detection range of 240 m is possible and around 60 m for a black car, considering a detection threshold of the laser power:
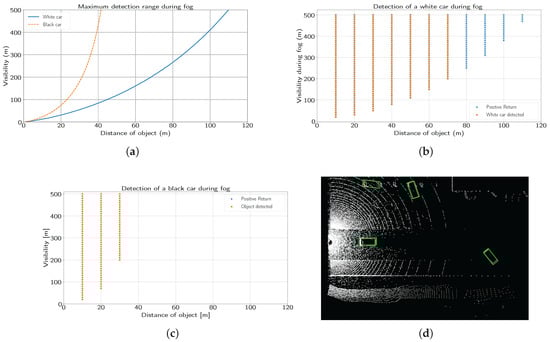
Figure 4.
(a) Theoretical detection range of differently colored cars during fog. (b) Detection of a white car during fog. (c) Detection of a black car during fog. (d) Detection of a black car during fog using the OpenPCDet framework, with the object marked with a green box. The algorithm will also detect and show false positive objects with a very low probability rating, which will be discarded.
This behavior can also be seen in Figure 4b,c. However, both graphs have a significant difference. In Figure 4b, two types of points are present: If the lidar detects a car-related point in the semantic point cloud, it will mark the point as a positive return; if the OpenPCDet algorithm detects the car at the right position in the reduced point cloud, it will be marked as object detected, an example that can be seen in Figure 4d. Obviously, the positive return points are missing in Figure 4c; this indicates that the reflected points are structured in such a way that the detection algorithm can still detect the black car, although they might have a very low intensity, and for some reason, this is not the case for the white car.
4.2.2. Analysis for Rain, Dust Storms, Polluted Air, and Snow
Figure 5a–d show the detectability of the black car for the weather conditions rain, snow, dust storm, and polluted air. The simulated weather conditions are shown in Table 2. Although the object distance was simulated up to 150 m, none of the graphs show a violation of the previously stated maximum detection range of 60 m for the simulated cars. As expected, with higher extinction coefficients and higher object distance, the detection capability is reduced. Where heavy rain or snowfall are obvious vision-restricting effects to humans and optical systems in the range of visible light, polluted air is a much more subliminal effect. Although humans might not perceive polluted air as restricting their vision, it has a huge impact on the lidar system, as shown in Figure 5d.
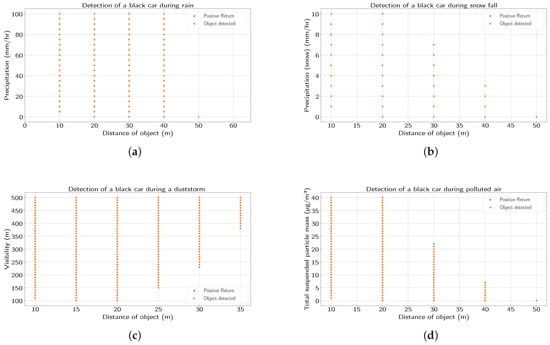
Figure 5.
The figures show a black car during different weather conditions: (a) rain, (b) snow, (c) dust, (d) polluted air.
Table 2.
Simulated weather parameters.
4.3. Evaluation of Expected Time to Collision in Corner Cases
Figure 6 presents the results of the experiments conducted to identify and compare the safe driving speed thresholds for a vehicle speed up to 100 km/h (speed limit for currently available SAE level 3-approved vehicles is 95 km/h). The figure shows the maximum calculated vehicle velocity to come to a full stop under different adverse weather conditions, generally expressed here as extinction coefficient . This corresponds to a scenario where the vehicle would be required to stop to avoid collision with a stationary vehicle. The corner cases shown in Figure 6 illustrate the detectability of a stationary vehicle on the lane ahead, as a function of visibility (expressed as a function of the extinction coefficient), for best and worst road conditions (i.e., “dry” and “wet”), and also considering nominally extreme cases of stationary vehicle body color from a reflectance viewpoint (i.e., “white” and “black”). As an additional reference, the extinction coefficient of a visibility of 50 m and 1000 m during fog is depicted as horizontal lines.
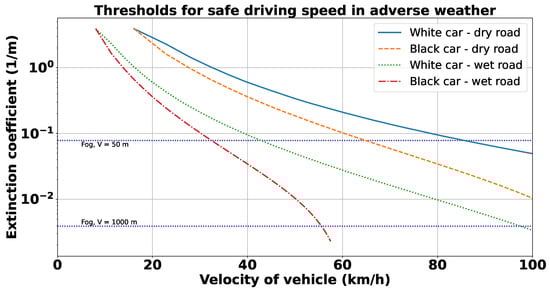
Figure 6.
Thresholds for safe driving speed for different colored cars and road conditions.
For an urban scenario with a dry road, the threshold for safe driving speed becomes critical for weather conditions with a high extinction coefficient , such as very dense fog with a visibility below 50 m, when most road users must drive at a reduced speed due to the visibility of a few meters. In Germany, for example, the maximum allowable speed is 50 km/h if the visibility is below 50 m; here, the lidar could support a maximum driving speed of 66 km/h, where a collision with a black vehicle can be avoided. However, as soon as the road is wet, the safe maximum speed drops to 33 km/h, as the tire traction is reduced, resulting in a reduced deacceleration rate. For a dry motorway scenario with a visibility of 1000 m and above, automated driving can be supported for black and white cars up to the maximum speed of 95 km/h. But this changes as soon as the road is wet. Here, a collision with a black vehicle will become inevitable at vehicle speeds above 55 km/h for some of the harsh weather conditions described in Section 4.1. However, contrary to the current practice to deactivate the driving assistant as soon as the weather conditions are not perfect, Figure 6 suggests that the lidar system could fully support highly automated driving in an urban scenario or in a traffic jam as long as the road is dry.
5. Discussion
The results of the first simulation setup, addressing research question 1, show that the number of detected points, which are related to objects with a very low reflectivity, are significantly reduced during adverse weather conditions compared to objects with a high reflectivity. The weather conditions where the detection of such dark objects might fail are a lot more likely than for bright objects, as different studies show.
The theoretical consideration of the maximum detection range depending on the object reflectivity shows that with the simulated lidar system dark objects are potentially detected up to 60 m and bright objects up to 240 m, answering research question 2. However, at larger distances, bright objects seem to generate patterns in the point cloud, which will not be detected as a valid object by the utilized object detection algorithm of the OpenPCDet framework. This is not the case for dark objects, where the patterns are obviously arranged in such a manner that the algorithm still can detect the object and just a few cases of positive point returns without successful detection are documented.
Finally, to address research question 3, a corner case with a time-sensitive aspect was analyzed. Here, it becomes clear that in bad weather and on wet roads, the speed range in which the vehicle can be driven safely is restricted, but it would probably not be necessary to deactivate the driving assistant completely at certain speeds, although this is still being done by the manufacturer at present.
This work shows that vehicles with a high reflectivity, such as white, are better detected by lidars than black vehicles. While sensor fusion is widely discussed in the literature [,] as a necessary approach to enhance robustness of object detection for autonomous driving, this research also points to the need to consider the vehicle body reflectivity characteristic as an important design consideration for future vehicles. This is important because, in many corner cases, lidar remains the most robust sensor, hence increasing the robustness of detection by lidar will directly contribute to the safety case.
6. Conclusions
This study highlights the challenges lidar systems face in detecting dark objects under adverse weather conditions, where the likelihood of detection failure is higher compared to bright objects. This work shows that virtual driving environments, enhanced with representative mathematical models of the environment and detailed sensor models, have the capability to significantly accelerate the validation of sensors and safety systems for autonomous vehicles, particularly by enabling the efficient investigation of critical corner cases. This approach allows automotive manufacturers (OEMs) and suppliers to accelerate development by systematically simulating a wide variety of environmental and object conditions. This simulation capability helps to identify potential weaknesses in systems, which is crucial for corner cases and to expand and validate the operational design domain. Ultimately, the findings emphasize the need for future safety frameworks to account for environmental factors, allowing for dynamic adjustments to vehicle speed to reduce the risk of accidents.
Author Contributions
Conceptualization, B.A., T.I., F.C., P.S. and A.A.; Methodology, B.A., T.I., F.C. and P.S.; Software, B.A.; Validation, B.A., T.I., F.C. and P.S.; Formal analysis, B.A. and F.C.; Investigation, B.A. and F.C.; Resources, B.A. and F.C.; Data curation, B.A.; Writing—original draft, B.A. and F.C.; Writing—review & editing, B.A., T.I., F.C., P.S. and A.A.; Supervision, T.I., F.C., P.S. and A.A.; Project administration, T.I. and F.C. All authors have read and agreed to the published version of the manuscript.
Funding
This research received no external funding.
Data Availability Statement
The original contributions presented in the study are included in the article; further enquiries can be directed to the corresponding author.
Conflicts of Interest
Author Behrus Alavi and Thomas Illing were employed by the company Valeo Schalter und Sensoren GmbH. The remaining authors declare that the research was conducted in the absence of any commercial or financial relationships that could be construed as a potential conflict of interest.
References
- SAE. Summary of Sae International’s Capability Levels for Aerospace and Automotive Applications; Technical Report; SAE: Warrendale, PA, USA, 2018. [Google Scholar]
- Vargas, J.; Alsweiss, S.; Toker, O.; Razdan, R.; Santos, J. An overview of autonomous vehicles sensors and their vulnerability to weather conditions. Sensors 2021, 21, 5397. [Google Scholar] [CrossRef] [PubMed]
- Zhao, J.; Li, W.; Zhu, B.; Zhang, P.; Hu, Z.; Meng, J. Corner Case Dataset for Autonomous Vehicle Testing Based on Naturalistic Driving Data. Smart Cities 2025, 8, 129. [Google Scholar] [CrossRef]
- Bolte, J.A.; Bar, A.; Lipinski, D.; Fingscheidt, T. Towards corner case detection for autonomous driving. In Proceedings of the IEEE Intelligent Vehicles Symposium, Paris, France, 9–12 June 2019; pp. 438–445. [Google Scholar] [CrossRef]
- Bogdoll, D.; Breitenstein, J.; Heidecker, F.; Bieshaar, M.; Sick, B.; Fingscheidt, T.; Zöllner, J.M. Description of Corner Cases in Automated Driving: Goals and Challenges. In Proceedings of the 2021 IEEE/CVF International Conference on Computer Vision Workshops (ICCVW), Montreal, BC, Canada, 11–17 October 2021. [Google Scholar] [CrossRef]
- Chipengo, U.; Krenz, P.M.; Carpenter, S. From antenna design to high fidelity, full physics automotive radar sensor corner case simulation. Model. Simul. Eng. 2018, 2018, 4239725. [Google Scholar] [CrossRef]
- German Aerospace Center (DLR). Pegasus Method; German Aerospace Center (DLR): Köln, Germany, 2020. [Google Scholar]
- Koopman, P.; Fratrik, F. How Many Operational Design Domains, Objects, and Events? In Proceedings of the Safe AI, Honolulu, HI, USA, 27–28 January 2019.
- Kutila, M.; Pyykonen, P.; Holzhuter, H.; Colomb, M.; Duthon, P. Automotive LiDAR performance verification in fog and rain. In Proceedings of the 2018 21st International Conference on Intelligent Transportation Systems (ITSC), Maui, HI, USA, 4–7 November 2018. [Google Scholar] [CrossRef]
- Heinzler, R.; Schindler, P.; Seekircher, J.; Ritter, W.; Stork, W. Weather Influence and Classification with Automotive Lidar Sensors. In Proceedings of the 2019 IEEE Intelligent Vehicles Symposium (IV), Paris, France, 9–12 June 2019; pp. 1527–1534. [Google Scholar] [CrossRef]
- Montalban, K.; Reymann, C.; Atchuthan, D.; Dupouy, P.E.; Riviere, N.; Lacroix, S. A quantitative analysis of point clouds from automotive lidars exposed to artificial rain and fog. Atmosphere 2021, 12, 738. [Google Scholar] [CrossRef]
- Hahner, M.; Sakaridis, C.; Dai, D.; Gool, L.V.; Be, L.V.; Zürich, E. Fog Simulation on Real LiDAR Point Clouds for 3D Object Detection in Adverse Weather. In Proceedings of the 2021 IEEE/CVF International Conference on Computer Vision (ICCV), Montreal, QC, Canada, 10–17 October 2021. [Google Scholar] [CrossRef]
- Hahner, M.; Sakaridis, C.; Bijelic, M.; Heide, F.; Yu, F.; Dai, D.; Gool, L.V.; Zürich, E. LiDAR Snowfall Simulation for Robust 3D Object Detection. In Proceedings of the 2022 IEEE/CVF Conference on Computer Vision and Pattern Recognition (CVPR), New Orleans, LA, USA, 18–24 June 2022. [Google Scholar]
- Kilic, V.; Hegde, D.; Sindagi, V.; Cooper, A.B.; Foster, M.A.; Patel, V.M. Lidar Light Scattering Augmentation (LISA): Physics-based Simulation of Adverse Weather Conditions for 3D Object Detection. In Proceedings of the ICASSP 2025—2025 IEEE International Conference on Acoustics, Speech and Signal Processing (ICASSP), Hyderabad, India, 6–11 April 2025. [Google Scholar]
- Schicktanz, C.; Gimm, K. Detection and analysis of corner case scenarios at a signalized urban intersection. Accid. Anal. Prev. 2025, 210, 107838. [Google Scholar] [CrossRef] [PubMed]
- Alavi, B.; Illing, T.; Campean, F.; Spencer, P.; Abdullatif, A. Quantifying Automotive Lidar System Uncertainty in Adverse Weather: Mathematical Models and Validation. Appl. Sci. 2025, 15, 8191. [Google Scholar] [CrossRef]
- Dosovitskiy, A.; Ros, G.; Codevilla, F.; López, A.; Koltun, V. CARLA: An Open Urban Driving Simulator. arXiv 2017, arXiv:1711.03938. [Google Scholar] [CrossRef]
- Macenski, S.; Foote, T.; Gerkey, B.; Lalancette, C.; Woodall, W. Robot Operating System 2: Design, architecture, and uses in the wild. Sci. Robot. 2022, 7, eabm6074. [Google Scholar] [CrossRef] [PubMed]
- OpenPCDet Development Team. OpenPCDet: An Open-source Toolbox for 3D Object Detection from Point Clouds. 2020. Available online: https://github.com/open-mmlab/OpenPCDet (accessed on 16 October 2025).
- Evans, B. On the Inversion of the Lidar Equation; Department of National Defence Canada: Ottawa, ON, Canada, 1984. [Google Scholar]
- Rasshofer, R.H.; Spies, M.; Spies, H. Influences of weather phenomena on automotive laser radar systems. Adv. Radio Sci. 2011, 9, 49–60. [Google Scholar] [CrossRef]
- ISO 28902-1:2012; Air Quality—Environmental Meteorology—Part 1: Ground-Based Remote Sensing of Visual Range by Lidar. ISO: Geneva, Switzerland, 2012.
- Carbonneau, T.H.; Wisely, D.R. Opportunities and challenges for optical wireless: The competitive advantage of free space telecommunications links in today’s crowded marketplace. Wirel. Technol. Syst. Millim.-Wave Opt. 1998, 3232, 119–128. [Google Scholar] [CrossRef]
- Naboulsi, M.A.; Sizun, H.; Gebhart, M.; Leitgeb, E.; Muhammad, S.S.; Flecker, B.; Chlestil, C. Measured and predicted light attenuation in dense coastal upslope fog at 650, 850, and 950 nm for free-space optics applications. Opt. Eng. 2008, 47, 036001. [Google Scholar] [CrossRef]
- ITU Radiocommunication Assembly. Prediction Methods Required for the Design of Terrestrial Free-Space Optical Links; International telecommunication Union: Geneva, Switzerland, 2007. [Google Scholar]
- Tonvall, D. Study of Reflective and Polarization Properties of Objects Found in Automotive LiDAR Applications. Ph.D. Thesis, Umeå University, Umeå, Sweden, 2020. [Google Scholar]
- Seubert, C.M. IR Reflectivity of Paint: Autonomy and CO2 Emissions; Technical Report; Ford Motor Company: Dearborn, MI, USA, 2018. [Google Scholar]
- Shung, J.L.W.; Hibbard, P.; Vijay, R.; Kin, L.A.H.; de Boer, N. White paper on LiDAR performance against selected Automotive Paints. arXiv 2023, arXiv:2309.01346. [Google Scholar] [CrossRef]
- Muckenhuber, S.; Holzer, H.; Bockaj, Z. Automotive Lidar Modelling Approach Based on Material Properties and Lidar Capabilities. Sensors 2020, 20, 3309. [Google Scholar] [CrossRef] [PubMed]
- Cerema. Plateforme de Simulation de Conditions Climatiques Dégradées. Available online: https://www.cerema.fr/en/innovation-recherche/innovation/offres-technologie/simulation-platform-adverse-climate-conditions (accessed on 25 November 2025).
- Velodyne. High Definition Lidar HDL-64E. Available online: https://hypertech.co.il/wp-content/uploads/2015/12/HDL-64E-Data-Sheet.pdf (accessed on 25 November 2025).
- Robert Bosch GmbH. Automotive Handbook, 11th ed.; John Wiley & Sons: Hoboken, NJ, USA, 2022. [Google Scholar]
- Mercedes Benz, A.G. EQS Betriebsanleitung+. Available online: https://www.mercedes-benz.de/passengercars/services/manuals.html/eqs-limousine-2022-08-v297-mbux (accessed on 25 November 2025).
- International Civil Aviation Organization. Manual on Automatic Meteorological Observing Systems at Aerodromes; Technical Report; International Civil Aviation Organization: Montreal, QC, Canada, 2011. [Google Scholar]
- Li, W.; Liu, X.; Duan, F.; Qu, Y.; An, J. A one-year study on black carbon in urban Beijing: Concentrations, sources and implications on visibility. Atmos. Pollut. Res. 2022, 13, 101307. [Google Scholar] [CrossRef]
- Peng, Y.; Abdel-Aty, M.; Shi, Q.; Yu, R. Assessing the impact of reduced visibility on traffic crash risk using microscopic data and surrogate safety measures. Transp. Res. Part C Emerg. Technol. 2017, 74, 295–305. [Google Scholar] [CrossRef]
- Akimoto, Y.; Kusaka, H. A climatological study of fog in Japan based on event data. Atmos. Res. 2015, 151, 200–211. [Google Scholar] [CrossRef]
- International Civil Aviation Organization. Quantitative Criteria for “Sandstorm” and “Duststorm”; Technical Report; International Civil Aviation Organization: Montreal, QC, Canada, 2009. [Google Scholar]
- Kadhum, A.K.; Rasheed, M.A. Some characteristics of sand and dust storm sources in Iraq. In Proceedings of the 2nd International Conference for Engineering, Technology and Sciences of Al-Kitab, Karkuk, Iraq, 4–6 December 2018; pp. 11–15. [Google Scholar] [CrossRef]
- IQAir. 2022 World Air Quality Report; Technical Report; IQAir: Steinach, Switzerland, 2022. [Google Scholar]
- Coors, V.; Pietruschka, D.; Zeitler, B. iCity. Transformative Research for the Livable, Intelligent, and Sustainable City; Springer Nature: Cham, Switzerland, 2022; pp. 225–234. [Google Scholar]
- Fayyad, J.; Jaradat, M.A.; Gruyer, D.; Najjaran, H. Deep learning sensor fusion for autonomous vehicle perception and localization: A review. Sensors 2020, 20, 4220. [Google Scholar] [CrossRef] [PubMed]
- Favelli, S.; Xie, M.; Tonoli, A. Sensor Fusion Method for Object Detection and Distance Estimation in Assisted Driving Applications. Sensors 2024, 24, 7895. [Google Scholar] [CrossRef] [PubMed]
Disclaimer/Publisher’s Note: The statements, opinions and data contained in all publications are solely those of the individual author(s) and contributor(s) and not of MDPI and/or the editor(s). MDPI and/or the editor(s) disclaim responsibility for any injury to people or property resulting from any ideas, methods, instructions or products referred to in the content. |
© 2025 by the authors. Licensee MDPI, Basel, Switzerland. This article is an open access article distributed under the terms and conditions of the Creative Commons Attribution (CC BY) license (https://creativecommons.org/licenses/by/4.0/).