Abstract
Mobile payments and e-commerce, along with credit cards, have become deeply embedded in people’s daily business and economic activities. However, the increase in transaction volume has also led to a rise in fraudulent activities. To address challenges such as extremely low fraud sample ratios, highly imbalanced data distributions, significant noise interference, and strong sequence dependencies, this paper proposes a multi-module collaborative framework for credit card fraud detection. This framework includes four core components: anomaly-aware cleaning, structure-preserving resampling, multi-indicator feature governance, and dual-channel modelling. A multi-attribute decision method based on TOPSIS is introduced for feature selection. Additionally, a dual-channel detection model is developed, comprising a static channel (random forest) and a dynamic channel (LSTM), to model non-sequential and sequential patterns, respectively. Compared with this state-of-the-art method, our results achieve 99.98% accuracy, 90.46% F1 score, and 96.39% AUC, improving both model accuracy and generalisation capabilities while maintaining structural integrity.
1. Introduction
Credit card fraud detection remains a key challenge in financial security. As electronic payments and online transactions become more common, fraudulent activities are increasingly hidden and adaptable, resulting in significant economic losses for banks and consumers [1]. Modern financial institutions increasingly rely on AI-driven fraud monitoring systems, placing fraud detection at the core of fintech and regtech ecosystems. As financial decision-making continually adapts to regulatory changes within the digital finance environment [2]. Creating efficient, accurate automatic fraud detection systems is essential for safeguarding the financial ecosystem [3]. Researchers have turned to machine learning and deep learning as primary solutions to address this issue [4,5]. However, because fraudulent transactions are rare and highly imbalanced, detection models tend to be biassed toward everyday transactions, leading to high false-negative rates [6,7]. Moreover, fraudulent behaviour often depends on the context of transaction sequences. A single transaction may seem normal, but when viewed in a sequence, it can indicate anomalies. This sequential dependency adds to the difficulty of detection [8,9]. Therefore, in credit card fraud detection research, it is essential to ensure accurate detection results without missing too many actual fraud cases. The key objective of credit card fraud detection research is to develop detection methods that remain robust in the face of multiple challenges, such as class imbalance, noise interference, and sequence dependency.
To address the challenges, researchers have proposed various detection methods. Traditional non-sequential modelling approaches include decision trees, random forests, gradient-boosted trees, XGBoost, and LightGBM, which focus on high-dimensional features and nonlinear relationships [10,11,12,13,14,15], enabling rapid modelling and classification of large-scale transaction data. However, such approaches typically treat each transaction as an independent sample for classification, often neglecting temporal dependencies between transactions and struggling to capture behavioural patterns across time. To address this limitation, increasing research recognises the critical information embedded within transaction sequences [16]. Sequence modelling approaches effectively capture contextual relationships within serialised transaction data, offering unique advantages for fraud detection, such as Recurrent Neural Networks (RNNs), Long Short-Term Memory (LSTM), and Gated Recurrent Units (GRUs) [17,18,19,20].
In credit card fraud detection, feature engineering, and data imbalance remain core challenges. Resampling strategies are widely used to mitigate the severe shortage of minority-class samples. Standard methods include oversampling, undersampling, and their variants [21,22]. Representative examples include Synthetic Minority Oversampling Technique (SMOTE), Adaptive Synthetic Sampling (ADASYN), and clustering-based sampling approaches, which have improved model performance [23,24]. However, most resampling techniques assume clean datasets; when noise or outliers are present, they can shift the data distribution, amplify outliers, and weaken model generalisation. Credit card fraud detection systems require a systematic solution that establishes synergistic mechanisms across feature selection, data cleaning, and model construction [25]. Some scholars have improved feature engineering and model architecture. Feature representation of transaction records is central to model training. While some studies employ multiple feature selection methods (such as information gain, recursive feature elimination, and chi-square tests) to select input features [26,27,28], most approaches still rely on a single method, resulting in selection bias and insufficient stability. Although hybrid resampling methods mitigate class imbalance to some extent during data processing, they inevitably over-replicate or amplify outlier samples when raw data contains noisy or anomalous instances. This leads to model overfitting and reduces detection reliability.
At the modelling level, non-sequential models excel at handling high-dimensional nonlinear features but are typically applied independently, lacking modelling of temporal dependencies in transaction data. While the sequential model is superior at capturing dependencies, it struggles to process high-dimensional static features. Both approaches have inherent limitations and performance bottlenecks when confronted with complex data. Consequently, existing solutions struggle to balance detection accuracy and recall when dealing with highly imbalanced, noisy, and highly sequential data, resulting in limited overall robustness.
To address these challenges, this paper proposes a multi-module collaborative framework structured around the primary sequence of “pre-cleaning → rebalancing → feature governance → robust discrimination”. First, an anomaly-aware cleaning module is designed, employing a One-Class Support Vector Machine (OCSVM) to proactively identify and softly isolate outliers before resampling, ensuring subsequent learning occurs solely within the cleaned subspace. Second, a structure-preserving oversampling technique is proposed that generates synthetic fraud samples exclusively within the cleaned subspace to mitigate class imbalance while preserving the original data distribution characteristics. Subsequently, a multi-metric feature governance strategy was constructed, integrating multiple feature selection metrics and employing TOPSIS for group decision-making optimisation to obtain a more discriminative feature subset. Finally, two independent modelling pipelines were built to capture different types of information: the static channel uses a random forest to learn non-sequential patterns (based on filtered features). In contrast, the sequential channel employs a recurrent neural network (LSTM) after cleaning and filtering to capture time dependencies and behavioural trajectories. Both pipelines undergo independent training and evaluation, with each reporting its advantages and applicable scenarios under different metrics and constraints. To our knowledge, this study is among the first to combine multi-criteria decision-making (TOPSIS) with a dual-sequence-static modelling framework for fraud detection. Unlike previous hybrid architectures (e.g., recurrent feature combination [29]), our framework unifies anomaly-aware cleaning, structure-preserving resampling, multi-indicator feature governance, and dual-channel prediction into a single process. Experiments conducted on a real European cardholder dataset demonstrate that this method outperforms competing methods in accuracy, F1 score, and AUC, validating its effectiveness and robustness in practical applications.
The main contributions of this paper are as follows:
- We adapted the TOPSIS multi-criteria decision method for feature selection. Six feature importance metrics were calculated: Information Value (IV), L1-regularised Logistic Regression, Random Forest feature importance, Extreme Gradient Boosting Tree (XGBoost) feature importance, Variance Threshold, and Mutual Information. These were integrated with the TOPSIS method for multi-attribute comprehensive evaluation to obtain the optimal feature subset.
- A two-stage balanced framework is proposed: first, OCSVM performs anomaly-aware cleaning; then, structure-preserving SMOTE oversampling is applied within the cleaned subspace to mitigate class imbalance while reducing distribution skew and evaluation leakage.
- The proposed method achieves 99.98% accuracy, 90.46% F1 score, and 96.39% AUC score, reaching state-of-the-art performance in the field.
The remainder of this paper is organised as follows: Section 2 introduces related works; Section 3 presents our proposed method, which involves feature selection, model construction, and optimisation process; Section 4 shows experimental results; Section 5 summarises the paper and future research directions.
2. Related Work
Severe class imbalance in credit card fraud datasets remains a persistent challenge. Traditional approaches such as the SMOTE (Synthesise Minority Over-sampling Technique) [30] have been widely adopted. This method requires careful tuning, particularly when dealing with outlier data, to prevent overfitting in high-dimensional datasets. Maldonado et al. [31] proposed FW-SMOTE (Feature Weighted SMOTE), which controls the quality of synthesised samples through feature weighting to mitigate distribution drift caused by “irrelevant feature amplification”. Complementing this, Lusito et al. [32] introduced an unsupervised feature engineering approach that represents records with feature combinations, aiding classifiers in capturing inter-class differences without relying on resampling techniques. Furthermore, Wang et al. [33] recently introduced an advanced GAN-based oversampling technique that generates more realistic fraudulent transaction samples by learning the underlying distribution of minority class data.
Feature engineering remains a critical component in fraud detection, where selecting highly relevant features significantly enhances system performance. Fu et al. [34] proposed RTEFS: a hybrid feature selection approach combining reordering and TOPSIS. By aggregating multiple scorers through a multi-stage process, it achieves a more stable and consistent ranking while reducing the bias and variance inherent in single-selector methods. Siam et al. [35] introduced a hybrid feature selection framework integrating three metrics (correlation/information gain/random forest importance), demonstrated, through validation across multiple credit card datasets, that multi-metric fusion outperforms single-metric approaches. Ileberi et al. [36] introduced a genetic algorithm-based feature selection method that significantly enhances fraud detection performance by identifying the most discriminative features from high-dimensional transaction data.
The evolving nature of fraud strategies and the demand for real-time detection have led recent reviews to note that while machine learning and deep learning have become mainstream approaches in financial anti-fraud, sample scarcity, concept drift, and evaluation bias remain major obstacles to both research and implementation [37]. Early studies primarily focused on traditional machine learning algorithms. Breiman’s [38] pioneering work on the random forest algorithm laid the foundation for ensemble methods in fraud detection. Subsequent studies extensively demonstrated the effectiveness of classical machine learning techniques in this domain. Recent comparative research has comprehensively evaluated traditional machine learning algorithms for fraud detection. Afriyie et al. [39] conducted a thorough analysis of algorithms, including Random Forest, XGBoost, and Support Vector Machines (SVM), revealing that Random Forest achieved outstanding performance with accuracy rates up to 96% and AUC values reaching 98.9%. Similarly, Alarfaj et al. [40] examined the application of state-of-the-art machine learning algorithms, highlighting the limitations of traditional methods in handling highly imbalanced datasets—a characteristic typical of credit card fraud data, where fraudulent transactions often constitute less than 1% of all transactions. Moreover, deep representation learning is being employed to enhance traditional classifiers. Fanai et al. [19] utilised autoencoders for unsupervised representation followed by a “two-stage framework” incorporating supervised deep learning methods, outperforming baseline approaches trained directly on raw features across multiple metrics. The emergence of deep learning has revolutionised credit card fraud detection by enabling automatic learning of complex patterns from raw transaction data. Benchaji et al. [16] pioneered combining attention mechanisms with LSTMs for sequential credit card fraud detection, leveraging temporal dependencies in transaction sequences to outperform traditional methods significantly. Forough and Momtazi [8] proposed a deep sequence model ensemble with a joint sequence labelling approach using LSTM+CRF, where the system utilises transaction sequence dependencies to enhance detection performance. Unsupervised autoencoders have gained attention in fraud detection for their ability to learn representations of “normal” transactions without relying on labelled data. Sehrawat and Singh [41] introduced a hybrid framework combining autoencoders with temporal networks. Autoencoders learn low-dimensional representations and reconstruction errors through reconstruction learning, which are then fed into LSTM/GRU models to capture temporal dependencies in transaction sequences. This hybrid mechanism outperformed single models and traditional baselines across comprehensive metrics. Recently, researchers have explored Transformer architectures for fraud detection. Tang et al. [42] introduced the Structured Data Transformer (SDT), organising credit card transactions into time-ordered sequences. They introduced learnable classification head tokens at the sequence head, combined with positional encoding, and utilised multi-head self-attention to capture long-range dependencies and cross-transaction patterns within transaction histories. This approach demonstrates stronger representational capabilities for complex, time-evolving fraud patterns and outperforms multiple traditional baselines on metrics such as AUC-ROC and AUC-PR. Mienye and Swart et al. [43] designed a novel ensemble model by combining generative adversarial networks (GANs) with recurrent neural networks (RNNs). The GAN partially generates synthetic fraudulent samples to mitigate data imbalance, while the RNN captures temporal patterns. This hybrid approach demonstrates robustness and effectiveness in handling class imbalance and enhancing model performance. Salam et al. [44] introduced a federated learning framework for credit card fraud detection. Under various sampling and deep model validation scenarios without sharing raw data, its performance rivals centralised training while meeting privacy compliance requirements. To enhance the interpretability of black-box deep models, Chagahi et al. [45] proposed an attention-based ensemble framework combined with SHAP for transaction-level explanations. This approach is crucial for compliance and building trust in automated fraud detection systems. Recent innovations explore graph neural networks for fraud detection. Sha et al. [46] modelled credit card transactions as heterogeneous graphs capturing relationships among cardholders, merchants, and transactions. Unlike traditional machine learning methods relying solely on numerical features from transaction records, their approach employs graph attention and temporal decay mechanisms to model higher-order relationships, achieving significant improvements in both accuracy and OC-ROC performance. Recently, Wu et al. [47] introduced Continuous Coupled Neural Networks (CCNNs), inspired by brain-like computation, for credit card fraud detection. By continuously activating neural units, this architecture strengthens its ability to learn complex temporal and spatial correlations, demonstrating strong performance in detecting previously unseen fraud patterns.
Despite significant advancements in credit card fraud detection, several challenges persist. The dynamic evolution of fraud patterns and the issue of concept drift severely undermine the long-term effectiveness of models. Existing research predominantly relies on training with static datasets, lacks continuous monitoring mechanisms to ensure temporal model stability, and thus makes it difficult to detect and adapt to emerging fraud patterns promptly. Second, the severe class imbalance problem remains fundamentally unresolved. While numerous resampling techniques mitigate sample scarcity to some extent, traditional oversampling methods are prone to introducing noise and outliers in high-dimensional feature spaces, causing synthetic samples to deviate from the true fraud distribution. More critically, existing approaches often focus solely on quantitative balance while neglecting the diversity within fraud samples. Simple quantitative augmentation fails to represent the subtypes of various fraud categories adequately. Feature engineering faces limitations in effectiveness and transferability. While specific approaches enhance feature selection stability, they rely heavily on dataset statistics, resulting in poor generalisation across institutions and regions. Moreover, heuristic search-based methods, such as genetic algorithms, incur high computational costs, making them unsuitable for real-time detection scenarios that require frequent updates. Finally, model interpretability and decision transparency remain inadequate. In fraud detection, false positives directly harm customer experience while false negatives cause financial losses, necessitating granular explanations to support manual review and model tuning. However, the internal representations of existing deep models are highly abstract, making alignment with domain experts’ experiential knowledge challenging. Future research directions include developing more robust methods to handle concept drift, creating privacy-preserving collaborative fraud detection systems, and designing architectures that balance detection accuracy with computational efficiency for deployment in production environments.
Recent research in financial economics emphasises that the impact of fraud and misconduct extends far beyond operational losses, exerting systemic effects on financial networks. For instance, studies indicate that financial advisors’ misconduct spreads through peer networks and undermines market trust, highlighting that fraud management is not merely a technical task but a phenomenon with significant economic and behavioural implications [48]. While these studies do not directly address detection algorithms, they underscore that fraud management transcends mere technical classification, representing a phenomenon with economic, behavioural, and regulatory significance. This broader perspective reinforces the importance of fraud detection research within the financial economics community. Furthermore, the rapid advancement of digital finance has accelerated the adoption of AI-based real-time fraud prevention tools, making fraud detection a central issue in both fintech and regtech domains. Financial decisions are increasingly influenced by evolving regulatory frameworks [2], meaning effective detection systems play a vital role in supporting compliant financial operations.
3. Proposed Method
This paper proposes a hybrid framework for credit card fraud detection that combines two complementary channels—non-sequential and sequential patterns—as illustrated in Figure 1. The first channel primarily identifies and evaluates static transaction features, including multi-indicator feature engineering, structure-preserving resampling, and robust classification model building. For feature selection, we synthesised six mainstream methods and fused their results using the TOPSIS multi-attribute decision method to select the optimal subset. To mitigate extreme class imbalance and outlier interference, we applied structure-preserving resampling for training data. This effectively preserves the original data distribution during testing, ensuring more objective model evaluation results. The classifier employs the Random Forest algorithm, which demonstrates significant advantages when handling high-dimensional, sparse, and nonlinear features. It is important that one-channel models rely solely on the static attributes of individual transactions, without considering temporal relationships between transactions. The second channel specifically handles time-dependent relationships within transaction sequences. Using a sliding window mechanism, it combines each target transaction with its preceding historical transactions to form input sequences [49]. This hybrid framework simultaneously evaluates static attributes and models dynamic behaviour, significantly enhancing the system’s adaptability and accuracy in practical credit card fraud detection. Subsequent sections will detail the specific implementation steps, experimental procedures, and validation results of this method.
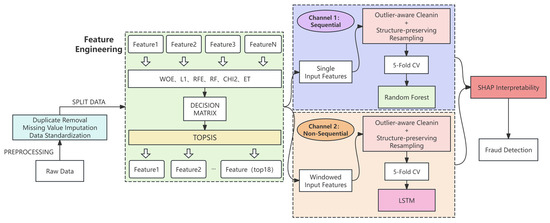
Figure 1.
Proposed credit card fraud detection framework.
To systematically evaluate the effectiveness of multi-indicator feature selection and an outlier-aware resampling strategy, this paper constructs detection models from both non-sequential and sequential modelling perspectives and conducts experiments under a unified data preprocessing framework.
Non-Sequential Modelling: Random Forest integrates multiple decision trees under the bagging framework, forming an ensemble model that enhances prediction stability and accuracy. During training, each tree performs bootstrap sampling to extract a subset from the training data and randomly selects features from the candidate set for node splitting. This randomness ensures significant variation among trees within the forest, thereby reducing overall overfitting risk. We trained the Random Forest model on a training set that underwent outlier detection and class balancing to learn the relationship between transaction static features and transaction categories. Here, “static features” refer to attributes inherent to the transaction itself, disregarding temporal context before and after the event. Examples include transaction amount (Amount) and PCA components V1–V28 (only 18 were ultimately used after feature selection). It is worth noting that, despite our feature selection, the random forest itself has the inherent capability to eliminate redundant features (irrelevant feature dropping). Therefore, retaining slightly more features does not significantly impact performance, though it increases computational load. After inputting the selected 18 features into the RF, the model can construct a large number of discriminative rules with sufficient randomness. For instance, some trees might utilise combinations of the Amount and time difference features to detect fraud, while others might employ PCA feature patterns to identify anomalies. The forest’s output is the votes or averaged probabilities from each tree, which we treat as the RF model’s fraud prediction score for each transaction. We also compared the effectiveness of different algorithms, where Random Forest stood out, outperforming others and significantly improving performance metrics.
Sequential Modelling: To capture temporal correlations between transactions, we employ Long Short-Term Memory (LSTM) networks in the sequential modelling component. Specifically, we incorporate the earlier-prepared sliding window mechanism into the LSTM architecture. For each transaction in the sequence, we extract its corresponding feature vector (using the same feature subset as RF to maintain consistency between models in the feature space). This study employs a temporal encoding architecture comprising a double-layer bidirectional LSTM, a self-attention module, an output LSTM (with a hidden dimension of 64), and two fully connected layers. Batch Normalisation and Dropout are incorporated between layers to mitigate overfitting. Input sequences are generated using a sliding window with a length of 10 and a stride of 1; each sample comprises three transaction feature matrices, sorted chronologically, with the label being the true category of the final transaction in the window. The network first extracts temporal step embeddings using two Bi-LSTM layers; subsequently, it applies scaled dot-product self-attention to perform temporal weighting of the sequence and concatenates the result with the original representation. This is followed by an LSTM layer to extract a sequence-level representation, which is then fed into two fully connected layers, and the final transaction probability is output via a Sigmoid function. During training, binary cross-entropy loss is used with the Adam optimiser for mini-batch iterative updates. In inference, the model’s fraud probability output is mapped to binary labels via a fixed threshold. It is crucial to emphasise that neither truncated BPTT nor sequence-level undersampling is employed. Category and noise processing occur at the sample level and exclusively on the training fold: first, suspicious normal samples are detected within the normal class of the training set; then, a portion of these suspicious samples is removed before sliding window sequence generation and training. The test fold is never used for fitting or cleaning, thereby preventing cross-fold information leakage during implementation.
We also analysed the computational complexity during training and inference phases. The non-temporal model employs a random forest, with training complexity approximated as O(T · N · d · log N), where T is the number of trees, N is the sample size, and d is the selected feature dimension. The temporal model constructs sequences using sliding windows (of length W) and employs LSTMs to extract sequence patterns, with training complexity expressed as O(E · N · W · H2), where E is the number of training epochs and H is the hidden unit dimension. In our experiments, five-fold cross-validation was employed, with the training phase constituting the most computationally intensive component. On a standard workstation, each fold of the sequential channel requires several minutes, while the non-sequential channel completes a fold within tens of seconds. However, since model training is an offline periodic task, this cost does not impact real-time requirements. For real-time fraud detection, inference speed is paramount. Both channels maintain lightweight characteristics during inference. The random forest model generates predictions within milliseconds, while the sequence model processes only short 10-step windows, resulting in extremely low inference latency. Consequently, this ensemble framework is suitable for real-time or near-real-time fraud detection applications.
In summary, this model enhances sensitivity to fraudulent transactions through dual static and dynamic detection channels. Random Forest provides robust rule-based predictions, while LSTM leverages temporal correlation information. In this framework, the two channels are designed to operate independently, each focusing on distinct aspects of fraudulent behaviour: the static channel concentrates on global transaction attributes, while the sequential channel captures behavioural dynamics over time. It is important to emphasise that the term “integrated dual-channel framework” refers to the architectural integration of these two complementary modelling perspectives, rather than the probabilistic fusion of their outputs. By providing parallel, complementary prediction pathways, the system can detect static anomaly patterns while also capturing temporal behavioural anomalies. Thus, integration occurs at the framework and functional levels, enabling the model to cover a broader spectrum of fraud patterns.
3.1. Data
This paper utilises the European cardholder credit card public dataset, compiled by the Free University of Brussels in Belgium in 2013. It contains 284,807 transaction records, with only 492 fraudulent samples, constituting 0.172% of the dataset [50], resulting in extreme class imbalance. The dataset comprises 31 features. To protect user privacy, no raw variables are included; the remaining 28 features were anonymised after Principal Component Analysis (PCA) processing. The time feature represents the number of seconds elapsed between each transaction and the first transaction, while ‘amount’ denotes the transaction value. Neither of these features underwent PCA. The target label “Class” distinguishes between legitimate and fraudulent transactions. Due to its authenticity and severe imbalance, this dataset has become a standard benchmark for credit card fraud detection research, frequently used to evaluate the effectiveness of resampling, anomaly detection, and sequence modelling methods.
Before formal modelling, we perform necessary preprocessing on the raw data to ensure the quality and validity of subsequent analyses. This paper conducts systematic data preprocessing across both channels. The overall workflow can be categorised into two main types: one involves basic operations independent of statistical features, while the other relies on statistical analysis.
All foundational data-cleansing tasks are completed before formal modelling and data splitting, to eliminate risks such as information leakage. Key operations include removing duplicate transaction records to avoid bias caused by sample redundancy and uniformly formatting fields such as time and amount to ensure all features are recognised under a consistent standard. These steps do not involve statistical calculations but significantly enhance data consistency.
For both sequential and non-sequential channels, this paper uniformly employs five-fold cross-validation (K = 5) for data partitioning. By dividing the entire dataset into five subsets, each experiment alternates between using one subset as the test set and the remaining four as the training set. This ensures every data point is utilised to validate model performance. This approach enables a more comprehensive assessment of the model’s behaviour across varying data distributions, yielding more reliable validation results. Fold cross-validation is also widely adopted in current credit card fraud detection research, facilitating easier comparison and replication with mainstream studies [51]. Furthermore, given the dataset size and distribution in this research, fold cross-validation strikes a balanced trade-off between computational cost and stability of results, making it suitable for supporting my model performance analysis.
In the sequence modelling task, we further allocated the most recent q% of data (where q is a tuneable parameter) as a separate test set. This simulates real-world scenarios where models must predict outcomes for the latest transactions. This approach achieves two objectives: On the other hand, financial transaction data evolves over time—for instance, fraud techniques advance, causing concept drift. Using the most recent data as the test set enables the model to adapt to such changes, maintaining robust detection performance even as the data distribution shifts over time. This better aligns with real-world application requirements.
3.2. Preprocessing
In the data preprocessing workflow described in this paper, certain operations rely on the data’s statistical properties. These steps must be performed after splitting the data into training and testing sets to ensure experimental rigour. Feature standardisation is a critical operation: we first calculate the mean and standard deviation for each feature using the training set. Subsequently, we use these statistics to normalise all samples’ features. The transformed data satisfies a mean of zero and a variance of one, accelerating model training convergence and enhancing overall algorithm performance.
Furthermore, to enhance training sample effectiveness and model robustness against noise, this paper adopts a “clean first, then balance” principle, performing oversampling only within the cleaned subspace. OCSVM (One-Class Support Vector Machine) is employed as the outlier detection tool. OCSVM automatically identifies outliers based on sample distributions, offering dynamic adaptive capabilities without requiring manual threshold settings. This approach avoids repetitive multi-round detection, streamlining the data cleaning process. Concurrently, we experimented with and compared several other mainstream anomaly detection methods, including Local Outlier Factor (LOF), Isolation Forest, and Elliptical Envelope. Experimental results demonstrate that when combined with SMOTE for class imbalance handling, OCSVM more effectively removes noise and enhances model performance. The key parameters in the preprocessing stage of all experiments were fixed to maintain methodological consistency.
3.3. Feature Selection
Feature selection plays a crucial role in fraud detection. Effectively mining discriminative features from high-dimensional data can significantly enhance a model’s learning efficiency and generalisation capability. Traditional feature selection methods typically rely on single evaluation metrics or fixed model assumptions, making it challenging to capture feature interactions and complementary information simultaneously. This paper constructs a multi-objective feature governance framework that performs scoring and fusion using only the training set, thereby avoiding data leakage. This framework integrates six commonly used methods: Information Value (IV) and Weight of Evidence (WOE), Random Forest (RF), Extreme Trees (ET), L1-regularised Logistic Regression, Chi-squared (Chi2), and Recursive Feature Elimination (RFE). Scores from each method are normalised to [0, 1] using minimum-maximum normalisation to form a unified multi-indicator score matrix. This set undergoes group decision-making via TOPSIS (Technique for Order Preference by Similarity to Ideal Solution) for weightless fusion and ranking. Rather than predefining a fixed number of features, we apply a cut-off threshold to the TOPSIS scores to determine the final subset. Features with fused scores above this threshold are retained, resulting in 18 discriminative features selected for the modelling stage.
TOPSIS, as a typical multi-attribute decision-making technique, centres on selecting the optimal solution that is both “closest to the ideal solution and farthest from the negative ideal solution” under multiple evaluation criteria. In feature selection scenarios, TOPSIS systematically balances various feature evaluation metrics by standardising and integrating feature importance across different scoring systems, thereby effectively mitigating biases inherent in single-scoring approaches. By measuring distance from the ideal solution, TOPSIS fully leverages information from all dimensions to achieve scientific ranking and screening of candidate features.
3.3.1. Feature Scoring
This paper selected the following six mainstream feature evaluation methods, covering multidimensional perspectives, including linear, nonlinear, statistical, and model-embedding methods:
- (1)
- Information Value (IV)
Information Value (IV) measures the discriminative power of a feature with respect to the target variable. Its core concept is Weight of Evidence (WOE), which quantifies the statistical dependence between the distributions of feature bins and class labels. For the -th feature in the training set, discretised into multiple bins , the evidence weight for each bin is defined as:
The Information Value of the feature is then calculated as:
A higher IV indicates that the feature contributes more significantly to distinguishing between positive and negative classes [52]. Empirically, the IV is interpreted as follows:
IV < 0.02: no predictive power
0.02–0.1: weak predictive power
0.1–0.3: medium predictive power
>0.3: strong predictive power
For continuous variables, features are first discretised into multiple bins, and their corresponding WOE and IV are computed to obtain the final IV score for each feature.
- (2)
- Random Forest Feature Importance (RF)
A Random Forest consists of an ensemble of multiple decision trees . The importance of a feature is measured by its average decrease in impurity, defined as:
where Indicates that node n splits on feature , denotes the proportion of training samples reaching node n in tree t; and represents the decrease in impurity at node n caused by splitting on feature [38].
In this study, we trained a Random Forest model consisting of 100 decision trees on a training dataset. We computed the average decrease in node impurity for each feature as its importance score. Additionally, we conducted validation experiments using the permutation importance method, which measures the reduction in model performance (accuracy and AUC) after randomly permuting a single feature. Since both methods yielded highly consistent rankings, we ultimately adopted permutation-based importance as the final criterion for feature ranking.
- (3)
- Extremely Randomised Trees Feature Importance (Extra Trees, ET)
Similarly to the Random Forest algorithm, Extra Trees (ET) calculates feature importance scores by randomly selecting cut points for feature splits. This approach captures more complex nonlinear relationships and balances the contributions of different features. The computation process is analogous to that of Random Forest, and the importance of the feature is given by:
where the notation is consistent with that used in Random Forest, except that the ensemble ɛ refers to the set of Extremely Randomised Trees [53].
In this study, we trained another Extra Trees model consisting of 100 trees to compute feature importance (using the mean decrease in impurity method) and obtained an additional feature ranking. The introduction of Extra Trees aims to provide a comparative evaluation with Random Forest and to mitigate potential bias arising from the randomness of a single model.
- (4)
- L1-Regularised Logistic Regression (L1-based Selection)
L1 regularisation leverages the sparsity property of the L1 norm by assigning a weight coefficient to each feature. For a given feature , its importance is represented by the absolute value of the corresponding regression coefficient . The objective function of L1-regularised binary logistic regression is formulated as:
where , and denotes the feature vector of the -th training sample [54].
The L1 penalty encourages unimportant feature coefficients to shrink toward zero, thereby performing feature selection. We incrementally increase the regularisation strength to control the model’s sparsity and identify essential features whose coefficients remain nonzero. To obtain a continuous importance ranking, we further calculate the average magnitude and occurrence frequency of the nonzero coefficients across multiple iterations and use these aggregated scores to rank the features.
- (5)
- Chi-Square Test (Chi2)
The Chi-square test evaluates the statistical independence between each feature and the target variable. For a given feature and the label y, a contingency table is constructed, where and represent the observed and expected frequencies, respectively. The Chi-square statistic for the feature is calculated as:
A larger value indicates a stronger correlation between the feature and the target label [55]. For each feature, we compute both the Chi-square statistic and the corresponding p-value.
A significance threshold of p < 0.05 is used as the criterion for feature–label dependency, and features are ranked according to their Chi-square values in descending order.
- (6)
- Recursive Feature Elimination (RFE)
Recursive Feature Elimination (RFE) algorithm performs wrapper-based feature selection by repeatedly evaluating model coefficients and eliminating less informative features. Using a logistic regression model as the base learner, the algorithm starts with the full feature set and removes, in each iteration, the feature with the smallest absolute coefficient value:
The process continues until a predefined number of remaining features, k = 15, is reached. The ranking of features is recorded according to their elimination order, and the feature importance score is calculated as:
This approach belongs to the wrapper family of feature selection methods [27]. In this study, we employed logistic regression as the base model for RFE due to its linearity and interpretability. The RFE algorithm recursively fits the model to all features, eliminates those with the smallest model coefficients or importance scores, and repeats the process until only 15 features remain. Finally, we recorded the elimination order of each feature to derive their overall importance ranking from the reverse elimination sequence.
3.3.2. TOPSIS Fusion Process
TOPSIS is a classic multi-attribute decision-making method. It is used to measure the degree to which each candidate feature approaches the “ideal solution” under multiple evaluation criteria. In this study, TOPSIS is applied to integrate the results of six feature selection methods (IV, RF, ET, L1, Chi2, RFE) to obtain the final ranking of feature importance. The detailed procedure is as follows:
- (1)
- Decision matrix construction
Assume that there are p features and m = 6 evaluation methods. A feature–method decision matrix is constructed as:
where denotes the normalised score of the i-th feature under the j-th evaluation method.
- (2)
- Normalisation
To eliminate the influence of different scales among methods, matrix X is normalised using the Min–Max method:
resulting in the normalized matrix .
- (3)
- Determination of positive and negative ideal solutions
For each column (criterion), the maximum and minimum values are identified as the positive and negative ideal solutions, respectively:
where represents the ideal best solution (for which all methods achieve optimal scores), and represents the ideal worst solution (for which all methods perform the worst).
- (4)
- Euclidean distance calculation
For each feature i, the Euclidean distances to the positive and negative ideal solutions are computed as follows:
where and represent the distance between the i-th feature and the positive and negative ideal solutions, respectively.
- (5)
- Relative closeness calculation
By combining the positive and negative distances, the TOPSIS closeness coefficient for each feature is defined as:
A larger value indicates that the corresponding feature performs closer to the “ideal solution” under all evaluation criteria, thus demonstrating higher overall importance.
- (6)
- Feature ranking and selection
Finally, the features are ranked in descending order according to their values. The top K features are selected as the final feature subset for model input. In this study, the selected number of features was set to K = 18:
This study employs the TOPSIS integrated evaluation method because it systematically consolidates multiple feature selection criteria within a unified framework. It synthesises multi-source information from methods such as IV, RF, ET, L1, Chi2, and RFE into a single ranking. This approach ensures the selection of the most discriminative features while effectively mitigating the bias inherent in any single algorithm. Compared to simple voting-based fusion, which relies solely on majority voting or average scoring, TOPSIS introduces geometric distance metrics for the positive and negative ideal solutions at the decision level. This approach considers both the direction and magnitude of differences between indicators, enabling more refined weighting and ranking. It overcomes the shortcomings of voting mechanisms that ignore relative distances and feature weight differences. Furthermore, TOPSIS’s scoring and ranking process is transparent and reproducible, providing a solid foundation for subsequent model evaluation and business interpretation. Subsequent experimental sections will compare this method with common single-feature selection approaches on mainstream datasets, further illustrating the practical value of TOPSIS integrated evaluation.
3.4. Resampling
In credit card fraud detection tasks, the original dataset typically contains both everyday transactions and fraudulent activities, as well as various outliers. Although specific abnormal samples and fraudulent samples may be closely distributed in the feature space, they carry entirely different implications in actual risk control and business decision-making. Failure to effectively distinguish between these two data types and apply targeted processing methods can easily introduce noise or disrupt class boundaries during resampling, thereby degrading the model’s overall detection performance. Therefore, identifying outliers prior to resampling is crucial for enhancing model robustness.
To address this, this study introduces an anomaly-aware minority class sample processing strategy prior to model training. Minority class transactions (fraud cases) often contain a small number of extremely sparse observations whose distribution significantly deviates from the core distribution. To more accurately characterise this heterogeneity, we apply single-class detection techniques to the fraud subset, identifying atypical minority samples based on their density in the feature space. This process categorises minority samples into two groups: primary typical fraud samples and a small number of atypical samples resembling outliers. These atypical minority samples are explicitly retained and processed during class balancing, rather than discarded or treated as noise.
After anomaly grouping, oversampling methods are employed to address class imbalance. Within each training fold, the SMOTE algorithm is applied only to typical minority class samples to generate synthetic fraud samples. The majority class (normal) distribution remains entirely unchanged, and evaluation folds undergo no resampling or filtering operations, thereby preserving the original structure of the test data. Following oversampling, previously identified atypical minority samples are reintegrated into the training set, ensuring the model learns both common and rare fraud patterns during training. This design preserves the statistical structure of the majority class while avoiding evaluation data tampering, and guarantees that time series or distributional features required for subsequent modelling remain unchanged.
Anomaly-Aware Cleaning
To address the inevitable presence of anomalous samples and outliers in raw credit card transaction data, this paper introduces One-Class Support Vector Machines (OCSVM) as an automated anomaly-detection tool during the training set preprocessing stage, enabling anomaly-aware cleaning. OCSVM is an unsupervised learning algorithm particularly suited to scenarios where only a large volume of normal samples is available and anomalous samples are extremely rare. This method determines an optimal hyperplane in a high-dimensional feature space, positioning the majority of samples (normal transactions) on one side of the hyperplane, far from the origin, while outliers that deviate from the mainstream distribution fall on the other side. Specifically, OCSVM can effectively characterise the mainstream distribution pattern of normal samples without relying on label information and automatically identify outliers far from the primary distribution region [56]. The data preprocessing pipeline for this study (including anomaly detection, grouping of anomalous samples, cleaning, and structure-preserving resampling) is shown in Figure 2. All preprocessing operations, including OCSVM-based anomaly detection and subsequent resampling procedures, were executed strictly within each training fold, ensuring that the test folds remained completely untouched throughout all experiments.
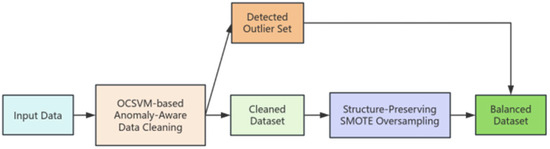
Figure 2.
Resampling Module Flowchart. “OCSVM-based anomaly-aware data cleaning” refers to using a One-Class Support Vector Machine (OCSVM) to proactively detect and remove outliers before any resampling. “Structure-Preserving SMOTE Oversampling” denotes a resampling technique that generates synthetic minority (fraud) samples only within the cleaned subspace.
- (1)
- Data preparation and partitioning
Let the transaction sample set after feature selection be
where each sample represents a feature vector, and indicates whether the transaction is legitimate or fraudulent .
The data are first divided into two subsets according to the labels: .
- (2)
- OCSVM model training
The OCSVM model is trained on the fraudulent subset . The optimisation objective of OCSVM is defined as:
subject to:
where is a nonlinear kernel mapping, controls the upper bound of outliers and the lower bound of support vectors (set to 0.5 in this study), is a slack variable allowing a small fraction of normal samples to fall inside the anomaly region, and is the bias term defining the hyperplane offset.
By introducing Lagrange multipliers, the dual form of the above optimisation problem can be expressed as:
subject to:
where denotes the kernel function.
The final decision function of OCSVM is given by:
If , the sample is classified as an anomaly (fraudulent transaction).
- (3)
- Separation of detected outliers
To prevent detected outliers from contaminating the fraudulent subset during resampling, the identified anomalous samples are separated from . Let denote the cleaned training subset used for resampling, and represent the potential outliers identified by OCSVM.
- (4)
- SMOTE-based resampling with anomaly isolation
To address the issue of extremely scarce fraudulent samples, SMOTE (Synthetic Minority Over-sampling Technique) was applied to the cleaned training subset under a 5-fold cross-validation (k = 5) setting. The OCSVM-identified outliers in were excluded from the resampling process to prevent abnormal patterns from being amplified during synthesis. In each iteration, for a minority sample , one of its k-nearest neighbours is randomly selected, and a new synthetic instance is generated as:
The fraud ratio was set to 5% to maintain a reasonable class balance after resampling. After the SMOTE generation process, the outlier set was reintegrated into the training set and uniformly labelled as fraudulent to ensure that rare but genuine anomalous fraud patterns were not overlooked.
In the anomaly-aware resampling process of this study, although the fraudulent samples detected by OCSVM also have significant reference value, they are not removed and do not participate in the SMOTE oversampling process. The entire resampling operation is performed within the main distribution range of the minority class, preserving the original data structure. Ultimately, the training set—composed of both newly generated samples and retained anomalous fraudulent samples—ensures the representativeness and diversity of the minority class while preventing outliers from distorting the distribution of synthetic data.
4. Experiments
In this section, we conduct a detailed analysis of the experimental results and performance metrics for the proposed credit card fraud detection framework. All experiments are based on the European Cardholder Public Dataset. The results will be presented and discussed under the following aspects: overall performance, channel-specific performance, contributions from features and resampling strategies, and model generalisation.
All experiments in this study were conducted in a local computing environment. The device features an Intel® Core™ i5-10200H processor with 16.0GB of DDR4 memory, running on the Windows 11 64-bit operating system. Experiments were conducted using the Python 3.12.5 language environment within an Anaconda virtual environment. Experimental results are based on the average performance metrics from five-fold cross-validation to minimise bias from random partitioning. Furthermore, resampling operations were strictly performed only after dataset partitioning to prevent data leakage.
To further validate the stability and robustness of our framework, we conducted independent experimental analyses on both non-sequential modelling and sequential modelling channels. It not only examines performance differences in static feature spaces but also evaluates the role of time-dependent information in detecting continuous fraudulent behaviour. Additionally, by comparing multiple feature selection mechanisms and resampling methods, we further explored the synergistic effects of data balancing and feature optimisation on model detection performance.
4.1. Feature Selection
To evaluate the impact of different feature selection strategies on model performance, this paper compares the performance of a single feature selection method, a voting method, and the proposed TOPSIS-based hybrid feature selection method across identical datasets and model structures.
As shown in Table 1, the differences among various feature selection methods across metrics are not particularly significant. However, since these methods rely solely on a single criterion for evaluation, they tend to overlook complementary relationships and redundant information among features, thereby limiting the model’s generalisation capability in high-dimensional feature spaces. In our study, the objective of the multi-indicator feature governance process and TOPSIS ranking is not to reduce the number of features, but to obtain a high-quality, balanced, and information-rich feature subset. Therefore, variations in feature counts reflect the scoring outcomes of the selection mechanism rather than an intentional increase in dimensionality.

Table 1.
Performance Comparison of different feature selection methods.
Notably, the voting method achieves a better balance among diverse information by integrating multiple feature selection results, yielding overall superior performance metrics compared to single-criterion approaches. This demonstrates that multi-criterion fusion effectively consolidates different algorithms’ judgments on feature relevance and discriminative power, thereby enhancing model robustness and generalisation capability.
Ultimately, the proposed TOPSIS-based feature selection method achieves multidimensional objective ranking by calculating feature-ideal solution similarities. Experiment results demonstrate superiority over both single-method and voting approaches. The TOPSIS fusion method comprehensively captures complex relationships between features and target variables, reduces dimensionality, and avoids the limitations of single methods and the subjectivity of voting methods, while effectively balancing feature diversity and model interpretability.
This study employs several commonly used evaluation metrics to quantitatively assess model performance in the fraud detection task. Given the inherent extreme class imbalance in credit card transaction datasets, overall accuracy alone is insufficient to reflect a fraud model’s true detection capability. Therefore, we supplement accuracy with more informative metrics—precision, recall, F1 score, and AUC-ROC—which more reliably reflect model behaviour and enable fairer comparisons between different approaches.
- Accuracy
Accuracy reflects the overall correctness of classification by calculating the percentage of correctly recognised samples within the total dataset, defined as:
- Precision
Precision indicates the fraction of genuine frauds among all transactions classified as fraudulent by the model, reflecting its capability to minimise false positives, defined as:
- Recall
Recall indicates the percentage of real fraudulent transactions identified by the classifier, serving as a key indicator for evaluating model effectiveness on the minority class, defined as:
- F1-score
The F1-score represents the harmonic mean of precision and recall, balancing both indicators, and is defined as:
- AUC (Area Under the ROC Curve)
AUC evaluates the model’s ability to distinguish between positive (fraudulent) and negative (legitimate) samples independent of a classification threshold. Its value ranges between 0 and 1, with higher values indicating better discrimination capability.
- MCC (Matthews Correlation Coefficient) and Balanced Accuracy
The Matthews Correlation Coefficient (MCC) and Balanced Accuracy serve as complementary metrics that more effectively reflect overall model performance under class imbalance conditions.
4.2. Structure-Preserving Resampling
To systematically evaluate the effectiveness of different data preprocessing strategies in handling class imbalance and noise interference, we conducted combined experiments pairing three resampling methods with four anomaly detection techniques. We also included models without resampling (without SMOTE and anomaly-aware cleaning) as baselines. As shown in Table 2, the selected combination achieved the best overall performance, with an F1 score of 88.34%, a recall rate of 91.14%, and an accuracy of 99.98%. Although the precision (85.71%) is slightly lower than that of specific configurations (e.g., SMOTE+ISF at 92.50%), recall is far more important than precision in credit card fraud detection scenarios. This is because the losses from false negatives—missing fraudulent transactions—typically outweigh the costs of false positives—incorrectly flagging legitimate transactions as fraudulent. Compared to the feature selection baseline F1 score, both the F1 score and recall of SMOTE+OCSVM improved. This demonstrates that cleaning outliers before resampling effectively prevents the amplification of noisy samples, enabling the model to focus more on learning genuine fraud patterns. Models trained without SMOTE or anomaly-aware cleaning show notably lower recall, confirming the importance of the resampling strategy.
Table 2.
Performance Comparison of Different Anomaly Detection Algorithms in Credit Card Fraud.
4.3. Model Evaluation
4.3.1. Non-Sequential Model
Table 3 presents a comprehensive performance comparison of various mainstream classification models on the European credit card fraud detection dataset. All experiments were conducted using five-fold stratified cross-validation, with model inputs obtained via structure-preserving resampling and feature selection.
Table 3.
Performance Comparison of Different Non-Sequential Classification Models.
Overall, all models achieved high scores, with accuracy (>99%) and AUC (>94%), indicating effective differentiation between legitimate and fraudulent transactions on this dataset. Among them, ensemble algorithms—AdaBoost, Gradient Boosting, XGBoost, LightGBM, and the Random Forest proposed in this paper—performed better overall than traditional single classifiers like KNN, Logistic Regression, SVM, and Decision Tree. This demonstrates that, in highly imbalanced fraud detection tasks, ensemble learning methods can more effectively capture the complex distributional characteristics of anomalous transaction samples through the voting fusion of multiple weak classifiers.
The Random Forest model, combined with feature selection and structure-preserving resampling strategies, achieved optimal performance across multiple key metrics: accuracy reached 99.98%, F1-score reached 90.46%, and MCC reached 90.49%, all significantly higher than other models; AUC reached 96.39%, demonstrating the model’s stability in overall discrimination capability. In contrast, while K-Nearest Neighbours (KNN) achieved slightly higher recall (95.21%), its precision (68.88%) was relatively low, resulting in a lower overall F1 score than our model. This demonstrates that our approach effectively balances precision and recall by maintaining high recall while controlling false positive rates.
Additionally, among traditional machine learning models, Support Vector Machines (SVM) and Multi-Layer Perceptron (MLP) performed relatively well, achieving F1-scores of 81.23% and 83.63%, respectively, with AUC values exceeding 99.00%. This indicates that deep learning and kernel methods retain strong expressive capabilities even with moderate sample sizes. In contrast, Naive Bayes, due to its overly stringent assumption of feature independence, exhibits significantly lower Precision and F1-scores than other models, struggling to identify complex feature interactions effectively. Figure 3 also shows the ROC curve for our non-sequential method’s performance. Figure 4 displays the confusion matrix for five-fold cross-validation. The model produces few false positives and false negatives, indicating stable recognition capability even under conditions of extreme class imbalance.
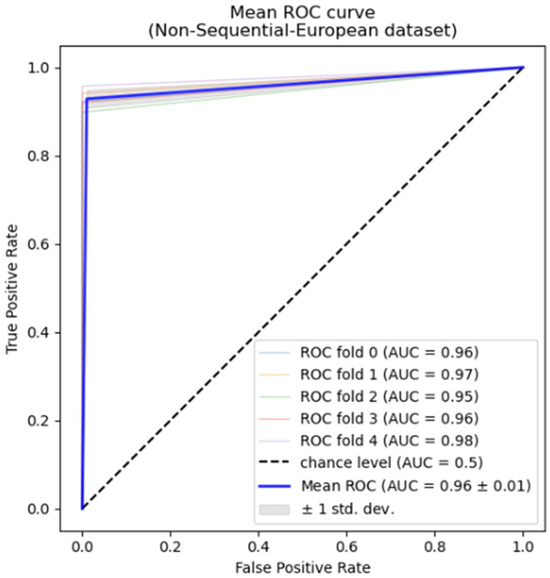
Figure 3.
ROC Curve for Sequential Modelling.
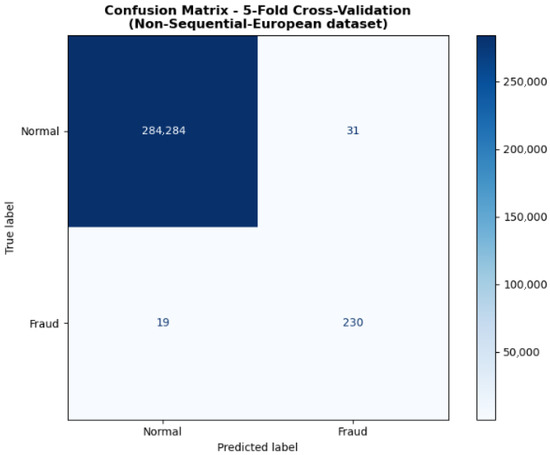
Figure 4.
Confusion Matrix.
4.3.2. Sequential Model
Here, we employed a time series neural network framework to model the sequence data after structure-preserving resampling, aiming to better capture the dynamic characteristics of fraudulent behaviour. Experiments were conducted using three recurrent neural network architectures: RNN, GRU, and LSTM.
Table 4 presents the performance of different sequential models on the European credit card dataset. The results indicate that the LSTM model achieved an AUC of 96.27%, an accuracy of 99.94%, and a recall of 78.28%. Consequently, the sequential modelling approach incorporating the temporal dimension enhances the recognition effectiveness of credit card fraud detection. Combined with the previously introduced non-sequential channel, the dual-channel detection framework proposed in this paper achieves higher overall accuracy and generalisation capability.
Table 4.
Performance Comparison of Sequential Models.
4.3.3. Comparison
- (1)
- Sequential Model Analysis
As shown in Table 5, which presents results from sequential input models (temporal feature modelling), the proposed model demonstrates significantly superior overall performance compared to existing studies. The references listed in the table report experimental results from recent years using traditional or enhanced machine learning algorithms (such as LightGBM and Random Forest) on the European Cardholder Credit Card Dataset. It can be observed that while some studies achieved high precision values, their recall and the comprehensive F1-score metric exhibited instability, particularly showing significant bias when identifying minority-class fraudulent samples. In contrast, the sequential modelling approach proposed in this paper achieved Accuracy = 0.9998, Recall = 0.9279, F1-score = 0.9046, and AUC = 0.9639 under 5-fold cross-validation, demonstrating superior generalisation capability in balancing recognition accuracy and recall. Notably, recall improved to approximately 0.93, indicating the model’s ability to capture genuine fraudulent transactions while maintaining low false-positive rates. This fully validates the modelling advantages achieved through the proposed temporal feature extraction and structure-preserving sampling strategy.
Table 5.
Comparisons with non-sequential model methods.
- (2)
- Non-Sequential Model Analysis
In the non-sequential modelling section, the proposed model was compared with the method employed by Forough and Momtaz [8], as shown in Table 6. Table 6 shows that the former achieves a Precision, Recall, and F1-score of 0.9623, 0.68, and 0.7969, respectively. Under the same window length of 10, our model improves these metrics to 0.8498, 0.7828, and 0.8108, while AUC increases from 0.84 to 0.9627. Although the precision of the proposed model decreased slightly, both recall and the comprehensive F1-score improved significantly. This demonstrates its robust minority class detection capability even without relying on temporal sequence features. Overall, the enhanced performance of the non-sequential model further validates the effectiveness of the proposed data distribution-preserving resampling method and feature optimisation strategy. These approaches enable the model to achieve stable and superior detection performance across different input structures.
Table 6.
Comparison with Sequential model Methods.
4.4. SHAP Analysis
SHAP is a universal method for interpreting model predictions, derived from the Shapley value concept in cooperative game theory [60]. It equitably distributes the overall score of a prediction across features: the expected difference in model output between “including a feature” and “excluding it” defines the feature’s marginal contribution to predicting that sample. Two key properties ensure interpretability credibility: Consistency guarantees that a feature’s SHAP value does not decrease when the model changes, and it leaves its true impact unchanged. Local accuracy requires that for any sample, the sum of all features’ SHAP values and the baseline output precisely reconstructs that sample’s prediction.
SHAP evaluates a feature’s average impact on overall predictions by comparing model outputs with and without that feature. This approach ensures fairness and consistency in feature importance assessment by considering all possible feature combinations. Calculating the average absolute SHAP value for each feature yields a global importance ranking, while individual sample SHAP values reflect a feature’s positive or negative influence on a specific prediction. This paper employs this method for interpretive analysis to identify the features most critical to fraud transaction detection, revealing the direction and magnitude of feature variations’ impact on model outputs.
In summary, as financial transaction data grows and fraud techniques evolve, credit card fraud detection will continue to face challenges. The method proposed in this study demonstrates the potential to significantly enhance detection performance by integrating multiple sources of technology (statistics, machine learning, deep learning, and decision analytics). Moving forward, we will continue refining this model to make it more intelligent, efficient, and robust, thereby contributing to the security of the electronic payment ecosystem.
Model interpretability is a critical component for establishing trust and transparency in credit card fraud detection systems. This study incorporates the SHAP (Shapley Additive exPlanations) method into the random forest model to quantify and visualise the influence of each feature on the model’s prediction outcomes. By integrating SHAP analysis, the model’s decision-making process can be intuitively explained, revealing the specific contributions of different features to classification results. Figure 5 displays the SHAP summary plot for the 18 primary features selected via TOPSIS. Features are ranked by their average absolute SHAP value, reflecting their relative importance in fraud identification.
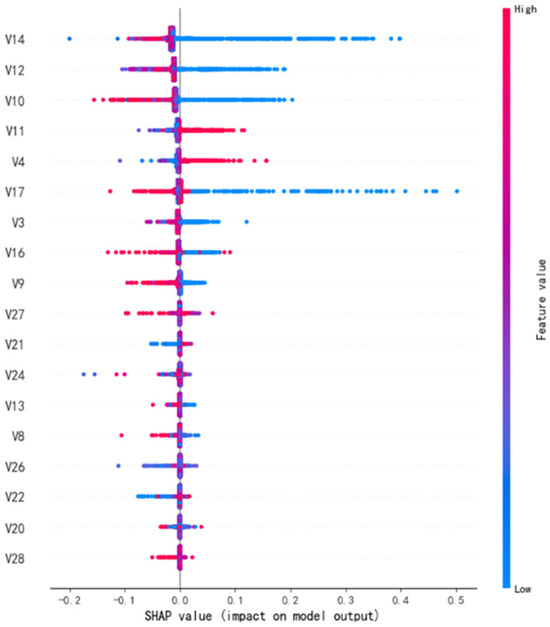
Figure 5.
SHAP Feature Importance Distribution.
As shown in Figure 5, V14, V12, V10, V11, V4, V17, V3, and V16 exert the most significant influence on model predictions. These variables likely represent anomalous transaction patterns or hidden risk signals within transaction data, effectively distinguishing legitimate transactions from fraudulent ones. Fraud analysts may prioritise monitoring resources and design targeted alert rules for these high-impact variables. Transactions exhibiting anomalous patterns can be flagged for enhanced manual review, enabling more efficient allocation of investigative resources. Specifically, V12, V10, and V11 exhibit concentrated yet wide-ranging SHAP value distributions, indicating pronounced directional effects within the model. Conversely, V14 and V17 display broader SHAP value distributions, with high-value samples showing distinct positive impacts. This suggests these features exhibit strong nonlinear effects across different samples—meaning high and low values may influence model predictions in opposite directions. This directional influence helps risk managers understand the context-dependent nature of fraud indicators, enabling the establishment of more refined decision thresholds rather than relying on simplistic cut-off rules.
Additionally, other features such as V3, V16, V9, V27, and V21 also contribute to the model output, indicating that fraud detection relies not on a single variable but on the combined effects of multiple interacting features. Overall, the model captures underlying patterns in fraudulent transactions by nonlinearly learning multidimensional signals in a high-dimensional feature space.
SHAP visualisation analysis provides clearer insights into the model’s internal logic. When feature values are high, certain variables significantly increase the probability of the model classifying a transaction as fraudulent. Conversely, when feature values are low, the model tends to classify transactions as legitimate. The global feature importance ranking derived from SHAP analysis can serve as a reference for data collection priorities while guiding investments in improving the data quality of high-impact variables. This interpretability not only validates the model’s rationality but also provides quantitative evidence for financial regulation and risk assessment.
In summary, SHAP analysis demonstrates that the model developed in this study maintains high accuracy and recall while exhibiting strong interpretability. It reveals the role of key features in fraud detection, providing crucial insights for subsequent model optimisation and practical implementation.
5. Conclusions and Discussion
This paper establishes a comprehensive closed-loop framework spanning feature governance, data balancing, anomaly cleaning, and dual-channel modelling, both sequential and non-sequential. Both channels achieve high accuracy and AUC scores, demonstrating enhanced robustness against dynamic shifts in fraud patterns. Combining OCSVM outlier-aware cleaning with structure-preserving SMOTE oversampling effectively mitigates the risk of amplifying noisy samples. The TOPSIS multi-criteria feature selection method integrates multidimensional feature importance evaluation, enhancing the scientific rigour of feature screening. The dual-channel modelling strategy fully leverages both static and dynamic sequence features, balancing generalisation capabilities for detection.
The dual-channel credit card fraud detection framework proposed in this paper, based on multi-indicator feature governance and structure-preserving resampling, achieves 99.98% accuracy, 90.46% F1 score, and 96.39% AUC on the European credit card fraud detection dataset with an extremely low fraud rate. Its performance not only validates the effectiveness of each module’s design but also provides a systematic approach to addressing the three core challenges in credit card fraud detection: class imbalance, noise interference, and sequence dependency.
The two-stage design—anomaly-aware cleaning followed by structure-preserving resampling—effectively addresses the challenge of noise amplification in traditional resampling techniques. Unsupervised learning characterises the distribution of normal and fraudulent samples, temporarily isolating outliers that deviate from it to prevent interference during SMOTE synthesis. Subsequent reintegration of these points ensures rare yet genuine fraud patterns are not overlooked, ultimately achieving a balance between noise suppression and pattern preservation.
During feature governance, this paper introduces the TOPSIS method from multi-criteria decision analysis to synthesise results from diverse feature importance metrics, constructing a more robust feature selection scheme. By calculating the distance between each feature and both the “positive ideal solution” and “negative ideal solution”, TOPSIS not only integrates multi-dimensional evaluation criteria but also avoids the biases inherent in single-method approaches and the shortcomings of voting methods that overlook differences in relative feature importance.
In the modelling phase, a dual-channel design combining static and dynamic features achieves complementarity between non-sequential patterns and temporal dependencies. Compared with representative non-sequential and sequential models discussed in the related literature, the proposed framework unifies the advantages of both modelling paradigms, integrating static and sequential learning into a cohesive design. This integration allows the model to capture both isolated transaction-level signals and evolving temporal behaviours, addressing the limitations of single-channel models that focus on only one perspective. The non-sequential channel excels in modelling static features of individual transactions; the sequential channel identifies latent fraud potentially involving sequential behaviour through windowing and bidirectional temporal encoding. Independent validation across both channels demonstrates that a single channel struggles to cover fraud patterns comprehensively. In contrast, dual-channel collaboration enables dynamic adaptation to transaction scenarios in practical applications, further enhancing detection robustness.
From a practical perspective, the improvements achieved by this framework hold direct significance for decision-making within financial institutions. The explainable random forest channel provides auditors with transparent risk assessment support, while the sequence LSTM channel captures temporal behavioural patterns that static models may overlook. Together, they form a decision support system that empowers risk teams to balance efficiency, interpretability, and customer experience during actual deployment. For cardholders, enhanced detection accuracy and reduced false positive rates not only strengthen transaction security but also boost user trust, enabling them to participate more confidently in the digital payment ecosystem.
All experiments and comparisons in this study are based on the European cardholder dataset. Future work will expand research to diverse real-world credit card transaction datasets, integrating domain knowledge to build more business-aligned feature systems. Although our framework currently operates two channels independently, integrating the prediction outputs from non-sequential and sequential channels through probabilistic fusion represents a natural and promising extension. Future work will explore various fusion strategies. We will investigate online learning and concept drift detection mechanisms, enabling real-time monitoring of model metrics to automatically trigger online update processes, thereby granting the framework long-term adaptability to business change. Despite the framework’s strong experimental performance, limitations remain. Future research will explore model parameter optimisation and introduce more expressive modelling structures—such as Graph Neural Networks (GNNs), Transformers, and federated learning—to tackle increasingly complex challenges. These endeavours collectively advance the development and practical implementation of financial risk control technologies.
Author Contributions
Conceptualisation, C.L., P.Q. and R.P.; methodology, C.L., P.Q. and R.P.; software, C.L.; validation, C.L. and P.Q.; formal analysis, C.L.; investigation, C.L. and P.Q.; data curation, C.L. and P.Q.; writing—original draft preparation, C.L., P.Q. and R.P.; writing—review and editing, C.L., P.Q. and R.P.; supervision, P.Q.; project administration, P.Q. All authors have read and agreed to the published version of the manuscript.
Funding
This work was supported by Shanghai Philosophy and Social Science Planning, China (Grant No. 2023ETQ001).
Data Availability Statement
The data presented in this study are openly available at https://www.kaggle.com/datasets/mlg-ulb/creditcardfraud (accessed on 1 December 2024).
Conflicts of Interest
The authors declare no conflicts of interest.
References
- Chaudhary, G.; Yadav, V.; Mallick, B. A review of fraud detection techniques: Credit card. Int. J. Comput. Appl. 2012, 45, 39–44. [Google Scholar]
- Abudy, M.M.; Gildin, I.; Mugerman, Y. Don’t move my cheese: Financial advice adaptation to regulatory change. Financ. Res. Lett. 2024, 61, 105005. [Google Scholar] [CrossRef]
- Ngai, E.W.T.; Hu, Y.; Wong, Y.H.; Chen, Y.; Sun, X. The application of data mining techniques in financial fraud detection: A classification framework and an academic review of literature. Decis. Support Syst. 2011, 50, 559–569. [Google Scholar] [CrossRef]
- Sulaiman, R.B.; Schetinin, V.; Sant, P. Review of machine learning approach on credit card fraud detection. Hum.-Cent. Intell. Syst. 2022, 2, 55–68. [Google Scholar] [CrossRef]
- Chen, Y.; Zhao, C.; Xu, Y.; Nie, C.; Zhang, Y. Deep Learning in Financial Fraud Detection: Innovations, Challenges, and Applications. Data Sci. Manag. 2025; in press. [Google Scholar] [CrossRef]
- Whitrow, C.; Hand, D.J.; Juszczak, P.; Weston, D.J.; Adams, N.M. Transaction aggregation as a strategy for credit card fraud detection. Data Min. Knowl. Discov. 2009, 18, 30–55. [Google Scholar] [CrossRef]
- Le, B.; Smith, J.; Nguyen, H. Real-time credit card fraud detection using hybrid ensemble model. Int. J. Cybersec. 2020, 12, 129–138. [Google Scholar]
- Forough, J.; Momtazi, S. Ensemble of deep sequential models for credit card fraud detection. Appl. Soft Comput. 2021, 99, 106883. [Google Scholar] [CrossRef]
- Xie, Y.; Liu, G.; Yan, C.; Jiang, C.; Zhou, M.; Li, M. Learning Transactional Behavioral Representations for Credit Card Fraud Detection. IEEE Trans. Neural Netw. Learn. Syst. 2024, 35, 5735–5748. [Google Scholar] [CrossRef]
- Kilickaya, O. Credit Card Fraud Detection: Smote Technique to Improve Model Performance. Available online: https://ssrn.com/abstract=4412674 (accessed on 10 May 2025).
- Dastidar, G.; Caelen, O.; Granitzer, M. Machine Learning Methods for Credit Card Fraud Detection: A Survey. IEEE Access 2024, 12, 12345–12367. [Google Scholar] [CrossRef]
- Chen, T.; Guestrin, C. XGBoost: A Scalable Tree Boosting System. In Proceedings of the 22nd ACM SIGKDD International Conference on Knowledge Discovery and Data Mining, San Francisco, CA, USA, 13–17 August 2016. [Google Scholar]
- Wang, S. A comprehensive survey of data mining-based accounting-fraud detection research. In Proceedings of the International Conference on Intelligent Computation Technology and Automation, Changsha, China, 11–12 May 2010. [Google Scholar]
- Sundaravadivel, P.; Isaac, R.A.; Elangovan, D.; KrishnaRaj, D.; Rahul, V.V.; Raja, R. Optimizing credit card fraud detection with random forests and SMOTE. Sci. Rep. 2025, 15, 17851. [Google Scholar] [CrossRef]
- Ge, D.; Gu, J.; Chang, S.; Cai, J. Credit card fraud detection using lightgbm model. In Proceedings of the 2020 International Conference on E-Commerce and Internet Technology, Zhangjiajie, China, 22–24 April 2020; pp. 232–236. [Google Scholar] [CrossRef]
- Benchaji, I.; Douzi, S.; El Ouahidi, B.; Jaafari, J. Enhanced credit card fraud detection based on attention mechanism and LSTM deep model. J. Big Data 2021, 8, 151. [Google Scholar] [CrossRef]
- Jayalakshmi, R.; Kumar, R.S.; T, T. A Survey on Credit Card Fraud Detection Using Deep Learning Models. Int. Res. J. Adv. Eng. Manag. (IRJAEM) 2025, 3, 1325–1334. [Google Scholar] [CrossRef]
- Hochreiter, S.; Schmidhuber, J. Long Short-Term Memory. Neural Comput. 1997, 9, 1735–1780. [Google Scholar] [CrossRef]
- Fanai, H.; Abbasimehr, H. A novel combined approach based on deep Autoencoder and deep classifiers for credit card fraud detection. Expert Syst. Appl. 2023, 217, 119562. [Google Scholar] [CrossRef]
- Cao, R.; Liu, G.; Xie, Y.; Jiang, C. Two-Level Attention Model of Representation Learning for Fraud Detection. IEEE Trans. Comput. Soc. Syst. 2021, 8, 1291–1301. [Google Scholar] [CrossRef]
- Chawla, N.V. Data Mining for Imbalanced Datasets: An Overview. In Data Mining and Knowledge Discovery Handbook; Maimon, O., Rokach, L., Eds.; Springer: Boston, MA, USA, 2009. [Google Scholar] [CrossRef]
- Douzas, T.; Bacao, F.; Last, F. Improving Imbalanced Learning through a Heuristic Oversampling Method based on K-Means and SMOTE. Inf. Sci. 2019, 501, 511–534. [Google Scholar] [CrossRef]
- Zhu, M.; Zhang, Y.; Gong, Y. Enhancing Credit Card Fraud Detection: A Neural Network and SMOTE Integrated Approach. arXiv 2024, arXiv:2405.00026. [Google Scholar] [CrossRef]
- He, H.; Bai, Y.; Garcia, E.A.; Li, S. ADASYN: Adaptive synthetic sampling approach for imbalanced learning. In Proceedings of the 2008 IEEE International Joint Conference on Neural Networks (IEEE World Congress on Computational Intelligence), Hong Kong, China, 1–6 June 2008; pp. 1322–1328. [Google Scholar] [CrossRef]
- Hafez, I.Y.; Hafez, A.Y.; Saleh, A.; Abd El-Mageed, A.A.; Abohany, A.A. A systematic review of AI-enhanced techniques in credit card fraud detection. J. Big Data 2025, 12, 6. [Google Scholar] [CrossRef]
- Siddiqi, N. Credit Risk Scorecards: Developing and Implementing Intelligent Credit Scoring; John Wiley & Sons: Hoboken, NJ, USA, 2012. [Google Scholar]
- Guyon, I.; Weston, J.; Barnhill, S.; Vapnik, V. Gene selection for cancer classification using support vector machines. Mach. Learn. 2002, 46, 389–422. [Google Scholar] [CrossRef]
- Pearson, K. On the Criterion That a Given System of Deviations from the Probable in the Case of a Correlated System of Variables Is Such That It Can Be Reasonably Supposed to Have Arisen from Random Sampling; Springer: New York, NY, USA, 1992; pp. 11–28. [Google Scholar] [CrossRef]
- Jurgovsky, J.; Granitzer, M.; Ziegler, K.; Calabretto, S.; Portier, P.-E.; He-Guelton, L.; Caelen, O. Sequence classification for credit-card fraud detection. Expert Syst. Appl. 2018, 100, 234–245. [Google Scholar] [CrossRef]
- Chawla, N.V.; Bowyer, K.W.; Hall, L.O.; Kegelmeyer, W.P. Smote: Synthetic minority over-sampling technique. J. Artif. Intell. Res. 2002, 16, 321–357. [Google Scholar] [CrossRef]
- Maldonado, S.; Vairetti, C.; Fernandez, A.; Herrera, F. FW-SMOTE: A feature-weighted oversampling approach for imbalanced classification. Pattern Recognit. 2022, 124, 108511. [Google Scholar] [CrossRef]
- Lusito, S.; Pugnana, A.; Guidotti, R. Solving imbalanced learning with outlier detection and features reduction. Mach. Learn. 2024, 113, 5273–5330. [Google Scholar] [CrossRef]
- Wang, J.; Yao, L. Unrolled GAN-based Oversampling of Credit Card Dataset for Fraud Detection. In Proceedings of the 2022 IEEE International Conference on Artificial Intelligence and Computer Applications (ICAICA), Dalian, China, 24–26 June 2022; pp. 858–861. [Google Scholar] [CrossRef]
- Fu, G.; Li, B.; Yang, Y.; Li, C. Re-ranking and TOPSIS-based ensemble feature selection with multi-stage aggregation for text categorization. Pattern Recogn. Lett. 2023, 168, 47–56. [Google Scholar] [CrossRef]
- Siam, A.M.; Bhowmik, P.; Uddin, M.P. Hybrid feature selection framework for enhanced credit card fraud detection using machine learning models. PLoS ONE 2025, 20, e0326975. [Google Scholar] [CrossRef]
- Ileberi, E.; Sun, Y.; Wang, Z. A machine learning based credit card fraud detection using the GA algorithm for feature selection. J. Big Data 2022, 9, 24. [Google Scholar] [CrossRef]
- Cherif, A.; Badhib, A.; Ammar, H.; Alshehri, S.; Kalkatawi, M.; Imine, A. Credit card fraud detection in the era of disruptive technologies: A systematic review. J. King Saud Univ.-Comput. Inf. Sci. 2023, 35, 145–174. [Google Scholar] [CrossRef]
- Breiman, L. Random Forests. Mach. Learn. 2001, 45, 5–32. [Google Scholar] [CrossRef]
- Afriyie, J.K.; Tawiah, K.; Pels, W.A.; Addai-Henne, S.; Dwamena, H.A.; Owiredu, E.O.; Ayeh, S.A.; Eshun, J. A supervised machine learning algorithm for detecting and predicting fraud in credit card transactions. Decis. Anal. J. 2023, 6, 100163. [Google Scholar] [CrossRef]
- Alarfaj, F.K.; Malik, I.; Khan, H.U.; Almusallam, N.; Ramzan, M.; Ahmed, M. Credit Card Fraud Detection Using State-of-the-Art Machine Learning and Deep Learning Algorithms. IEEE Access 2022, 10, 39700–39715. [Google Scholar] [CrossRef]
- Sehrawat, D.; Singh, Y. Auto-Encoder and LSTM-Based Credit Card Fraud Detection. SN Comput. Sci. 2023, 4, 557. [Google Scholar] [CrossRef]
- Tang, Y.; Liu, Z. A credit card fraud detection algorithm based on SDT and federated learning. IEEE Access 2024, 12, 182547–182560. [Google Scholar] [CrossRef]
- Mienye, I.D.; Swart, T.G. A Hybrid Deep Learning Approach with Generative Adversarial Network for Credit Card Fraud Detection. Technologies 2024, 12, 186. [Google Scholar] [CrossRef]
- Salam, M.A.; Fouad, K.M.; Elbably, D.L.; Elsayed, S.M. Federated learning model for credit card fraud detection with data balancing techniques. Neural Comput. Appl. 2024, 36, 6231–6256. [Google Scholar] [CrossRef]
- Chagahi, M.H.; Delfan, N.; Dashtaki, S.M.; Moshiri, B.; Piran, M.J. Explainable AI for Fraud Detection: An Attention-Based Ensemble of CNNs, GNNs, and A Confidence-Driven Gating Mechanism. arXiv 2024, arXiv:2410.09069. [Google Scholar]
- Sha, Q.; Tang, T.; Du, X.; Liu, J.; Wang, Y.; Sheng, Y. Detecting credit card fraud via heterogeneous graph neural networks with graph attention. arXiv 2025, arXiv:2504.08183. [Google Scholar] [CrossRef]
- Wu, Y.; Wang, L.; Li, H.; Liu, J. A Deep Learning Method of Credit Card Fraud Detection Based on Continuous-Coupled Neural Networks. Mathematics 2025, 13, 819. [Google Scholar] [CrossRef]
- Dimmock, S.G.; Gerken, W.C.; Graham, N.P. Is fraud contagious? Coworker influence on misconduct by financial advisors. J. Financ. 2018, 73, 1417–1450. [Google Scholar] [CrossRef]
- Yousefimehr, B.; Ghatee, M. A distribution-preserving method for resampling combined with LightGBM-LSTM for sequence-wise fraud detection in credit card transactions. Expert Syst. Appl. 2025, 262, 125661. [Google Scholar] [CrossRef]
- Available online: https://www.kaggle.com/datasets/mlg-ulb/creditcardfraud (accessed on 10 May 2025).
- Browne, M.W. Cross-Validation Methods. J. Math. Psychol. 2000, 44, 108–132. [Google Scholar] [CrossRef]
- Lin, A.Z.; Hsieh, T.-Y. Expanding the Use of Weight of Evidence and Information Value to Continuous Dependent Variables. In Proceedings of the SouthEast SAS Users Group (SESUG 2014), Helen, GA, USA, 19–21 October 2014; pp. 1–12. [Google Scholar]
- Geurts, P.; Ernst, D.; Wehenkel, L. Extremely randomized trees. Mach. Learn. 2006, 63, 3–42. [Google Scholar] [CrossRef]
- Tibshirani, R. Regression Shrinkage and Selection Via the Lasso. J. R. Stat. Soc. Ser. B (Methodol.) 1996, 58, 267–288. [Google Scholar] [CrossRef]
- Forman, G. An extensive empirical study of feature selection metrics for text classification. J. Mach. Learn. Res. 2003, 3, 1289–1305. [Google Scholar]
- Schölkopf, B.; Platt, J.C.; Shawe-Taylor, J.; Smola, A.J.; Williamson, R.C. Estimating the support of a high-dimensional distribution. Neural Comput. 2001, 13, 1443–1471. [Google Scholar] [CrossRef]
- Leevy, J.L.; Hancock, J.; Khoshgoftaar, T.M.; Zadeh, A.A. One-class classification for credit card fraud detection: A detailed study with comparative insights from binary classification. In Analytics Modeling in Reliability and Machine Learning and Its Applications; Springer: Berlin/Heidelberg, Germany, 2025; pp. 117–140. [Google Scholar]
- Shah, D.; Kumar Sharma, L. Credit card fraud detection using decision tree and random forest. ITM Web. Conf. 2023, 53, 02012. [Google Scholar] [CrossRef]
- Taha, A.A.; Malebary, S.J. An Intelligent Approach to Credit Card Fraud Detection Using an Optimized Light Gradient Boosting Machine. IEEE Access 2020, 8, 25579–25587. [Google Scholar] [CrossRef]
- Thanathamathee, P.; Sawangarreerak, S.; Chantamunee, S.; Nizam, D.N.M. SHAP-Instance Weighted and Anchor Explainable AI: Enhancing XGBoost for Financial Fraud Detection. Emerg. Sci. J. 2024, 8, 2404–2430. [Google Scholar] [CrossRef]
Disclaimer/Publisher’s Note: The statements, opinions and data contained in all publications are solely those of the individual author(s) and contributor(s) and not of MDPI and/or the editor(s). MDPI and/or the editor(s) disclaim responsibility for any injury to people or property resulting from any ideas, methods, instructions or products referred to in the content. |
© 2025 by the authors. Licensee MDPI, Basel, Switzerland. This article is an open access article distributed under the terms and conditions of the Creative Commons Attribution (CC BY) license (https://creativecommons.org/licenses/by/4.0/).