You are currently viewing a new version of our website. To view the old version click .
Electronics
  • Article
  • Open Access

25 November 2025

Frequency-Domain Modeling and Multi-Agent Game-Theory-Based Low-Carbon Optimal Scheduling Strategy for Integrated Energy Systems

,
,
,
,
and
1
State Grid Shandong Electric Power Company, Jinan 250000, China
2
Shandong Provincial Key Laboratory of Big Data Technology for Energy Industry Internet, Jinan 250000, China
3
State Grid Shandong Electric Power Research Institute, Jinan 250000, China
4
State Grid Dezhou Power Supply Company, Dezhou 253000, China
This article belongs to the Special Issue Hydrogen and Fuel Cells: Innovations and Challenges, 2nd Edition

Abstract

Driven by the dual-carbon strategy, achieving low-carbon economic operations through coordinated optimization of multi-energy flows in integrated energy systems (IES) has emerged as a critical research focus. This paper proposes a low-carbon optimized scheduling strategy for IES based on frequency-domain modeling and multi-agent collaborative game theory, presenting a dual-dimensional innovative methodology for electricity–heat–gas integrated energy systems. At the physical modeling level, the study overcomes the limitations of conventional steady-state models and finite difference methods by pioneering a frequency-domain analytical approach for day-ahead scheduling. Through Fourier transform, the partial differential equations (PDEs) governing thermal and gas network dynamics are converted into linear complex algebraic equations, significantly reducing solution complexity while preserving modeling accuracy and enhancing computational efficiency. In operational optimization, a multi-agent cooperative mechanism is established by partitioning system operators into a tripartite alliance comprising power-to-gas (P2G) facilities, carbon capture units, and energy storage systems. A collaborative optimization model incorporating dynamic energy transmission characteristics is developed, with innovative application of Shapley value method to quantify agent contributions and allocate collaborative surplus. Simulation results demonstrate that the proposed strategy maintains dynamic constraint accuracy in gas–thermal networks while achieving notable improvements: significant reduction in total operational costs, enhanced wind power accommodation rates, and decreased carbon emission intensity. This research provides novel insights that help to resolve the modeling accuracy–computational efficiency dilemma in multi-energy coupled systems, concurrently establishing an equitable and economically viable benefit distribution mechanism for multi-agent collaboration. The findings offer substantial theoretical significance for advancing the low-carbon transition of modern power systems.

1. Introduction

At present, compared with traditional generating units, combined heat and power (CHP) units and gas turbines are developing rapidly, and the coupling relationship between the power system (EPS), district heating network (DHN), and natural gas network (NGN) is increasingly close. The proportion of natural gas power generation in the United States continues to rise, from 37% in 2019 to 41% in 2023. Natural gas has become the highest proportion of power generation fuel []. More than 70% of the heating load in northern China is borne by CHP units []. Gas-fired units and CHP units have significant economic and environmental benefits, but they also lead to a strong coupling relationship between natural gas, heat, and power systems, which increases the complexity of integrated energy systems (IES). At present, the integrated energy network with the deep coupling of multi-energy flow is regarded as an organic whole. It is of great significance to study its optimal scheduling method to improve energy efficiency, reduce carbon emissions, and break the barriers between traditional energy systems. This process can promote the synergy and complementarity of different energy networks, release the inherent flexibility of the network, reduce the overall operating costs and reduce security risks.
In recent years, many scholars have carried out research on the modeling of integrated energy systems. Most scholars use steady-state models to optimize the modeling of multi-energy flow systems. For example, Reference [] transformed mixed integer quadratic constraint programming (MIQCP) into mixed integer linear programming (MILP) through a rolling optimization strategy to improve the efficiency of solution. Reference [] proposed a two-stage distributed optimal scheduling model for electricity and heat, which strengthened the privacy protection ability in joint scheduling. References [,] studied resilience enhancement strategies for electric thermal coupling systems based on steady-state heating network models. Reference [] constructed a decentralized two-stage robust scheduling framework by simplifying the Weymouth equation and the pipeline gas storage equation. In Reference [], a distributed coordinated optimization model of a power–gas distribution network is established for wind power uncertainty, and it is linearized. References [,] adopt a distributed robust optimization method, combined with a column and constraint generation (CCG) algorithm, to solve the steady-state electric pneumatic coupling system model and improve operational flexibility. However, the above research has three limitations: Firstly, the steady-state model does not take into account the dynamic transmission characteristics of the heating network and the gas network, resulting in the inherent scheduling flexibility of the system not being fully explored, and the space for economic benefit improvement is limited. Secondly, the scheduling scheme generated based on the steady-state assumption may deviate from the actual dynamic constraints, resulting in a decrease in the reliability of the operation strategy. Thirdly, the dynamic security boundary of the multi-energy flow coupling system is not included in the optimization model, which may lead to potential operational risks. In addition, even the dynamic adaptation ideas involved in existing studies do not directly conduct accurate modeling of the dynamic processes of multi-energy networks or rely on simplified processing of time-domain dynamic models, which have problems in terms of high computational complexity and difficulty in adapting to day-ahead scheduling needs. The research shows that the lack of dynamic characteristic modeling not only affects the economy and flexibility of the system, but also leads to a mismatch between the scheduling results and the actual physical process, which threatens the safe and stable operation of the energy network.
At present, research on the coordinated operation optimization of integrated energy system has made a series of progressions. By constructing a cross-time-scale collaborative optimization framework covering the coupling of electricity–heat–cold–gas multi-energy flow, the existing research [,] effectively integrates energy conversion equipment and energy storage devices in the day-ahead–day-real-time multi-stage scheduling model, fully taps the multi-energy complementary potential and system operation flexibility, and lays a theoretical foundation for the IES infrastructure. Reference [] innovatively proposed a source-load bilateral collaborative optimization paradigm. By characterizing the coupling characteristics of the demand-side response of cooling, heating, and power, a park-level IES scheduling model was constructed to achieve collaborative optimization of economic improvement and renewable energy consumption.
Notably, as IES operation involves multiple stakeholders, coordinating multi-subject interests is key to optimizing system performance, and multi-agent game theory has become a core tool for this. Studies on this theory in energy systems from 2022 to 2024 have produced notable results. For instance, some research focuses on the dynamic game and alliance formation mechanisms among multi-agents under the carbon neutrality goal, deeply exploring the strategy selection and benefit distribution of different energy entities under carbon constraints. Additionally, other work combines new technologies such as digital twins and blockchain to provide more innovative technical support and trust mechanisms for multi-agent collaboration. These advances have laid a foundation for multi-subject coordination in IES, but they still fail to cover the specific scenarios of low-carbon technology and its integration.
However, there are still gaps in the existing research on the construction of multi-agent coordination mechanisms and, especially, the alliance operation mode of low-carbon technologies such as P2G and carbon capture (CCS) has not been discussed in depth. Due to the diminishing marginal returns of a single subject investing in low-carbon equipment, it is crucial to establish a multi-party cooperation mechanism to synergize the renewable energy consumption potential of P2G and the carbon emission reduction advantages of CCS, and design a scientific income distribution mechanism.
In response to the key issues mentioned above, this article proposes an IES low-carbon collaborative optimization method based on the dual perspectives of frequency-domain modeling and cooperative game theory. Firstly, frequency-domain modeling is performed on the heat and gas network models; subsequently, a multi-objective optimization model considering carbon trading mechanisms and wind curtailment penalties is constructed to quantify the low-carbon economic indicators of the system, and efficient calculations are achieved through the GUROBI 10.0.1 optimizer. The numerical simulation results show that this strategy significantly improves the economic and environmental benefits of system operation while ensuring solution accuracy, verifying the dual advantages of the model in promoting multi-agent cooperation and enhancing the consumption of new energy. It is the first to apply the frequency-domain analysis method to the day-ahead scheduling of electricity–heat–gas three-network-coupled systems. By transforming the dynamic partial differential equations of heating and gas networks into linear complex algebraic equations via Fourier transform, the method not only makes up for the defect of ignoring dynamic characteristics in existing steady-state models but also solves the problem of the high computational complexity of traditional time-domain dynamic methods. At the same time, this frequency-domain model is integrated with the Shapley value game mechanism to form a closed loop of “dynamic modeling–optimal scheduling–benefit distribution”, which fills the research gap between the dynamic characteristic characterization of multi-energy coupled systems and multi-agent collaborative optimization, and provides a new technical path for the low-carbon economic operation of integrated energy systems.

2. Frequency-Domain Modeling of Heating and Gas Networks

This section proposes a key network frequency-domain dynamic modeling method for integrated energy systems, which constructs refined dynamic models for heating networks and natural gas networks, respectively. It establishes a three-dimensional coupled model for the heating network, consisting of dynamic transmission equations for heating pipelines, mixed temperature equations for nodes, and continuity equations for node branch temperatures, to accurately characterize the time-varying heat transfer characteristics of the thermal system. For natural gas networks, a triple constraint system is used to fully describe the dynamic pressure fluctuations and mass conservation relationship during gas transmission through the dynamic pressure equation of gas network pipelines, the continuity equation of node branch pressure, and the conservation equation of node flow rate. Both types of models are based on frequency-domain analysis theory, which converts complex partial differential equations into linear algebraic forms, significantly improving model solving efficiency while retaining dynamic characteristics.

2.1. Dynamic Frequency-Domain Modeling of Heating Pipelines

For the axial heat conduction process in heating pipelines, its heat transfer behavior can be described by the following partial differential equation (PDE):
T ( x , t ) t = α 2 T ( x , t ) x 2 h P ρ c p A ( T ( x , t ) T a )
where T x , t is the temperature distribution, α = k ρ c p is the thermal diffusivity, k is the thermal conductivity of the medium, c p is the constant pressure specific heat capacity, ρ is the medium density, h is the convective heat transfer coefficient, P is the pipe perimeter, A is the cross-sectional area, and T a is the ambient temperature.
The Biot number (Bi) is a dimensionless number that characterizes the ratio of internal conductive thermal resistance to external convective thermal resistance. For the pipe insulation layer, it is defined as follows:
B i   =   h × δ i n s k i n s
where h is the external convective heat transfer coefficient, δ i n s is the characteristic length (here, the thickness of the insulation layer), and k i n s is the thermal conductivity of the insulation material.
A B i   < <   0.1 indicates that the internal temperature gradient is negligible, and the lumped capacitance method can be applied. Although our model is not strictly a lumped capacitance model, a small Bi value suggests that radial temperature variations are significantly less pronounced than axial ones, thereby supporting the approximate validity of the primary 1D axial heat transfer model.
For the typical pipe parameters involved in this study (DN300 steel pipe with a specified insulation layer, insulation thermal conductivity k i n s 0.03   W / ( m K ) , external convective heat transfer coefficient h 10   W / ( m 2 K ) ), the calculated Biot number is B i     0.02 . Given that Bi < 0.1, this indicates that the internal conductive resistance of the insulation layer is much smaller than the external convective resistance, and the temperature across the insulation cross-section is nearly uniform. The radial thermal dynamics are thus much faster than the axial transport process. Consequently, for the day-ahead scheduling focus, where the primary concern is axial energy transport over timescales greater than several tens of minutes, neglecting detailed radial temperature distribution is an acceptable engineering approximation, and the 1D axial model effectively captures the dominant system dynamics. Certainly, for uninsulated or poorly insulated pipes, or for studies requiring precise capture of transient processes involving significant radial gradients (e.g., during pipe startup), a two- or three-dimensional model would be necessary.
To convert the time-domain heat conduction equation to the frequency domain for simplified analysis, the Fourier transform is applied to time t. We define the Fourier transform of the temperature distribution as T ^ ( x , j ω ) = F { T ( x , t ) } = T ( x , t ) e j ω t d t   (where j is the imaginary unit and ω is the angular frequency); performing Fourier transform on both sides of Equation (1) yields the following:  F { T ( x , t ) t } = j ω T ^ ( x , j ω ) T ( x , 0 ) , F { α 2 T ( x , t ) x 2 β ( T ( x , t ) T a } = α d 2 T ^ ( x , j ω ) d x 2 β ( T ^ ( x , j ω ) T a ( j ω ) } . Upon substitute the transformed left and right sides into Equation (1), the original partial differential equation can then be transformed into the following:
j ω T ^ ( x , j ω ) = α d 2 T ^ ( x , j ω ) d x 2 h P ρ c p A ( T ^ ( x , j ω ) T ^ a )
After rearranging the above equation, an ordinary differential equation (ODE) with respect to the spatial variable x is obtained:
d 2 T ^ ( x , j ω ) d x 2 j ω ρ c p A + h P k A T ^ ( x , j ω ) + h P k A T ^ a = 0
Solving this ordinary differential equation, its general solution takes the following form:
T ^ ( x , j ω ) = A e γ x + B e γ x + T ^ a
where γ = j ω ρ c p A + h P k A is a complex coefficient that comprehensively reflects the influence of frequency and pipeline thermal properties on the heat conduction process; A and B are undetermined coefficients, and the specific process is as follows:
Initial condition (t = 0): The initial temperature field is known. This condition is directly incorporated into the general solution through the particular solution, ensuring the solution satisfies the temperature state at the initial moment.
Inlet boundary condition (at x = 0): The time-varying law of the pipeline inlet temperature is known, and its Fourier transform result can be directly substituted into the general solution at the inlet position (x = 0). This establishes the first equation for A and B, reflecting the initial influence of inlet temperature on the temperature distribution inside the pipeline.
Non-reflective outlet boundary condition (at x = L): To simulate the physical characteristics of practical heating networks, particularly of no heat reflection at the outlet, the spatial rate of change in temperature at the outlet must be zero. By taking the spatial derivative of the general solution and substituting the outlet position (x = L) and the “zero derivative” constraint, the second equation for A and B is established, which reflects the physical constraint of non-reflective outlet.
The two equations derived from the inlet and outlet boundary conditions can be solved to obtain the unique coefficients A and B. Substituting the solved A and B back into the general solution yields the frequency-domain temperature distribution satisfying all boundary constraints.
Furthermore, for the one-dimensional heat conduction process in heating pipelines considering both convection and heat loss, its time-domain partial differential equation is described as follows:
ρ c w A θ ( x , t ) t + ρ c w A v θ ( x , t ) x = λ A 2 θ ( x , t ) x 2 + h o P ( θ a θ ( x , t ) )
where θ ( x , t ) is the temperature distribution under convection; ρ is the medium density; c w is the medium specific heat capacity; v is the medium flow velocity; λ is the thermal conductivity; h o is the outer-surface convective heat transfer coefficient; and θ a is the external environment reference temperature.
To reconcile the application of frequency-domain analysis with the finite horizon of day-ahead scheduling and the causal nature of thermal disturbances, the transform is applied over a finite time window. For a given time window T w , the applied transform for angular frequency ω is defined as follows:
T ˜ ( x , ω ; t 0 ) = t 0 t 0 + T w T ( x , t ) e j ω t d t
This formulation, effectively a Short-Time Fourier Transform (STFT) centered at t 0 with a rectangular window of length T w , is applied sequentially across the scheduling horizon. It allows for the analysis of frequency components within a localized time window, making it suitable for our finite-time scheduling problem. The window length T w is chosen to be 1.2 h, corresponding to the thermal inertia time constant of the pipeline, ensuring it captures the system’s dominant dynamic response.
The thermal inertia time constant τ of the pipeline, which dictates the characteristic timescale of its transient thermal response, is calculated based on the lumped capacitance method. The calculation formula and parameters are given by the following:
τ = ( m c p ) pipe + ( m c p ) water U A s
where ( m c p ) pipe is the heat capacity of the steel pipe section. The mass m is calculated using the pipe’s outer diameter (DN300, 323.9 mm), wall thickness (7.1 mm), density ρ steel = 7850   kg / m 3 , and specific heat capacity c p , steel = 490   J / ( kg K ) ; ( m c p ) water is the heat capacity of the water inside the pipe, calculated using the pipe’s inner diameter, density ρ water = 1000   kg / m 3 , and specific heat capacity c p , water = 4182   J / ( kg K ) ; and h is the overall heat transfer coefficient between the pipe and the ambient. For the insulated pipe studied, this value is dominated by the insulation layer (thickness 50 mm and thermal conductivity k i n s 0.03   W / ( m K ) , resulting in U 0.5   W / ( m 2 K ) ; A s is the outer surface area of the insulation layer per unit length.
Substituting the standard parameters for a DN300 insulated steel pipe into the above equation yields a time constant τ 1.2 h, which validates the selected value for the time window T w .
When performing the finite-time transform on this time-domain equation, the following boundary conditions are specified.
The validity range of this assumption holds when the propagation time of thermal disturbances is within the characteristic time window T w (1.2 h for the heating pipeline studied in this paper). Within this time range (≤1.2 h), the dynamic response of the thermal network can be accurately characterized; when exceeding T w , a time-domain correction term (based on the finite difference method) needs to be introduced to avoid cumulative errors caused by frequency-domain linearization.
Initial condition: At t = 0 , the temperature distribution of the medium inside the pipeline is a known initial field, θ ( x , 0 ) = θ 0 ( x ) . This initial distribution acts as the “a priori input” of the pipeline’s thermal state, characterizing the intrinsic temperature field before thermal disturbances are imposed.
Spatial boundary conditions: At the pipeline inlet x = 0 , the time-varying temperature satisfies a known inlet temperature function θ ( 0 , t ) = θ in ( t ) , which represents the temperature input to the pipeline from the upstream heat source or heat transfer link; at the pipeline outlet ( x = l , l being the pipeline length), the non-reflective boundary condition is satisfied to simulate the physical characteristic in practical scenarios of no heat reflection at the outlet.
In the Fourier transform process, combining the above initial and inlet boundary conditions, the Fourier transform is applied to both sides of the time-domain equation simultaneously. Utilizing the differential properties of the Fourier transform (e.g., the time-domain differential property F f ( t ) t = j ω f ˙ ( ω ) f ( 0 ) and the spatial-domain differential property F f ( x , t ) x = f ˙ ( x , ω ) x ), the frequency-domain equation is finally derived.
By applying the idea of Fourier transform, the frequency-domain equation describing the dynamic characteristics of thermal network pipelines can be written as follows:
t ˙ b , k E = e μ b c w m b l b e j k Ω ρ w A l m b t ˙ b , k S , b B H , k = 0 , , K H
where t ˙ b , k E is the complex amplitude of the medium temperature at the exit of pipeline b for the frequency component k , μ b is the heat loss coefficient of pipeline b , c w is the specific heat capacity of the heat transfer medium at constant pressure, m b is the mass flow rate of the medium in pipeline b , l b is the length of pipeline b , j is the imaginary unit, k is the frequency index, Ω is the fundamental frequency, ρ w is the density of water, A i is the characteristic cross-sectional area of the pipeline, t ˙ b , k S is the complex amplitude of the medium temperature at the start of pipeline b for the frequency component k , B H is the set of all heating pipelines, and K H is the total number of frequency components considered.

2.2. Mixing Equation of Heating Node Temperature

i I n HS q i HS ( τ ) + c w b I n H , in m b t b E ( τ ) = q n HL ( τ ) + c w t n N ( τ ) b I n H , , out   m b , n H
where q i HS ( τ ) is the heat input from source i into node n at time τ , t b E ( τ ) is the temperature of the medium at the exit of pipeline b entering node n at time τ , q n HL ( τ ) is the heat loss from node n to the environment at time τ , t n N ( τ ) is the temperature of the medium within node n at time τ , I n HS is the set of heat sources supplying node n , I n H , in is the set of pipelines flowing into node n , I n H , out is the set of pipelines flowing out from node n , H is the set of all heating nodes, and τ is the time variable.
Dimensions of each term: The dimensions of q i HS ( τ ) and q n HL ( τ ) are W , c w is J / ( kg K ) , m b is kg / s , t b E ( τ ) is K , and the dimension of c w m b t b E ( τ ) is J / ( kg K ) kg / s K = J / s = W . Therefore, the dimensions of both sides of the equation are W and the dimensions are consistent.

2.3. Frequency-Domain Model of Temperature Continuity Equation

i b , k S = t ˙ n , k N , b I n H ,   out   , n H , k = 0 , , K H
where i b , k S is the complex amplitude of the medium temperature at the start of pipeline b outflowing from node n for the frequency component k , t ˙ n , k N is the complex amplitude of the medium temperature within node n for the frequency component k , k is the frequency index, and K H is the total number of frequency components considered.

2.4. Dynamic Frequency-Domain Modeling of Gas Supply Pipelines

Gas supply pipelines act as core carriers for natural gas transmission in integrated energy systems, with their dynamic behaviors influenced by multiple factors, including natural gas compressibility, pipeline friction, and geometric parameters. To accurately characterize such nonlinear dynamics, this section derives the frequency-domain model of gas supply pipelines based on the Fourier transform and hyperbolic function theories, laying a foundation for dynamic coupling analysis in multi-energy systems.
The flow of compressible natural gas in pipelines obeys the laws of momentum conservation and mass conservation, described by the following original partial differential equations (PDEs):
v ( x , t ) t + v ( x , t ) v ( x , t ) x + 1 ρ P ( x , t ) x + f v ( x , t ) | v ( x , t ) | 2 D = 0
ρ ( x , t ) t + ( ρ ( x , t ) v ( x , t ) ) x = 0
where v x , t is flow velocity, P x , t is pressure, ρ ( x , t ) is density, f is the friction factor, and D is pipe diameter.
These governing equations represent a widely adopted simplification of the full compressible Navier–Stokes equations for gas transmission pipelines. The simplification is justified for the low-Mach-number flows characteristic of natural gas networks, where the dominant dynamics for system-level scheduling are captured by the balance between pressure forces, line pack storage (compressibility), and pipeline inertia. Furthermore, the friction factor f is treated under the quasi-steady assumption, which is valid for the slow, diurnal flow variations considered in this day-ahead scheduling study. It is acknowledged that for analyses involving very rapid transients (on the order of seconds), a frequency-dependent friction model would be required for higher accuracy.
To simplify the analysis of these nonlinear PDEs, Fourier transforms are applied to both time t and space x, combined with the small perturbation assumption—i.e., the fluctuation amplitude of gas pressure and flow velocity around the steady-state operating point is less than 10% of the steady-state value ( v c , where c denotes the speed of sound in natural gas).
The validity range of this assumption is limited to the system’s normal operation scenarios, which specifically meet the following two conditions: first, the fluctuation amplitude of natural gas load is ≤12% of the rated load, and this threshold complies with the provisions on the daily load variation range of urban gas networks in CJ/T 447-2014 [] Technical Code for Urban Gas Load Forecasting; second, the fluctuation amplitude of renewable energy (wind power/photovoltaic) output is ≤18% of the predicted value, referring to the short-term prediction accuracy indicators of new energy in GB/T 19963.1-2021 [] Technical Requirements for Short-Term Forecasting of Wind Power.
It should be specifically noted that this assumption is not applicable to extreme scenarios such as sudden interruption of gas supply, large-scale load shedding, or sharp drops in renewable energy output caused by extreme weather like typhoons and cold waves (the fluctuation amplitude is usually >18% in such scenarios), and nonlinear time-domain models need to be adopted for further correction in these cases.
P ^ ( x , j ω ) = F { P ( x , t ) }
Q ^ ( x , j ω ) = F { ρ ( x , t ) v ( x , t ) A }
By eliminating nonlinear terms, ordinary differential equations (ODEs) for pressure P ^   and mass flow rate Q ^   in the frequency domain are derived, enabling subsequent frequency-domain analysis.
The linearized frequency-domain ODE for gas pipelines takes the following general form:
d 2 y d x 2 λ 2 y = 0
where y represents a frequency-domain physical quantity, and λ is complex coefficient involving frequency and pipe parameters.
The general solution to this ODE is y = C e λ x + D e λ x , with C and D as undetermined coefficients constrained by boundary conditions. To intuitively characterize signal attenuation/oscillation behaviors, the following hyperbolic functions are introduced to simplify the solution:
cosh ( z ) = e z + e z 2
sinh ( z ) = e z e z 2
Hyperbolic functions convert the exponential solution into “hyperbolic cosine/sine” forms, explicitly reflecting gas signal propagation along the pipeline. From this hyperbolic-form solution and gas pipeline boundary conditions, the key coefficient C b , k Ω is derived as follows:
C b , k Ω = e u b 2 L b cosh u b 2 + 4 z b , k Ω y b , k Ω 2 L b u b e u b 2 L b u b 2 + 4 z b , k Ω y b , k Ω sinh u b 2 + 4 z b , k Ω y b , k Ω 2 L b
where u b , z b , k Ω , y b , k Ω are intermediate coefficients derived from pipe parameters and frequency; L b is the length of pipeline b ; and cosh ( ) and sinh ( ) are the hyperbolic cosine and sine functions.
u b = γ g sin θ b / c s 2
where u b is a coefficient accounting for the effect of pipeline slope on gas pressure, γ is the specific weight of natural gas, g is the gravitational acceleration (taken as 9.81 m/s2 in this study), θ b is the slope angle of pipeline b , and c s is the speed of sound in natural gas (typically 343 m/s at 25 °C).
z b , k Ω = j k Ω A b + λ b v ¯ b 2 d b A b
where z b , k Ω is a complex coefficient characterizing the interaction between frequency and pipeline friction, j is the imaginary unit ( j 2 = 1 ), Ω is the angular frequency, A b is the cross-sectional area of pipeline b , λ b is the Darcy–Weisbach friction factor of pipeline b , v ¯ b is the average flow velocity of natural gas in pipeline b , and d b is the inner diameter of pipeline b .
y b , k Ω = γ A b j k Ω / c s 2
where y b , k Ω is a complex coefficient linking pipeline geometry to frequency-dependent gas compressibility, and k is the index of frequency components.
Using the idea of Fourier transform, the partial differential equations describing the dynamic characteristics of gas supply pipelines can be transformed into a system of linear complex algebraic equations, as follows:
H ˙ b , k Ω E M ˙ b , k Ω E = C b , k Ω D b , k Ω E b , k Ω F b , k Ω H ˙ b , k Ω s M ˙ b , k Ω S , k = 0 , , K , b B G \ B G , C
where H b , k Ω E is the frequency-domain pressure at the outlet of pipeline b , M b , k Ω E is the frequency-domain mass flow rate at the outlet of pipeline b , H b , k Ω S is the frequency-domain pressure at the inlet of pipeline b , M b , k Ω S is the frequency-domain mass flow rate at the inlet of pipeline b , C b , k Ω , D b , k Ω , E b , k Ω , F b , k Ω   are transfer matrix elements determined by pipeline parameters and angular frequency Ω , K is the total number of frequency components, B G is the set of all gas pipelines in the system, and B G , C is the set of gas pipelines connected to carbon capture units.
The frequency-domain model of gas pipelines, represented by the 2 × 2 transfer matrix in Equation (20), may become ill-conditioned under certain conditions, such as long pipeline lengths or high-frequency components. To ensure numerical stability, we analyze the condition number of the matrix T ( ω ) , defined as κ ( T ) = T T 1 . For the pipeline parameters considered in this study, the condition number remains below 10 3 for frequencies within the practical range of interest ω 10 2 rad / s , which indicate acceptable numerical behavior. To further mitigate potential ill-conditioning, we employ a frequency-domain truncation strategy, retaining only the dominant frequency components that contribute significantly to the system dynamics. This approach not only preserves model accuracy but also enhances computational robustness.
D b , k Ω = 2 z b , k Ω e u b 2 L b u b 2 + 4 z b , k Ω y b , k Ω sinh u b 2 + 4 z b , k Ω y b , k Ω 2 L b
E b , k Ω = 2 y b , k Ω e u b 2 L b u b 2 + 4 z b , k Ω y b , k Ω sinh u b 2 + 4 z b , k Ω y b , k Ω 2 L b
F b , k Ω = e u b 2 L b cosh u b 2 + 4 z b , k Ω y b , k Ω 2 L b + u b e u b 2 L b u b 2 + 4 z b , k Ω y b , k Ω sinh u b 2 + 4 z b , k Ω y b , k Ω 2 L b

3. IES Device Modeling

This section sequentially models the common coupling components of IES mathematically.

3.1. P2G

As a key electric-to-gas conversion technology in integrated energy systems, electric-to-gas (P2G) conversion adopts a two-stage operating mechanism: the electrolysis of water to produce a hydrogen stage and a methane synthesis stage (H2 + CO2 → CH4). This study innovatively combines P2G with lithium battery energy storage systems to form a power–energy dual-dimensional complementary architecture: lithium batteries play a role in short-term energy storage and smooth power fluctuations in the grid, while P2G achieves cross-time-scale energy scheduling through bidirectional conversion between electricity and gas. This architecture not only avoids the bottleneck of lithium batteries’ life cycle being constrained by charging and discharging depth, but also relies on natural gas networks to achieve large-scale energy time-domain transfer and spatial allocation. The operational constraints and energy conversion model are described as follows:
V Cas , t = 3600 η P 2 G P P 2 G , t K Ciss Q PCG , t = α CO η P 2 G P PCG , t P P , t ,   min   P P 2 G , t P P 2 G ,   max   P P 2 G , , ban   P P 2 G , t P P 2 G , t 1 P P 2 G , ,   up   .
where V Gas , t represents the volume of natural gas generated by the power-to-gas (P2G) system at time t , η P 2 G denotes the energy conversion efficiency of the P2G system, P P 2 G , t stands for the electric power input to the P2G system at time t , K Gas refers to the calorific value coefficient of the generated natural gas, Q P 2 G , t indicates the carbon dioxide (CO2) consumption of the P2G system at time t , α CO 2 represents the reaction coefficient for the interaction between CO2 and natural gas in the P2G reaction process, P P 2 G , min , P P 2 G , max are the minimum and maximum limits of the electric power input to the P2G system, and P P 2 G , up , P P 2 G , down represent the upper and lower adjustment bounds for the electric power input of the P2G system.

3.2. CHP Unit

G CHP , t = K Cis V CHP , t P CHP , t = η CHP e G CHP , t H CHP , t = η CHP h G CHP , t P CHP , min P CHP , t P CHP , max P CHP ,   domn   P CHP , t P CHP , t 1 P CHP , up
where G CHP , t is the gas consumption of the CHP unit at time t , K CHP is the calorific value coefficient of gas for the CHP unit, V CHP , t is the steam production of the CHP unit at time t , P CHP , t is the power generation of the CHP unit at time t , H CHP , t is the heat supply of the CHP unit at time t , η CHP G , η CHP H are the power generation and heat supply efficiencies of the CHP unit, P CHP , min , P CHP , max are the minimum and maximum values of the power generation of the CHP unit, and P CHP , up , P CHP , down are the upper and lower adjustment limits of the power generation of the CHP unit.

3.3. Boiler

H CB , t = K Cis η CB h V CB , t H CB , min H CB , t H CB , max H GB , domn H GR , t H GB , t 1 H CB , up
where H GB , t signifies the heat output of the boiler at time t , K GB denotes the calorific value factor of the gas utilized in the boiler, V GB , t represents the gas consumption volume of the boiler at time t , η GB is the thermal efficiency of the boiler during heat supply, H GB , min and H GB , max stand for the lower and upper bounds of the boiler’s heat output, and H GB , up and H GB , down indicate the upper and lower adjustment ranges for the boiler’s heat output.

4. Multi-Agent Game Model

In market-oriented operation scenarios, renewable energy suppliers, carbon capture power plants, and gas-fired thermal power plants are usually independent market entities. In the traditional paradigm involving independent operations, each entity follows a decentralized decision-making mechanism: electricity suppliers sell electricity to the grid at benchmark grid prices, while P2G facilities and carbon capture units purchase electricity at industrial catalog prices to complete gas preparation and carbon capture operations. Based on the policy framework of the National Energy Administration’s “Pilot Program for Market based Trading of Distributed Generation”, the cooperative alliance constructs a new trading mechanism; by establishing a direct purchase model between renewable energy generators and electricity users, power grid enterprises transform into transmission service providers, responsible for coordinating the transmission and distribution of distributed energy and collecting grid fees based on government pricing. In this mode, renewable energy suppliers form a directional power supply relationship with P2G and carbon capture equipment, complete clean energy transactions at agreed electricity prices, and fully bear the grid crossing costs. This mechanism breaks through the traditional barriers of purchasing and selling electricity prices, achieving coordinated optimization of energy and value streams within the alliance.

4.1. Multi-Agent Alliance Rules

Based on cooperative game theory, the collaborative operation mechanism of the integrated energy system relies on the information symmetry assumption as a fundamental premise—this ensures the effective implementation of dual rationality conditions.
Information symmetry assumption: The proposed cooperative game model operates under the premise of information symmetry. This assumes that all alliance members (renewable energy suppliers, carbon capture power plants, and gas-fired thermal power plants) can share the necessary data for day-ahead scheduling, including forecasted energy prices, load demands, and equipment status, via a reliable communication platform without significant delay, concealment, or distortion. This is a standard and reasonable assumption for day-ahead scheduling models, which rely on forecasts and do not require millisecond-level, real-time data exchange. It is applicable in environments with robust communication infrastructure. The model’s performance may degrade in scenarios with severe communication impairments (e.g., delays > 500 ms or packet loss > 3%), which are considered a practical implementation challenge addressed in the research outlook.
The collaborative operation mechanism needs to meet dual rationality conditions; group rationality requires that the total revenue of the alliance must exceed the sum of the independent operating revenue of the members ( v S v   N ), while individual rationality ensures that the revenue of each member is not lower than that of the non-cooperative state ( i ,   x i v   { i } ). The multi-agent alliance constructed by this research institute follows the following differentiated cooperation rules:
(1)
Renewable energy providers: Upon entering the cooperative alliance, they gain bidirectional transaction entitlements. Specifically, they can either sell electrical energy to the power grid at benchmark electricity rates or provide power to carbon capture facilities and P2G systems via direct procurement contracts. The electricity contract price for such direct transactions follows the formula P c o n t a g r e e m e n t   p r i c e =   P T O U   t i m e o f u s e   p r i c e   + T g r i d   w h e e l i n g   c o s t . This move breaks through the single-electricity-sales model and achieves energy cascade utilization.
(2)
Carbon capture power plants: After participating in the alliance, a dual-channel energy supply system is formed; in addition to conventional power grid purchases, green-electricity-driven carbon capture equipment within the alliance can be purchased based on real-time electricity price optimization strategies. The captured CO2 is sold as a commodity to the CCS system, building a value chain of “electricity input, carbon asset output”.
(3)
Gas–thermal power plants: Their membership in the alliance grants them the following flexible energy procurement rights: when meeting the dynamic energy consumption needs of P2G equipment, they can independently choose to purchase electricity from the grid or through agreements within the alliance, and maximize the synergistic benefits of heat and electricity through their monopoly position in the heating network.
Non-cooperative mode constraints: The direct trading of electrical energy is prohibited between independent operating entities, and gas-fired thermal power plants only bear operating costs due to heating monopolies and cannot obtain heating benefits, resulting in the overall inefficient operation of the system. The cooperative alliance quantifies the marginal contributions of its members using the Shapley value method, ensuring fairness and incentive compatibility in the distribution of cooperative surplus.
The Shapley value quantifies each participant’s marginal contribution in a coalition. Its implementation steps in multi-agent games are as follows:
  • Identify All Possible Coalitions: For n participants (set N = { 1 , 2 , , n } ), enumerate all 2 n 1   non-empty subsets (from single-agent to full coalitions).
  • Calculate Coalition Payoffs: For each coalition S N , solve its internal optimization problem (e.g., energy interaction and collaborative scheduling) to obtain total payoff   v S . For singleton sets,   v S is the individual payoff.
  • Compute Marginal Contributions: For agent i N , calculate its marginal contribution to each coalition S i   as v ( S ) v ( S \ { i } ) (where S \ { i } is S without i ).
  • Calculate Shapley Values: The Shapley value ϕ i for agent i is the weighted average of its marginal contributions across all coalitions containing i , with weights reflecting coalition probabilities as follows:
    ϕ i = S N , i S ( s 1 ) ! ( n s ) ! n ! [ v ( S ) v ( S \ { i } ) ]
    where s = S (coalition size) and s 1 ! n s ! / n ! is the weight factor.
The core logic of the Shapley value is to achieve fair and reasonable benefit distribution by quantifying each participant’s marginal contribution across all possible coalitions. However, it should be clarified that exact calculation requires enumerating all 2(n−1) coalitions (where n denotes the number of participants), and the number of coalitions grows exponentially with the number of participants. For systems with ≥8 participants, exact calculation completely lacks engineering feasibility. Therefore, this paper adopts an approximate calculation method based on Monte Carlo sampling, with the specific steps as follows:
Stratified sampling design: Stratify by coalition size, covering all possible coalition size levels from the empty coalition (without the target participant) to the coalition containing all other participants except the target one. Sample sizes are allocated for each stratum according to the proportion of the total number of coalitions of the corresponding size.
Sample size determination: The optimal sample size is determined through error convergence analysis. Taking the exact Shapley values of a small system with a small number of participants as the benchmark, the sample size is gradually increased, and the approximation error is calculated to finalize the total sample size.
Marginal contribution estimation: For each participant, a specified number of coalition samples (that do not include the participant) are randomly selected from each stratum. The change in revenue of each sample coalition after adding the participant is calculated, and the average value of the marginal contributions across all samples is used as the approximate Shapley value of the participant.
e.
Payoff Distribution: Allocate total coalition payoffs based on ϕ i ensuring fairness.
The existence and uniqueness of the Shapley value given by Equation (30) are guaranteed under the following conditions. The Shapley value, as a classic solution in cooperative game theory, guarantees existence and uniqueness under the following conditions []:
Superadditivity of the game: For any two disjoint coalitions S and T, the condition v ( S T ) v ( S ) + v ( T ) holds. The multi-agent alliance constructed in this study achieves energy complementarity and cost savings through collaborative optimization, and its coalition payoff function satisfies superadditivity.
Convexity of the game: If for any coalitions S, T N , or v ( S T ) + v ( S T ) v ( S ) + v ( T ) holds, the game is convex. In this case, the Shapley value not only exists and is unique but also lies within the core, ensuring the stability of the allocation. In our model, the increasing marginal benefits generated through resource sharing and coordinated scheduling among agents cause the coalition payoff function to exhibit characteristics of convexity.
Therefore, within the cooperative game framework established in this paper, the existence and uniqueness of the Shapley value are theoretically guaranteed, providing a solid foundation for the subsequent fair distribution of collaborative surplus based on the Shapley value.
(1)
Renewable energy output constraints are as follows:
P R , t = P w + P pw , t P R , t = P RN , t + P R 2 C , t + P R 2 P , t 0 P w , t W prac , t 0 P pr , t P V pr , t
where P R , t denotes the total generation from renewable energy sources at time t , P w represents wind power generation, P pv , t signifies photovoltaic power generation at time t , P RN , t stands for the generation from conventional renewable energy sources at time t , P R 2 G , t is the renewable energy power allocated to power-to-gas (P2G) at time t , P R 2 L , t refers to the renewable energy power dedicated to energy storage at time t , W pv , t indicates the maximum available photovoltaic power capacity at time t , and P pf , t is the forecasted photovoltaic power generation at time t .
(2)
System operation constraints are as follows:
P Cappurc   , t = P T 2 C , t + P R 2 C , t P PPa , t = P buy , t + P RZ 2 P , t
where P Cappurc   , t denotes the power output of the captive power plant at time t , P T 2 C , t represents the power from the thermal power unit allocated for gas production at time t , P R 2 C , t is the renewable energy power utilized for gas production at time t , P buy , t is the power purchased from the external power grid at time t , and P RZ 2 P , t refers to renewable energy power used for other applications at time t .
(3)
Power balance constraints are as follows:
P T , t + P R , t + P CHP , t + P EES , t d + P buy , t = P Load , t e + P EES , t c + P Captur , t + P P 2 G , t
P TN , t + P RN , t + P CHP , t + P EES , t d = P Lax , t e + P EES , t c
H GB , t + H CHP , t + H EES , t d = H EES , t c + P LLLoad , t h
where P t is the output of conventional generation units at time t , P CHP , t denotes the power generated by the combined heat and power (CHP) unit at time t , P EES , t d represents the discharge power of the energy storage system at time t , P EES , t c signifies the charging power of the energy storage system at time t , P P 2 G , t is the power input to the power-to-gas (P2G) system at time t , H GB , t refers to the heat supplied by the boiler at time t , H CHP , t denotes the heat supplied by the CHP unit at time t , H EES , t d is the heat release power of the thermal energy storage at time t , H EES , t c represents the heat absorption power of the thermal energy storage at time t , and H Load , t is the heat load at time t .

4.2. Multi-Agent Alliance Constraint Conditions

When quantifying the collaborative benefits of multi-agent cooperative alliances and constructing a Pareto optimal objective model for comprehensive energy systems, the core of this is a joint optimization function based on dynamic energy flow balance.
The objective function aims to minimize the comprehensive cost of the multi-agent operation of the integrated energy system. The mathematical expression is as follows:
min t = 1 T C R + C Q + C F + C CS + C Gas + C P 2 G + C Buy + C Net C SE C SC
C R = i = 1 T α w P w , t + α pv P pv , t + α S P EES , t c C Q = β 1 t = 1 T W pre , t P W , t + β 2 t = 1 T P V pr , t P p , t , t C F = t = 1 T P T , t 2 + b P T , t + c C CS = λ CS t = 1 T Q co 2 , t c Q C 2 p t , t C Gas = p Gas t = 1 T V CHP , t + V GB , t V P 2 G ,   o u t ,   t C P 2 G = p CO t = 1 T Q P 2 G , t Q C 2 , t , t + λ PQG t = 1 T P P 2 G , t C Buy = p ce , t t = 1 T P buy , t C Net = t = 1 T α Net P RzC , t 2 + β Net P RzC , t    + t = 1 T α Net P RzP , t 2 + β Nel P RzP , t C SE = p se , t t = 1 T P TN , t + P RNN , t + P CHP , t C SC = γ c Q Co , t , t T Q Co , t , t d
where C R is the renewable energy power generation cost, C Q is the cooling cost, C F is the heating cost, C CS is the energy storage system operation cost, and C Gas is the natural gas purchase cost. The term V P 2 G ,   o u t ,   t represents the internal natural gas produced by the P2G facility; it is subtracted here to offset the external gas purchases, preventing any double-counting of costs. C P 2 G is the power-to-gas (P2G) equipment operation cost, C B buy is the power purchase cost, C Net is the power grid transmission and distribution cost, C SE is the energy efficiency improvement benefit, C SC is the demand-side response benefit, and T is the total time period.

5. Case Analysis

All examples in this section are solved by calling GUROBI through the MATLAB YALMIP platform, with the solution process relying on a specific hardware and software environment. The hardware configuration includes an Intel Core i7-12700H CPU, a 16 GB DDR5-4800 dual-channel RAM, and a 1 TB NVMe PCIe 4.0 solid-state drive (SSD), while the system environment is the Windows 11 Professional operating system. The software tools consist of MATLAB R2022b, YALMIP 20220410, and GUROBI 10.0.1. MATLAB R2022b is used for programming and data visualization; YALMIP 20220410 is applied to construct the mixed-integer linear programming (MILP) model for the optimal scheduling of the integrated energy system (IES); and GUROBI 10.0.1 serves as the core solver for the MILP model.
The constructed model is a MILP problem, containing 1248 variables and 896 constraints. To ensure solution accuracy and computational efficiency, the key parameters of the GUROBI solver are set with reference to Table 1. The convergence of the solver is determined by three criteria: constraint violation < 1 × 10⁻⁶, relative gap of the objective function < 0.1%, and the solver termination status being “GRB_OPTIMAL”. The resulting schedules are also validated against key physical assumptions, such as the small perturbation limit in the gas network, to ensure the consistency between the optimization outcome and the model’s foundational premises.
Table 1. Core parameter settings of GUROBI solver.
The overall architecture of the IES studied in this paper is shown in Figure 1. Centered on ‘multi-energy complementarity, agent collaboration, and low-carbon scheduling’, this architecture includes a power supply module, a heat supply module, and a multi-agent interaction layer. This structure provides a physical basis for the subsequent construction of scheduling models.
Figure 1. Schematic diagram of integrated energy systems.
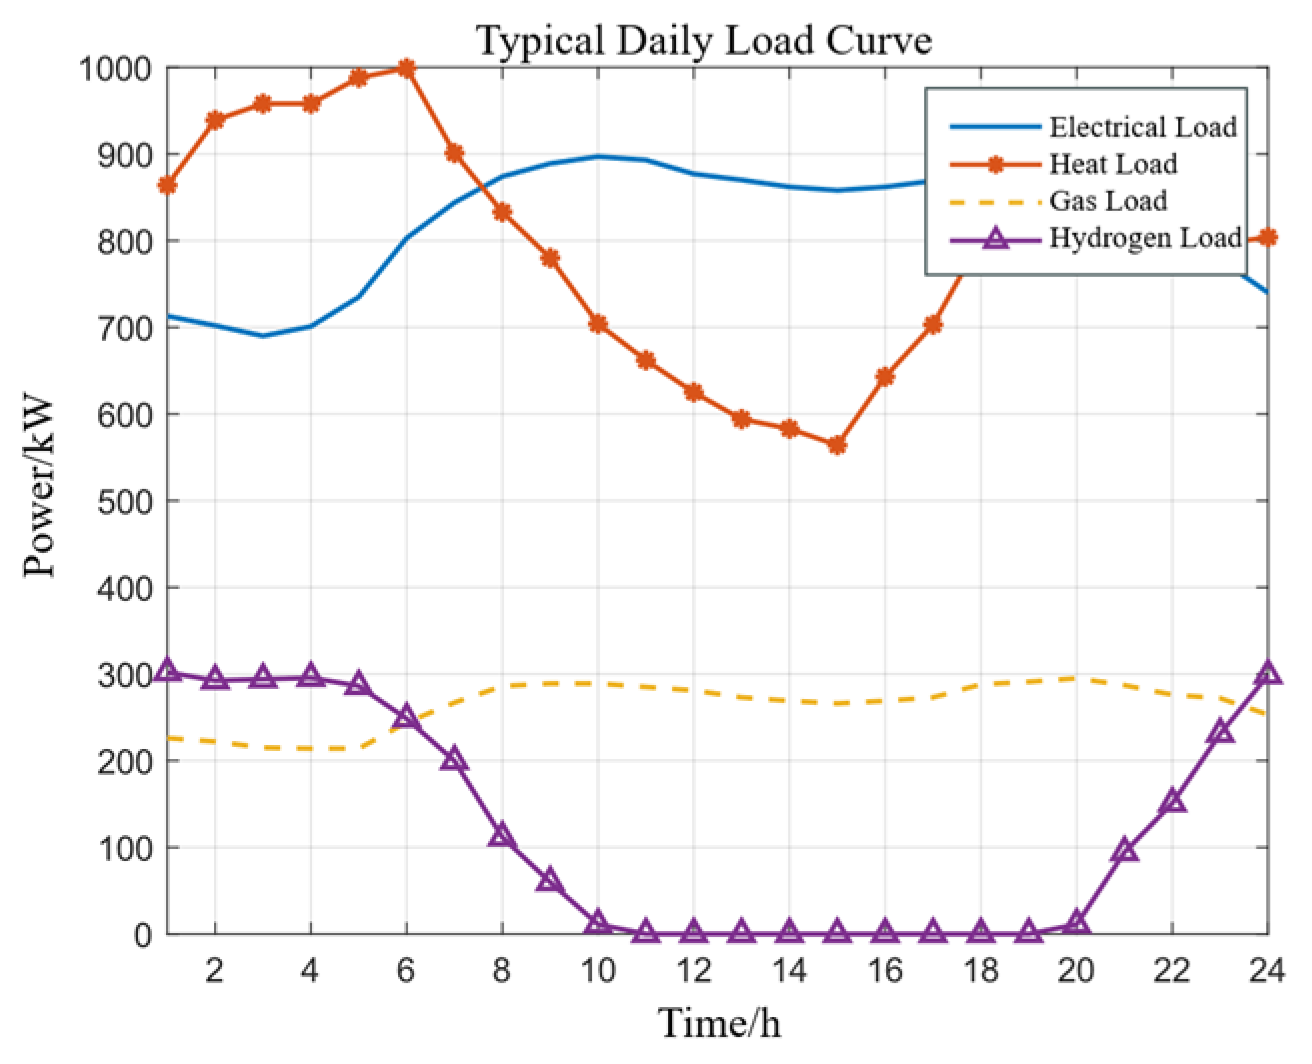
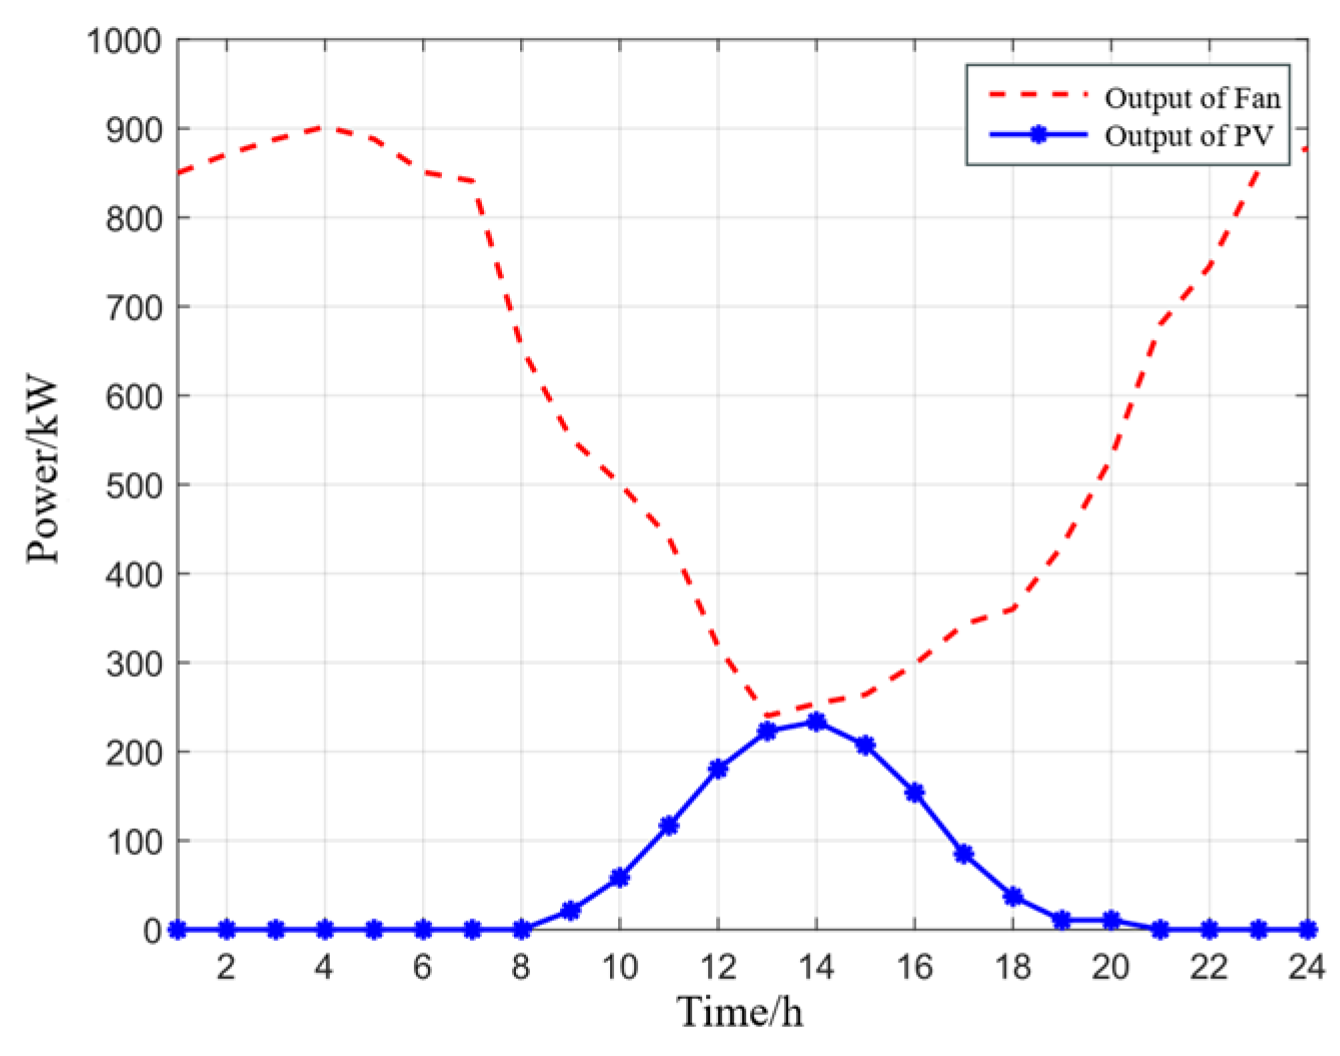
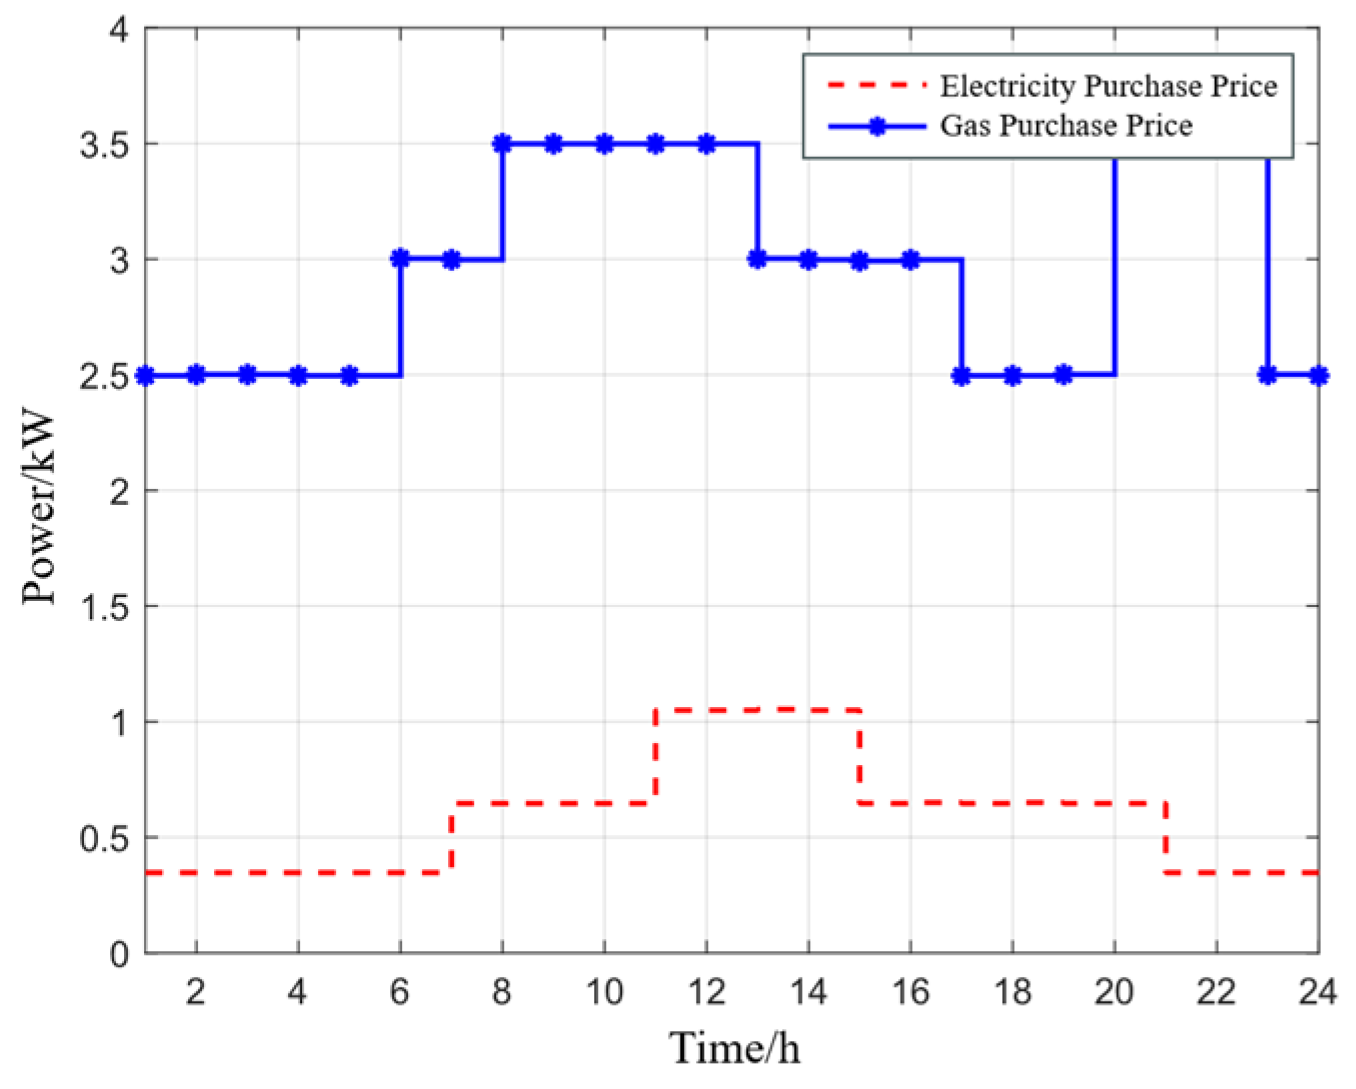
The typical daily load curve of IES is shown in Figure 2, reflecting the time-varying patterns of electricity, heat, and gas loads. The forecast data for wind and solar days is shown in Figure 3. This data is obtained from the short-term forecasting system of the regional new energy dispatching center and is mainly used in scheduling for two purposes: first, it is used to constrain the actual output range of renewable energy; second, to optimize the consumption and allocation of renewable energy. Specifically, this data not only sets the upper limit of the actual output of wind and solar energy based on the predicted values to ensure the feasibility of scheduling, but also guides the coordinated operation of P2G, CHP units, carbon capture equipment, and energy storage in different time periods according to its time characteristics of “high wind power output at night and high photovoltaic output during the day”, so as to realize the efficient consumption of renewable energy and the low-carbon economic scheduling of the system. The time-of-use-based electricity price and on-grid electricity price are shown in Figure 4; this data further shape the economic dispatch strategy of the system by influencing the costs of energy purchase and sale.
Figure 2. Typical daily load curve.
Figure 3. Wind and solar power output.
Figure 4. Purchase price of electricity and gas.

5.1. Scheduling Results

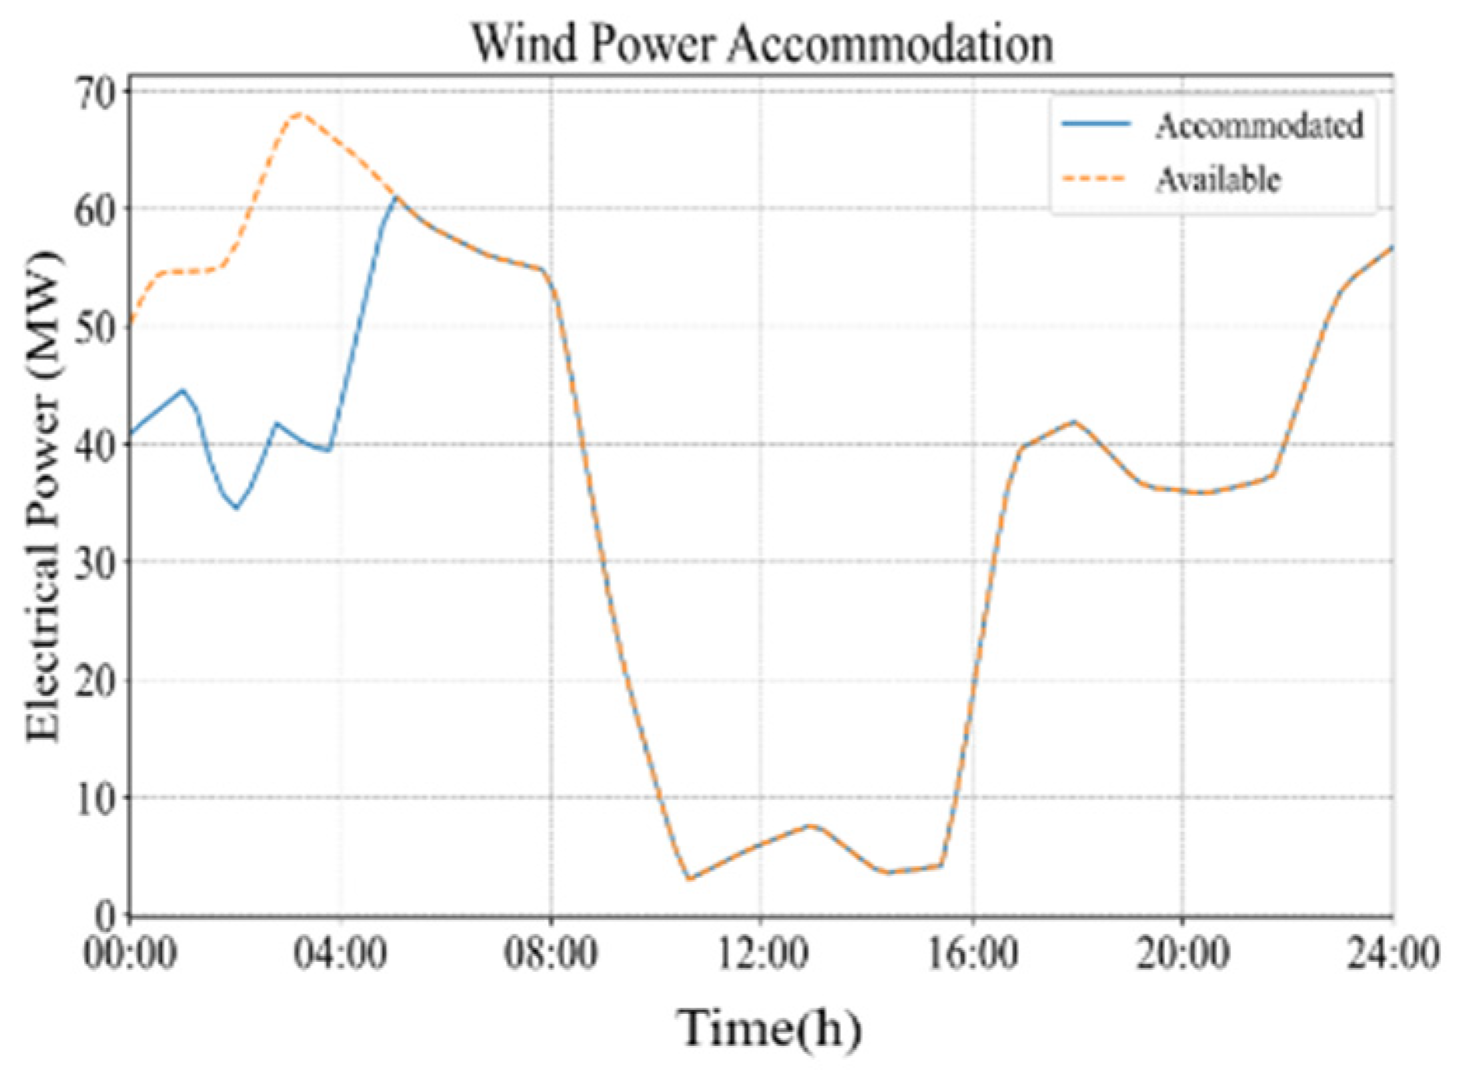
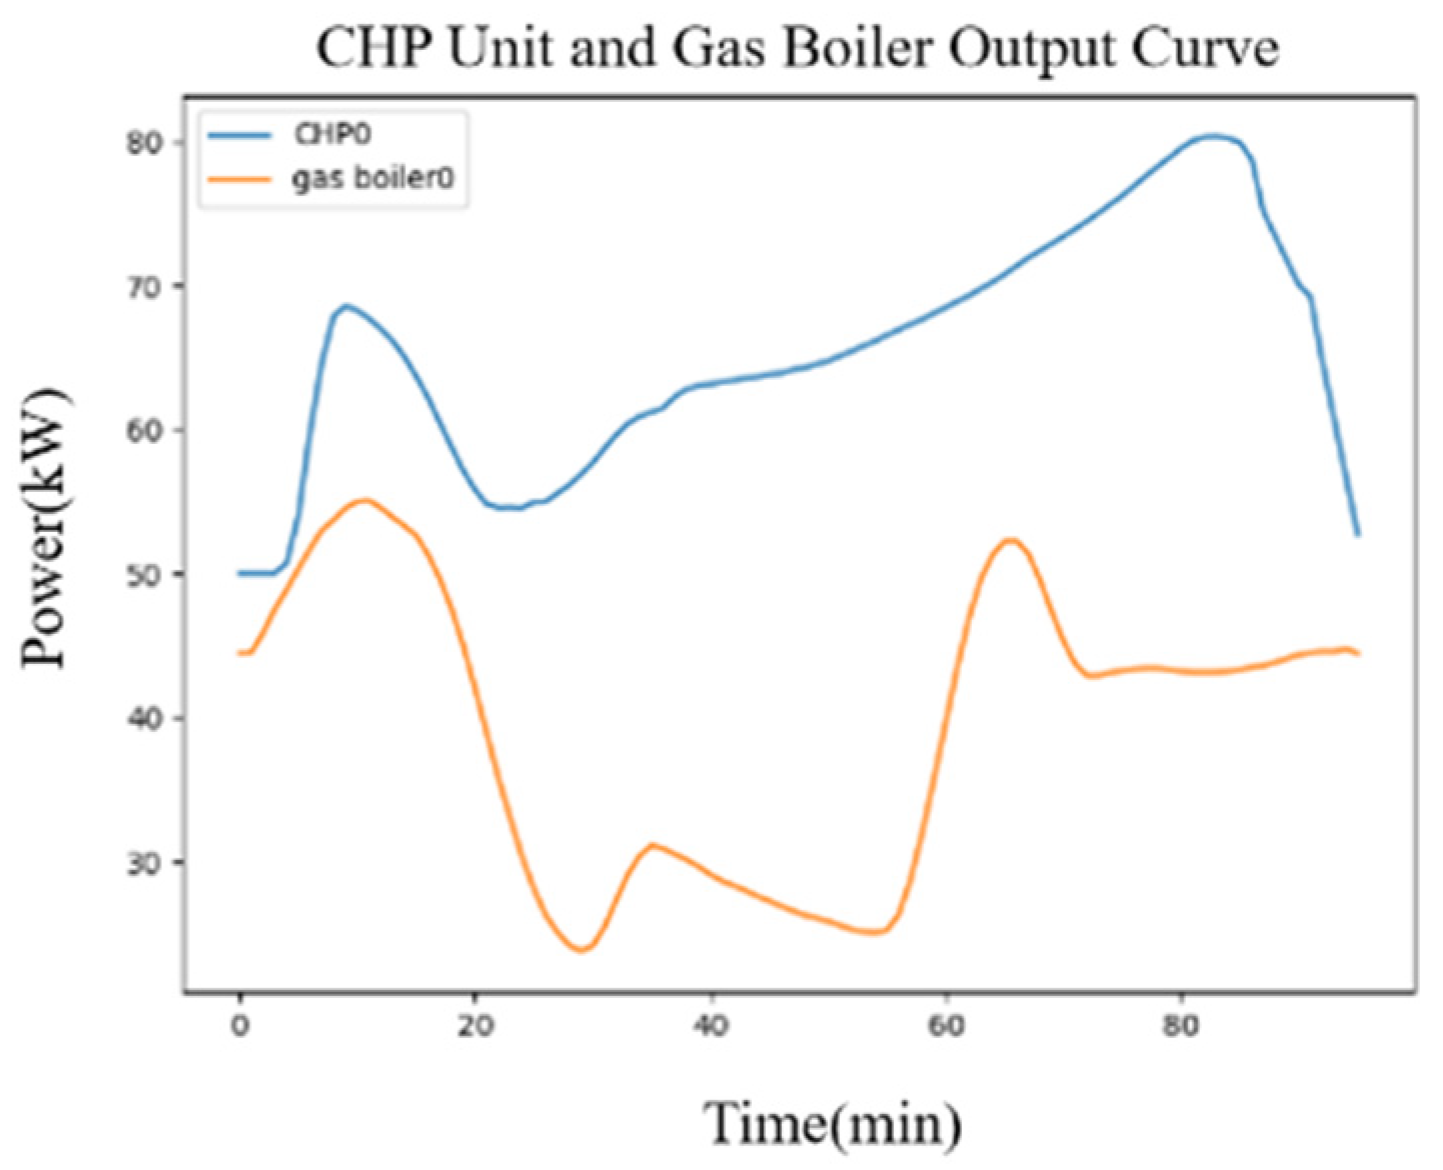
The day-ahead scheduling horizon of the IES is set to 24 h, with a time step of 1 h. This time resolution balances the capture of load/output fluctuations and computational efficiency. The number of frequency components K adopted in the frequency-domain model is 12. Table 2 lists the core operating parameters of the combined heat and power (CHP) units and gas boilers in the case study of this paper. All parameters are based on current national technical standards and matched with the official technical parameters of common equipment in practical Integrated Energy System (IES) projects, with traceable sources and data that meet the rationality requirements for engineering applications. These parameters provide reliable support for the calculation of the curves in Figure 5 (Wind Power Consumption Curve) and Figure 6 (CHP Unit and Gas Boiler Output Curve) of this paper.
Table 2. Key operating parameters of CHP units and gas boilers.
Figure 5. Wind power consumption.
Figure 6. CHP unit and gas boiler output curve.
Based on the comprehensive analysis of Figure 5 and Figure 6, it can be seen that during different time periods, the system achieved effective consumption of wind and photovoltaic power by flexibly adjusting the output of various units and equipment, reducing the cost of wind power curtailment and improving the overall operational efficiency of the system.
In the time frame of 01:00–07:00, wind power generation reaches a high level while the load remains low, and the system may encounter wind curtailment when operating in a non-cooperative alliance mode. However, in the operational state of the cooperative alliance, via flexible regulation of shiftable loads such as carbon capture apparatuses and the support of P2G facilities, the system can efficiently absorb surplus wind power and reduce the wind curtailment cost by 6317 US dollars. The application of P2G equipment allows the system to avoid over-reliance on lithium batteries for accommodating wind and solar energy, thereby boosting the system’s ability to harness wind and solar resources. This not only mitigates the mismatch between renewable energy output and load requirements but also ultimately realizes peak shaving and valley filling.
From 08:00 to 10:00, the system can satisfy the reduced heat load demand entirely through the power output of CHP units. Simultaneously, as the generation of CHP units declines, the power output of carbon capture power plants rises, and the energy consumption of carbon capture devices also increases. Additionally, since their energy consumption is jointly supplied by wind and solar power, CO2 emissions do not increase, thus accomplishing the goal of energy conservation and emission reduction.
From 11:00 to 17:00, electricity demand is considerable, and the output of wind and solar power is prioritized to meet the load requirement. Serving as an adjustable load, the capture capacity of carbon capture devices can be flexibly adjusted according to the output of renewable energy. Meanwhile, because of the low heat load, the output of CHP units is lowered, and the heat they produce is absorbed by thermal energy storage, thus further enhancing the system’s operational efficiency.
During 18:00–24:00, the output of wind and solar power declines, and the system depends on the output of carbon capture power plants and CHP units to meet the electricity load demand. As the load demand decreases, the carbon capture capacity of carbon capture units grows, and most of the wind power output is utilized to meet the energy consumption of carbon capture units. This reduces the system’s CO2 emissions and improves the system’s carbon trading revenue, realizing a win–win situation in terms of both economic and environmental benefits.
In summary, through the cooperative alliance operation mode and flexible scheduling of various equipment, the system not only effectively reduces the cost of wind power curtailment and improves the consumption capacity of renewable energy, but it also meets the load demand while achieving energy conservation, emission reduction, and economic benefits.
The above analysis has verified the physical adaptability of the proposed multi-agent collaborative scheduling scheme in balancing multi-energy supply and demand (e.g., effective wind power curtailment reduction via P2G adjustment, and coordinated output of CHP units and gas boilers) as well as its initial economic value (e.g., a 6317 USD decrease in wind curtailment costs). To further assess the scheme’s reliability in practical operation—where uncertainties (especially deviations in renewable energy output prediction) are unavoidable—this section supplements an analysis of economic benefit robustness under uncertain scenarios.
Considering that renewable energy output prediction deviation is the most prominent uncertainty factor affecting IES scheduling, the “confidence level” herein is defined to reflect the accuracy of such predictions; a 100% confidence level indicates no deviation in renewable energy output prediction, while a 70% confidence level means the prediction deviation reaches 30%. The impact of this uncertainty on the multi-agent alliance’s economic benefits is presented in Table 3.
Table 3. System total revenue under different confidence levels.
The table presents the system’s net operating cost, where a larger value indicates higher operating costs and a smaller value indicates better economic performance. With the decrease in confidence level (i.e., the increase in renewable energy output prediction deviation), the system’s net operating cost first increases and then rebounds slightly when the confidence level drops to 70%. Notably, the overall fluctuation range of the net operating cost is controlled within 1.4%, which demonstrates that the proposed scheduling strategy can still maintain stable economic performance even when facing renewable energy output fluctuations. This result further validates the economic rationality of the multi-agent alliance operation mechanism established in Section 4, providing practical support for the scheme’s application in real-world IES scenarios.

5.2. Carbon Reduction Results

To measure the carbon emission reduction effect, this article defines the carbon emission coefficients as follows: the CHP system has a coefficient of 0.5 kg per kilowatt hour; gas boilers have a coefficient of 0.8 kg per kilowatt hour; purchased gas power has a coefficient of 1.0 kg per kilowatt hour; wind turbines and photovoltaic systems have a carbon emission coefficient of 0 kg; and P2G technology has a coefficient of 0.3 kg per kilowatt hour. All these parameters are derived from authoritative technical documents and engineering practice, thus ensuring their rationality and reliability. These parameters not only provide the basis for generating the results presented in Figure 7 and Figure 8 but also enable the estimation of carbon emissions across different time periods, which can then be compared with those of traditional energy systems to determine specific carbon reduction targets.
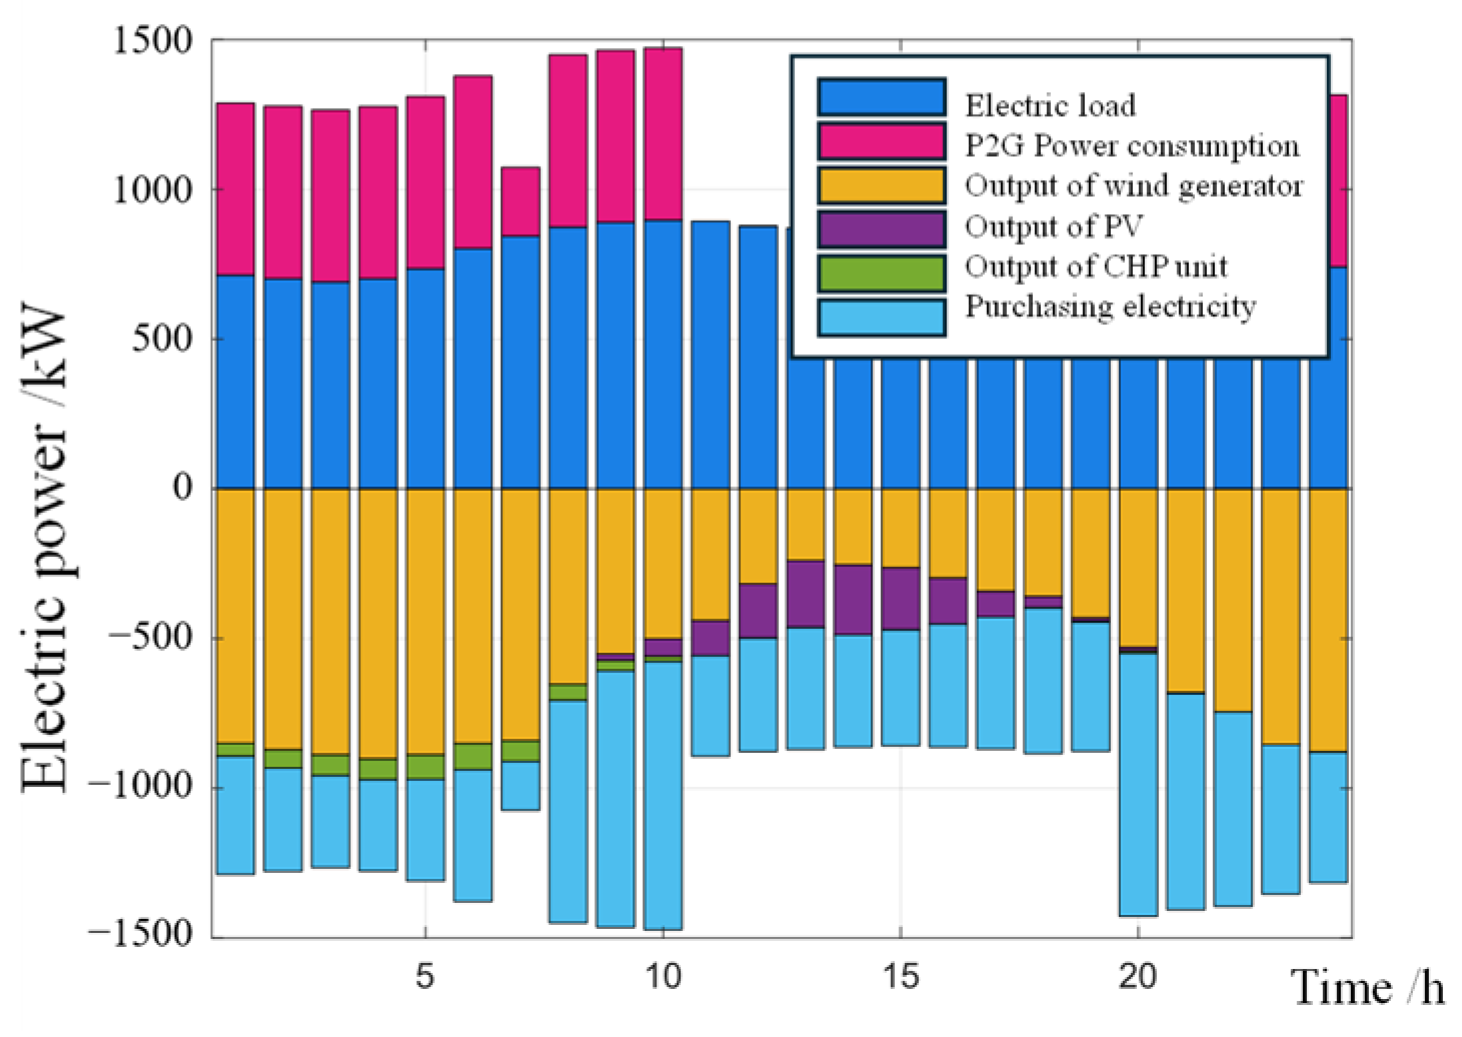
Figure 7. Electric power balance.
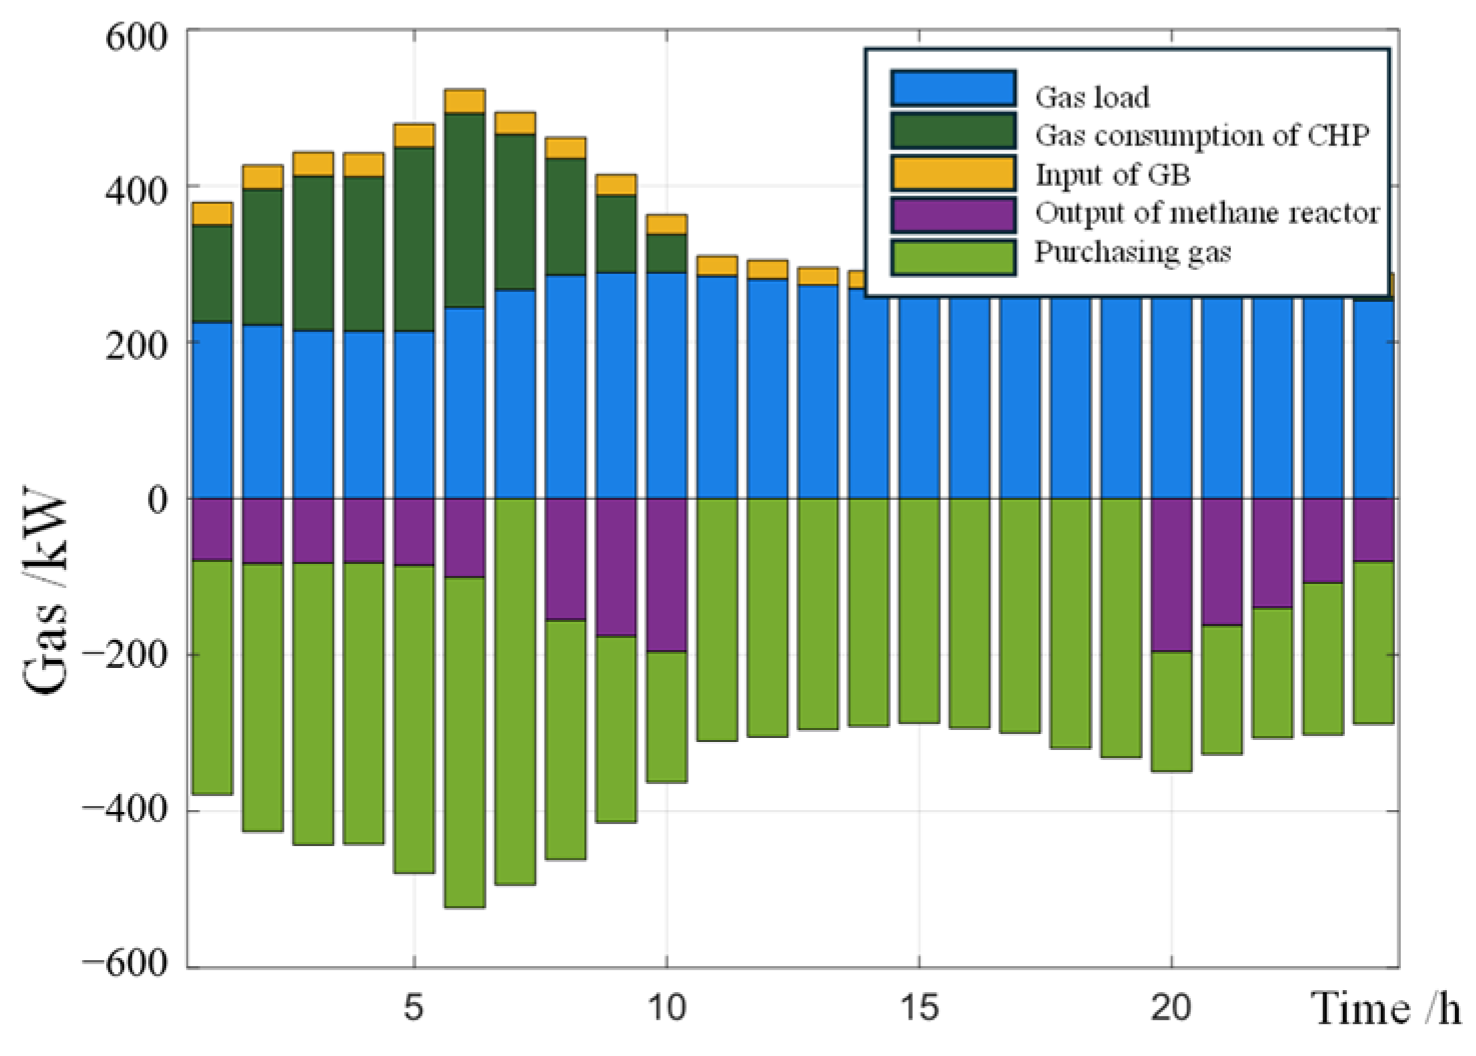
Figure 8. Gas balance.
Through in-depth analysis of Figure 8 (gas load balance chart) and Figure 7 (electricity load balance chart), the following pattern can be observed: the fluctuation amplitude of the gas load in Figure 8 is relatively small within 24 h, basically remaining at around 200 kW. The gas consumption of the CHP (combined heat and power) system and the intake of the gas boiler in Figure 8 remain relatively stable, while the natural gas output from the methane reactor and the purchased gas power in Figure 8 show significant fluctuations over a period of 5 to 10 h. In Figure 7 (electric load balance diagram), the fluctuation amplitude of the electric load is relatively large, especially reaching its peak around 10 h, close to 1500 kW. The output power of the wind turbine and the photovoltaic output in Figure 7 are higher during the daytime, especially the photovoltaic output in Figure 7 reaches its peak between 10 and 15 h. The purchased power in Figure 7 also shows certain fluctuations within 24 h, especially a significant downward trend around 10 h.
The CHP system plays a crucial role in both figures, as the relative stability between its gas consumption and power generation helps to improve energy efficiency and reduce carbon emissions. The increase in wind turbine and photovoltaic output, especially during the daytime, indicates that the use of renewable energy has played a positive role in reducing carbon emissions. Although the changes in P2G (power-to-gas) technology are not significant, the increase in electricity consumption during certain periods can help to balance the grid load and further optimize energy efficiency.
To ensure the validity of the frequency-domain linearization for the gas network, the optimized scheduling results were explicitly checked against the small perturbation assumption (i.e., pressure and mass flow rate fluctuations ≤ 10% of their steady-state values). The analysis confirmed that across all time periods and all pipeline segments, the maximum observed pressure fluctuation was 8.7% and the maximum mass flow rate fluctuation was 9.2%, which are both within the 10% threshold. This verification guarantees that the linearized model accurately represents the system dynamics under the obtained optimal schedule, and that the optimization process did not violate the underlying physical modeling assumption.
To further verify the robustness of the carbon reduction conclusion, a supplementary sensitivity analysis was conducted. A ±10% fluctuation range was selected for each device’s emission coefficient, and the system’s carbon emissions and emission reduction rate under different scenarios were calculated.
(1)
Scenario Design for Sensitivity Analysis
Emission coefficient settings for each scenario are as follows:
Baseline Scenario: CHP (0.5 kg/kWh), gas-fired boiler (0.8 kg/kWh), purchased gas-fired power (1.0 kg/kWh), and P2G (0.3 kg/kWh).
Scenario 1 (−10% fluctuation): CHP (0.45 kg/kWh), gas-fired boiler (0.72 kg/kWh), purchased gas-fired power (0.9 kg/kWh), and P2G (0.27 kg/kWh).
Scenario 2 (+10% fluctuation): CHP (0.55 kg/kWh), gas-fired boiler (0.88 kg/kWh), purchased gas-fired power (1.1 kg/kWh), and P2G (0.33 kg/kWh).
(2)
Results of Sensitivity Analysis
Carbon Emissions Variation: In the baseline scenario, the system’s 24 h carbon emissions are 12,860 kg. In Scenario 1 (10% reduction in coefficients), these carbon emissions decrease to 11,574 kg (a 9.99% reduction vs. baseline). In Scenario 2 (10% increase in coefficients), carbon emissions increase to 14,146 kg (a 9.99% increase vs. baseline).
Stability of Emission Reduction Rate: Compared with the traditional scheduling strategy (carbon emissions: 18,371 kg), the emission reduction rate in the baseline scenario is 30.00%. In Scenario 1, the rate is 37.00%, and in Scenario 2, it is 23.00%. All rates remain above 20%, with a fluctuation range of less than 20%, indicating the proposed scheduling strategy still achieves significant and stable carbon reduction even when emission coefficients fluctuate within a reasonable range.
Key Influencing Factors: Analysis of variance (ANOVA) shows the emission coefficient of purchased gas-fired power generation has the greatest impact on system carbon emissions (contribution rate: 42.3%), followed by the CHP system (31.5%), gas-fired boiler (18.2%), and P2G technology (8.0%). This further verifies the rationality of the scheduling logic in prioritizing renewable energy in order to replace purchased gas-fired power generation.
Furthermore, the sensitivity analysis conducted in this section, which varies carbon emission coefficients by ±10%, conceptually aligns with addressing parameter uncertainties. It demonstrates that the proposed scheduling strategy maintains its economic and carbon reduction benefits even under reasonable parameter fluctuations, thereby enhancing the practical reliability of our findings.
Based on the above analysis, carbon emissions can be substantially reduced by properly scheduling the CHP system, boosting the utilization rate of renewable energy, and refining the application of P2G technology. Specifically, the stable operation of CHP systems improves energy utilization efficiency and reduces dependence on fossil fuels; the substantial output from wind turbines and photovoltaics lessens the demand for traditional energy sources, and P2G technology acts as an auxiliary tool to balance the power grid’s load, thereby further enhancing the overall performance of the energy system.
Preliminary analysis results show that this scheduling strategy exerts remarkable effects in terms of reducing carbon emissions, providing robust support for achieving the sustainable development of the energy system.

5.3. Error Quantification of Frequency-Domain Model Under Out-of-Range Perturbation Scenarios

To address the applicability limitation of the small perturbation assumption, this section supplements systematic error quantification by comparing the proposed frequency-domain model with a nonlinear time-domain model. Three representative out-of-range perturbation scenarios are designed, covering common large-deviation cases in practical systems, and key performance indicators such as pipeline outlet temperature, node pressure, and system carbon emissions are selected for error analysis.

5.3.1. Scenario Design

This paper presents three out-of-range scenarios: Scenario 1 represents typical moderate prediction errors, Scenario 2 involves severe prediction errors or minor equipment faults, and Scenario 3 covers extreme deviation conditions. The out-of-range scene parameter settings are as follows (Table 4):
Table 4. Out-of-range scene parameter settings.
The nonlinear time-domain model uses the same pipeline parameters (DN300 insulated pipe and gas pipeline length 10 km) and boundary conditions as the frequency-domain model, ensuring its comparability. The finite difference model’s time step is set to 10 s, its spatial step to 500 m, and its convergence criterion to 1 × 10⁻⁶, guaranteeing its accuracy as a benchmark.

5.3.2. Error Quantification Results

The error is defined. The statistical results of the average error and maximum error across 24 h are shown in Table 5.
Table 5. Error comparison of key indicators under different scenarios.
The error characteristics of out-of-range scenes can be obtained from Table 5. With the increase in perturbation amplitude, the linearization error gradually expands. For moderate deviations, the average error of temperature/pressure remains below 6%, and carbon emissions error below 4%; this level of error is acceptable for engineering applications. For severe deviations, the maximum error exceeds 9% but is still controllable for preliminary scheduling, with subsequent real-time correction feasible to reduce deviations. For extreme deviations, the error exceeds 10%, indicating the frequency-domain model alone is insufficient, and the hybrid time–frequency-domain framework is necessary.

5.4. Numerical Comparison with Benchmark Methods

To verify the superiority of the frequency-domain modeling and multi-agent game optimization strategy proposed in this paper, traditional steady-state modeling methods (MILP model) and time-domain dynamic modeling methods were selected for comparison with the proposed method, as shown in Table 6.
Table 6. Numerical comparison with baseline method.
The comparison results show that in terms of computational efficiency, the computational time of the proposed method is only 9.2% of the traditional steady-state modeling method and 2.1% of the time-domain dynamic modeling method, significantly meeting the high-efficiency computing requirements of day-ahead scheduling, which benefits from the simplification advantage of the frequency-domain model in terms of converting partial differential equations into linear algebraic equations. In terms of modeling accuracy, the dynamic errors of the heating/gas network of the proposed method are lower than those of the two types of benchmark methods, verifying the accurate characterization ability of frequency-domain modeling for dynamic constraints, which is superior to the steady-state model that ignores dynamic characteristics and the conventional time-domain method with high computational complexity. In terms of economic and environmental benefits, the total operating cost of the proposed method is reduced by 12.7% compared with the traditional steady-state modeling method, the wind power accommodation rate is increased by 10.4%, and the carbon emission reduction rate is increased by 140.0%. This is because the frequency-domain model taps the potential of multi-energy dynamic complementarity, and the multi-agent game mechanism realizes benefit balance and collaborative optimization, an advantage that cannot be achieved by existing benchmark methods.

5.5. Frequency Component Truncation Validation

To verify that the truncated frequency components K can sufficiently capture the transient characteristics of the studied gas pipelines, a numerical validation experiment is conducted, based on the actual pipeline parameters in this study (DN300 insulated steel pipe, length L = 5–20 km, slope angle θ = ±3°, and Darcy–Weisbach friction factor f = 0.012–0.020).
The validation process adopts the following steps: (1) establish a full-frequency reference model (considering all frequency components within 0–5 Hz) to obtain the benchmark transient responses (pressure and mass flow rate) of the pipeline; (2) test the transient response accuracy under different K values (5, 8, 10, 12, and 15) by comparing with the benchmark; and (3) use mean absolute error (MAE) and maximum relative error (MRE) to quantify the deviation, with the engineering accuracy requirement set as MRE ≤ 1%.
The validation results are shown in Table 7. It can be seen that when K = 12, the MRE of pressure transient response is 0.78% and the MAE is 0.35%, while the MRE of the mass flow rate transient response is 0.91% and the MAE is 0.42%, which all meet the engineering accuracy requirement. When K continues to increase to 15, the MRE of the pressure and mass flow rate only decreases by 0.09% and 0.11%, respectively, but the computational time increases by 37%. Therefore, this study selects K = 12 as the number of truncated frequency components, which balances transient capture accuracy and computational efficiency.
Table 7. Transient response accuracy under different K values.

6. Conclusions

6.1. Core Research Innovations

The developed comprehensive energy system model streamlines the frequency-domain models of the heating and gas networks, thereby reducing the system’s complexity. Based on cooperative game theory, it effectively integrates equipment such as power-to-gas conversion, carbon capture, gas turbines, and thermal energy storage systems. Through the coordinated operation of carbon capture and P2G, the system’s wind power consumption capacity has been significantly improved, the cost of wind power curtailment has been reduced, peak shaving and valley filling have been achieved, and energy utilization efficiency has been optimized.
Based on the Shapley value model, the distribution of total profits in the alliance shows that, compared to the independent operation of each comprehensive energy entity, the overall profitability of the system is significantly improved after forming a cooperative alliance. When the RCG alliance is formed, the alliance’s revenue is significantly improved compared to that in independent operation. Through a reasonable profit distribution mechanism, it further stimulates the cooperation enthusiasm of each member and verifies the value of the establishment of a cooperative alliance.
After the carbon capture power plant and P2G entered a collaborative operation mode through a cooperative alliance, the carbon emissions and carbon trading costs of the system were significantly reduced. Compared with carbon capture power plants or P2G independent operation modes, the cooperative mode shows more significant effects in terms of reducing carbon emissions while improving the system’s economy and environmental friendliness, achieving a win–win situation regarding economic and environmental benefits.
To conclude, the study’s core innovations are as follows: First, in physical modeling, it abandons traditional steady-state models and finite difference methods for IES, pioneering a frequency-domain approach for heat and gas networks—this converts dynamic transmission-related partial differential equations into linear complex algebraic equations, balancing modeling accuracy (retaining heat–gas network dynamic constraints) and computational efficiency (reducing solution complexity). Second, in terms of the operational mechanism, it innovatively integrates cooperative game theory with low-carbon IES operation, builds an RCG multi-agent alliance, and uses the Shapley value method to quantify each agent’s marginal contribution, realizing fair surplus distribution and breaking interest barriers between independent entities. Third, in terms of low-carbon synergy, it proposes deep collaboration between carbon capture and P2G, coupled with renewable energy consumption—this leverages P2G to improve wind power accommodation and carbon capture to cut emission costs—achieving integrated optimization of energy efficiency, carbon reduction, and economic benefits.

6.2. Research Limitations

Although this study has made certain progress in the field of low-carbon scheduling of IES, there are still three limitations that need to be further improved.
First, the frequency-domain modeling adopts the assumption of small perturbations near the steady state. This assumption is only applicable to scenarios where system parameters (such as load and renewable energy output) fluctuate slightly. When facing large-scale load mutations or severe fluctuations in renewable energy output caused by extreme weather, the linearized model cannot accurately characterize the nonlinear dynamic characteristics of the system, which may lead to an increase in the deviation between the scheduling scheme and the actual physical process.
Furthermore, the proposed frequency-domain modeling approach introduces certain simplifications for both the heating and gas networks. For instance, the heating pipeline model employs a one-dimensional axial heat transfer assumption, the approximate validity of which for the studied pipe parameters has been supported by a supplementary Biot number analysis. However, for pipes with poor insulation or atypical dimensions, or for scenarios requiring precise capture of transients involving significant radial temperature gradients (e.g., during system start-up), this 1D model might introduce deviations.
Second, while the day-ahead scheduling model assumes information symmetry, its practical real-time execution relies on communication fidelity. The study primarily focuses on the day-ahead scheduling strategy under ideal information conditions. The impact of real-world communication impairments (e.g., delays or packet loss during the execution of scheduling instructions) on the alliance’s collaborative performance is not modeled. Such issues could cause deviations between the scheduled plan and its real-time implementation, potentially damaging the collaborative benefits and introducing operational risks.
Third, the processing of the output of renewable energy such as wind power and photovoltaics adopts deterministic prediction data, which does not fully incorporate their inherent randomness and volatility and lacks a robust scheduling mechanism to deal with uncertainty. Under extreme meteorological conditions, the adaptability and reliability of the scheduling strategy are insufficient.

6.3. Outlook for Future Work

To address the above limitations, future research will be carried out in the following three aspects:
To break through the limitation of the small perturbation assumption on large-scale change scenarios, a fusion framework of nonlinear frequency-domain analysis and time–frequency-domain hybrid modeling will be constructed. On the one hand, the Volterra series expansion method is introduced to decompose the nonlinear dynamic characteristics of heating–gas networks into multi-order harmonic components. The nonlinear characterization under large-scale changes is realized through the superposition of multi-order frequency-domain responses. At the same time, the order truncation is adopted to balance the computational accuracy and efficiency, avoiding excessive increase in model complexity. On the other hand, a time–frequency-domain dynamic switching mechanism is designed: the frequency-domain model is used to ensure computational efficiency when the system operates stably; when the fluctuation amplitude of load or renewable energy output exceeds the preset threshold, the switch to the time-domain nonlinear model (such as finite element method and implicit difference method) is automatically triggered. Through the interaction and correction of time–frequency-domain data, the accurate characterization of the system’s dynamic characteristics under large-scale changes is ensured. In the follow-up, the effectiveness of the framework will be verified and the model switching threshold will be optimized based on the simulation data of extreme scenarios (such as sudden increase in heating load caused by cold waves or sudden drop in wind power output caused by typhoons).
To bridge the gap between the ideal information assumption of the day-ahead model and the challenges of real-time operation under communication constraints, a three-layer guarantee system focusing on communication reliability will be constructed. This system will integrate redundant topology, delay compensation, and distributed decision-making. First, in the design of the multi-agent communication network, active-standby dual-link redundancy is introduced; the active link adopts optical fiber communication, and the standby link adopts a wireless private network. Using the real-time monitoring of communication indicators (such as packet loss rate and delay time), when the delay of the active link exceeds the set value or the active link fails, the switch to the standby link is automatically triggered to ensure the continuity of data transmission. Second, for tolerable delays, the idea of Model Predictive Control (MPC) is introduced. A prediction model is established, based on historical communication delay data, to generate the compensatory amount of scheduling instructions in advance, offsetting the impact of delay on the scheduling effect. Finally, the optimization of the distributed multi-agent decision-making mechanism is promoted to reduce the dependence on the central node. The distributed gradient descent consensus algorithm is adopted to enable each agent to make independent decisions based on local operation data and local interaction information with neighboring agents, realizing global convergence through local collaboration, and reducing the impact of a single communication failure on alliance collaboration.
To quantify and tackle the uncertainty associated with renewable energy, a combined model integrating scenario generation, two-stage stochastic programming, and risk measurement will be built. The initial step involves generating numerous renewable energy output scenarios via a Monte Carlo simulation, which relies on historical output data and meteorological forecast information, and then compressing them into representative scenarios with the L2 distance clustering approach, guaranteeing the coverage of uncertainty whilst lowering computational complexity. The second step is to set up a two-stage stochastic programming model: the first phase (day-ahead scheduling) ascertains inflexible decision variables like the on–off status of combined heat and power (CHP) units and the base power of power-to-gas (P2G) prior to the realization of uncertainty; the second phase (real-time scheduling) modifies flexible variables, including energy storage charging and discharging power as well as carbon capture load, to handle deviations once the actual value of renewable energy output is obtained. The objective function is formulated to minimize the overall expected cost of the two stages, encompassing day-ahead scheduling cost and real-time adjustment cost. The third step is to incorporate Conditional Value at Risk (CVaR) to quantify the risk cost of highly unfavorable scenarios. Through establishing the CVaR constraint with a confidence level, the system’s economy and the robustness in dealing with uncertainty are balanced, preventing operational instability in extreme scenarios and offering support for the reliable operation of integrated energy systems (IES) in the context of high-proportion renewable energy integration.

Author Contributions

Conceptualization, Y.C. and Z.W.; methodology, Y.C. and Z.W.; validation, Y.C. and Z.Z.; formal analysis, Z.W.; investigation, X.L. and Y.L.; data curation, Y.L.; writing—original draft, Y.C.; writing—review and editing, Y.C.; visualization, Y.L. and S.Z.; supervision, Z.W. and Z.Z.; project administration, X.L.; and resources, S.Z. All authors have read and agreed to the published version of the manuscript.

Funding

This research was funded by the National Key Research and Development Program grant number (2022YFB2702805).

Data Availability Statement

The original contributions presented in this study are included in the article. Further inquiries can be directed to the corresponding author.

Acknowledgments

The authors thank the Editors and the anonymous reviewers for their constructive feedback.

Conflicts of Interest

Authors Yingxian Chang, Xin Liu, and Zhiqiang Wang were employed by the State Grid Shandong Electric Power Company. Zhiqiang Wang was employed by the State Grid Dezhou Power Supply Company. The remaining authors declare that the research was conducted in the absence of any commercial or financial relationships that could be construed as a potential conflict of interest.

References

  1. U.S. Energy Information Administration. Annual Energy Outlook 2020 with Projections to 2050; U.S. Energy Information Administration: Washington, DC, USA, 2024; pp. 19–35.
  2. Zheng, L.; Zhou, X.; Zheng, L.; Yang, L. Day-ahead optimal dispatch of an integrated energy system considering multiple uncertainty. Power Syst. Technol. 2020, 44, 2466–2473. [Google Scholar]
  3. Wang, Y.; Su, J.; Xue, Y.; Chang, X.; Li, Z.; Sun, H. Toward on rolling optimal dispatch strategy considering alert mechanism for antarctic electricity-hydrogen-heat integrated energy system. IEEE Trans. Sustain. Energy 2024, 15, 2457–2471. [Google Scholar] [CrossRef]
  4. Dong, L. Day-Ahead Optimal Operation Research on Hybrid CCHP System. Ph.D. Thesis, Shandong University, Jinan, China, 2019. [Google Scholar]
  5. Deng, B.; Fang, J.; Hui, Q.; Zhang, T.; Chen, Z.; Teng, Y.; Xi, X. Optimal scheduling for combined district heating and power systems using subsidy strategies. CSEE J. Power Energy Syst. 2019, 5, 399–408. [Google Scholar] [CrossRef]
  6. Wang, K.; Xue, Y.; Zhou, Y.; Li, Z.; Chang, X.; Sun, H. Distributed coordinated reconfiguration with soft open points for resilience-oriented restoration in integrated electric and heating systems. Appl. Energy 2024, 365, 123207. [Google Scholar] [CrossRef]
  7. Lin, C.; Wu, W.; Zhang, B.; Sun, Y. Decentralized solution for combined heat and power dispatch through benders decomposition. IEEE Trans. Sustain. Energy 2017, 8, 1361–1372. [Google Scholar] [CrossRef]
  8. Zou, Y.; Yang, L.; Li, J.; Xiao, L.; Ye, H.; Lin, Z. Robust optimal dispatch of micro-energy grid with multi-energy complementation of cooling heating power and natural gas. Autom. Electr. Power Syst. 2019, 43, 65–72. [Google Scholar]
  9. Fang, J.; Zeng, Q.; Ai, X.; Chen, Z.; Wen, J. Dynamic optimal energy flow in the integrated natural gas and electrical power systems. IEEE Trans. Sustain. Energy 2018, 9, 188–198. [Google Scholar] [CrossRef]
  10. Gan, W.; Yan, M.; Yao, W.; Guo, J.; Ai, X.; Fang, J.; Wen, J. Decentralized computation method for robust operation of multi-area joint regional-district integrated energy systems with uncertain wind power. Appl. Energy 2021, 298, 117280. [Google Scholar] [CrossRef]
  11. Tang, J.; Liu, J.; Sun, T.; Kang, H.; Hao, X. Multi-time-scale optimal scheduling of integrated energy system considering demand response. IEEE Access 2023, 11, 135891–135904. [Google Scholar] [CrossRef]
  12. Yang, M.; Cui, Y.; Huang, D.; Su, X.; Wu, G. Multi-time-scale coordinated optimal scheduling of integrated energy system considering frequency out-of-limit interval. Int. J. Electr. Power Energy Syst. 2022, 141, 108268. [Google Scholar] [CrossRef]
  13. Guo, Z.; Zhang, R.; Wang, L.; Zeng, S.; Li, Y. Optimal operation of regional integrated energy system considering demand response. Appl. Therm. Eng. 2021, 191, 116860. [Google Scholar] [CrossRef]
  14. CJ/T 447-2014; Automatic Shut-Off Valve for Pipeline Gas. Ministry of Housing and Urban-Rural Development of the People’s Republic of China: Beijing, China, 2014.
  15. GB/T 19963.1-2021; Technical Specifications for the Connection of Wind Farms to the Electricity System Part 1: Onshore Wind Farms. China Standards Press: Beijing, China, 2021.
  16. Ye, Y.F.; Li, D.F. Joint replenishment model with fuzzy demand and cost allocation approach based on egalitarian Shapley value. Syst. Eng. Theory Pract. 2024, 44, 1229–1245. [Google Scholar]
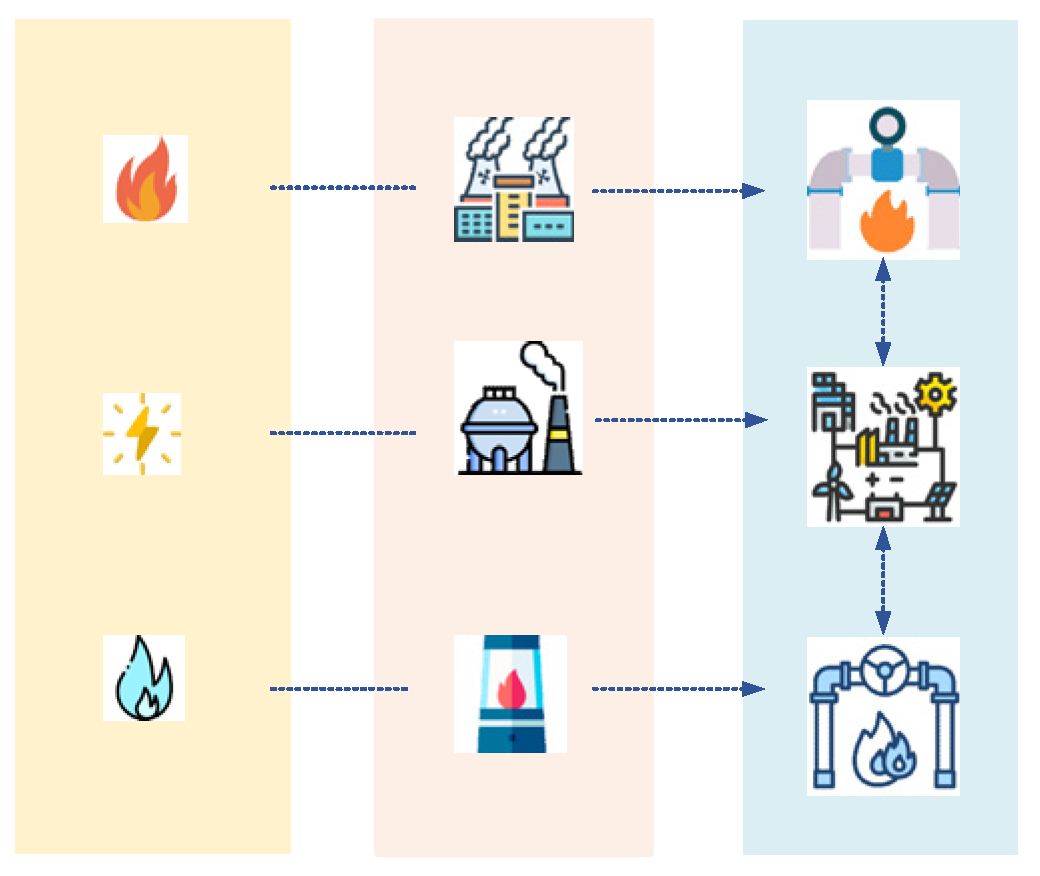
Disclaimer/Publisher’s Note: The statements, opinions and data contained in all publications are solely those of the individual author(s) and contributor(s) and not of MDPI and/or the editor(s). MDPI and/or the editor(s) disclaim responsibility for any injury to people or property resulting from any ideas, methods, instructions or products referred to in the content.

Article Metrics

Citations

Article Access Statistics

Multiple requests from the same IP address are counted as one view.