Abstract
The basic requirement for ship voyage planning is to determine a safe route while meeting certain safety and economic criteria. ECDIS are a commonly used tool for this purpose. Route planning is normally accomplished by setting route cross track limit-XTE. The XTE value can be adjusted on individual sections of the planned route. As a complementary criterion, the own ship domain is proposed, understood as the area around the ship which is to remain free of other objects. The concept of a hydrographic object domain, analogous to the vessel domain, is proposed. The proposed domain complements existing safety criteria, particularly the criterion of a safe passing distance, and can also be used to define the safe cross-track error (XTE) limit. Different types of these objects are considered, and their classification is proposed. A methodology for determining such domains is presented, consisting of a vessel track analysis method (based on AIS data) and specific methods for determining domains for different types of hydrographic objects. Based on actual recorded Automatic Identification System (AIS) data for conventional ships, domains of fixed objects and navigational hazards have been determined. The domains of hydrographic objects may be applied to the delineation of ‘NoGo areas’ around them in nautical charts.
1. Introduction
Planning the voyage of a sea-going vessel is one of the key stages in the transport process. Planning must take into account, among other factors, the characteristics of the navigational water area, basic safety parameters, the vessel’s maneuverability, as well as physical and contractual constraints. It also requires determining the passing distances from fixed objects and navigational hazards.
In the case of ECDIS, which are commonly used for planning and conducting navigation, it is necessary—beyond simply drawing and connecting route legs—to first determine the basic safety parameters for the entire route, differentiating them by section according to the characteristics of the basin.
The basic safety parameters include, among others:
- safety contour;
- safety depth;
- cross-track limits (port/starboard);
- types of objects identified during the “check route planning” and route monitoring procedures.
The obligation to plan and approve the voyage in advance arises from the SOLAS Convention [1] as well as from the shipowner’s Safety Management System (SMS) procedures implemented under the ISM Code.
This task is highly complex, as it requires collecting and analyzing a large volume of data before plotting the route (nowadays, predominantly in Electronic Chart Display and Information Systems (ECDIS) or other electronic chart systems). However, even the most advanced navigation systems still require considerable experience—both during the plotting process and in monitoring and adjusting the route to ensure compliance with the established safety parameters.
The ECDIS system is used for route planning. In general, AIS data are employed during voyages for route monitoring and hazard avoidance. These data are displayed on AIS receivers or ECDIS screens. Traditionally, AIS data have not been used for voyage planning, which relied instead on nautical charts.
AIS data significantly complement ENC data. AIS transponders installed on both floating and fixed objects (e.g., buoys, beacons) enable voyage monitoring and hazard avoidance. Moreover, such data can be used to define areas around these objects. One example is the delineation of safety zones around ships. In this study, the use of AIS data are proposed for determining recommended safety areas/zones around fixed objects.
During voyage planning, it is necessary to take into account, among other factors: the cross-track limit (XTE), the vessel’s turning capabilities, traffic separation schemes, physical and legal restrictions (e.g., prohibited and special areas), the distance to navigational obstacles, and the obligation to follow designated routes in specific sections of the planned passage.
Currently, automatic route planning systems are available as part of ECDIS or as separate programs with optimization capabilities and the option to transfer the route to ECDIS. However, these systems require the same or similar assumptions, and the same level of route analysis and evaluation, as those applied in manual planning.
The significance of this issue is highlighted by ongoing efforts to introduce new chart layers under the International Hydrographic Organisation (IHO) S-100 standards. These include, among other features, the implementation of “NoGo areas.” A NoGo area is defined as an area where a vessel must not or should not navigate due to shallow waters, surface or underwater obstructions, or any other conditions that may compromise the safety of the vessel. The S-100 framework nautical charts, to be introduced into navigation from 1 January 2026, provide significantly more data and offer new capabilities compared to the navigational charts currently in use. Among other improvements, the amount of bathymetric and environmental data (currents, tides, weather) has been substantially increased. By utilizing such high-resolution data, it becomes possible to automatically delineate ‘NoGo areas,’, i.e., regions encompassing clusters of hazards, a task that until now has been performed manually.
Incorporating such layers will enable the integration of critical factors into both route planning and subsequent monitoring (e.g., areas with a high density of hazardous point objects). These areas should be defined based on, among other criteria, the vessel’s size, and draught. It is also advisable to consider hydrometeorological conditions, which implies that NoGo areas should be determined dynamically.
At present, there are no universally accepted methods or criteria for identifying these areas. This issue is especially important for planning and conducting voyages of semi-autonomous and autonomous vessels, which may operate with a reduced crew or no crew at all. NoGo areas are also crucial when planning and executing collision avoidance maneuvers with nearby vessels, as they define the available maneuvering space.
A proposal has been made to introduce domains of static objects, which could serve as a foundation for expanding ongoing work on the automatic identification of NoGo areas to include both surface and underwater hazards.
For this purpose, AIS data were employed, providing a substantial complement to ENC information. AIS transponders mounted on both floating and fixed navigational objects (e.g., buoys, beacons) allow not only for effective voyage monitoring and hazard avoidance but also for the determination of spatial domains around these objects. A notable example is the delineation of safety zones surrounding vessels. In this study, we propose an innovative use of AIS data to define recommended safety areas or zones around fixed objects, thereby enhancing the reliability of route planning in restricted waters.
The literature addresses issues related to voyage planning. Voyage planning consists of determining successive waypoints, either manually by the navigator or automatically by systems such as ‘Route Planner.’ Various aspects of voyage planning and execution are analyzed in the literature, taking into account the criteria and tools available in ECDIS to support this process. These tools allow verification of the route planned by the navigator using designated waypoints. Verification involves checking whether the intended track, defined by waypoints and permissible cross-track error (XTE) limits, intersects the safety contour, isolated navigational hazards, or restricted and special areas. Additionally, it is possible to introduce ‘NoGo Areas.’ The safety contour is understood as the one selected by the navigator from the ENC database. It necessitates corrections of waypoint positions and XTE values for individual route segments. Current IHO work within the S-100 standard framework allows for the automatic generation of ‘NoGo Areas.’ The hydrographic object domains and methods of their determination proposed by the authors, defining passing distances from hydrographic objects, may be applied to the delineation of ‘NoGo Areas’ around them.
State of the Art
The rules for voyage planning are collected in the guidelines of the International Maritime Organization [2]. The principles of planning and monitoring the vessel route based on ECDIS are described in [3]. The issue of setting cross track limits XTE as one of the most important safety parameters in route planning was presented by Kristić et al. in [4]. The concept of the ship domain in navigation safety assessment is described in [5]. The use of data from an automatic identification system has become widespread with the increasing possibilities of recording, storing, and sharing it. The use of AIS data in traffic monitoring systems is presented in [6,7,8,9,10]. For the practical assessment of situational awareness, AIS data were used in [11]. The integration of AIS data with other systems and anomaly detection was described by Spandon et al. in [12] and Riveiro and Pallotta in [13]. An innovative approach to route planning for autonomous and semi-autonomous ships is presented in [14,15,16]. A novel algorithm for ship route planning considering motion characteristics and Electronic Navigational Charts (ENC) was presented in [17]. Jang, D.-u and Kim, J.-s. presented development of ship route-planning algorithm based on rapidly exploring random tree (RRT*) using designated space [18]. Lyu, H. and Yin, Y. proposed fast path planning for autonomous ships in restricted waters [19]. The study by Di Ciaccio et al. [20] illustrated the practical implementation of the AIS on navigational aids, highlighting its potential for enhancing maritime navigation.
Section 1 discusses the methods and criteria currently used for route planning. It presents safety assessment criteria proposed in the literature, as well as the directions of work being undertaken by international organizations and research institutions.
Section 2 proposes a categorization of nautical chart objects. It introduces a methodology for determining areas around these objects that should not be encroached upon by vessels, based on real data from the AIS. These areas are referred to as domains of hydrographic objects, with a focus on point object domains.
Section 3 presents a case study on determining point object domains. It proposes a method for using these domains to define NoGo areas.
Section 4 provides a graphical visualization of the results along with tabular summaries.
2. Materials and Methods
2.1. Categorization of Hydrographic Objects
In the ENC electronic navigation chart, there are three types of objects: point objects, linear objects, and polygon type objects. Each of these objects is “visible” by the ECDIS or other chart system both during the planning and subsequent monitoring of the route. It is the responsibility of the navigator planning the route to properly take into account the objects in terms of the planned passing distance, the side on which to avoid, the intersection or not of the area or not taking it into account in the planning. The categorization proposed by the authors for determining prohibited areas around objects is presented in Figure 1. The basic object types (point, polygon, line) correspond to the IHO classification.
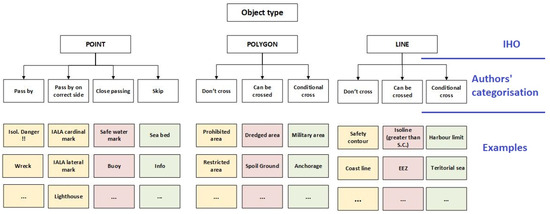
Figure 1.
Proposal categorization of hydrographic objects occurring on nautical charts based on IHO chart objects: point, polygon, linear.
The categorization proposed by the authors for determining prohibited areas around objects is presented in Figure 1. The basic object types (point, polygon, line) correspond to the IHO classification. The authors proposed a categorization of such objects and provided illustrative examples.
For the purpose of determining the areas around these objects, it is necessary to obtain and select ship traffic data in the vicinity of these facilities.
2.2. Data Sources and Scope
In order to determine the domains of hydrographic objects, data from the automatic identification system AIS recorded by the own AIS receivers and onshore systems (AIS PL, AIS DK) were analyzed. In the AIS, vessels regularly transmit both static data, including identification details, ship type, dimensions, and draught, as well as dynamic data, such as current position, draught, course, and speed. In this study, data on ship size and position were used. AIS signals are also transmitted by AtoN (Aids to Navigation), both physically existing and virtual. The article uses data on ship sizes and their recorded positions.
Messages sent from AIS are encoded according to the NMEA standard. An example of the original data recorded in NMEA format is shown in Figure 2.
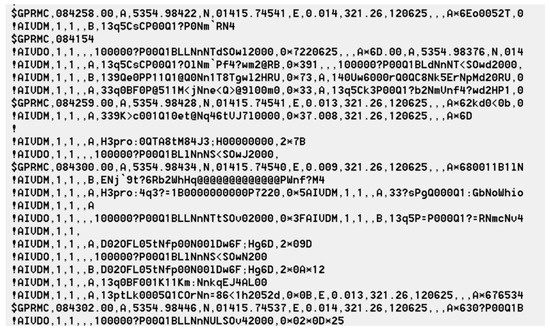
Figure 2.
Fragment of original data in NMEA standard.
Historical data from 2020 to 2024 were analyzed. The analysis covers restricted areas (marked with a red box in Figure 3):
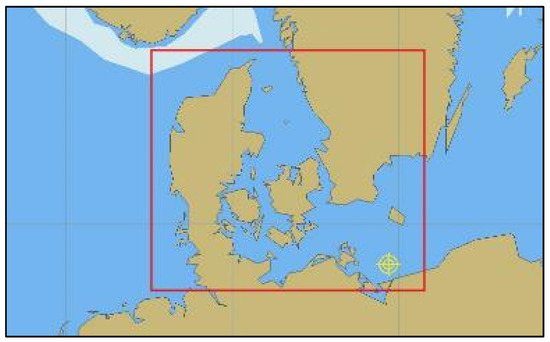
Figure 3.
Area of research—Western Baltic, Kattegat, Skagerrak, and Sund.
- approach from the North Sea to the Danish Straits;
- the Danish Straits;
- South-Western Baltic;
- Pomeranian Bay.
These waters are characterized by a large number of navigational hazards, special areas as well as recommended shipping routes and traffic separation systems. In addition, these are areas with heavy traffic.
The research was conducted for ships of different sizes: small, medium, large, and huge (Table 1). The proposed classification reflects the commonly used division of ships in navigation according to size. The basic ship parameters considered in route planning are its size—length and draught. It is not feasible to determine a domain for a vessel of arbitrary length and draught. The adopted division into groups by length was established arbitrarily, based on the navigator’s experience. Conventional and widely used shipping terminology for ship size groups was applied: coaster, short-trade ship, handy size, and panamax. For clarity, especially for readers less familiar with this subject, the corresponding simplified terms were introduced: ‘small,’ ‘medium,’ ‘large,’ and ‘panamax’ ship. The division was dictated, among other things, by the specific nature of the recommended shipping routes for ships in the analyzed area.

Table 1.
Ship size classes.
The figures below (Figure 4a,b) show an example of a point hydrographic object (4a) and recorded ship tracks from the AIS (4b). Ship tracks represent the positions of ships (blue points) transmitted in AIS messages.
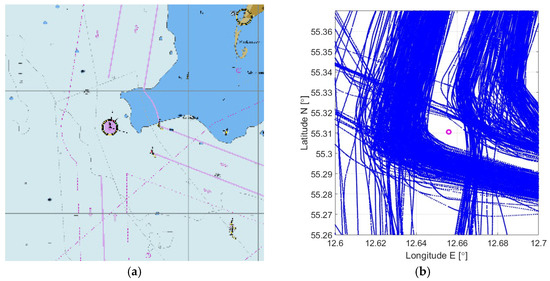
Figure 4.
Example of a point hydrographic object: (a) point object—Lighthouse Falsterborev: (b) recorded ship tracks from the AIS around the object.
These data will form the basis for determining safe areas around hydrographic objects.
2.3. Domain of Hydrographic Object—Point Object
Analogous to the concept of the ship domain [21], the concept of the domain of a hydrographic object has been proposed. This is an area where no ship should be present. The hydrographic object domain DH is determined by its boundary BDH. In a general case, the domain boundary can be represented as a set of points pDi (i = 1, 2, ..., n), lying on bearings (0–360°) at distances dDBi from the object’s centre.
where BDS is a set of points determining the domain boundary.
The size of hydrographic domain DH on each bearing is then described by distances of points of domain boundary from the ship centre on the respective relative bearings:
It was assumed to approximate the domain of hydrographic objects with the use of geometric figures.
The hydrographic domains of point objects were considered. An ellipse was proposed for their description due to the ease of presentation on the chart and use in calculations. The task of determining the domain in this case comes down to determining the parameters of the ellipse:
- the radii of the ellipse Ra and Rb,
- the position of the center of the ellipse Xc and Yc,
- angle of rotation of the ellipse υ.
The following steps were proposed for determining the domain of a selected point object (Figure 5):
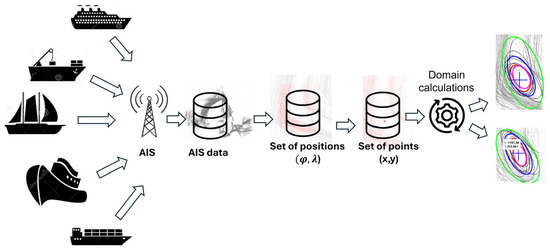
Figure 5.
The process of domain assignment: data acquisition, decoding, filtering, object domain determination.
- acquisition of ship traffic messages from the AIS in the area of the point object;
- decoding of AIS messages;
- filtering data, e.g., selecting ships of a specific size based on recorded ship tracks
- determining domains: minimum, mean and maximum.
2.4. Pre-Processing
Processing of data sent in AIS messages (Figure 2) requires their decoding and then selection of data necessary to determine the domains of hydrographic objects. The set of recorded R messages contains records
each described by the attribute vector
where
i—record index,
j—attribute index,
n—number of registered messages,
mk—number of message attributes,
—the value of the j attribute in the i record of the R set.
The attributes describe:
- static data, e.g., MMSI vessel identifier, status, type, length, breadth,
- dynamic data: position, date, course, speed and more.
Two stages of preprocessing of recorded messages were carried out:
Stage I: Message decoding and data pre-filtering:
- decoding AIS messages from the NMEA standard (cf. Section 2.2),
- narrowing down the list of attributes contained in messages to those considered necessary in the process of designating domains based on the analysis of ship tracks.
Stage II: Filtration of data to determine the domains of selected hydrographic objects, taking into account selected groups of vessels, e.g., selected sizes:
- narrowing the area where ship tracks will be analyzed,
- selection of ship tracks based on selected attributes of the set of messages for determining the domains of hydrographic objects,
- transformation of ship track coordinates into a rectangular—Cartesian coordinate system.
The implementation of both stages of preprocessing allowed to significantly reduce the size of data and speed up the process of designating domains. A fragment of decoded messages with a reduced number of attributes (stage I) is presented in Table 2.
Table 2.
Stage I of pre-processing—decoded messages.
Where
MMSI—Marine Mobile Service Identity,
Status—current ship navigational status—here: 0 = underway using engine,
SOG—speed over ground,
COG—course over ground,
Type—ship type, here: 70 = cargo ship, 80 = tanker.
Stage II of pre-processing included:
- determination of a set of records G from R representing traces of ships with positions (λi, φi) belonging to the considered water area described by coordinates :
i—record index,
j—attribute index,
ng—number of records in set G,
m—number of attributes,
—the value of attribute j in record i of set G.
- narrowing down the range of analyzed ship tracks by determining a set of S point records from set G with attribute values of a vector , satisfying the conditions of belonging to defined value intervals Ik or to finite sets of values Vk:
—minimum and maximum values of attribute k
—l-th acceptable value of attribute k
ko—number of acceptable values of attribute k
Then, the set of points representing ship tracks is defined as follows:
where
iS—record index,
j—attribute index,
m—number of attributes,
nS—number of records in set S.
- transformation T of geographical coordinates φ, λ of ship positions to a set of points in Cartesian coordinates x, y in the set of points P:
—cartographic representation: (e.g., Gauss–Kruger, UTM, Mercator, etc.),
—a set of points in a geographical coordinate system,
—a set of corresponding points in the Cartesian coordinate system.
To perform the transformation from geographic to Cartesian coordinates, an evolution of the Gauss–Kruger–Universal Transverse Mercator (UTM) model was used. It is based on the mathematical mapping of points on the World Geodetic System (WGS-84) reference ellipsoid to corresponding points on a plane. This article applies the transformation of the geographic coordinates of ships positions , into Cartesian coordinates of these positions , y in a rectangular system on a plane. The transformation was performed as follows:
- for the geometric parameters describing the ellipsoid model (WGS-84):—major axis,—flattening—minor axisAnd the parameter known as first eccentricity
- the radius of curvature in the first vertical was calculated:
- the coordinates were converted (for points on the sea surface–elevation
2.5. Method for Determining the Domain for a Point Type Object
The safety domain of a hydrographic point is geometrically represented by an ellipse related to points representing ship positions and a characteristic point representing a point hydrographic object.
Depending on the nature of these relationships, two types of ellipses have been defined: inscribed ellipses and bounding ellipses.
- An ellipse inscribed in a set of points is an ellipse that:
- (1)
- has the largest areaand
- (a)
- contains a characteristic point,
- (b)
- does not contain any points from the surrounding set of points;
- an ellipse bounding on a set of points is an ellipse that
- (2)
- has the smallest areaand
- (a)
- contains a characteristic point (this condition can be taken into account, although it is not necessary due to the nature of the points described),
- (b)
- contains all surrounded (described) points.
The way in which the above definitions of ellipses are expressed determines how their parameters are calculated. These parameters are calculated by optimization, i.e., in the process of determining such parameters for which the optimal value of the target function is reached while satisfying the underlying assumption. According to the definitions shown above):- (3)
- the optimal value of the objective function is achieved (maximum value of the area for the inscribed ellipse and minimum value for the circumscribed ellipse)—points 1 in the above definitions,while satisfying the conditions limiting the solution space:
- (a)
- the characteristic point is inside the inscribed ellipse and the bounding ellipse (this condition is unnecessary—it does not change anything, because the characteristic point is naturally surrounded by points representing the positions of ships),
- (b)
- all other points (except for the characteristic point) are outside the inscribed ellipse or inside the bounding ellipse.
There are many classes of algorithms for solving optimization problems for different types of problems (e.g., analytical methods, numerical methods with and without constraints, global optimization, or discrete optimization). To calculate the parameters of inscribed and bounding ellipses, a procedure for determining the minimum of a constrained nonlinear multivariable function was used. Function “fmincon” is based on “interior-point” algorithm and implemented in programming and numeric computing platform Matlab [22,23]. The results of the optimization task for determining the inscribed and bounding ellipse are shown in Figure 6 (left figure: inscribed ellipse, right figure: circumscribed ellipse).
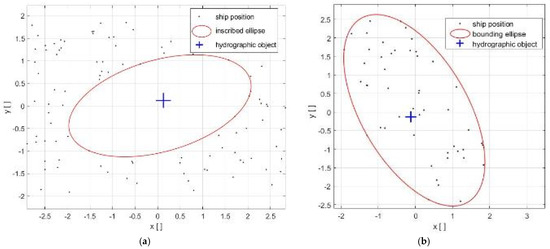
Figure 6.
Calculated ellipses: (a) inscribed ellipse; (b) bounding ellipse.
The above defined ellipses are used for formulating the domains:
- base domain—an ellipse inscribed in the set of points P, containing a hydrographic object;
- temporal domain—a base domain for a subset of points recorded within a specified period of time (e.g., day):
- ○
- minimum,
- ○
- maximum,
- ○
- mean,
- ○
- intermediate.
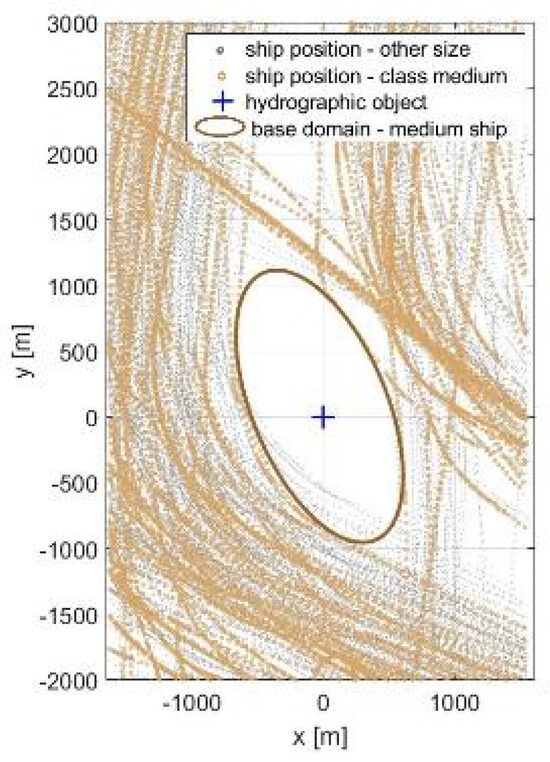
Figure 7.
Base domain for a ‘medium’ ship.
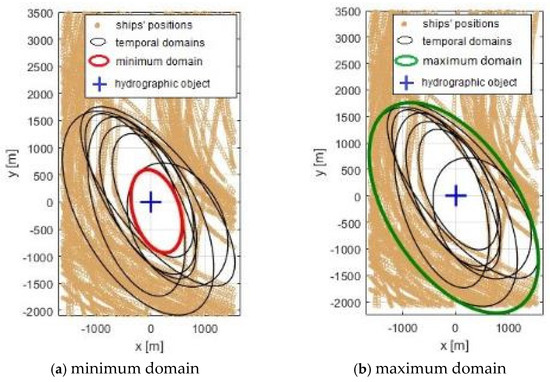
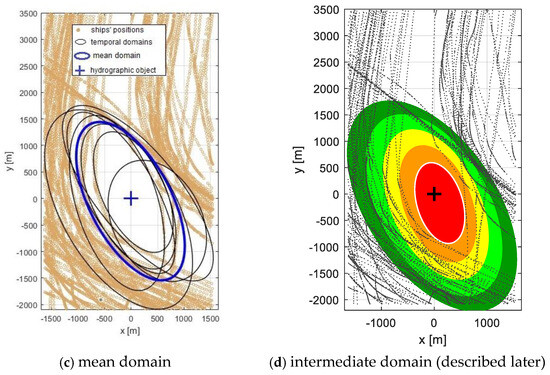
Figure 8.
Domains for the ‘medium’ ship: minimum (a), maximum (b), mean (c) and intermediate (d).
The base domain defined for all ship tracks of a given class under consideration is sensitive to single passages (single tracks) of ships in close proximity to the object. For this reason, ship tracks were divided into smaller sets for further statistical analysis. The concept of a temporal domain was introduced.
A temporal domain is defined using base domain for a fixed time interval inscribed in a subset of points () (Equation (7)). Figure 8 shows one day temporal domains for seven time intervals (seven days), marked in black.
Based on the temporal domains, the minimum, maximum, mean, and intermediate domains were determined.
Minimum domain is defined by the domain inscribed in all temporal domains (Figure 8a).
Maximum domain is defined by the domain bounding all temporal domains (Figure 8b).
Mean domain is calculated using arithmetic averages of temporal domains parameters (Figure 8c).
Intermediate domain is defined by an ellipse with parameters dividing the region between the maximum and minimum domain in a specified ratio, e.g., 0.25, 0.5, 0.75, 1.0 (Figure 8d). The ratio can be interpreted as relative distance between the minimum and maximum domains.
3. Case Study
Falsterborev Lighthouse was selected to determine the domains of point objects (φ = 55°18.5′ N, λ = 012°39.6′ E—Figure 3). Vessels equipped with Class A AIS were considered.
The analysis took into account the length of vessels as one of the attributes describing the size of a vessel (Table 1). Vessels with a length of 60 metres or more and a draught of more than 2.5 metres were included (see Section 2.2). Thus, vessels that, due to their size, could approach or maneuver at a short distance from a hydrographic object were omitted.
3.1. Base and Temporal Domains
Base domains were designated for each of the analyzed classes (Table 1). They are illustrated in Figure 9. Traces of ships of a given class are marked in brown, while traces of other ships are marked in grey. For small, medium, and large ships, an increase in domain dimensions was observed with an increase in ship size. This trend was not observed for very large ships. This is because the basic domain is strictly based on all observations, while the actual observed ship routes are not deterministic and are characterized by a certain degree of randomness. In such cases, the routes that deviate from the average norm have a significant impact on the final result (a deterministic inscribed ellipse), significantly distorting the reasoning. Therefore, it was proposed to divide the results in order to obtain multiple ellipses (e.g., daily). This moved the considerations from the deterministic to the stochastic domain. The calculated ellipses, representing time domains (daily), can be subjected to elementary statistical processing and, on this basis is possible to determine:
- the minimum domain—as inscribed in the temporary domains,
- the average domain with parameters being the average values of temporary domains,
- the maximum domain—as bounding the temporary domains

Figure 9.
Base domains for 4 ship size classes. The ship tracks inside the domains represent vessels of sizes other than the one under analysis.
Figure 9.
Base domains for 4 ship size classes. The ship tracks inside the domains represent vessels of sizes other than the one under analysis.

In this way, seven temporal domains were designated for each ship class (Figure 10).
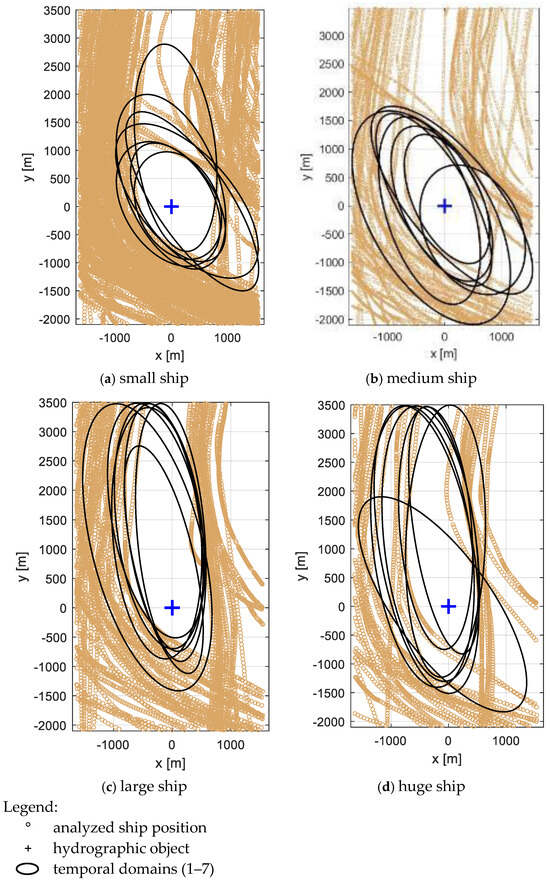
Figure 10.
Temporal (daily) domains for 4 classes of ship sizes.
Differences in the size and location of temporal domains were observed on individual days. This allowed for further statistical analysis of the domains in order to determine the minimum, mean, maximum and intermediate domains for the four analyzed ship size classes.
3.2. Minimum, Mean, Maximum and Intermediate Domain
The domains defined using the method described in Section 2.5 determine the zones around the object: unacceptable, acceptable and safe (Figure 11a–d).
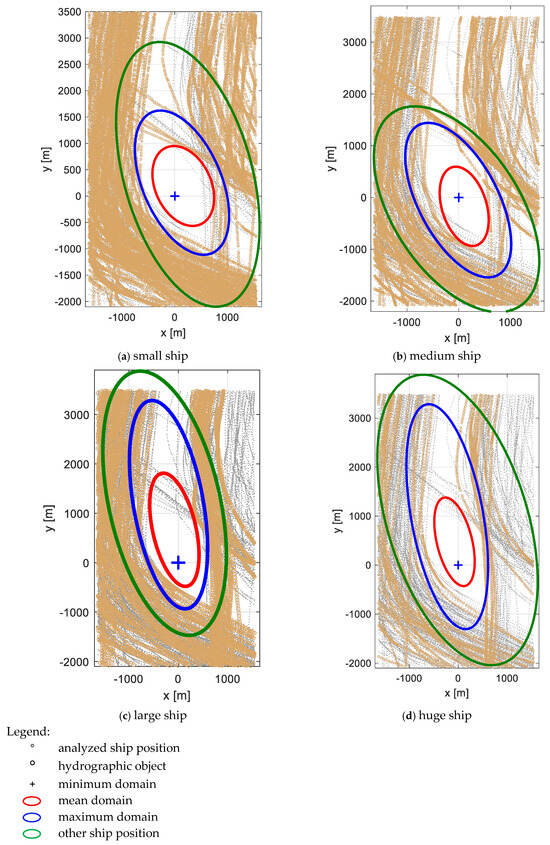
Figure 11.
Minimum, mean and maximum domains for 4 classes of ship size.
Similar relationships were observed between the sizes of individual domains in the analyzed ship size classes.
The introduced sharp intermediate domain allows the determination of additional zones marked by sharp boundaries.
Intermediate sharp domains were determined based on established sharp ratio values—CR:
- CR = 0.0—maximum domain;
- CR = 0.25; 0.50; 0.75—intermediate domains;
- CR = 1.0—minimum domain.
Intermediate domains with sharp boundaries were analyzed (Figure 12a–d).
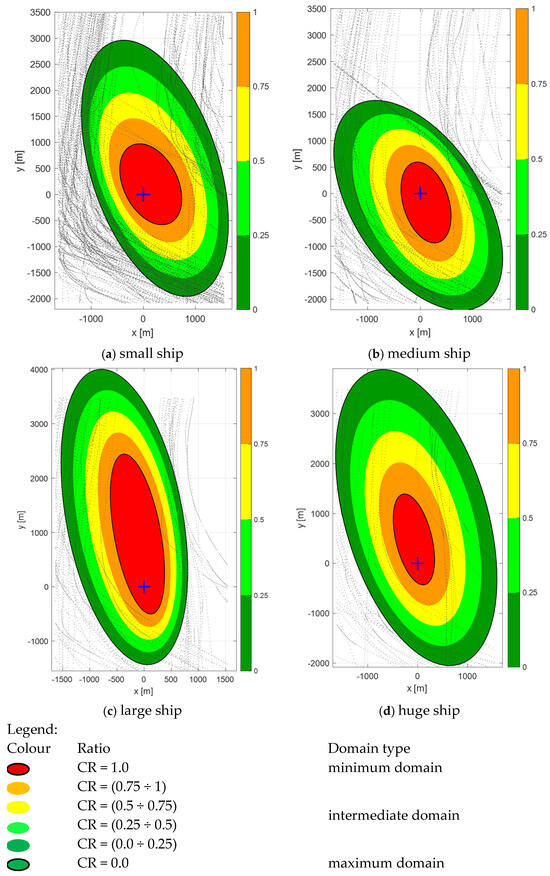
Figure 12.
Intermediate sharp domains for 4 classes of ship sizes based on CR factor. Minimum domain marked black.
Subsequently, the fuzzy domain of an object was introduced based on fuzzy set theory (Figure 13a–d), analogously to the ship’s fuzzy domain. The fundamental concept of this theory is the fuzzy set, which allows an element to belong to a set with a degree ranging from 0 to 1. A membership degree of 0 indicates that the element does not belong to the set, a degree of 1 denotes full membership, and values within the interval (0, 1) represent partial membership. The coefficient CR is interpreted as the degree of membership in the fuzzy set defined as the fuzzy domain of a hydrographic object. This approach enables continuous assessment of the current level of intrusion into the area surrounding the object, based on the CR factor, and facilitates tracking its direction of change.
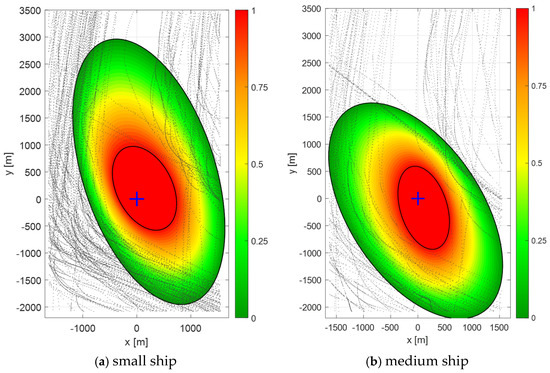
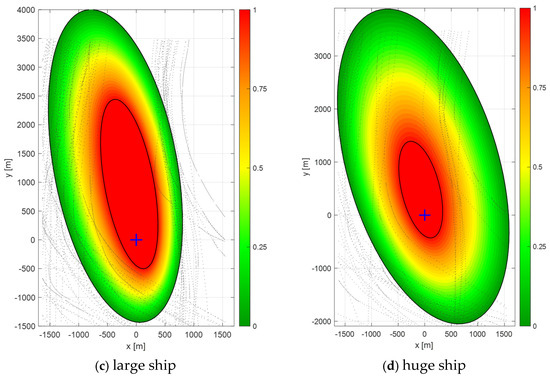
Figure 13.
Intermediate fuzzy domains for 4 classes of ship sizes with minimum domain marked red.
Intermediate fuzzy domains were determined by changing the CR coefficient in the range [0, 1] with a step of 0.0057 (175 intermediate domains). Visualization was performed by assigning colours to individual intermediate domains in the RGB colour space model.
Both variants—sharp and fuzzy intermediate domains—are alternatives to domains determined on the basis of ship track density, where it may be difficult to indicate track density ranges for defining minimum, mean and maximum domains.
4. Results
The domains of the hydrographic object for different ship size classes were compared. The maximum domains of the point object for very large and large ships were similar in shape and reflected the size relations of the ships (the domain for very large ships is larger than the domain for large ships (Figure 14). Attention is paid to the relationship between the domains of medium and small ships.
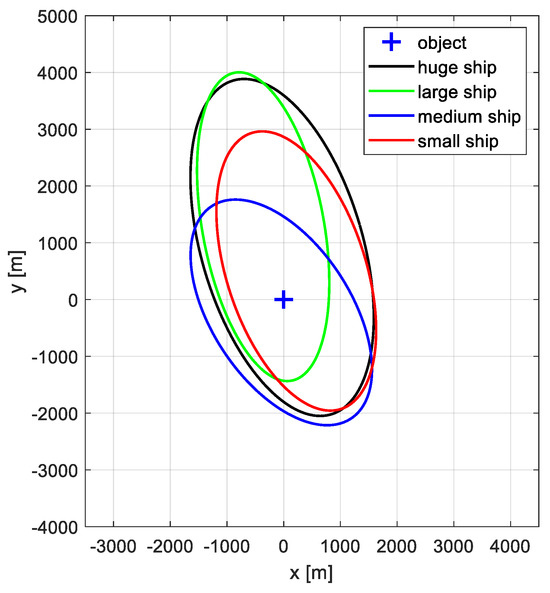
Figure 14.
Calculated maximum domains for different ship size classes.
The medium domains of the point object for medium and small ships were similar in shape and reflected the size relations of the ships (the domain for very large ships is larger than the domain for large ships (Figure 15). Similar relationships were observed for medium and small ship domains.
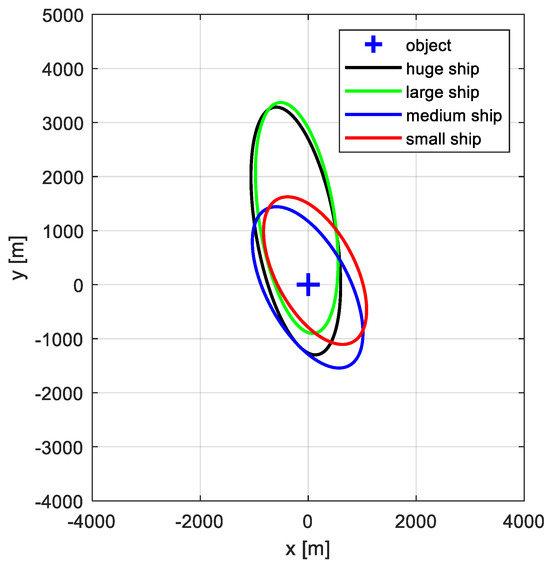
Figure 15.
Calculated mean domains for different ship size classes.
The minimal domains of the point object for very large and large ships were similar in shape and reflected the size relations of the ships (the domain for huge ships is larger than the domain for large ships (Figure 16). Similar relationships were observed for medium and small ship domains.
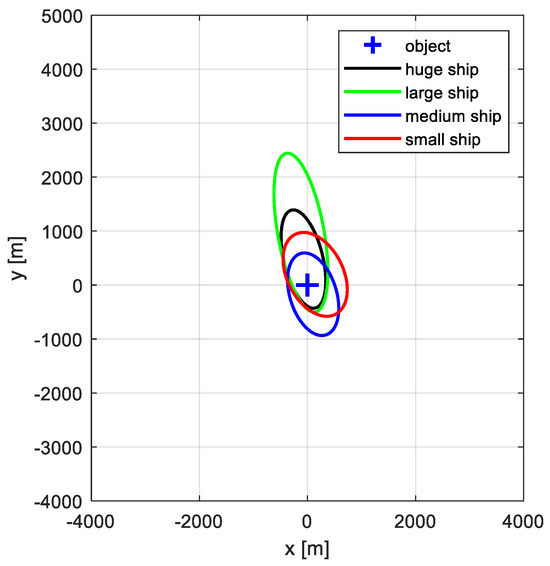
Figure 16.
Calculated minimum domains for different ship size classes.
Table 3, Table 4, Table 5 and Table 6 list the parameters of ellipses representing the designated domains presented in Figure 11. The domain parameters can be interpreted as follows: The length of the semi-long axis represents the distance at which the vessel must consider taking action to avoid a hydrographic object. The length of the short semi-short axis represents the recommended passing distance of the object.
Table 3.
Domains of the “huge” ship.
Table 4.
Domains of the “large” ship.
Table 5.
Domains of the “medium” ship.
Table 6.
Domains of the “small” ship.
The values of the semi-axis lengths of the calculated domains are visualized in Figure 17, Figure 18 and Figure 19.
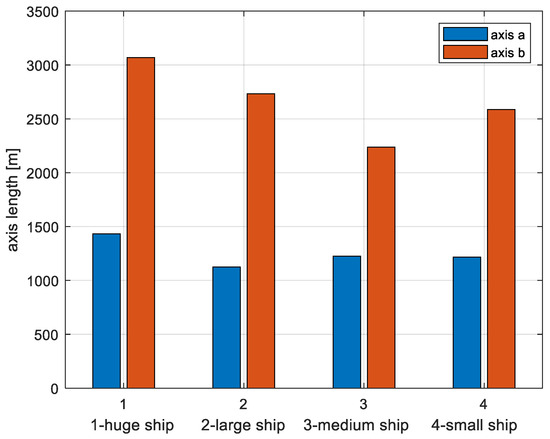
Figure 17.
Domain semi-axis length for maximum domains.
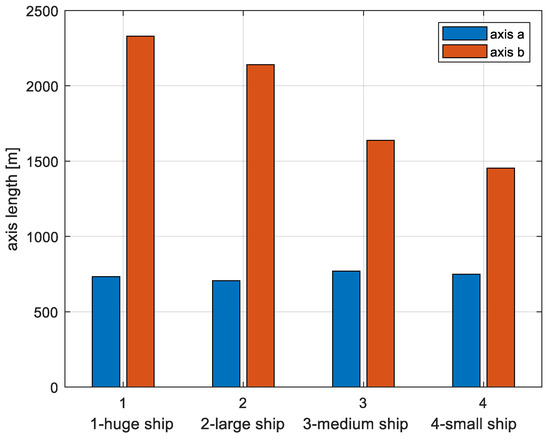
Figure 18.
Domain semi-axis length for mean domains.
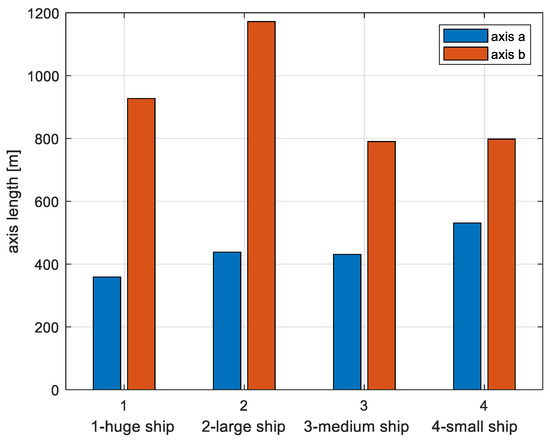
Figure 19.
Domain semi-axis length for minimum domains.
5. Discussion
The proposed method precisely defines how to determine the maximum, mean, minimum and intermediate domains.
In the case of the first three, a domain violation may result in a warning being generated, a recommended anti-collision maneuver being designated and, in the case of autonomous ships, the execution of that maneuver. The fourth domain allows continuous measurement of safety level.
The usefulness of these domains in the process of planning and monitoring a ship’s route was analyzed. In the case of the maximum domain, its practical application seems to be limited. Medium domains can be used to recommend the distance of passage from hydrographic objects. Minimum domains represent dangerous areas and can be used to define ‘NoGo areas’.
Table 3, Table 4, Table 5 and Table 6 list the parameters of ellipses representing the designated domains presented in Figure 11. As expected, the lengths of the semi-axes a and b for all domains—minimum, average, and maximum—increase with the size of the vessel. At this stage of the research, the observed relationships were not analyzed in detail. In further studies, it will be possible to distinguish a greater number of vessel size groups and to determine mathematical relationships between vessel size and domain size.
In the process of domain identification, a significant influence of navigator behaviour and navigational conditions on the sizes of the minimum and maximum domains was observed. The size of the minimum domain was affected, among other factors, by individual passages described by the authors as risky, which significantly reduced its value. Due to the adopted method for determining the maximum domain, a significant elongation of the semi-axes was observed, related to the specifics of traffic in the area. The existing directional lanes in the TSS restricted or excluded the possibility of passing the object at all bearings around it. The method used for determining the average domain resulted in a substantial reduction in the influence of the factors described above. It was calculated as the arithmetic mean of the temporal domains, thus reducing the impact of both risky passages (minimum domain) and those caused by the specifics of the area (maximum domain).
Figure 17, Figure 18 and Figure 19 illustrate the relationships described above. They show a lack of logical distribution of semi-axis lengths for the minimum and maximum domains, in contrast to the average domain. The length of the minor semi-axis can be interpreted as the recommended passing distance of a hydrographic object by a vessel and is similar in value for all vessel sizes. The length of the major semi-axis can be interpreted as the distance at which a vessel should alter course to pass the object at the intended distance. Consequently, the length of the major semi-axis is influenced by the size of the vessel.
6. Conclusions
In the available literature, the safety criteria are generally defined by the safety contour and the allowable cross-track error (XTE). The criterion of a safe passing distance from hydrographic objects is not taken into account. There is a need to designate hydrographic object domains to ensure safe navigation near hydrographic objects, including for the designation of NoGo areas on navigation charts. The novel elements of the article are the proposed hydrographic object domains and the methodology for their determination. These can be used for the automatic identification of NoGo areas in the ship voyage planning process.
The results of research on point hydrographic object domains are presented and a method for their designation is proposed. Ship traffic on one of the busiest shipping routes in Europe was analyzed. The research used ship tracks recorded in the AIS. Due to the large number of such objects, it seems advisable to automate the process of determining hydrographic object domains.
The proposed domains take into account the specific nature of a particular object and water body. Maximum domains can be used for early warning of approaching hydrographic objects. The mean domains determined by this method can be used to recommend the distance of passage from hydrographic objects and to determine the size of the safety frame (look ahead) used in ECDIS. The minimum domains represent dangerous zones and can be used to define NoGo areas. This is particularly important for voyage planning and ship route monitoring. It can be used for both autonomous and conventional ships with all degrees of autonomy.
The authors plan to extend the proposed method of determining the domains of point hydrographic objects to linear objects and polygonal objects.
Author Contributions
Conceptualization, M.W. and Z.P.; methodology, Z.P.; software, G.W.; validation, Z.P., M.W. and G.W.; formal analysis, M.W.; investigation, G.W.; resources, M.W.; data curation, G.W.; writing—original draft preparation, M.W.; writing—review and editing, Z.P. and G.W.; visualization, G.W. and M.W.; supervision, Z.P.; project administration, M.W.; funding acquisition, Z.P. All authors have read and agreed to the published version of the manuscript.
Funding
This research outcome has been achieved under the research project 1/S/KI/25, financed from a subsidy of the Ministry of Science and Higher Education for statutory activities of the Maritime University of Szczecin, Poland.
Data Availability Statement
The original contributions presented in this study are included in the article. Further inquiries can be directed to the corresponding author.
Acknowledgments
The research was conducted in the AIS laboratory of the Centre for the Operation of Floating Objects at the Maritime University of Szczecin.
Conflicts of Interest
The authors declare no conflicts of interest.
Abbreviations
The following abbreviations are used in this manuscript:
| AIS | Automatic Identification System |
| COG | Course over ground |
| ECDIS | Electronic Chart Display and Information System |
| IHO | International Hydrographic Organization |
| IMO | International Maritime Organization |
| ISM | International Safety Management (Code) |
| NMEA | National Marine Electronics Association |
| SMS | Safety Management System |
| SOG | Speed over ground |
| WGS-84 | World Geodetic System ‘84 |
| XTE | Cross Track Error |
References
- International Maritime Organization. International Convention on Safety of Life at Sea (SOLAS), The IMO-Vega Database. 2025. Available online: https://www.imo.org/en/publications/pages/imo-vega.aspx (accessed on 10 January 2025).
- International Maritime Organization. Resolution A.893(21) Guidelines for Voyage Planning. Available online: https://wwwcdn.imo.org/localresources/en/KnowledgeCentre/IndexofIMOResolutions/AssemblyDocuments/A.893(21).pdf (accessed on 12 March 2025).
- Wang, Q.; Zhong, M.; Shi, G.; Zhao, J.; Bai, C. Route Planning and Tracking for Ships Based on the ECDIS Platform. IEEE Access 2021, 9, 71754–71762. [Google Scholar] [CrossRef]
- Kristić, M.; Žuškin, S.; Brčić, D.; Valčić, S. Zone of Confidence Impact on Cross Track Limit Determination in ECDIS Passage Planning. J. Mar. Sci. Eng. 2020, 8, 566. [Google Scholar] [CrossRef]
- Wielgosz, M.; Pietrzykowski, Z. The ship domain in navigational safety assessment. PLoS ONE 2022, 17, e0265681. [Google Scholar] [CrossRef] [PubMed]
- Jaskólski, K.; Marchel, Ł.; Felski, A.; Jaskólski, M.; Specht, M. Automatic Identification System (AIS) Dynamic Data Integrity Monitoring and Trajectory Tracking Based on the Simultaneous Localization and Mapping (SLAM) Process Model. Sensors 2021, 21, 8430. [Google Scholar] [CrossRef] [PubMed]
- Tu, E.; Zhang, G.; Rachmawati, L.; Rajabally, E.; Huang, G.-B. Exploiting AIS Data for Intelligent Maritime Navigation: A Comprehensive Survey from Data to Methodology. IEEE Trans. Intell. Transp. Syst. 2018, 19, 1559–1582. [Google Scholar] [CrossRef]
- Emmens, T.; Amrit, C.; Abdi, A.; Ghosh, M. The Promises and Perils of Automatic Identification System (AIS) Data. Expert Syst. Appl. 2021, 178, 114975. [Google Scholar] [CrossRef]
- Kim, Y.-J.; Lee, J.-S.; Pititto, A.; Falco, L.; Lee, M.-S.; Yoon, K.-K.; Cho, I.-S. Maritime Traffic Evaluation Using Spatial-Temporal Density Analysis Based on Big AIS Data. Appl. Sci. 2022, 12, 11246. [Google Scholar] [CrossRef]
- Guo, Z.; Liu, X.; Zhang, Y.; Luo, Q. From AIS Data Processing to Maritime Traffic Networks: Semantic Models and Frameworks. Ocean Eng. 2024, 302, 114813. [Google Scholar]
- Ribeiro, C.V.; Alves, J.C.; Gonçalves, G.; Pinto, F.R. AIS-Based Maritime Anomaly Traffic Detection: A Review. Expert Syst. Appl. 2023, 225, 120561. [Google Scholar] [CrossRef]
- Spadon, G.; Kumar, J.; Chen, J.; Smith, M.; Hilliard, C.; Vela, S.; Gehrmann, R.; DiBacco, C.; Matwin, S.; Pelot, R. Maritime Tracking Data Analysis and Integration with AISdb. SoftwareX 2024, 28, 101952. [Google Scholar] [CrossRef]
- Riveiro, M.; Pallotta, G. Maritime Anomaly Detection: A Review. Wiley Interdiscip. Rev. Data Min. Knowl. Discov. 2018, 8, e1266. [Google Scholar] [CrossRef]
- Wang, G.; Wang, J.; Wang, X.; Wang, Q.; Han, J.; Chen, L.; Feng, K. A Method for Coastal Global Route Planning of Unmanned Ships Based on Human-like Thinking. J. Mar. Sci. Eng. 2024, 12, 476. [Google Scholar] [CrossRef]
- Lu, C.-W.; Hsueh, C.-K.; Chuang, Y.-L.; Lai, C.-M.; Yang, F.-S. Marine Collision Avoidance Route Planning Model for MASS Based on Domain-Based Predicted Area of Danger. J. Mar. Sci. Eng. 2023, 11, 1724. [Google Scholar] [CrossRef]
- Li, Y.; Yang, F.; Zhang, X.; Yu, D.; Yang, X. Improved D* Lite Algorithm for Ship Route Planning. J. Mar. Sci. Eng. 2024, 12, 1554. [Google Scholar] [CrossRef]
- He, Q.; Hou, Z.; Zhu, X. A Novel Algorithm for Ship Route Planning Considering Motion Characteristics and ENC Vector Maps. J. Mar. Sci. Eng. 2023, 11, 1102. [Google Scholar] [CrossRef]
- Jang, D.-U.; Kim, J.-S. Development of Ship Route-Planning Algorithm Based on Rapidly-Exploring Random Tree (RRT*) Using Designated Space. J. Mar. Sci. Eng. 2022, 10, 1800. [Google Scholar] [CrossRef]
- Lyu, H.; Yin, Y. Fast Path Planning for Autonomous Ships in Restricted Waters. Appl. Sci. 2018, 8, 2592. [Google Scholar] [CrossRef]
- Di Ciaccio, F.; Menegazzo, P.; Troisi, S. Optimization of the Maritime Signalling System in the Lagoon of Venice. Sensors 2019, 19, 1216. [Google Scholar] [CrossRef] [PubMed]
- Pietrzykowski, Z.; Wielgosz, M. Effective ship domain–Impact of ship size and speed. Ocean. Eng. 2021, 219, 108423. [Google Scholar] [CrossRef]
- Waltz, R.A.; Morales, J.L.; Nocedal, J.; Orban, D. An interior algorithm for nonlinear optimization that combines line search and trust region steps. Math. Program. 2006, 107, 391–408. [Google Scholar] [CrossRef]
- Byrd, R.H.; Gilbert, J.C.; Nocedal, J. A Trust Region Method Based on Interior Point Techniques for Nonlinear Programming. Math. Program. 2000, 89, 149–185. [Google Scholar] [CrossRef]


Disclaimer/Publisher’s Note: The statements, opinions and data contained in all publications are solely those of the individual author(s) and contributor(s) and not of MDPI and/or the editor(s). MDPI and/or the editor(s) disclaim responsibility for any injury to people or property resulting from any ideas, methods, instructions or products referred to in the content. |
© 2025 by the authors. Licensee MDPI, Basel, Switzerland. This article is an open access article distributed under the terms and conditions of the Creative Commons Attribution (CC BY) license (https://creativecommons.org/licenses/by/4.0/).