Abstract
The calculation of Total Transfer Capability (TTC) for transmission corridors serves as the foundation for security region determination and electricity market transactions. However, existing TTC methods often neglect corridor correlations, leading to overly optimistic results. TTC computation involves complex stability verification and requires enumerating numerous renewable energy operation scenarios to establish security boundaries, exhibiting high non-convexity and nonlinearity that challenge gradient-based iterative algorithms in approaching global optima. Furthermore, practical power systems feature coupled corridor effects, transforming multi-corridor TTC into a complex Pareto frontier search problem. This paper proposes a MOEA/D-FRRMAB (Fitness–Rate–Reward Multi-Armed Bandit)-based method featuring: (1) a TTC model incorporating transient angle stability constraints, steady-state operational limits, and inter-corridor power interactions and (2) a decomposition strategy converting the multi-objective problem into subproblems, enhanced by MOEA/D-FRRMAB for improved Pareto front convergence and diversity. IEEE 39-bus tests demonstrate superior solution accuracy and diversity, providing dispatch centers with more reliable multi-corridor TTC strategies.
1. Introduction
The global energy transition toward decarbonization has led to large-scale integration of high-penetration renewable energy sources (RESs) such as wind and solar power, fundamentally transforming power system operations [1,2,3]. This requires the development of security control strategies to carefully monitor inter-area transfer limits. This can be achieved via total transfer capability (TTC) monitoring and control [4,5]. According to the North American Electricity Reliability Council (NERC) [6], TTC is defined as an index to measure the ability of a transmission network to reliably carry electric power from one location to another across the system without compromising the system security. TTC calculation critically impacts transmission pricing, congestion management, and grid planning decisions—all crucial factors for system security and economic efficiency [7].
While participating in electricity market transactions, TTC serves as a quantitative indicator of security boundaries, guiding operators to adjust operational modes for system stability. However, TTC identifies the ideal stability limit along the most optimistic path, varying with operational conditions and requiring real-time monitoring—significantly increasing dispatchers’ workload. Consequently, practical engineering applications typically employ transmission limits as quantitative security benchmarks, ensuring system safety by maintaining corridor power flows below these thresholds [8,9,10]. As boundary values defining secure operational modes are typically obtained through iterative “trial-and-error” adjustments of source–load distributions between sending and receiving ends [11], calculating multiple TTC values under extreme scenarios and selecting the most conservative result. Thus, building on existing theory, TTC can also be considered an indirect quantitative indicator of security boundaries, intrinsically linked to transmission limits.
The large-scale integration of high-penetration renewable energy sources like wind power has significantly increased the complexity and diversity of power system operations [12], leading to a substantial expansion of fundamental operational scenarios. This introduces significant challenges to conventional gradient-based TTC calculation methods (e.g., continuation power flow [13] and sensitivity analysis [14]), which struggle to converge to global optima when handling high-dimensional nonlinear constraints. The resulting volatile local optima in extensive TTC calculations severely compromise transmission limit accuracy. Moreover, the complex stability verification required during TTC computation makes it difficult to accurately derive gradients for iterative feasible solution searches, thus limiting traditional methods’ applicability. Critically, while tightly coupled interactions exist among transmission corridor power limits in large-scale interconnected grids [15,16,17], current research often inadequately addresses multi-corridor interdependencies. Reference [18] employs a multi-corridor control method to adjust stability-limited power flows, but it fails to consider interdependencies among corridor limits. Study [19] proposes distributed maximum power search strategies focusing on interaction factors between adjacent corridor pairs; however, the coupling mechanisms among multiple corridors in complex grids remain insufficiently explored. As demonstrated in [20,21], current analyses of multi-corridor power limit correlations predominantly rely on expert experience, exhibiting limited adaptability to diverse operational scenarios. The prevalent neglect of coupling relationships between corridors frequently results in excessively conservative transmission limit calculations. Consequently, comprehensive consideration of complex inter-corridor relationships would further increase TTC calculation dimensionality and complexity, thereby exacerbating global optimization difficulties. Therefore, effectively addressing high-dimensional nonlinear constraints, complex stability verification, and multi-corridor coupling effects to achieve accurate coupled multi-corridor TTC computation—and consequently providing a robust foundation for more precise and economical offline transmission limit determination—represents a critical challenge in power system security operation and planning.
Research demonstrates that the decomposition-based multi-objective evolutionary algorithm (MOEA/D) can effectively reconcile conflicting objectives through its unique decomposition strategy, exhibiting superior performance in power system optimization. As evidenced in References [22,23,24], MOEA/D achieved excellent Pareto solution coverage and convergence when applied to two competing objectives: voltage stability and cost optimization. MOEA/D’s gradient-free nature makes it particularly suitable for complex stability verification problems in TTC calculation where gradient derivation is challenging. Moreover, its multi-objective capability enables effective capture of inter-corridor coupling relationships, avoiding conservative estimates resulting from neglected correlations. However, when addressing high-dimensional, strongly nonlinear multi-corridor coupled TTC problems, conventional MOEA/D still shows limitations in convergence speed and global optimization capability, tending to converge to local optima and struggling to obtain high-precision Pareto frontiers—directly impacting the accuracy of offline transmission limit determination.
To address the aforementioned challenges, particularly the limitations of conventional MOEA/D in convergence and global optimization capability for high-dimensional nonlinear problems, this paper introduces the MOEA/D-FRRMAB algorithm for solving multi-corridor coupled TTC problems. As an advanced MOEA/D variant, MOEA/D-FRRMAB incorporates an embedded FRRMAB mechanism that significantly enhances global optimization capability and convergence speed when handling complex optimization problems, thereby effectively avoiding local optima and obtaining more precise Pareto frontiers. The main contributions include: (1) construction of a multi-objective TTC calculation model accounting for high-penetration renewable energy characteristics and multi-corridor coupling effects; (2) successful application of the MOEA/D-FRRMAB algorithm to the multi-objective TTC optimization problem, effectively overcoming its inherent complexities such as high-dimensional nonlinearity, non-convexity, dynamic constraints, and multi-corridor coupling, thereby meeting stringent reliability requirements and obtaining an accurate and reliable Pareto optimal solution set; and (3) comparative analysis with NSGA-II, a state-of-the-art multi-objective optimization algorithm, demonstrating significant advantages in both accuracy and coverage of Pareto frontiers on the IEEE 39-bus test system. The experimental results confirm that the proposed framework provides robust support for accurate multi-corridor coupled TTC computation and subsequent transmission limit determination, offering substantial improvements over existing approaches in handling the complex interdependencies inherent in modern power systems.
2. Materials and Methods
2.1. TTC Calculation Model
The calculation of TTC is fundamentally a Transient Stability-Constrained Optimal Power Flow (TSCOPF) problem [25], expressed mathematically as follows [26].
2.1.1. Objective Function
The objective function for maximizing the critical stable power transfer capacity across transmission corridors is formulated as
where denotes the power transmission along corridor in the specified direction, represents the set of all corridors, and represents all decision variables influencing corridor power flow, specifically generator active power output, load active power output, number of capacitor switching groups and capacity.
2.1.2. Power Flow Constraint
The system power flow constraints are as follows:
where , with being the set of all nodes; and represent the active and reactive power outputs of generators, respectively; denotes the injected power from reactive power compensation devices; and are the active and reactive loads at the node; and indicate the voltage magnitude and phase angle at the node; and and correspond to the magnitude and angle of the bus admittance matrix elements.
2.1.3. Transient Stability Constraints
- (1)
- Transient rotor angle stability constraints
Transient rotor angle stability constraints with the employed for quantification are expressed by
where denotes the set of all generators and represents the rotor angle. The system becomes transiently unstable when , with larger values indicating greater stability.
- (2)
- Transient voltage stability constraints
For transient voltage stability assessment, this study adopts the criteria specified in the Guide for Security and Stability Calculation and Analysis of China Southern Power Grid [27], where voltage at key system buses below 0.75 p.u. for ≤1 s is deemed stable (with 0.8–1 s duration classified as critical stability), while voltages remaining < 0.75 p.u. beyond 1 s indicate instability.
The transient voltage stability margin is selected as the nodal evaluation metric, mathematically expressed as
where ; denotes the minimum post-fault transient voltage at node i; represents the voltage threshold (0.75 p.u.) for node i; is the permissible duration (1 s) for < 0.75 p.u.; is the total duration of voltage below ; marks the time step when for the j-th occurrence; is the restored steady-state voltage at node i; and is the critical voltage deviation factor (here, = 0.75). Transient voltage instability is declared when < 0. The system-wide voltage stability margin is defined as the minimum of all values.
2.1.4. Steady-State Operational Constraints
The steady-state operational constraints are as follows:
where represents the post-fault current on transmission line , denotes the current capacity limit of line , is the set of generators, represents the node set, and indicates the collection of tie-lines. Equation (7) specifies the following constraints: upper and lower bounds for generator active power output, reactive power output limits of power sources, nodal voltage magnitude constraints, and thermal stability limits of transmission lines.
2.1.5. Reactive Power Resource Operation Constraint
The reactive power resource operation constraints are as follows:
where denotes the 0-1 integer variable for capacitor switching; represents the unit capacity of switched capacitors; indicates the number of capacitor banks switched at node i; and are the lower and upper limits of capacitor banks at node i, respectively; is the maximum allowable capacitor capacity at node i; and denotes the set of all reactive power compensation nodes, where .
2.2. Multi-Corridor Coupled TTC Calculation Method
2.2.1. Theoretical Calculation Model for Multi-Corridor Coupled TTC
The previous section introduced the computational model for independent transmission corridor TTC.
where represents state variables, denotes algebraic variables, and stands for control variables. and indicate the initial operating conditions. The simulation time step is denoted by , while specifies the transient process duration. The system dynamics are described by . φ(·) represents the stability criteria, including both rotor angle stability and voltage stability constraints. Equation (12) presents the standard optimal power flow model, where is the objective function and and represent equality and inequality constraints, respectively. Equation (13) introduces the transient stability constraints that must be satisfied throughout the simulation period.
However, in complex power systems, the mutual coupling effects among multiple corridors must be considered. Consequently, it is necessary to compute the TTC for multiple coupled corridors. This problem falls within the domain of multi-objective optimization, as it requires the simultaneous optimization of multiple transmission corridors. The formal definition is provided below.
where contains the state, algebraic, and control variables of the power system; comprises distinct objective functions for individual corridor TTC calculations. and represent system equality and inequality constraints, respectively, where includes steady-state operational constraints and transient instability constraints. The objective is to identify a set of optimal solutions balancing competing objectives—the Pareto optimal frontier. Figure 1 shows a visualization of the multi-objective decomposition strategy.
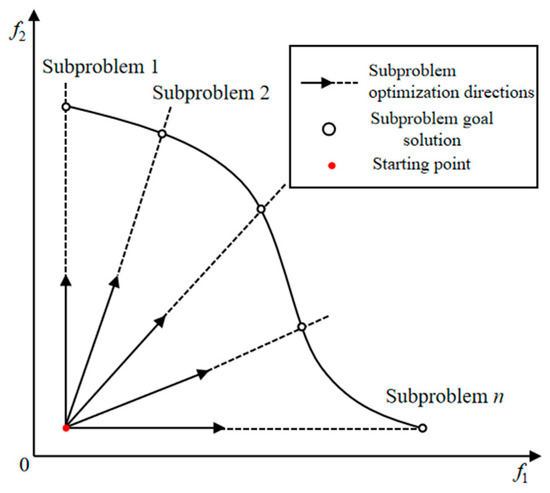
Figure 1.
Multi-objective decomposition.
This paper decomposes the multi-corridor coupled TTC computation problem using the weighted sum method [28], formulated as follows: Let represent a set of uniformly distributed weight vectors, where each vector corresponds to . The ideal point is denoted as . This formulation transforms the multi-objective optimization problem into subproblems, with each subproblem’s objective being the minimization of the following function:
where the ideal point is dynamically updated as the optimal value of objective .
2.2.2. MOEA/D-FRRMAB
Conventional multi-objective optimization algorithms exhibit two key limitations when addressing complex problems: (1) Inflexible operators—The classical MOEA/D employs a single differential evolution (DE) operator, failing to balance exploration and exploitation requirements across different optimization phases. For instance, strong exploratory operators (e.g., DE/rand/1) are needed during initial convergence, while more exploitative operators (e.g., DE/best/1 or DE/current-to-best/1) become crucial when approaching the Pareto front. (2) Inefficient resource allocation—Traditional methods (e.g., NSGA-II and MOEA/D) uniformly distribute computational resources, resulting in significant waste on already-converged or low-potential regions.
These limitations become particularly problematic for multi-corridor coupled TTC computation due to: uncertain interdependencies among corridors, non-adaptive fixed operators, and uniform allocation strategies that ignore the quantitative characterization of corridor coupling relationships by weight vectors. These issues lead to dispersed computational resources and slow convergence to the true Pareto front. To address these challenges, this paper introduces the MOEA/D-FRRMAB algorithm for multi-corridor coupled TTC computation. The general framework of the MOEA/D-FRRMAB algorithm is shown in Figure 2.
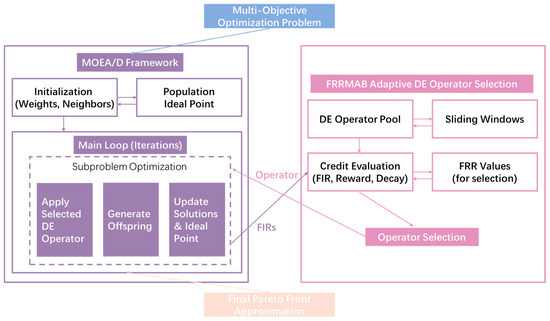
Figure 2.
Framework of MOEA/D-FRRMAB.
MOEA/D-FRRMAB is an enhanced version of MOEA/D that employs multi-armed bandit (MAB) for dynamic DE operator selection [29], enabling adaptive matching with problem characteristics. Additionally, based on Fitness–Rate–Rank (FRR) metrics, it prioritizes the optimization of challenging subproblems and high-potential regions. Specifically, it performs the actions below.
MOEA/D-FRRMAB utilizes a sliding window of fixed size to store the most recent Fitness Improvement Rate (FIR) values for each operator. The FIR for an operator at time , is calculated as
where is the fitness value of the parent solution and is the fitness value of the offspring solution.
For every operator, the sum of all FIR values within its sliding window is computed as the raw reward . To transform raw rewards into rank-aware credit values, the algorithm: (1) ranks all operators based on , (2) applies an attenuation factor raised to the power of to adjust raw rewards, yielding decayed rewards :
and (3) normalizes these values to obtain each operator’s final Fitness–Rate–Rank (FRR) metric. The FRR for an operator at time , is calculated as
Higher FRR values indicate superior operator performance at the current search stage, warranting higher selection priority.
For operator selection, MOEA/D-FRRMAB employs a variant of the Upper Confidence Bound (UCB) algorithm. If there are any operators that have not yet been selected, one is chosen uniformly at random. Otherwise, at time step , the algorithm selects the operator that maximizes the following expression:
where is a constant balancing exploration and exploitation, is the total number of operators, is the number of times operator has been selected up to time , and is the number of times operator has been selected up to time . This strategy ensures a balance between exploiting well-performing operators and exploring less-used ones.
The framework of MOEA/D-FRRMAB for multi-corridor coupled TTC computation is illustrated in Figure 3.
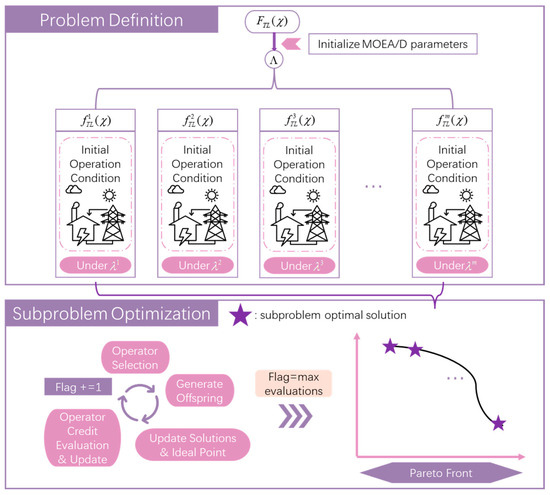
Figure 3.
Multi-corridor coupled TTC computation framework.
3. Results
This study employs the IEEE 39-bus test system. The investigated coupled transmission corridors consist of Corridor 1 (tie-lines 1–39, 2–3, and 18–3) and Corridor 2 (tie-line 15–16), as shown in Figure 4. Operational scenario data were generated through Python-controlled PSASP simulations, version 7.41.04, utilizing its integrated power flow module and transient stability module to verify convergence and perform time-domain stability analysis. The evaluation considers both thermal stability constraints and transient rotor angle stability constraints. A three-phase fault scenario is implemented on tie-line 15–16, initiated at t = 0.1 s and cleared after 0.12 s, with a 5 s transient simulation window. The system uses 100 MW base power, classical generator models including excitation control, and constant-impedance load models. All tests were performed in a hardware environment with an AMD 16-core R9-7945HX CPU (AMD Inc., Santa Clara, CA, USA) and a single RTX 4060 Laptop GPU (NVIDIA, Santa Clara, CA, USA).
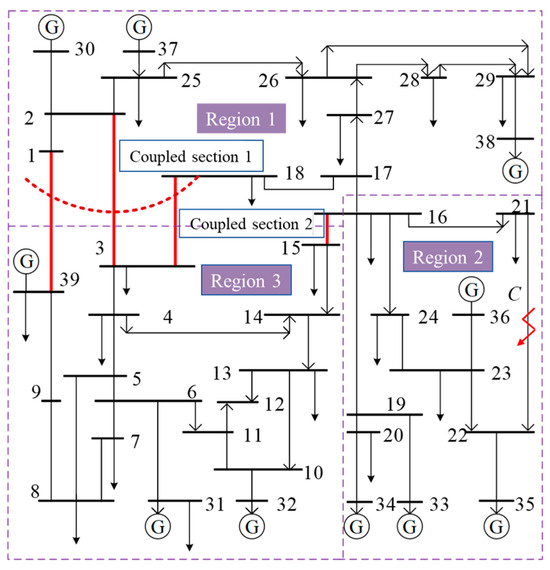
Figure 4.
IEEE 39-bus system.
The hyperparameter values for the MOEA/D-FRRMAB algorithm were adopted from Reference [29], with their specific settings detailed in Table 1.

Table 1.
Hyperparameter for MOEA/D-FRRMAB.
Figure 5 presents the training performance of the first weighted subproblem, with coordinates representing power flows in Corridor 1 and Corridor 2, respectively. The optimization trajectory for the Subproblem is also plotted.
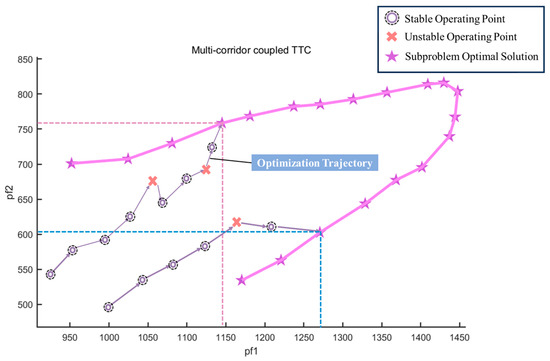
Figure 5.
Subproblem Optimization Results.
To validate the effectiveness of the proposed framework, this paper employed Latin Hypercube Sampling to generate 12,000 operating scenarios, which were then subjected to transient stability verification under consistent fault configurations. These stability-verified sample points, through dense sampling and stability evaluation, collectively illustrate the system’s TTC stable operating boundary on the system operating state plane (as shown in Figure 6). In the figure, circles represent stable operating modes, and crosses represent unstable operating modes. The violet region represents stable operating conditions; the purple region indicates unstable operating conditions; and the chaotic region exhibits interleaved stable and unstable operating states.
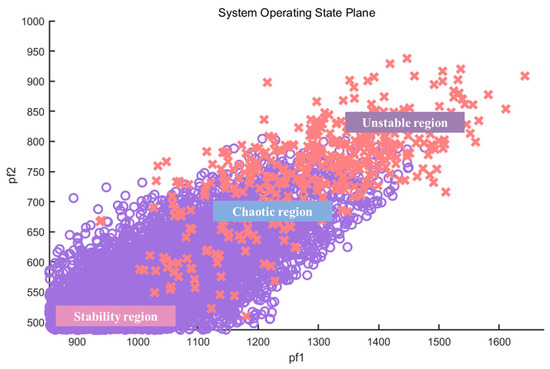
Figure 6.
System operating state plane.
In multi-corridor coupled TTC calculation, the correlation between corridors is a critical factor determining the optimization strategy and the reliability of the results. Neglecting the coupling effects between corridors may lead to a reduction in the feasible region for multi-corridor limit allocation or even result in a lack of feasible operating modes, thereby affecting the accuracy of multi-corridor limit determination. To effectively identify corridor combinations with significant coupling effects and to avoid the issue of “one objective potentially dominating another” in multi-objective optimization, this paper first performs correlation screening on potential coupled corridor combinations before conducting multi-objective TTC calculations.
This study employs the Pearson Correlation Coefficient (PCC) to quantitatively assess the correlation between corridors. The PCC is calculated as follows :
where and are the transmission power sample vectors for Corridor and Corridor , respectively; and are the means of and , respectively; and are the standard deviations of and , respectively; is the covariance of and ; and is the expected value.
Here, we screen for correlated corridor pairs using a criterion where the absolute value of the PCC coefficient is greater than 0.5. It is only meaningful to include corridors in multi-objective optimization when there are actual mutual influences and constraints between them.
For the 12,000 operating scenarios generated by Latin Hypercube Sampling, we calculated the PCC between the power flows of Corridor 1 and Corridor 2. The calculation result yielded a PCC coefficient of 0.8711. This value is significantly greater than 0.5, indicating that the two transmission corridors selected in this paper constitute a strongly correlated coupled corridor pair, representing a genuinely coupled corridor combination. Therefore, after this correlation screening process, the issue of “one of the mentioned objectives might dominate another objective” will not arise when calculating multi-corridor TTC, as all optimized objectives have been confirmed to be mutually influential and exhibit trade-off relationships. This ensures that the multi-objective optimization can effectively explore and characterize the Pareto front formed by these mutually constrained power limits.
Results demonstrate effective convergence to the optimal solution within the proposed framework.
To rigorously validate the superiority of MOEA/D-FRRMAB, this study selects the most widely used multi-objective metaheuristic algorithm as the benchmark, specifically selecting the high-performance NSGA-II algorithm. To ensure statistical reliability, each test case was executed through 20 independent experimental repetitions, with the average results selected for comparative analysis. Figure 7 demonstrates the comparative Pareto frontiers of corridor TTC values between NSGA-II and MOEA/D-FRRMAB.
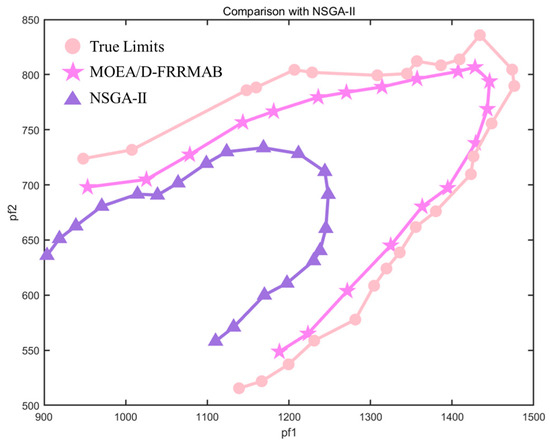
Figure 7.
Comparison of Pareto frontiers obtained by MOEA/D-FRRMAB algorithm and NSGA-II algorithm.
Figure 7 demonstrates that NSGA-II with conventional iteration counts yields a Pareto frontier significantly deviating from actual results, prone to local optima entrapment and exhibiting overly conservative optimization that underutilizes transmission capacity. The MOEA/D-FRRMAB algorithm outperforms NSGA-II in both convergence and diversity, verifying its superior global optimization capability.
Figure 8 provides a detailed visual comparison of the Pareto front performance for both the Proposed Framework and NSGA-II, incorporating statistical metrics derived from 20 independent optimization runs. Specifically, Figure 8a illustrates the performance of the Proposed Framework, while Figure 8b depicts that of NSGA-II. Each subplot presents four distinct Pareto front curves: the average Pareto front, the median Pareto front, the best Pareto front, and the true limits. This comprehensive visualization allows for a robust statistical assessment of not only the algorithms’ best-case performance but, more critically, their consistency and reliability in converging towards the true Pareto front across multiple independent runs.
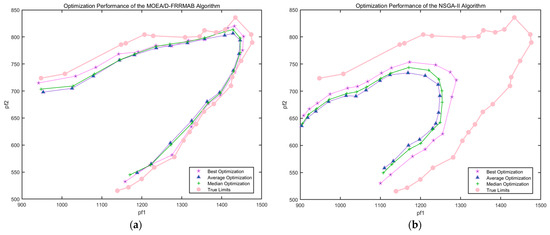
Figure 8.
Comparative Pareto Front Performance: Statistical Metrics and Best Runs. (a) Proposed Framework’s Pareto Front Performance (Average, Median, Best, and True Limits); (b) NSGA-II’s Pareto Front Performance (Average, Median, Best, and True Limits).
Table 2 compares the two algorithms using Average Euclidean Distance (AED) and Root Mean Square Error (RMSE) metrics between the Pareto frontiers and actual TTC boundaries. The results demonstrate that MOEA/D-FRRMAB achieves superior accuracy compared to conventional multi-objective optimization algorithms, achieving a 71.11% reduction in AED and a 67.90% reduction in RMSE compared to NSGA-II, attributable to its FRRMAB mechanism. In complex power system operational domains, standard multi-objective algorithms struggle to balance convergence precision and distribution uniformity of the Pareto frontier. In contrast, FRRMAB adaptively selects operators to dynamically match problem characteristics while optimizing challenging subproblems and high-potential regions, thereby achieving precise Pareto frontier generation.
Table 2.
Comparison of algorithm accuracy metrics and computational time.
We assume represents the true Pareto frontier, composed of N points. Each point is a k-dimensional vector denoting a solution in the k-objective space, expressed as . denotes the Pareto frontier comprising M points generated by the optimization algorithm, where each point is likewise a k-dimensional vector formulated as .
The Euclidean distance between two points and is defined as
In multi-objective optimization, AED typically refers to Generational Distance (GD), which quantifies the average Euclidean distance from each point on the obtained Pareto frontier to its nearest point on the true Pareto frontier. A smaller AED value indicates closer proximity of the obtained frontier to the true frontier, reflecting superior convergence performance. The metric is mathematically expressed as follows:
where M denotes the number of points in the obtained Pareto frontier , while N represents the number of points in the true Pareto frontier . Here, corresponds to the i-th point in and indicates the j-th point in . The term quantifies the minimum Euclidean distance between point and all points in the true frontier .
The RMSE measures the square root of the average squared minimum Euclidean distances from points on the obtained Pareto frontier to their nearest points on the true Pareto frontier. Similarly to AED, RMSE quantifies convergence quality but imposes stronger penalties for larger deviations due to its quadratic term. The metric is mathematically expressed as follows:
4. Discussion
4.1. Sensitivity Analysis
To further strengthen the manuscript’s rigor, this section presents a brief sensitivity analysis of how the main results may change when key stability assumptions are slightly altered. Specifically, we examined a scenario where the fault clearing time was shortened from 0.12 s to 0.08 s and simultaneously the was relaxed from 0.75 pu to 0.7 pu. This combined change represents a set of more lenient stability conditions.
Comparing the TTC limits obtained under these relaxed assumptions with the baseline TTC limits from the case study, as shown in Figure 9, the results clearly indicate a significant outward expansion of the TTC limits. This expansion signifies that under more lenient stability conditions, the system can safely accommodate higher transmission power across the coupled corridors. This finding aligns with power system stability principles, where faster fault clearing and greater tolerance for voltage sags contribute to enhancing overall system operational flexibility.
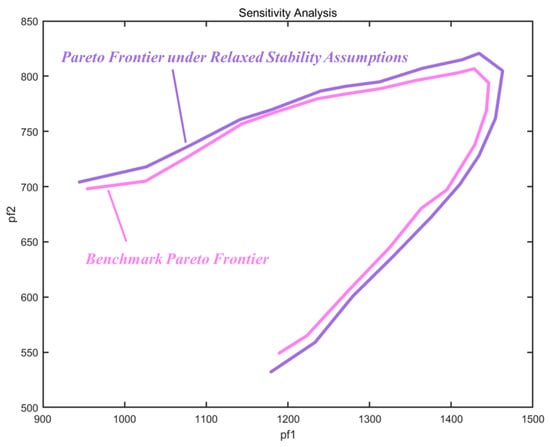
Figure 9.
Comparison of Multi-Corridor TTC Pareto Frontiers under Benchmark and Relaxed Stability Assumptions.
Overall, this brief sensitivity analysis demonstrates that while the absolute values and extent of the stable operating region are sensitive to changes in stability assumptions, the fundamental shape of the TTC limits and the identified coupling characteristics remain consistent. This underscores the importance of accurately defining stability criteria in practical applications and highlights the adaptability of the proposed framework to various operating scenarios.
4.2. Algorithm Scalability Analysis
To further validate the scalability and applicability of the proposed framework in handling larger-scale power system problems, this paper additionally selected the IEEE 68-bus system for testing. The IEEE 68-bus system, as a medium-scale test system, has a significantly greater number of buses and lines than the IEEE 39-bus system, which allows for better simulation of complex grid environments. The investigated coupled transmission corridors consist of Corridor 1 (tie-lines 1–27) and Corridor 2 (tie-line 9–8 and 30–3). In the figure, black arrows represent the direction of the corridors’ power flow, as shown in Figure 10. A three-phase fault scenario is implemented on tie-line 1–27, initiated at t = 0.1 s and cleared after 0.12 s, with a 5 s transient simulation window. The system uses 100 MW base power, classical generator models including excitation control, and constant-impedance load models.
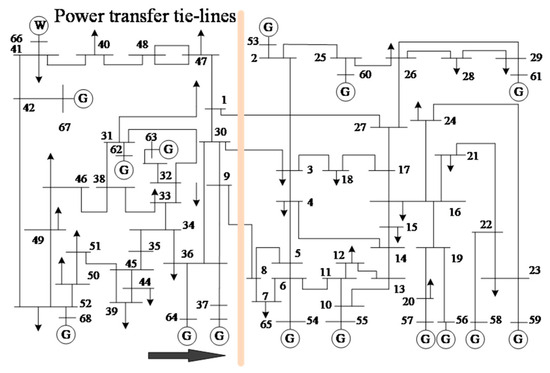
Figure 10.
IEEE 68-bus system.
Using Latin Hypercube Sampling, 12,000 operating scenarios were generated. As depicted in Figure 11, the operating space is presented, along with a comparison between the Pareto front obtained by the proposed framework and the true TTC limits derived from sampling. This indicates that the MOEA/D-FRRMAB algorithm can still effectively converge and generate a Pareto front with good distribution and convergence on the IEEE 68-bus system, successfully identifying the multi-corridor coupled TTC limits.
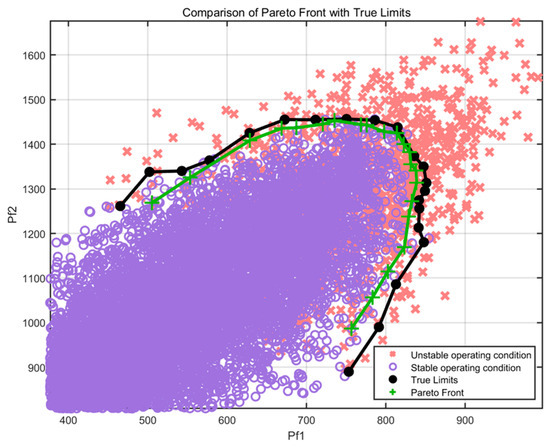
Figure 11.
Comparison of Pareto Front with True Limits.
These results strongly suggest demonstrate that the proposed framework is not only applicable to small to medium-sized test systems but also exhibits excellent scalability and computational capability when handling the larger-scale IEEE 68-bus system, thereby providing strong support for practical power grid applications.
5. Conclusions
Accurate computation of transmission corridor power limits considering inter-corridor correlations plays a pivotal role in power system security and stability analysis. Addressing these critical requirements, this paper proposes a MOEA/D-FRRMAB-based methodology for multi-corridor coupled TTC calculation, yielding the following key findings:
- (1)
- Propose a novel transmission corridor TTC calculation model that incorporates multiple stability constraints and hybrid operational resources. Building upon this foundation, we further develop a multi-corridor coupled TTC computation model that explicitly accounts for inter-corridor dependencies.
- (2)
- To address the limitations of conventional metaheuristics in handling model non-convexity, nonlinearity, and multi-objective conflicts, this study introduces the MOEA/D-FRRMAB algorithm. Through its unique FRRMAB mechanism, the algorithm effectively balances solution convergence accuracy and distribution uniformity. Experimental validation on the IEEE 39-bus system demonstrates that compared to the high-performance multi-objective metaheuristic NSGA-II, MOEA/D-FRRMAB shows remarkable advantages in Pareto frontier generation quality, achieving a 71.11% reduction in AED and a 67.90% decrease in RMSE.
Author Contributions
Conceptualization, Z.S.; Methodology, J.Z.; Data curation, J.Z.; Writing—original draft, J.Z.; Writing—review & editing, W.S. and L.W.; Supervision, W.S. and L.W. All authors have read and agreed to the published version of the manuscript.
Funding
This work was supported by the State Grid Hebei Electric Power Co., Ltd. Cangzhou Power Supply Branch (the funder) through its Science and Technology Project under Grant 5204CZ240009.
Data Availability Statement
The data used in this study were generated through simulation based on the standard IEEE 39-bus and IEEE 68-bus systems. All simulation parameters and configurations are fully described within the article. No external datasets were used or generated.
Conflicts of Interest
Authors Zengjie Sun, Wenle Song and Lei Wang were employed by the company State Grid Hebei Electric Power Co., Ltd. The remaining authors declare that the research was conducted in the absence of any commercial or financial relationships that could be construed as a potential conflict of interest.
Nomenclature
| Sets | |
| Set of corridors. | |
| Set of all nodes. | |
| Set of all generators. | |
| Set of tie-lines. | |
| Set of all reactive power compensation nodes. | |
| Parameters | |
| Transient process start time. | |
| Transient process end time. | |
| The voltage threshold for node i. | |
| Allowable duration of the minimum bus voltage below during the post-fault transient process. | |
| Critical voltage deviation factor. | |
| The current capacity limit of line . | |
| Upper limit of active power output for generator i. | |
| Lower limit of active power output for generator i. | |
| Upper limit of reactive power output for generator i. | |
| Lower limit of reactive power output for generator i. | |
| Upper limit of voltage for bus i. | |
| Lower limit of voltage for bus i. | |
| The unit capacity of switched capacitors. | |
| The upper limits of capacitor banks at node i. | |
| The lower limits of capacitor banks at node i. | |
| The maximum allowable capacitor capacity at node i. | |
| Variables | |
| The power transmission along corridor . | |
| The active power outputs of generator i. | |
| The reactive power outputs of generator i. | |
| The injected power from reactive power compensation devices. | |
| The active loads at node i. | |
| The reactive loads at node i. | |
| The voltage magnitude at node i. | |
| The phase angle at node i. | |
| The magnitude of the bus admittance matrix elements. | |
| The angle of the bus admittance matrix elements. | |
| The rotor angle of generator i. | |
| Transient rotor angle stability index. | |
| The minimum post-fault transient voltage at node i. | |
| The total duration of voltage below . | |
| The time step when for the j-th occurrence. | |
| The restored steady-state voltage at node i. | |
| The 0-1 integer variable for capacitor switching. | |
| The number of capacitor banks switched at node i. |
References
- Medina, C.; Ana, C.R.M.; González, G. Transmission grids to foster high penetration of large-scale variable renewable energy sources–A review of challenges, problems, and solutions. Int. J. Renew. Energy Res. (IJRER) 2022, 12, 146–169. [Google Scholar]
- Alam, M.S.; Al-Ismail, F.S.; Salem, A.; Abido, M.A. High-Level Penetration of Renewable Energy Sources into Grid Utility: Challenges and Solutions. IEEE Access 2020, 8, 190277–190299. [Google Scholar] [CrossRef]
- Impram, S.; Nese, S.V.; Oral, B. Challenges of renewable energy penetration on power system flexibility: A survey. Energy Strategy Rev. 2020, 31, 100539. [Google Scholar] [CrossRef]
- Fang, Y.; Cui, X.; Wang, S.; Huanf, Z. Coordinated limit power calculation of multi-sections with transient stability limit coupling. Autom. Electr. Power Syst. 2015, 39, 53–58. [Google Scholar]
- Liu, X.; Min, Y.; Chen, L.; Zhang, X.; Feng, C.; Hu, W. A pragmatic method to determine transient stability constrained interface real power flow limit via power system scenario similarity. CSEE J. Power Energy Syst. 2019, 6, 131–141. [Google Scholar] [CrossRef]
- Transmission Transfer Capability Task Force. Available Transfer Capability Definitions and Determination; North American Electric Reliability Council: Princeton, NJ, USA, 1996. [Google Scholar]
- Mohammed, O.O.; Mustafa, M.W.; Mohammed, D.S.S.; Otuoze, A.O. Available transfer capability calculation methods: A comprehensive review. Int. Trans. Elect. Energy Syst. 2019, 29, e2846. [Google Scholar] [CrossRef]
- State Grid Dispatching Center. Preparation Process of National Power System Operation Mode; State Grid Dispatching Center: Beijing, China, 2021. (In Chinese) [Google Scholar]
- Wang, Z.; Zhou, Y.; Guo, Q.; Sun, H.; Yan, Z.; Yang, K. Active transfer learning for TTC assessment of transmission interfaces with changing operating scenarios. Proc. CSEE 2023, 43, 5732–5744. [Google Scholar]
- Wang, F.; Wang, H.; Yu, X.; Zhang, Z.; Chen, Q.; Yang, L. Section power sensitivity control considering out-of-limit degrees. Power Syst. Technol. 2023, 47, 3847–3854. [Google Scholar]
- Li, W.; Vaahedi, E.; Lin, Z. BC Hydro’s Transmission Reliability Margin Assessment in Total Transfer Capability Calculations. IEEE Trans. Power Syst. 2013, 28, 4796–4802. [Google Scholar] [CrossRef]
- Cheng, H.; Li, J.; Wu, Y.; Chen, H.; Zhang, N.; Liu, L. Challenges and prospects for AC/DC transmission expansion planning considering high proportion of renewable energy. Autom. Electr. Power Syst. 2017, 41, 19–27. [Google Scholar]
- Tinney, W.F.; Wang, X.; Frame, J.G.; Waight, J.G.; Tong, J.; Ejebe, G.C. Available transfer capability calculations. IEEE Trans. Power Syst. 1998, 13, 1521–1527. [Google Scholar] [CrossRef]
- Ilic, M.; Galiana, F.; Fink, L.; Bose, A.; Mallet, P.; Othman, H. Transmission capacity in power networks. Int. J. Electr. Power Energy Syst. 1998, 20, 99–110. [Google Scholar] [CrossRef]
- Hou, Q.; Zhang, N.; Kirschen, D.S.; Du, E.; Cheng, Y.; Kang, C. Sparse oblique decision tree for power system security rules extraction and embedding. IEEE Trans. Power Syst. 2021, 36, 1605–1615. [Google Scholar] [CrossRef]
- Yu, L.; Wu, X.; Cheng, L.; Li, X. Transmission section limit power calculation based on improved-inspired bat algorithm. J. Phys. Conf. Ser. 2023, 2592, 012082. [Google Scholar] [CrossRef]
- Xu, T.; Bao, Y.; Su, Y.; Zhang, J.; Ren, X.; Yao, H. Calculation of power limit interval and correlation degree for transient stability section. Autom. Electr. Power Syst. 2016, 40, 154–160. [Google Scholar]
- Zhang, D.; Wang, B.; Guo, H.; Chu, Z.; Yang, H.; Ma, Y. A method of identifying a transmission section based on topology aggregation and the transmission limit of the section. Power Syst. Prot. Control 2022, 50, 33–42. [Google Scholar]
- Bai, S.; Zhang, J.; Bao, Y.; Meng, J.; Xu, W.; Tian, Z. On-line limit power calculation of correlative transmission section considering new energy consumption. Power Syst. Technol. 2020, 44, 3717–3724. [Google Scholar]
- Wang, Z.; Xiao, F. Calculation method of DC limit power considering influence of new-generation synchronous condensers. J. Phys. Conf. Ser. 2021, 2022, 012004. [Google Scholar]
- Soares, T.; Bessa, R.J.; Pinson, P.; Morais, H. Active distribution grid management based on robust AC optimal power flow. IEEE Trans. Smart Grid 2018, 9, 6229–6241. [Google Scholar] [CrossRef]
- Liu, Z.; Song, E.; Ma, C.; Yao, C.; Song, T. Multi-objective optimization of a dual-fuel engine at low and medium loads based on MOEA/D. In Proceedings of the 2022 34th Chinese Control and Decision Conference (CCDC), Hefei, China, 15–17 August 2022; pp. 1655–1661. [Google Scholar]
- Ge, X.; Xiao, C.; Jiang, D.; He, M.; Zhang, Y.; Piao, Z. An Enhanced MOEA/D Algorithm for Optimal Charging of Electric Vehicle Populations Considering Traffic and Power Grid Factors. In Proceedings of the 2025 9th International Conference on Green Energy and Applications (ICGEA), Singapore, 7–9 March 2025; pp. 77–81. [Google Scholar]
- Zhang, H.; Yue, D.; Yue, W.; Li, K.; Yin, M. MOEA/D-Based Probabilistic PBI Approach for Risk-Based Optimal Operation of Hybrid Energy System With Intermittent Power Uncertainty. IEEE Trans. Syst. Man Cybern. Syst. 2021, 51, 2080–2090. [Google Scholar] [CrossRef]
- Xia, S.; Luo, X.; Chan, K.W.; Zhou, M.; Li, G. Probabilistic Transient Stability Constrained Optimal Power Flow for Power Systems With Multiple Correlated Uncertain Wind Generations. IEEE Trans. Sustain. Energy 2016, 7, 1133–1144. [Google Scholar] [CrossRef]
- Li, K.; Qiu, G.; Liu, T. Transmission Limit Calculation of Corridors Based on Transferable Reinforcement Learning. Power Syst. Technol. 2023, 47, 5147–5157. [Google Scholar]
- China Southern Power Grid Power Dispatching and Communication Center. Southern Power Grid Safety and Stability Calculation and Analysis Guidelines: Q/CSG 11004—2009; China Southern Power Grid Power Dispatching and Communication Center: Guangzhou, China, 2009. (In Chinese) [Google Scholar]
- Chen, J.; Zhang, Z.; Cao, Z.; Wu, Y.; Ma, Y.; Ye, T.; Wang, J. Neural Multi-Objective Combinatorial Optimization with Diversity Enhancement. arXiv 2023, arXiv:2310.15195. [Google Scholar] [CrossRef]
- Li, K.; Fialho, Á.; Kwong, S.; Zhang, Q. Adaptive Operator Selection With Bandits for a Multiobjective Evolutionary Algorithm Based on Decomposition. IEEE Trans. Evol. Comput. 2014, 18, 114–130. [Google Scholar] [CrossRef]
Disclaimer/Publisher’s Note: The statements, opinions and data contained in all publications are solely those of the individual author(s) and contributor(s) and not of MDPI and/or the editor(s). MDPI and/or the editor(s) disclaim responsibility for any injury to people or property resulting from any ideas, methods, instructions or products referred to in the content. |
© 2025 by the authors. Licensee MDPI, Basel, Switzerland. This article is an open access article distributed under the terms and conditions of the Creative Commons Attribution (CC BY) license (https://creativecommons.org/licenses/by/4.0/).