Article

Development of a Load Monitoring Sensor for the Wire Tightener

1
Qujing Power Supply Bureau, Yunnan Power Grid Co., Ltd., Qujing 655000, China
2
School of Electronic and Electrical Engineering, Chongqing University of Science and Technology, Chongqing 401331, China
*
Author to whom correspondence should be addressed.
Electronics 2025, 14(18), 3716; https://doi.org/10.3390/electronics14183716
Submission received: 30 July 2025 / Revised: 15 September 2025 / Accepted: 17 September 2025 / Published: 19 September 2025

Abstract

The wire tightener is a critical tool in the construction and maintenance of power lines. Failure to detect tension overload in a timely manner may lead to plastic deformation or even breakage of the tool, potentially causing serious safety accidents. To address this issue, a force monitoring sensor was developed to track the real-time load on wire tighteners. In terms of hardware design, a foil strain gauge was integrated with an ultra-low-power mixed-signal microcontroller based on the mechanical characteristics of the wire tightener, enabling accurate acquisition and processing of load data. Low-power LoRa technology was employed for wireless data transmission, and an adaptive sleep–wake strategy was implemented to optimize power efficiency during data collection. The sensor’s material, geometry, and structure were tailored to the tool’s composition and working environment. Experimental results showed that the average relative error between the sensor readings and the reference values was less than 0.5%. The sensor has been successfully deployed in practical engineering applications, consuming approximately 4500 mWh over an 8 h continuous monitoring period.

1. Introduction

The reliability and safety of power systems are of higher and higher requirements in modern society. In order to reduce the times of power outages, live working technology which allows failure-preventive interventions and possible maintenance work on transmission lines without de-energizing has been widely applied [1]. Usually, the live working is completed with live working tools, such as a wire tightener and insulated stick. The wire tightener is often used for tightening wires during the replacement of the insulators. When operating the wire tightener, attention should be paid to avoid sudden breakage or failure of wires, hooks, or other parts of the tools that could result in safety accidents. At the same time, the tools should be maintained regularly to ensure the correct working condition. However, according to the standard, the mechanical test cycle for live working tools is once every two years [2]. Before the next test, the condition of the tools is mainly assessed by the operator’s observation that resulted in the effects caused by the overload, and so could not be detected in time. The risk factors in live working includes incorrect operation of personnel, bad weather, poor condition tools, etc. To avoid the incorrect operation of personnel, the monitoring and alarm methods based on the detection of hazardous actions in live working were applied [3]. However, there are few works on monitoring the condition of tools to prevent the failure of the tools. As a tool often used in live work, it is important to measure the load of the wire tightener in real time and warn the operator in case of overload.
In practice, accurate strain measurement is critical for structural health monitoring (SHM), material science, and industrial applications. Strain measurement quantifies deformation in materials under stress, providing insights into mechanical behavior and structural integrity. Typical technologies include resistance strain gauges (RSGs) [4,5], optical fiber sensors (OFSs) [6,7], nanomaterial-based sensors [8,9,10,11], and digital image technologies [12,13]. Advancements in sensor technology have enabled modern power equipment to integrate strain sensors for real-time load measurement. To timely reflect the actual load-bearing capacity of bearing tools in the transmission line, and avoid the occurrence of overload or over-traction in the lifting and taking up of lines, an intelligent bearing tool composed of a resistance strain-type force transducer, A/D converter, single-chip microcomputer, and other components was designed, which can monitor the load of the bearing tool and realize the construction safety control. But the load data can only be observed on a local OLED screen, and the battery life is about 6 h [14]. To check or real-time monitor the sags in transmission lines, an early warning system of a tightening conductor for high-voltage transmission line construction was designed to guide the tension line design and tight line construction. The system obtains the span and elevation difference by GPS. Sensors are used in the construction process for the dynamic measurement of the line end node stress and angle. Bluetooth and GPRS communication protocols were carried out to realize the real-time feedback of information: Bluetooth was designed for local area data transmission and GPRS for a wide area. However, the power supply method of the system and the length of time it could continue to work have not been discussed [15]. To evaluate the ice-covered equivalent thickness, a tension sensor based on FBG was applied in the icing thickness monitoring of a 110 kV transmission line. The tension sensor was installed on the transmission tower and connected with an insulator string. The weights of the insulator string, transmission line, and covered ice were collected by the sensor and transmitted to the monitoring master via the fiber optic cable of the optical fiber composite overhead ground wire (OPGW). In this case, the sensor is a passive component and the challenges associated with the power supply no longer exist. However, this situation is only suitable for the sensors that are fixed on the infrastructure, such as the transmission tower, and the lack of temperature compensation resulted in an icing thickness error. At the same time, expensive spectra analyzing equipment is another consideration when applying the FBG sensor [16]. In order to solve the problem of safety accidents caused by the overload and the disconnection of the ropes of the inner suspension pole during the assembly process of the power transmission tower, a sensor suitable for monitoring the force of the inner suspension pole group tower ropes was developed. The low-power ZigBee technology was used to complete the wireless transmission of monitoring data. The sensor adopts a low-power working mode and consumes 24% of the electricity during the 6-day monitoring process of the entire base iron tower assembly [17]. However, the penetration capability of a single ZigBee module is weak; to increase the penetration distance, more routing nodes need to be added. This limits the use of ZigBee in urban distribution networks, where buildings may block signal transmission [18].
The sensors work well in the given scenario and the occurrence of accidents have been reduced to some extent. However, to measure the mechanical status of a given tool, we need to consider the specific characteristics of the tool and its operation conditions. In this paper, a load monitoring sensor was developed to measure the stress forced on the wire tightener, which is often used in live working. The structure of the wire tightener and its operation environment were taken into consideration. The sensor integrated the functions of load monitoring and wireless data transmission, as well as the characteristics of being water proof, sturdy, and easy to assemble with the wire tightener.

2. Load Monitoring Sensor Functional Analysis

2.1. The Application Scenarios of Tighteners in Power System

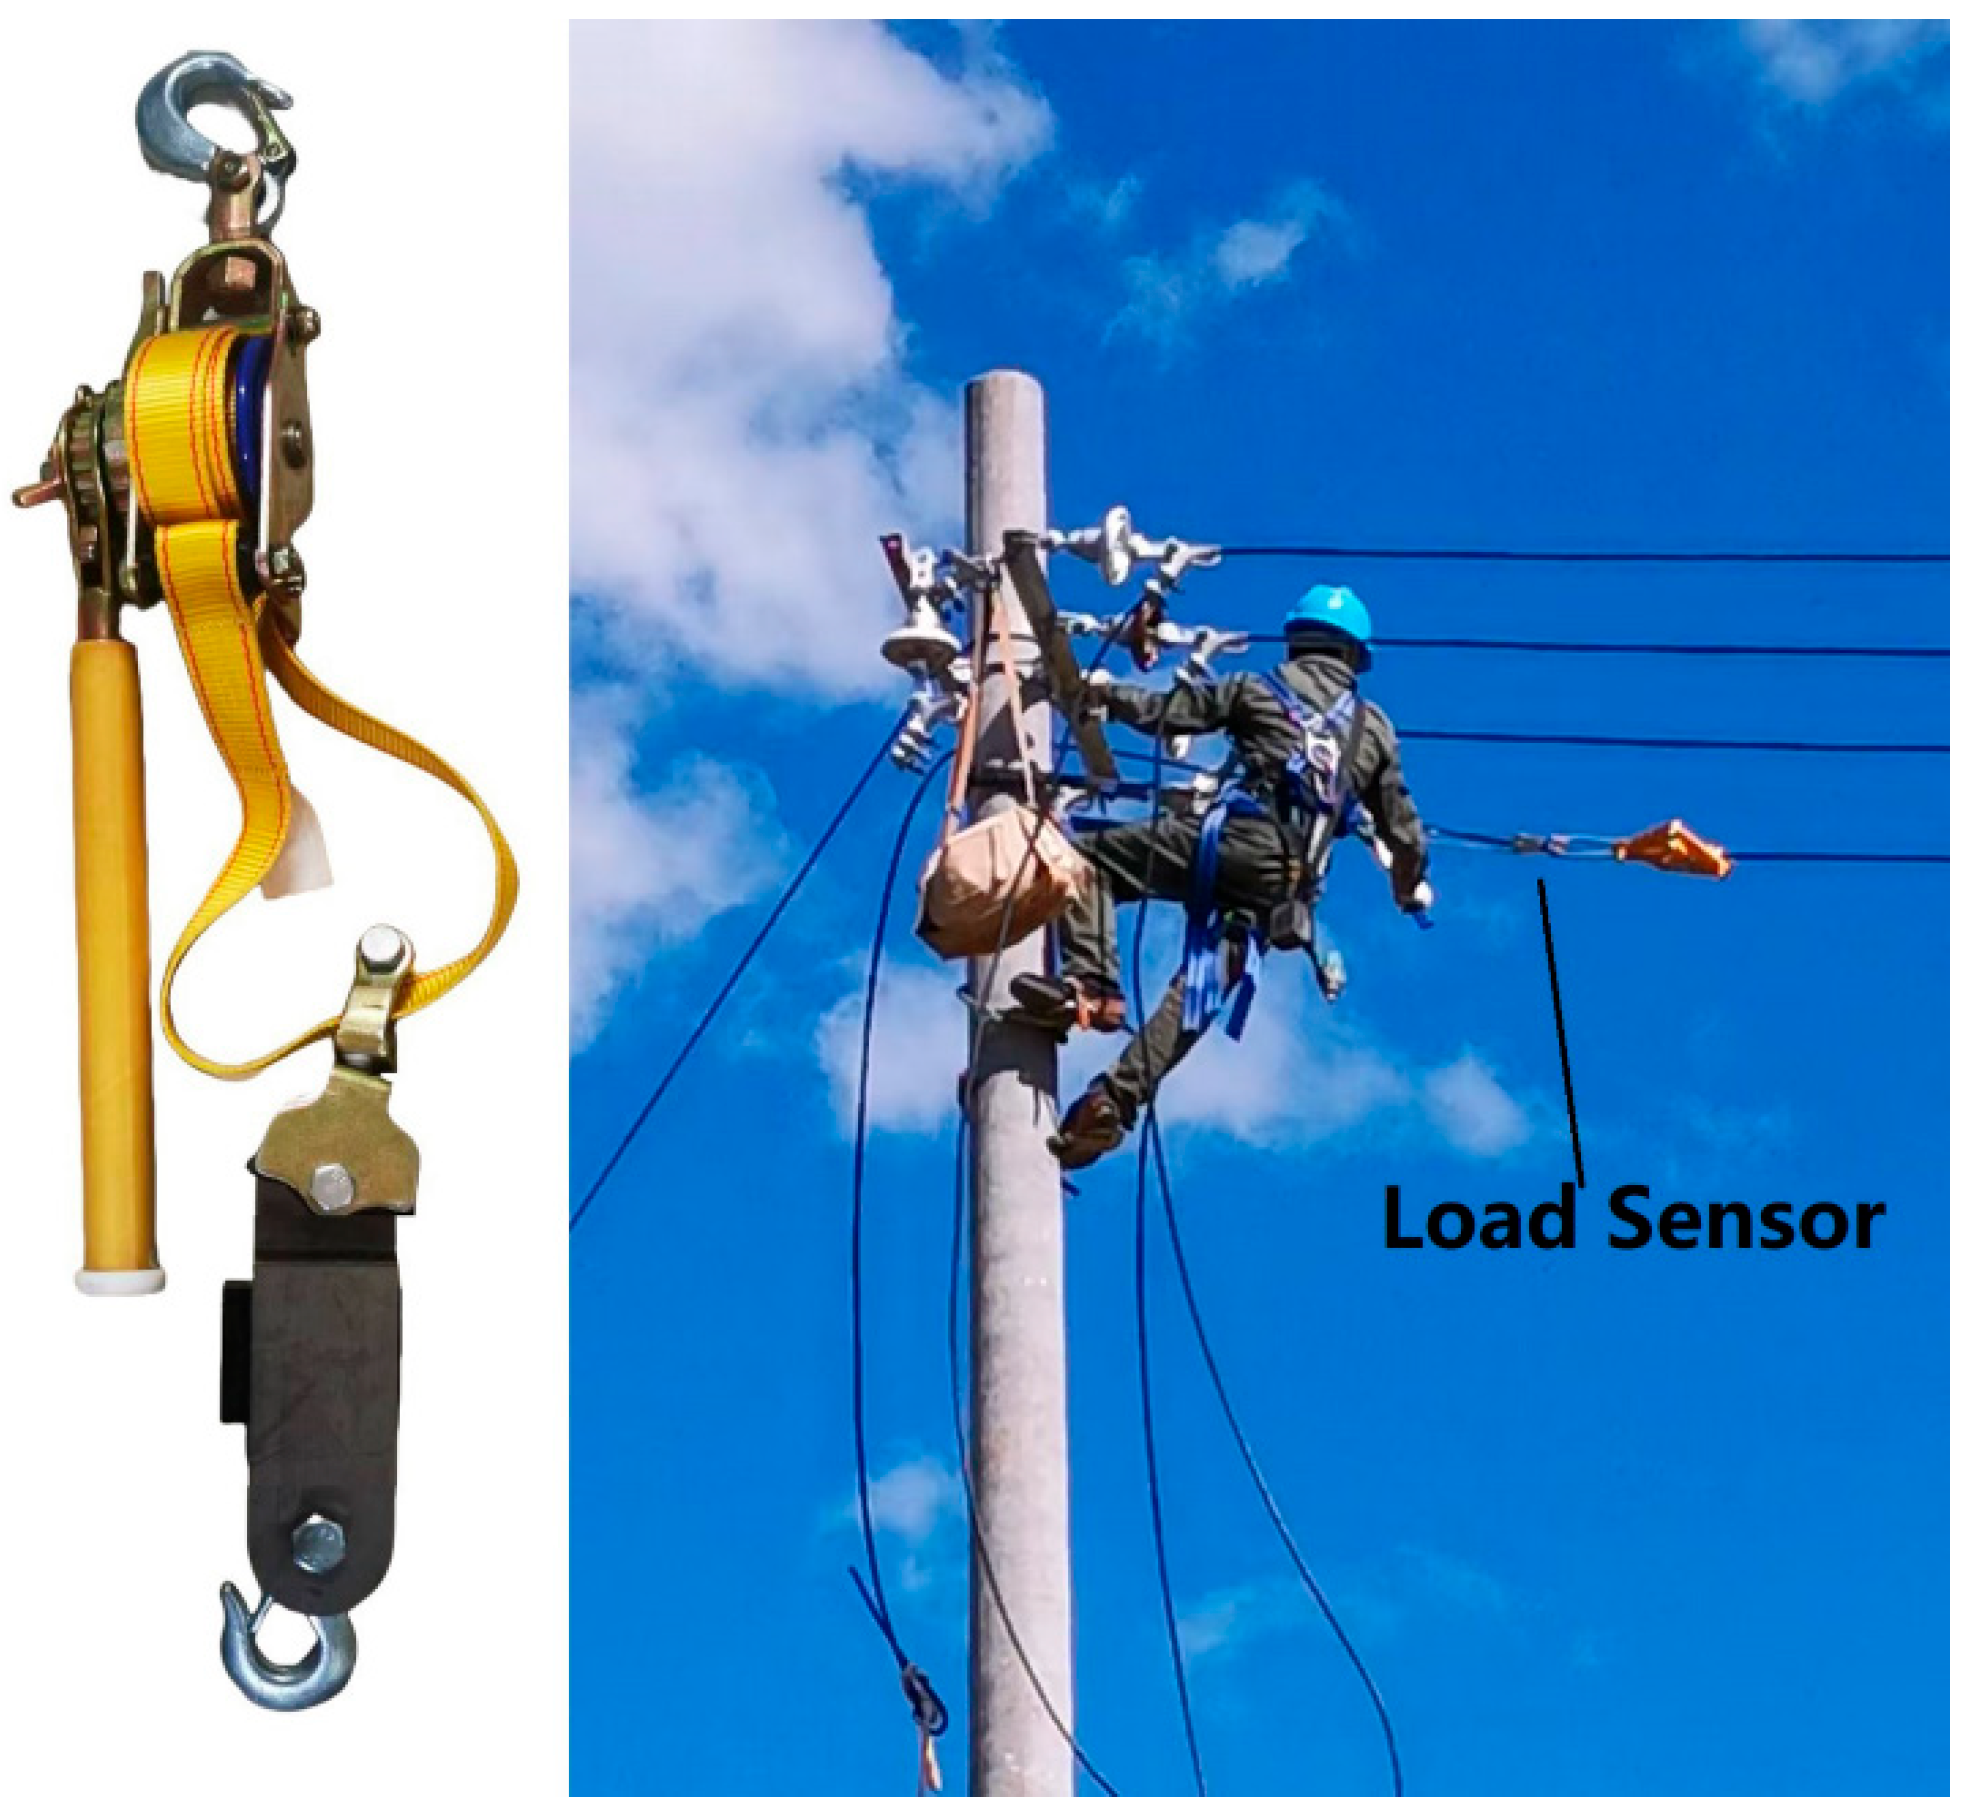
Live working in power systems includes replacing the cross-arm, replacing the insulator or insulator string, the disconnection/connection of the wire, and so on. In these cases, wire tighteners, as shown in Figure 1, were used to tension wires. During use, one of the end hooks is fixed on the cross-arm or hoop, and the web strap on the drum casting is loosened to clamp the wire with the wire clamp. Then, by pulling the special wrench or handle, the web strap is wound on the drum to gradually tighten the wire. Due to the anti-reversal effect of the ratchet and pawl, the wire connected to the cross-arm or insulator can be unfastened, and all the weight of the wire is forced on the wire tighteners until the pawl is loosened. The weight of the wire is different depending on the voltage level and capacity of transmission lines, from several hundreds of kilograms to several tons. During live working, if the load exceeds the rating value, it will cause damage, even the breakage of the wire tighteners. Therefore, installing sensors at the connections between the idler roller and web strap for load monitoring and warning when overloaded could effectively enhance the safety and reliability of live working.
The operation conditions of the sensor and wire tighteners depend on the limitation of the live working. According to the standard, live working on transmission lines should be conducted in favorable weather. Work should be avoided when wind speeds exceed 10 m/s and relative humidity exceeds 80%. Live working is strictly prohibited during thunderstorms, rain, snow, or heavy fog [19]. In live working, the current flowing through the transmission lines will heat the conductor. The maximum permissible operating temperature for steel-core aluminum stranded wire and tubular conductors is +80 °C. Therefore, the sensor shall operate reliably with the specified operating temperature range of 0 °C to +80 °C, relative humidity below 80%, and altitude below 2 km. Furthermore, in live working, the tools may be deployed across transmission lines spanning distances exceeding hundreds of meters. To monitor the status of the tools simultaneously, robust long-distance data transmission capabilities are essential.

2.2. Demand Analysis for Load Monitoring Sensor

The load monitoring sensor is used to measure the load forced on the wire tightener to prevent equipment damage or personal injury caused by overloading. Therefore, the functional requirements of the sensor should be formulated based on the working environment and stress characteristics of the wire tightener. The functional requirements of the sensor are listed as follows.
Firstly, the safety and stability of the operator when using the wire tightener must be fully considered. To avoid the tool breaking due to the installation of the sensor, the stability and reliability of the sensor must be ensured. At the same time, the material used for the sensor must be wear-resistant and corrosion-resistant, accounting for the long-term outdoor operation of the wire tightener in harsh working environments.
Secondly, to facilitate not only the load monitoring for the operator but also the participation of on-site technical staff in related decision-making processes, the selection of wireless transmission is necessary for data acquisition and transmission. To ensure the sensor can be usable throughout the live working, the sensor is designed with a low-power operational mode featuring automatic sleep and timed wake-up functions to extend battery life and improve overall system reliability.
Lastly, the sensor should be designed with ease of disassembly to meet the demand of flexible application across various tools and working environments. Additionally, given the demand of the sensor to be reusable, the sensor should be designed to be chargeable and to provide long-lasting endurance. This capability together with the low-power operational mode are designed to meet the demand of endurance in standard live working to improve the utilization efficiency and economic viability of the sensors.

2.3. Design Process of Load Monitoring Sensor

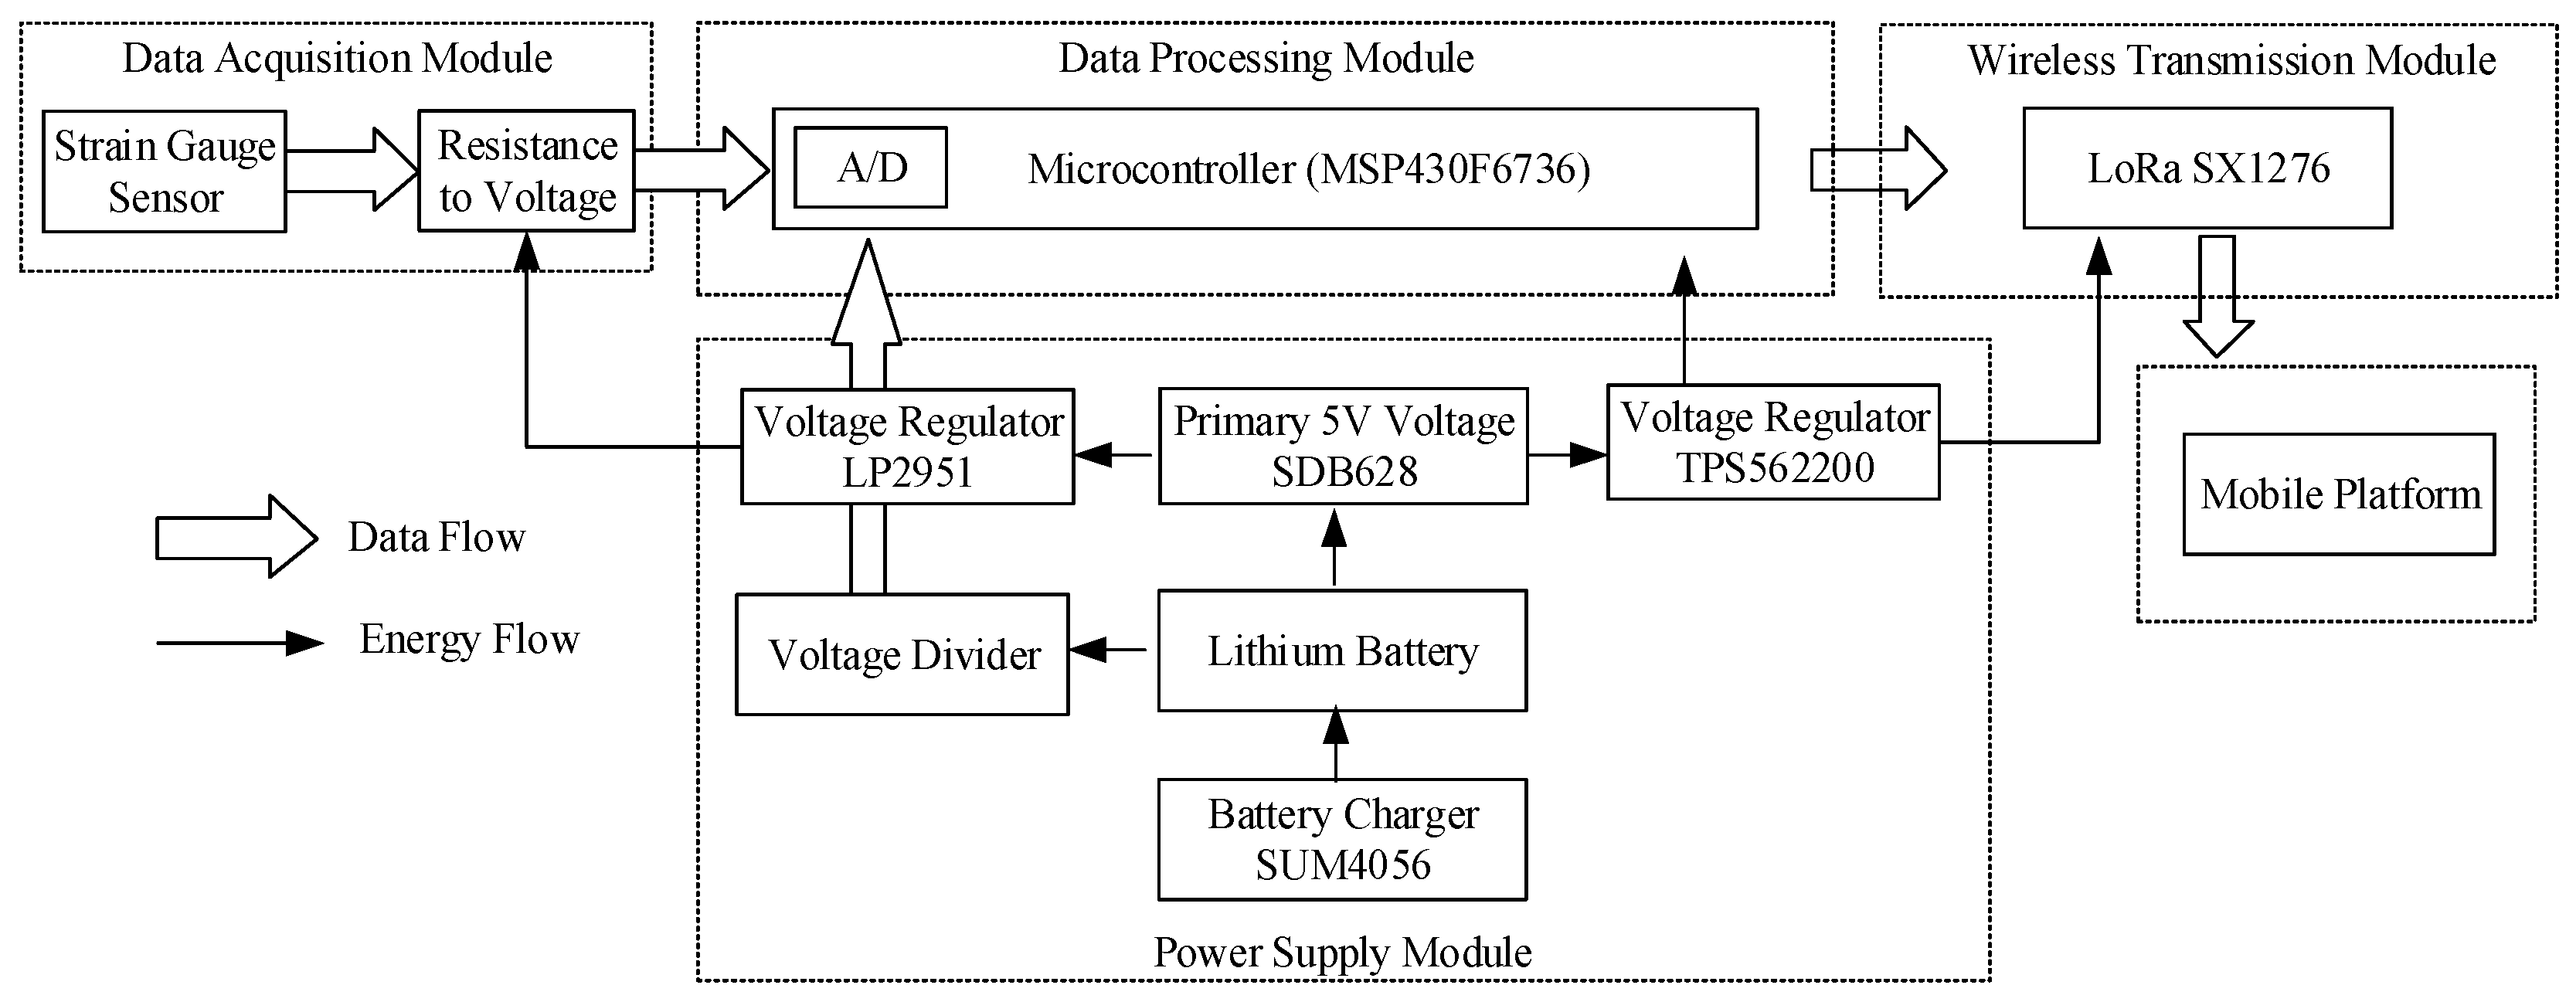
Under the category of meeting the functional demand, the sensor design process is divided into three main steps: hardware design, software design, and mechanical/structure design. The hardware of the sensor comprises four modules: the sensing/acquisition module, data processing module, communication module, and power supply module. These modules are internally encapsulated within the sensor to achieve the collection, processing, and transmission of load data.
Firstly, to ensure the practicality of the sensor, it is essential to guarantee that the load sensor can be easily and securely assembled with the wire tightener. Additionally, the sensor’s tensile strength must significantly exceed the tensile force experienced by the wire tightener during operations to ensure reliability and safety in high-stress conditions. Finally, in the mechanical/structural design step, it is also crucial to ensure that all hardware components can be effectively encapsulated to protect the internal circuitry from external environmental influence.

3. Sensor Hardware Design

3.1. Data Acquisition Module

Due to the characteristics of high linearity, small hysteresis and creep, diversified structural design, and relatively low cost, the resistance strain gauge was selected as the key component of the data acquisition module. The principle of the data acquisition module in the sensor is to convert the strain caused by the load of the wire tightener into electrical signals which can be recognized by electronic devices. The acquisition module employs a strain gauge which converts a change in dimension to a change in electrical resistance. When external forces are applied to a stationary object, stress and strain are the result, where strain is the physical displacement and deformation that occurs. With the strain gauge being bonded to it, the electrical resistance of the strain gauge’s metallic grid changes in proportion to the amount of strain experienced by the object. The ratio of mechanical strain to electrical resistance is what is known as the gauge factor. The relationship between the change in resistance of the strain gauge and the strain at the measured location can be expressed by the following equation:
R = R 0 · k · ε
where ΔR is the change in resistance of the strain gauge, R0 is the initial resistance of the strain gauge, k is the sensitivity coefficient of the strain gauge, and ε is the strain produced at the measured location caused by force.
Strain gauges come in many different shapes, sizes, and patterns depending on the parameter being measured. By arranging the strain gauges in various configurations, strain can be accurately measured. The Wheatstone bridge is the most common configuration, which is a four-element circuit configured in a diamond-shaped schematic. When external forces cause a change in resistance of the strain gauge, the bridge becomes unbalanced and outputs a voltage signal proportional to the strain [20]. When an excitation voltage is applied to the +Vin and −Vin terminals, a differential voltage proportional to the strain magnitude will be generated at the +Vout and −Vout terminals, as shown in Figure 2 [21].
In the full-bridge configuration, the change in output voltage is directly proportional to the strain. The output voltage of the Wheatstone bridge can be expressed as
V o u t = V i n k ε
where Vout is the output differential voltage, Vin is the excitation voltage, k is the sensitivity coefficient, and ε is the strain value.
Typically, the strain gauges are classified into two main categories: metallic resistance strain gauges and semiconductor resistance strain gauges. The sensing grid, which serves as the core component of a strain gauge, can be further divided into three types: wire type, foil type, and thin-film type. A comparison of these three different strain gauges is presented in Table 1 [4,5,22]. Among these three types of strain gauges, foil strain gauges exhibit significant advantages in the thickness of the sensitive grid, performance, and sensitivity (gauge factor). The sensitive grid thickness of foil strain gauges is moderate (0.003–0.01 mm), which provides foil strain gauges with the characteristic of high precision, good heat dissipation, and low hysteresis, and makes foil strain gauges suitable for various complex environments. In contrast, wire strain gauges have the characteristics of a simple structure and low cost but suffer from low sensitivity and poor stability. Semiconductor strain gauges offer extremely high sensitivity but are hindered by poor stability and significant nonlinearity. The sensitivity factor of foil strain gauges ranges from 2 to 5, which makes it balanced between sensitivity and nonlinearity, and foil strain gauges demonstrate an excellent stability in long-term use. Therefore, in terms of accuracy, reliability, and environmental adaptability, foil strain gauges outperform both wire and semiconductor strain gauges. It is the ideal choice for the long-term load monitoring of wire tighteners.
The acquisition module used in this paper is a foil-type full-bridge strain gauge. The small changes in resistance are converted into changes in voltage through signal amplification, which can be directly recognized by the detection device to measure the stress [23]. Therefore, the strain gauge bending module can be applied to measure stress changes in both the positive and negative directions. The main technical parameters, such as substrate material, excitation voltage, resistance, sensitivity, and grid dimensions, of the strain gauge used in this paper are listed in Table 2. When the excitation voltage is 5 V and the maximum strain range of the strain gauge is 10,000 µε in the full-bridge configuration, the deformation relative to the original length is 0.01, resulting in an output voltage of 100 mV.

3.2. Data Processing Module

The output voltage signals of the data acquisition module must be converted into digital signals before they can be processed and transmitted. In this paper, the ultra-low-power mixed-signal microcontroller MSP430F6736 is applied, which features an integrated high-performance 24-bit Sigma-Delta A/D converter and programmable gain stage. The 24-bit Sigma-Delta ADC of the MSP430F6736 has a maximum differential input voltage of ±920 mV when the gain is set to 1 [24,25]. To address the mismatch between the low output voltage of the strain gauge and the input voltage range of the Sigma-Delta ADC, the value of gain is set to 8 in this paper.
The Sigma-Delta ADC module can work at differential input modes with high input impedance. This configuration makes connecting the output signal of the Wheatstone bridge to the Sigma-Delta ADC easy. However, an analog front-end composed of capacitances is designed to reduce any reference voltage noise, thereby ensuring the stability and accuracy of the input signal. The schematics of the analog front-end circuits are shown in Figure 3. The circuit (a) is the voltage inputs for strain gauge outputs, and the diodes (1N4148) are used to protect the circuit from voltage spikes. The circuits (b) and (c) are the voltage inputs for strain gauge excitation voltage and battery voltage, respectively. The circuit (d) is the ADC interface part of the MSP430F6736. With the gain of the converter set to 8, the input signal from circuit (a) to the converter is a fully differential input with a voltage swing of ±800 mV, and the input signal from circuits (b) and (c) to the converter are approximately 792 mV and 665 mV when the excitation voltage is 5 V and the full voltage of battery is 4.2 V.

3.3. Wireless Transmission Module

To facilitate the long-distance transmission of load data monitored by sensors, this system utilizes low-power, high-efficiency LoRa (Long-Range) technology as the wireless data transmission solution. LoRa is a wireless communication protocol based on spread spectrum technology, characterized by long-distance transmission, low power consumption, and strong anti-interference capabilities [26]. It is widely applied in Internet of Things (IoT) devices, and is particularly suitable for remote data acquisition and monitoring systems. LoRa technology supports data transmission rates ranging from 300 bps to 37.5 kbps [27].
LoRa technology offers significant advantages in long-distance communication, low power consumption, strong anti-interference capabilities, and extensive device coverage. It is particularly suitable for the application of the load monitoring of the wire tightener, which requires long-term stable operation and wide-area coverage. In contrast, although Bluetooth and WiFi technology can provide higher data rates, there is a shorter communication distance in certain situations. From the point of remote monitoring, large-scale deployments, and low power consumption, LoRa technology is a more reasonable choice than Bluetooth and WiFi technology. In this paper, the SX1276 series LoRa wireless communication module was applied to send the load data to remote monitoring units and communicates with MSP430F6736 through the SPI interface.

3.4. Power Supply Module

The power supply module serves as the core energy source of the sensor system, providing power to each sub-module. Due to the varying voltage requirements of different modules, the system design must ensure that each module receives the appropriate voltage while maintaining battery life and overall system stability.
The operating voltage is 5 V for the data acquisition module, and 3.3 V for the data processing module and wireless transmission module. To ensure that the sensor can provide high-precision measurement results, the voltage regulator chip LP2951 was used to provide a stable 5 V, and the voltage regulator chip TPS562200 was used to provide a stable 3.3 V. For the battery charging and primary 5 V voltage, the lithium battery charge management chip SUM4056 and the step-up converter SDB628 are used, respectively. At the same time, a voltage divider circuit was designed to monitor the remaining power of the battery.

3.5. Hardware Integrated Design

After completing the design of the aforementioned modules, the next step involves the proper assembly of these modules into the designed sensor structure. Subsequently, the strain gauge acquisition module converts the load from the tensioner into voltage signals. These signals are then processed by algorithms and the resulting data is displayed on a mobile platform. The internal hardware design structure of the sensor is illustrated in Figure 4.

4. Sensor Software Design

4.1. Sensor End Software Design

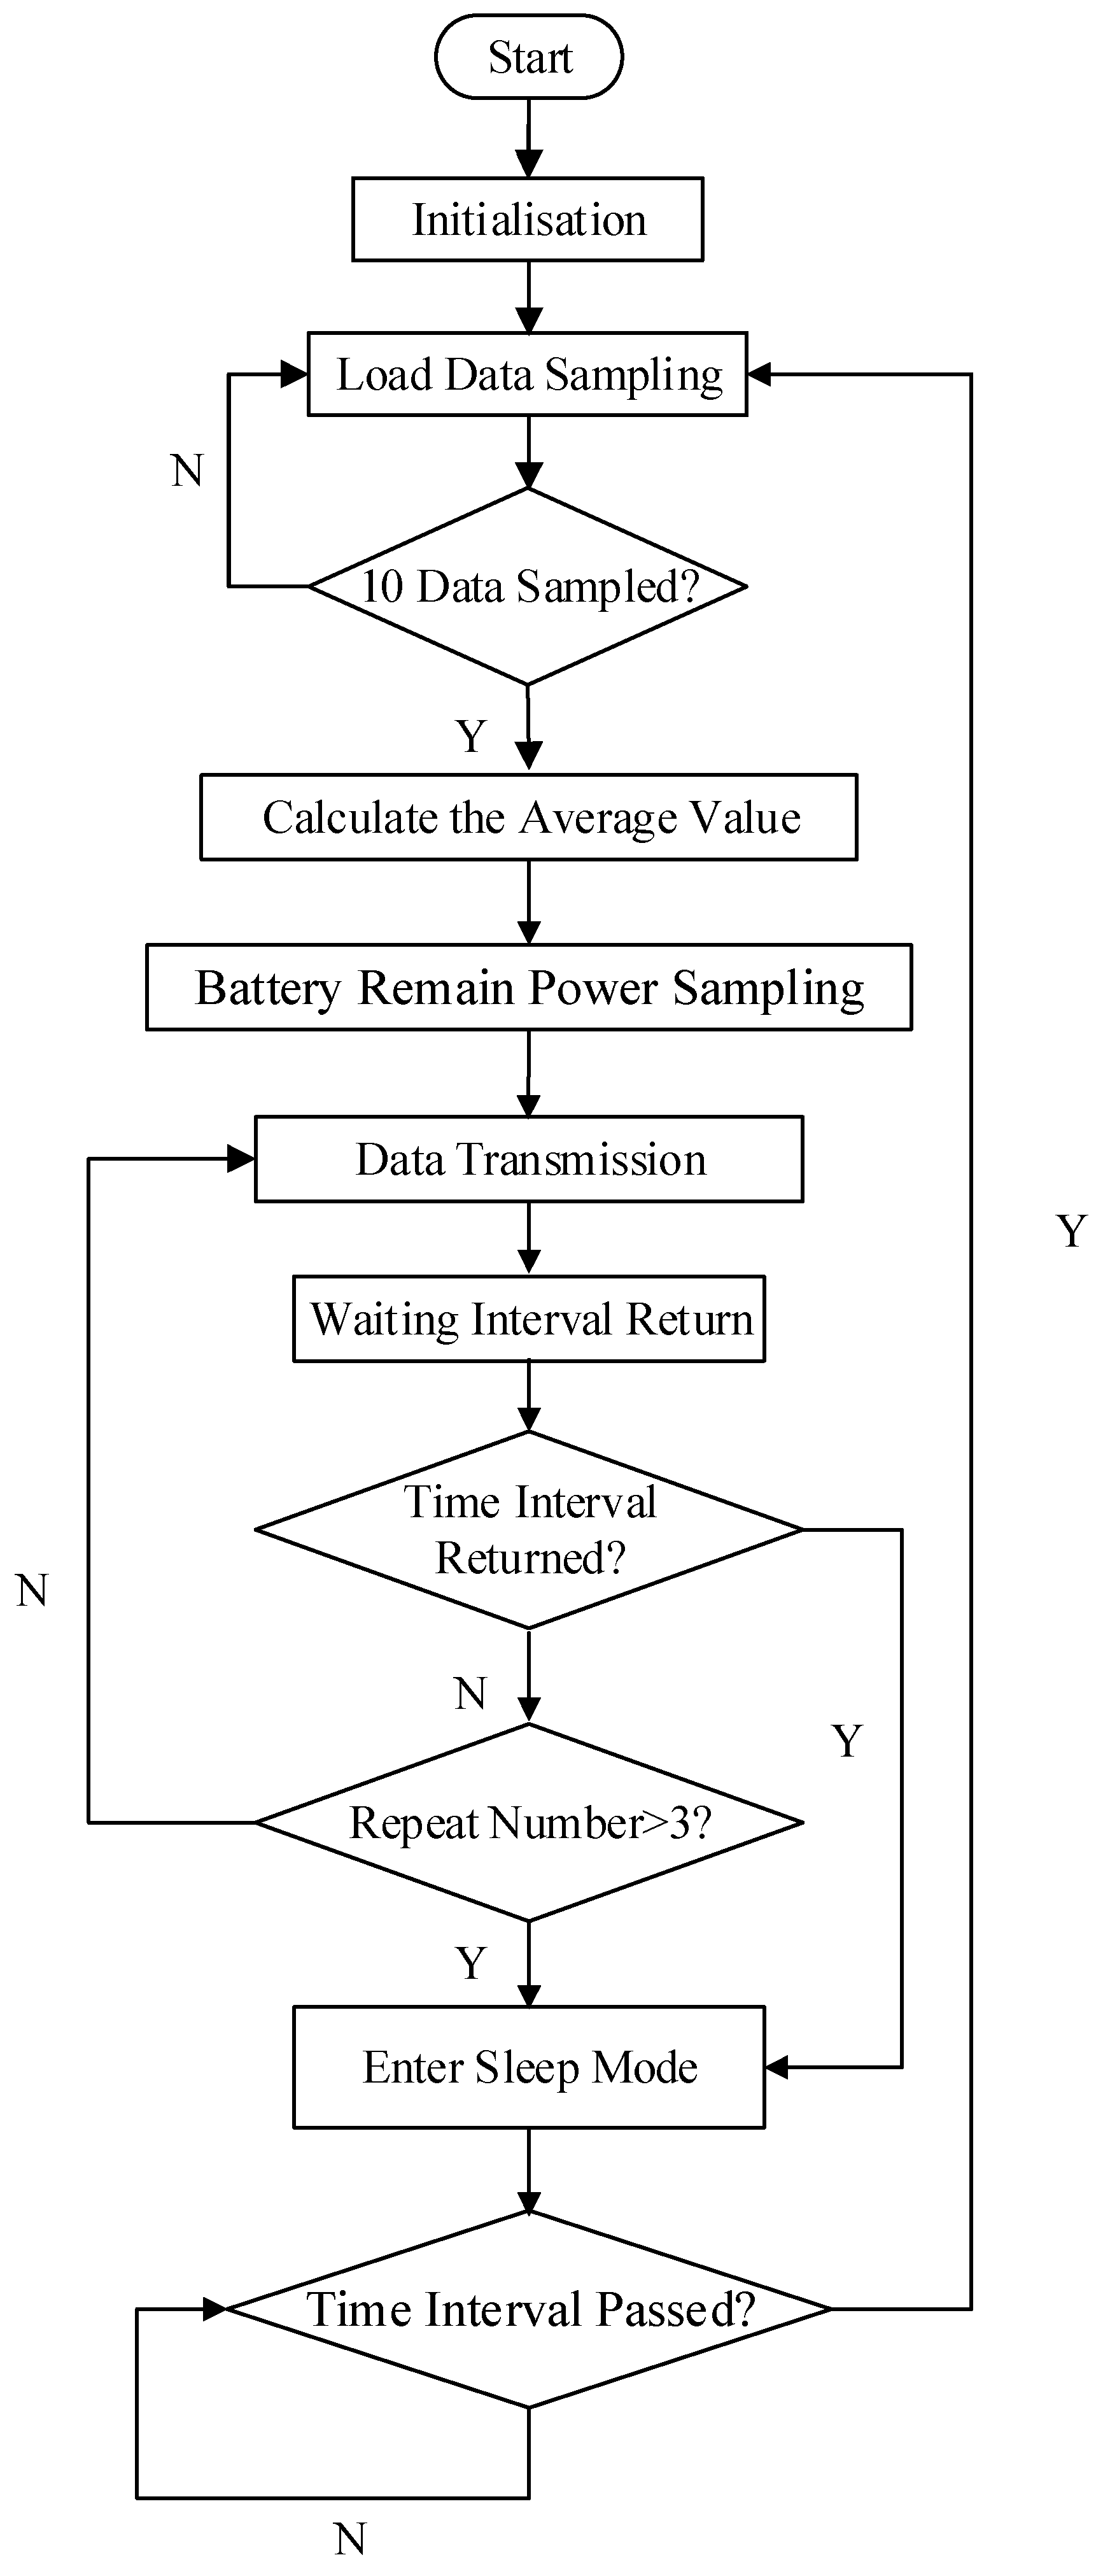
To prevent wire tightener overload, the sensor must promptly trigger an alert as the load approaches critical thresholds. So, the program of data acquisition end should have the basic requirements of high operational reliability. To facilitate stable data transmission, the reliable serial communication protocol with data validation was applied.
To balance accuracy and power consumption, 10 samples of load data were sampled in 100 milliseconds, and the average value along with the remaining battery power were transmitted. If the receiver obtains the data successfully, the time interval for each data transmission will be returned to the sender. After data transmission is complete, the sensor enters sleep mode, and all components except the microcontroller and the real-time clock will be shut down. When the time interval has passed, the sensor will wake up and start a new data sampling and transmission cycle. The program flow of the sensor end is shown in Figure 5.

4.2. Receiver End Software Design

The receiver end utilizes a portable tablet as the hardware platform, and was designed to monitor the real-time changes in load during the live working. The monitoring data uploaded by the sensors will be stored, displayed, and compared with the alert threshold on the receiver. If the wire tightener is overloaded, the supervisor will be alerted by voice and a flash of the screen. Through this alert mechanism, construction risks can be reduced, and the safety and efficiency of the construction process is ensured.
To enhance the data processing efficiency and alert response speed, the receiving end employs an event-driven mechanism. The software of the receiver end was developed using the C# programming language. A visual user interface (UI) was designed to ensure a clean interface and efficient responsiveness. Additionally, the data receiving end offers data export functionality which supports the saving of historical monitoring data in Excel file format. This function facilitates the preparation of construction reports and problem tracing.
Another important job of the receiver is to calculate the sleep time (the data acquisition cycle) of the sensor. Unlike traditional given wake-up time methods, the sensor sleep time can be flexibly adjusted according to the trend of load changing. During the load monitoring process, load fluctuations—especially sharp increases—require particular attention. In this paper, a load-adaptive strategy is adopted to dynamically adjust the data acquisition cycle. The strategy operates as follows:
  • The acquisition cycle ranges from 1 to 10 min, depending on load variations.
  • The cycle shortens as the load increases and lengthens as it decreases. It also shortens when load fluctuations intensify.
The adjustment of the data acquisition cycle is determined by the following formula:
T t + 1 = 600 540 · [ S i g n ( y ¯ t y ¯ t 1 ) · α · σ * + 1 α · σ * ]
where
  • Tt+1 is the next data acquisition interval (in seconds);
  • y ¯ t = 1 N i = 0 N 1 y t i is the average of the latest N samples;
  • y ¯ t 1 is the average of the previous N samples;
  • The sign function indicates whether the load is increasing or decreasing;
  • The weight coefficient α (set to 0.5 in this paper) balances the influence of the load trend and fluctuation intensity;
  • σ * represents the normalized standard deviation of recent samples, calculated as
    σ * = 1 N i = 0 N 1 y t i * y ¯ t * 2
  • σ * represents the normalized standard deviation of the first-order differences, calculated as
    σ * = 1 N i = 0 N 1 y t i * y ¯ t * 2 ]
To constrain values between 0 and 1, the load data are normalized using
y t * = y t y m i n y m a x y m i n
where y m a x and y m i n are the maximum and minimum values over the most recent N samples (N is set to 10 in this paper).
In this formulation
  • σ * quantifies the trend of the load;
  • σ * captures the intensity of fluctuations;
  • Normalization ensures both metrics lie in the range [0, 1], enabling consistent scaling of the acquisition interval.

5. Sensor Mechanical Design

In live working, most of the wire tightener is assembled by several parts using the traditional bolt connection method. In order to facilitate the installation and connection of the wire tightener’s load-bearing parts and the sensor, connection components such as hexagon head bolts [28], hex nuts [29], and flat washers [30] are used. There are round holes at both ends of the sensor that can be used to assemble with the bolts. In addition, a square opening space is reserved in the middle of the sensor for the installation of strain gauges and circuit boards. The framework of the load sensor is shown in Figure 6.
To select the appropriate material for the sensor and evaluate the tensile strength of the metal housing, the finite element software ANSYS 2024 R1 was used to simulate the tensile strength of the metal shell of the sensor with different materials. The structural parameters were imported into ANSYS 2024 R1 for mesh generation. The overall geometric dimension was set to 1 mm to ensure simulation accuracy, and mesh refinement was applied at critical stress locations and bolt holes with a mesh size of 0.5 mm. The final mesh comprised 1.52 million nodes, as shown in Figure 7.
The typical rating load of the wire tightener used in live working is 1 to 2 tons. Considering the safety coefficient, displacement constraints were applied at the openings, and a tensile force of 1.5 or 3 tons was exerted on the front edge of the openings, while 0.75 or 1.5 tons of tensile force were applied to the rear openings. These settings simulate the tensile forces applied by the wire tightener to the sensor during live working. Furthermore, the structural degrees of freedom in the X and Z directions were fixed, while the Y direction remained free. Then, the stress and strength verification of the sensor housing was conducted for different materials. The stress distribution of the sensor made of 7075 aluminum alloy under a 1.5 ton load is shown in Figure 8.
Sequentially, commonly available casting materials such as structural steel, 7075 aluminum alloy and TC4 titanium alloy were selected for stress strength simulation analyses. The results are presented in Table 3.
According to the finite element analysis results, the yield strengths of common aluminum alloys and gray cast iron are significantly lower than the maximum stress intensity. Using these two materials will fail to meet the design requirements and make the load sensor prone to plastic deformation or failure. Although 7075 aluminum alloy has a higher yield strength than ordinary aluminum alloys, it is still much lower than TC4 titanium alloy. TC4 titanium alloy not only possesses the highest yield strength (1070 MPa) but also demonstrates excellent performance in strength reserve and reliability. Additionally, TC4 titanium alloy has superior corrosion resistance and light weight advantages. Considering the potential dynamic loads during live working, selecting TC4 titanium alloy is the optimal material choice to meet the demands of high load and high safety.
Since live work is predominantly carried outdoors, the wire tightener should meet the requirement of long-term operation outdoors with certain oxidation and corrosion resistance. In accordance with the standard [31], which specifies surface treatment requirements for metal tools, the surface treatment process for the load sensor is hot-dip galvanization. At the same time, because polyethylene can resist the erosion of most acids and alkalis, and is insoluble in general solvents at room temperature, the strain gauge and other circuit were installed in the square opening space and encapsulated with polyethylene.

6. Results

6.1. The Calibration of Load Sensor

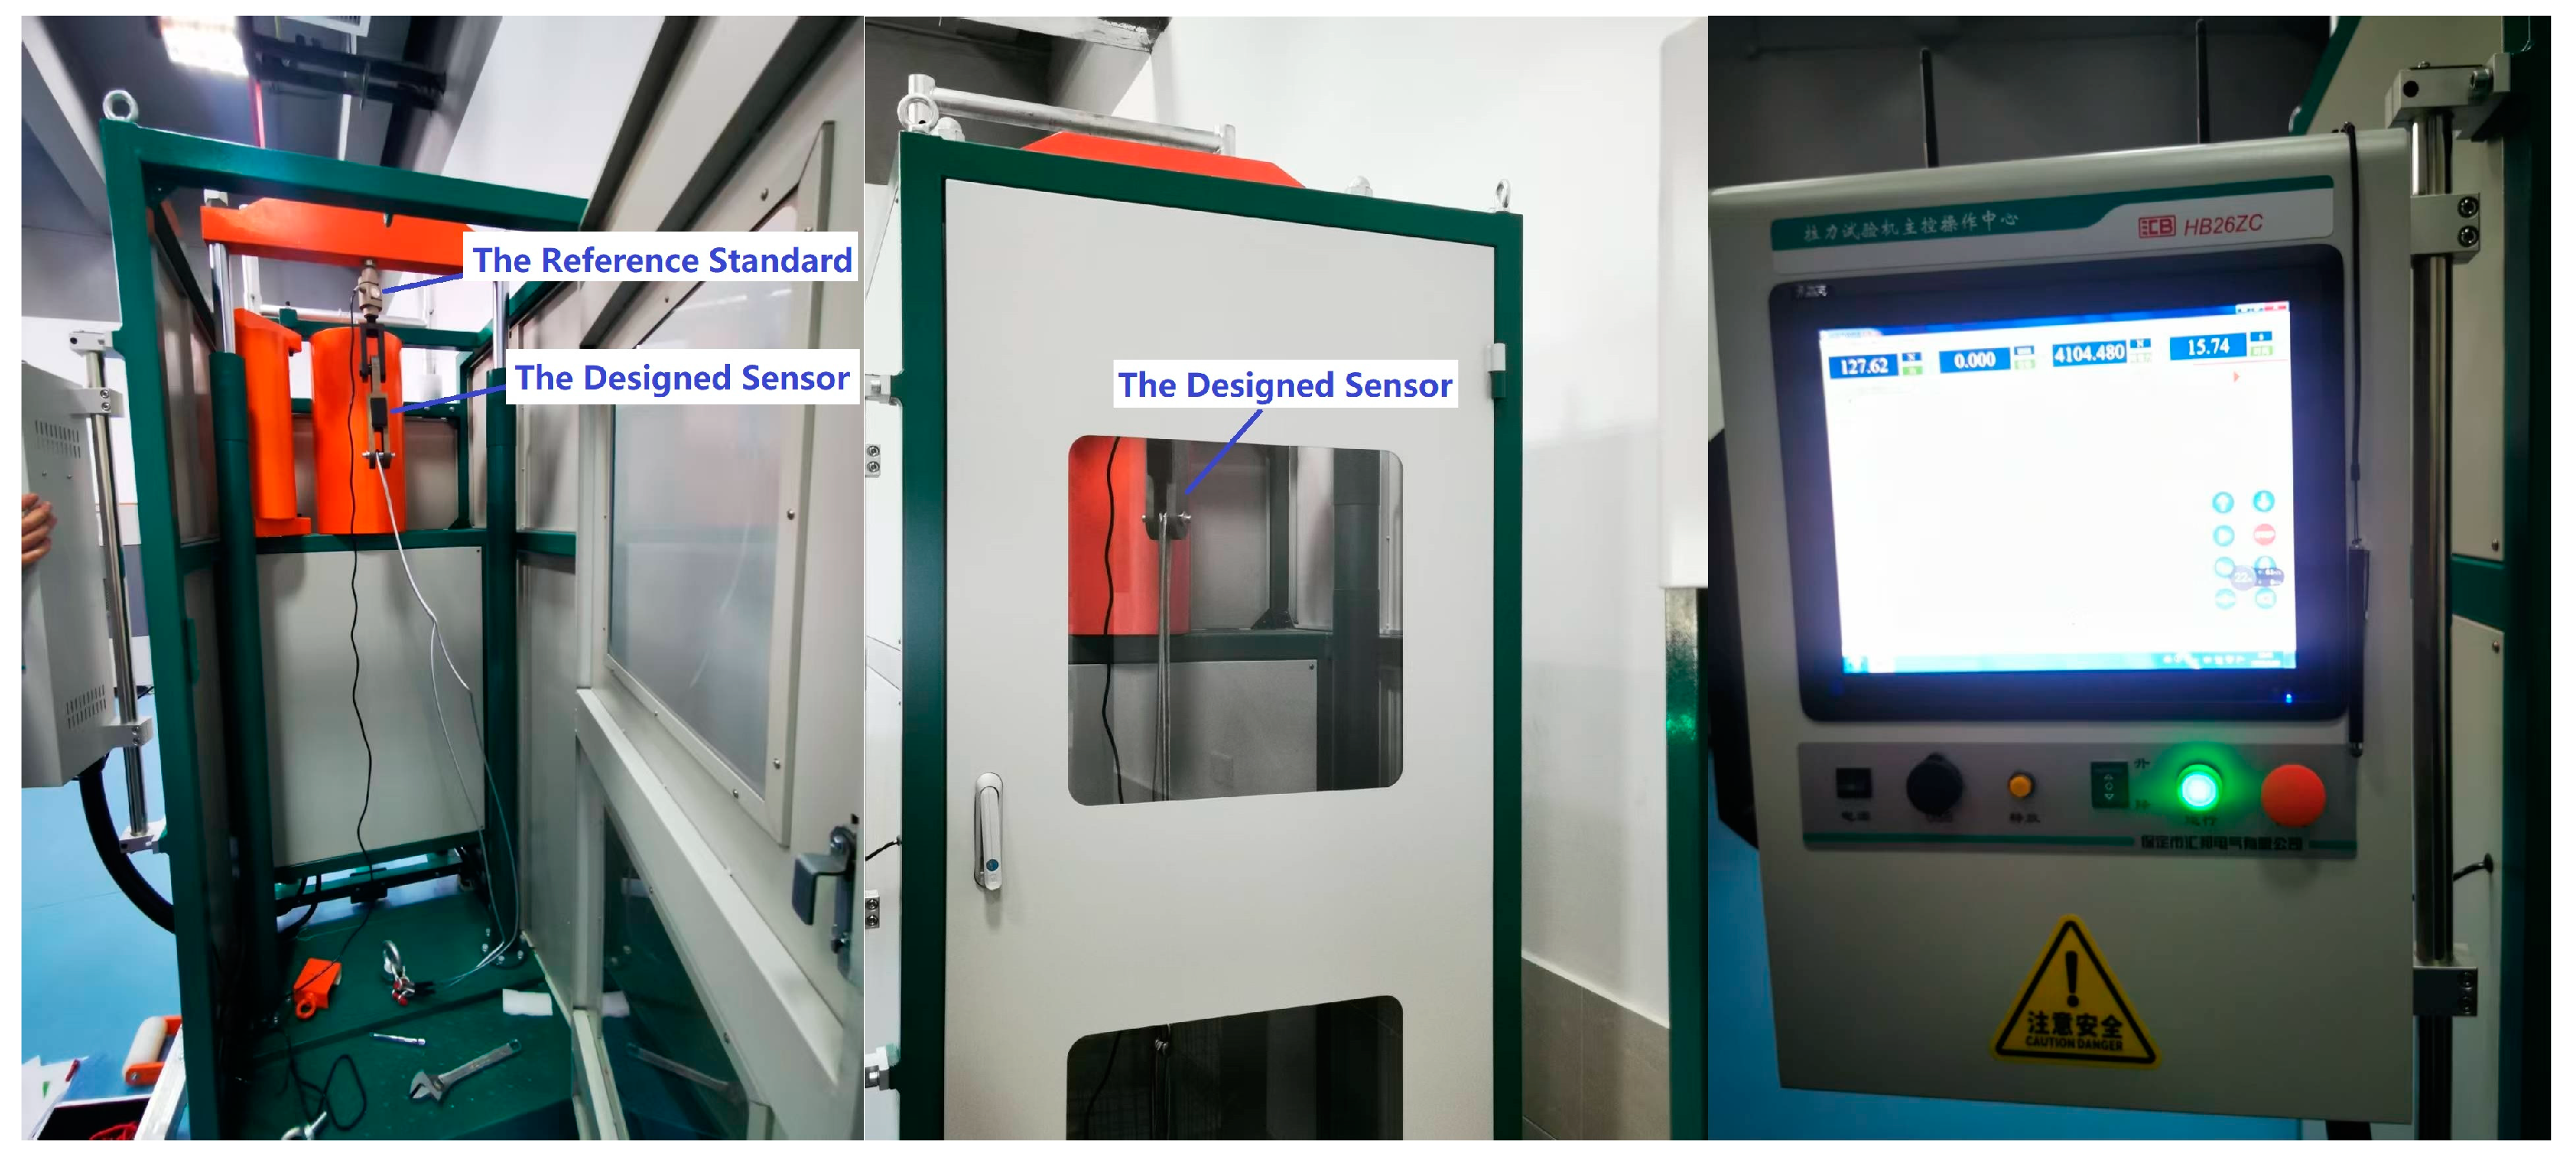
In order to ensure the accuracy of the force measurement of the designed load sensor, the multi-functional combined mechanical testing device (HB26ZC) was used to load and unload calibration, as shown in Figure 9.
Calibration was performed at nine equally spaced load points (0, 2.5, 5, 7.5, 10, 12.5, 15, 17.5, and 20 kN). A total number of 10 observations were recorded at each load point, with 5 each in increasing and decreasing orders of loads cycles, thus making total 90 observations. The results thus obtained from these experiments were used to measure the performance of the sensor. In the experiments, the excitation voltage is 4.999 V, and there is a 12.76 mV increase in the output of the transducer for the load range of (0–20) kN. The output behavior with respect to the input is shown in Figure 10. From the plots, it is observed that the output of the sensor follows a quite linear relationship as a function of the load for both increasing and decreasing pressures. The coefficient of determination (R2) is nearly 1 (precisely 0.9999). From Figure 10, it can also be observed that the slopes of both increasing and decreasing cycles are almost identical. This means the sensitivity is not affected by the load increment or decrement. The slight difference is in their intercepts, which are due to the hysteresis of the sensor, and which is a very common error for the strain gauge.
After calibration, the load sensor measured each applied force 10 times, and the average value was taken to calculate the error. The test data are shown in Table 4. It can be seen that the average relative error of the load sensor is 0.44%. According to the test data, the designed load sensor could be applied in practical working conditions.

6.2. The Application of Load Sensor

The load sensor was applied in August 2024 in the project such as to replace the tensile insulators, as shown in Figure 11. The load sensor is easy to be assemble with the wire tightener during actual use, and the wireless data transmission is stable. Through the handheld data receiver, the working supervisor could observe the load on the wire tightener. During the continuous monitoring of 8 h, about 4500 mWh power was consumed. The voltage of the battery with a capacity of 6000 mAh dropped from 4.2 V to 3.97 V, and about 20% power was consumed.

7. Conclusions and Discussion

7.1. Conclusions

A strain gauge-based sensor with a load range of 0–20 kN was designed, developed, and calibrated. This sensor is suitable for the real-time monitoring of the wire tightener load and incorporates the following features:
  • TC4 titanium alloy was used to meet the demands of high load and high safety for its high yield strength (1070 MPa), excellent corrosion resistance, and light weight.
  • Low-power LoRa technology was employed for wireless data transmission. By using an ultra-low-power mixed-signal microcontroller and an adaptive sleep–wake strategy, the sensor can operate continuously for 40 h on a 3.7 V, 6000 mAh battery. Future work may include defining data quality metrics—such as whether key information is missed—to optimize the strategy parameters N and α.
  • The sensor can be easily bolted between the idler roller and web strap, allowing flexible deployment across various tools and working environments.
  • Performance evaluation and calibration showed high linearity (R2 = 0.9999) and low hysteresis loss. The sensor maintains good accuracy across the full load range, with errors within 5% of the full scale.
  • The sensor costs approximately USD 100. Although expensive compared to the wire tightener, it is cost-effective compared to potential accident-related damages.

7.2. Discussion

The sensor significantly enhances tightener safety. However, other critical factors—such as vibration, aging, and environmental conditions—also affect the performance and safety of the wire tightener, underscoring the importance of regular maintenance and fault diagnosis. Fault diagnosis is a core technology in prognostics and health management (PHM). Typically, the effectiveness of fault diagnosis relies on the availability of sufficiently labeled fault data. Yet in industrial applications, such data are often scarce or even unavailable, making it challenging to implement predictive maintenance or condition-based maintenance strategies for the tightener. In this context, the fault detection and localization method under zero-faulty data has been proposed [32,33]. These approaches aim to enable accurate fault detection and localization, even when historical fault examples are lacking. Therefore, this method represents a promising direction and is worthy of further investigation in subsequent studies.

Author Contributions

Conceptualization, Y.Z.; methodology, G.H.; software, G.H.; validation, Y.Z.; formal analysis, T.S.; investigation, Q.Y.; resources, Y.Z.; data curation, Q.Y.; writing—original draft preparation, T.S.; writing—review and editing, G.H. and Y.S.; visualization, T.S. and Y.S.; supervision, Q.Y.; project administration, X.C.; funding acquisition, Q.Y. All authors have read and agreed to the published version of the manuscript.

Funding

This research was supported by the Yunnan Power Grid Science and Technology Project, “Research and application of real-time mechanics of the live working equipment in the transmission lines” (Grant Number: YNKJ048).

Institutional Review Board Statement

Not applicable.

Informed Consent Statement

Not applicable.

Data Availability Statement

Data are contained within the article.

Conflicts of Interest

Author Yuxiong Zhang, Qikun Yuan and Xuanlin Chen were employed by the company Qujing Power Supply Bureau, Yunnan Power Grid Co., Ltd. The remaining authors declare that the research was conducted in the absence of any commercial or financial relationships that could be construed as a potential conflict of interest.

Abbreviations

The following abbreviations are used in this manuscript:
SHMStructural Health Monitoring
RSGsResistance Strain Gauges
OFSsOptical Fiber Sensors
FBGFiber Bragg Grating
CNTsCarbon Nanotubes
DICDigital Image Correlation
OLEDOrganic Light-Emitting Diode
GPSGlobal Positioning System
GPRSGeneral Packet Radio Service
OPGWOverhead Ground Wire
ADCAnalog-to-Digital Converter
CPUCentral Processing Unit
IoTInternet of Things
WANWide Area Network
MACMedia Access Control Address
UIUser Interface

References

  1. Han, J.X. Innovation and Application of Live-Line Working Tools for Distribution Networks. Master’s Thesis, Lanzhou Jiaotong University, Lanzhou, China, 2020. [Google Scholar]
  2. DL/T 878-2004; Test Guide of the Insulating Tool for Live Working. China Electricity Council: Beijing, China, 2004.
  3. Hu, S.H.; Liu, M.X.; Yu, H. Intelligent Monitoring and Alarm Intervention Methods for Hazardous Actions Aimed at the Safety Protection of Live Working Personnel. Digit. Commun. World 2023, 12, 75–77. [Google Scholar]
  4. Zhao, Y.; Liu, Y.; Li, Y.; Hao, Q. Development and Application of Resistance Strain Force Sensors. Sensors 2020, 20, 5826. [Google Scholar] [CrossRef] [PubMed]
  5. Kumar, R.; Rab, S.; Pant, B.D.; Maji, S. Design, development and characterization of MEMS silicon diaphragm force sensor. Vacuum 2018, 153, 211–216. [Google Scholar] [CrossRef]
  6. López-Higuera, J.M. Handbook of Optical Fibre Sensing Technology; John Wiley & Sons: Hoboken, NJ, USA, 2002. [Google Scholar]
  7. Yassin, M.H.; Farhat, M.H.; Soleimanpour, R.; Michel, N. Fiber Bragg grating (FBG)-based sensors: A review of technology and recent applications in structural health monitoring (SHM) of civil engineering structures. Discov. Civ. Civil. Eng. 2024, 1, 151. [Google Scholar] [CrossRef]
  8. Mehmood, A.; Mubarak, N.M.; Khalid, M.; Walvekar, R.; Abdullah, E.C.; Siddiqui, M.T.H.; Baloch, H.A.; Nizamuddin, S.; Mazari, S. Graphene based nanomaterials for strain sensor application-a review. J. Environ. Chem. Eng. 2020, 3, 103743. [Google Scholar] [CrossRef]
  9. Xu, R.; Zheng, X.; Chen, M.; Sun, L.; Chen, J.; Wang, F.; Ma, Y. Enhancing the Linearity and Stability of a Fabric-Based Strain Sensor with Microfolded Graphene Structures. Appl. Sci. 2020, 10, 6230. [Google Scholar] [CrossRef]
  10. Riyajuddin, S.; Kumar, S.; Gaur, S.P.; Sud, A.; Maruyama, T.; Ali, M.E.; Ghosh, K. Linear piezoresistive strain sensor based on graphene/g-C3N4/PDMS heterostructure. Nanotechnology 2020, 31, 295501. [Google Scholar] [CrossRef] [PubMed]
  11. Qiu, A.D.; Aakyiir, M.; Wang, R.Y.; Yang, Z.K.; Umer, A.; Lee, I.; Hsu, H.Y.; Ma, J. Stretchable and calibratable graphene sensors for accurate strain measurement. Mater. Adv. 2020, 2, 235–243. [Google Scholar] [CrossRef]
  12. Peters, W.H.; Ranson, W.F. Digital Imaging Techniques in Experimental Stress Analysis. Opt. Eng. 1982, 21, 427–431. [Google Scholar] [CrossRef]
  13. Khoo, S.W.; Karuppanan, S.; Tan, C.S. A Review of Surface Deformation and Strain Measurement Using Two-Dimensional Digital Image Correlation. Metrol. Meas. Syst. 2016, 23, 461–480. [Google Scholar] [CrossRef]
  14. Ge, X.; Cheng, S.; Fu, J.; Zhu, C.G.; Li, S.; Tang, H.; Ma, H.K. Development of intelligent bearing tool for transmission lines. Electr. Eng. 2019, 7, 42–44. [Google Scholar]
  15. Qin, Z.H.; Tao, J.S.; Chen, T.; Xiong, W.J.; Fang, S.H.; He, M.H. Study on early warning system for tightening conductor of HV transmission line based on stress change rate. Eng. J. Wuhan Univ. 2022, 12, 1285–1292. [Google Scholar]
  16. Yang, J. Research on Wire Icing Monitoring Based on Tensile Force and Inclination Sensing Using FBG. Master’s Thesis, Kunming University of Science and Technology, Kunming, China, 2019. [Google Scholar]
  17. Zhang, L.B.; Tang, B.; Huang, M.X.; Li, F.H.; Liu, G. Development of stress monitoring sensors for internal suspension bracing tower ropes. China Meas. Test 2023, 4, 119–126. [Google Scholar]
  18. Liu, Z.; Li, Y.; Zhao, L.; Liang, R.; Wang, P. Comparative Evaluation of the Performance of ZigBee and LoRa Wireless Networks in Building Environment. Electronics 2022, 11, 3560. [Google Scholar] [CrossRef]
  19. GB/T 18857-2019; Technical Guide of Live Working on Distribution Line. China Electricity Council: Beijing, China, 2019.
  20. Wang, Y.J.; Chi, P.K.; Lin, Y.H.; Lu, T.F.; Sue, C.Y. A six-axis force and torque sensor consisting of compliant mechanisms and full-bridge strain gauges. Measurement 2024, 226, 114151. [Google Scholar] [CrossRef]
  21. Analog Devices. Driving Strain-Gauge Bridge Sensors with Signal-Conditioning ICs. Available online: https://www.analog.com/en/resources/technical-articles/2022/07/16/08/57/driving-straingauge-bridge-sensors-with-signalconditioning-ics.html (accessed on 20 July 2024).
  22. Rong, D.; Bofeng, L. Sensor Principle and Engineering Application, 2nd ed.; Electronic Industry Press: Beijing, China, 2021. [Google Scholar]
  23. Kaner, B.; Asmaz, K. Investigation of using strain gauge in tension, torsion and bending experiments. Sigma J. Eng. Nat. Sci. 2024, 3, 755–766. [Google Scholar] [CrossRef]
  24. Texas Instruments. MSP430F673x, MSP430F672x Mixed-Signal Microcontrollers. Available online: https://www.ti.com/lit/ds/symlink/msp430f6736.pdf?ts=1758249893391 (accessed on 20 July 2024).
  25. Texas Instruments. Implementation of a Single-Phase Electronic Watt-Hour Meter Using the MSP430F6736(A). Available online: https://www.ti.com.cn/product/cn/MSP430F6736A (accessed on 20 July 2024).
  26. Kamal, M.A.; Alam, M.M.; Sajak, A.A.B.; Su’ud, M.M. Requirements, deployments, and challenges of LoRa technology: A survey. Comput. Intell. Neurosci. 2023, 1, 5183062. [Google Scholar] [CrossRef] [PubMed]
  27. Rahman, H.U.; Ahmad, M.; Ahmad, H.; Habib, M.A. LoRa WAN: State of the Art, Challenges, Protocols and Research Issues. In Proceedings of the 2020 IEEE 23rd International Multitopic Conference (INMIC), Bahawalpur, Pakistan, 5 November 2020. [Google Scholar]
  28. GB/T 5782-2016; Hexagon Head Bolts. China Machinery Industry Federation: Beijing, China, 2016.
  29. GB/T 6175-2016; Hexagon Nuts, Style 2. China Machinery Industry Federation: Beijing, China, 2016.
  30. GB/T 95-2002; Plain Washers-Product Grade C. China Machinery Industry Federation: Beijing, China, 2002.
  31. GB/T 18037-2008; Technical Requirements and Design Guide for Live Working Tools. China Electricity Council: Beijing, China, 2008.
  32. Chen, Z.Y.; Huang, H.Z.; Deng, Z.W.; Wu, J. Shrinkage mamba relation network with out-of-distribution data augmentation for rotating machinery fault detection and localization under zero-faulty data. Mech. Syst. Signal Process. 2025, 224, 112145. [Google Scholar] [CrossRef]
  33. Chen, Z.Y.; Huang, H.Z.; Wu, J.; Wang, Y.H. Zero-faulty sample machinery fault detection via relation network with out-of-distribution data augmentation. Eng. Appl. Artif. Intell. 2025, 141, 109753. [Google Scholar] [CrossRef]
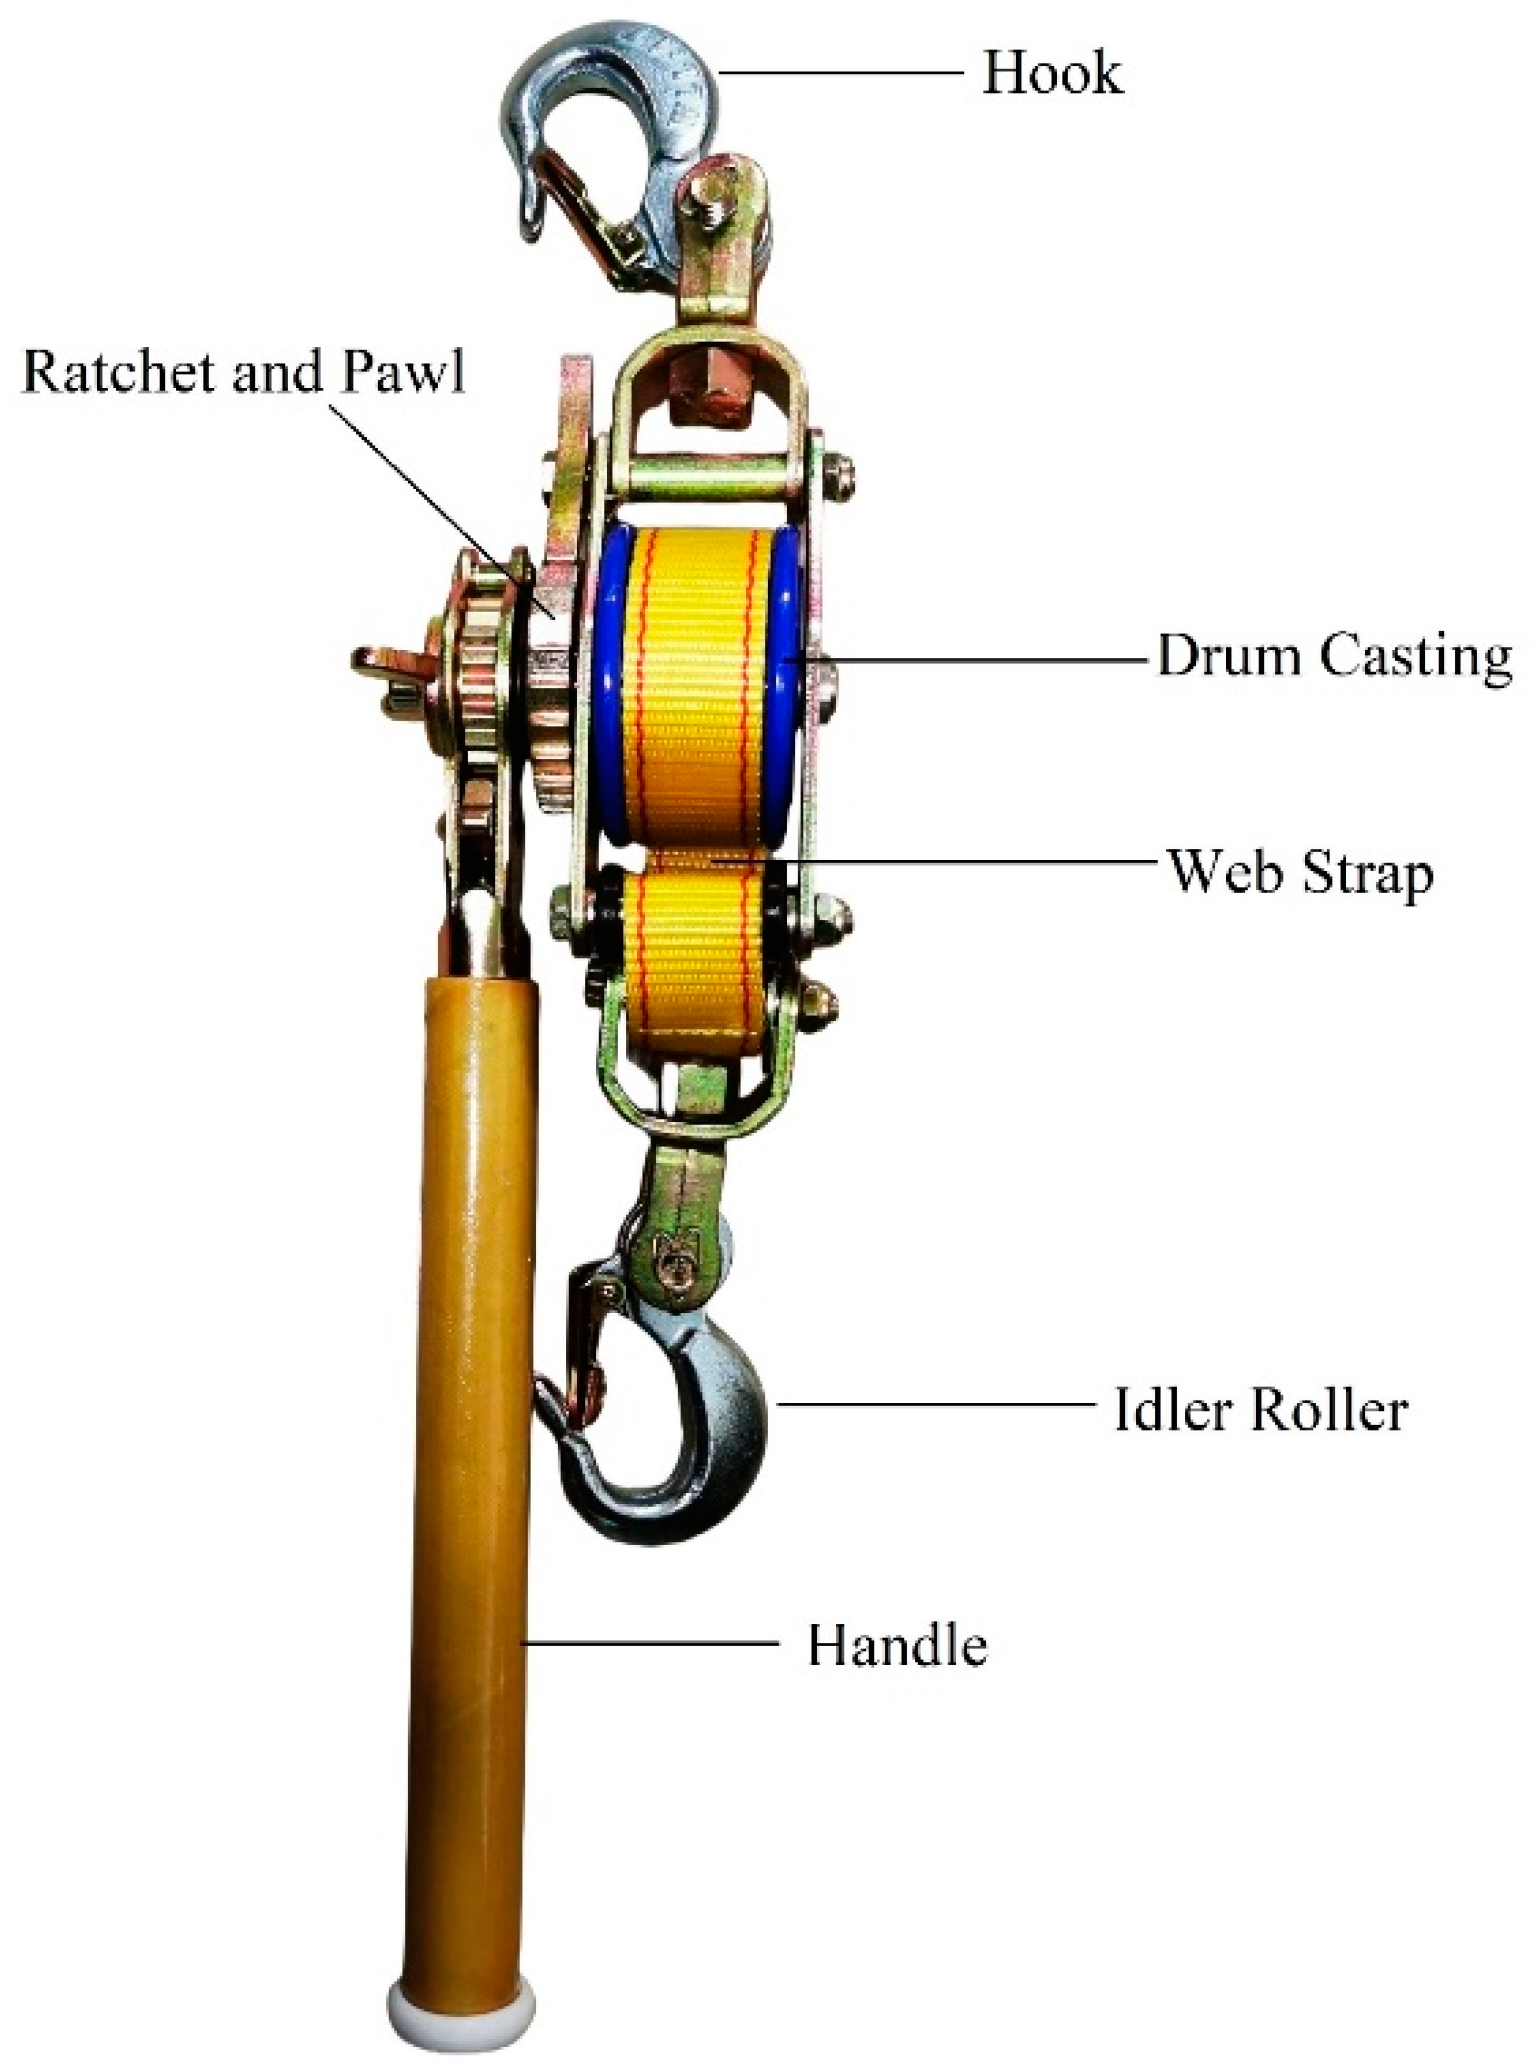
Figure 1. The structural diagram of wire tightener.
Electronics 14 03716 g001
Figure 2. The Wheatstone bridge configuration of strain gauge. (a) An uncompensated bridge. (b) A temperature-compensated bridge.
Electronics 14 03716 g002
Figure 3. The analog front-end circuit. (a) Analog front-end for bridge outputs. (b) Analog front-end for bridge inputs. (c) Analog front-end for battery outputs. (d) Bridge and battery measurement ADC connections.
Electronics 14 03716 g003
Figure 4. The hardware design structure of the sensor.
Electronics 14 03716 g004
Figure 5. The program flow of the sensor end.
Electronics 14 03716 g005
Figure 6. The framework of the load sensor. (a) Front view. (b) Left view. (c) Back view.
Electronics 14 03716 g006
Figure 7. The finite element model of the load sensor.
Electronics 14 03716 g007
Figure 8. The stress distribution of load sensor.
Electronics 14 03716 g008
Figure 9. The calibration of sensor.
Electronics 14 03716 g009
Figure 10. Voltage vs. load curve for increasing and decreasing cycles of load. (a) Increasing order. (b) Decreasing order.
Electronics 14 03716 g010
Figure 11. Wire tightener with sensor applied in live working.
Electronics 14 03716 g011
Table 1. Features of different types of resistive strain gauges.
TypeWire Strain GaugesFoil Strain GaugesSemiconductor Strain Gauges
Sensitive grid thicknessDiameter approx. tens of micro-meters0.003–0.01 mmDepends on the semiconductor structure
Performance characteristicsSimple structure and low cost;
low sensitivity and poor stability
High precision and good heat hysteresis; large resistance dispersionHigh sensitivity;
poor stability and obvious nonlinearity
Sensitivity factorApprox. 2Approx. 2–5Approx. 50–200
Table 2. The main technical parameters of strain gauges.
Substrate MaterialExcitation VoltageResistanceSensitivityGrid Dimensions
steel5 V350 Ω2.0 ± 1%4 × 7.5 mm
Table 3. Stress simulation results for different materials.
MaterialMax Stress
(MPa)@ 15 kN
Max Stress
(MPa)@ 30 kN
Yield Strength
(MPa)
Common Aluminum Alloy385764280
7075 Aluminum Alloy383767505
Gray Cast Iron383765270
TC4 Titanium Alloy3837671070
Table 4. Test data of load sensor.
Given Value (kN)Test Average Value (kN)Relative Error (%)
55.020.40
1010.050.50
1515.070.47
2020.080.40
Average Value of Relative Error0.44
Disclaimer/Publisher’s Note: The statements, opinions and data contained in all publications are solely those of the individual author(s) and contributor(s) and not of MDPI and/or the editor(s). MDPI and/or the editor(s) disclaim responsibility for any injury to people or property resulting from any ideas, methods, instructions or products referred to in the content.