Abstract
Recent advances in Radio Frequency (RF)-based device classification have shown promise in enabling secure and efficient wireless communications. However, the energy efficiency and low-latency processing capabilities of neuromorphic computing have yet to be fully leveraged in this domain. This paper is a first step toward enabling an end-to-end neuromorphic system for RF device classification, specifically supporting development of a neuromorphic classifier that enforces temporal causality without requiring non-neuromorphic classifier pre-training. This Spiking Neural Network (SNN) classifier streamlines the development of an end-to-end neuromorphic device classification system, further expanding the energy efficiency gains of neuromorphic processing to the realm of RF fingerprinting. Using experimentally collected WirelessHART transmissions, the TI-SNN achieves classification accuracy above 90% while reducing fingerprint density by nearly seven-fold and spike activity by over an order of magnitude compared to a baseline Rate-Encoded SNN (RE-SNN). These reductions translate to significant potential energy savings while maintaining competitive accuracy relative to Random Forest and CNN baselines. The results position the TI-SNN as a step toward a fully neuromorphic “RF Event Radio” capable of low-latency, energy-efficient device discrimination at the edge.
1. Introduction
The motivation for this work stems from the earlier introduction of the ‘RF Event Radio’ concept in [1], which draws an analogy to event-based cameras. Just as event-based vision has enabled lower energy consumption, reduced latency, higher temporal resolution, and greater dynamic range in compact neuromorphic hardware [2,3], the RF Event Radio seeks to bring these advantages to RF signal sensing and classification. The envisioned capability is a neuromorphic system that provides physical-layer communication security for mesh networks by supporting localized inference at the edge or near-edge where Size, Weight, and Power (SWaP) are constrained. Achieving this requires on-device intelligence that reduces the computational footprint of Radio Frequency (RF) fingerprinting while preserving classification accuracy. Spiking Neural Networks (SNNs) offer a pathway to this capability through low-latency, energy-efficient inference compatible with event-based RF representations.
From the earliest 21st century work [4,5,6] until now, the discrimination of electronic devices using Radio Frequency Fingerprinting (RFF) has remained an area of interest across the multi-national research community. The RFF implementation methods are as varied as the RF signal features they target for information extraction and are duly summarized in related surveys published in 2020 [7] and in 2024 [8]. Some of the earliest foundational details for RFF work presented here are provided in these surveys and are omitted here for brevity—the reader is referred to [7,8] which aptly summarize historical RFF development and demonstration that have occurred over the past two decades.
Despite the broad use of dissimilar terminology and differing RF signal features, RFF effectiveness for discriminating electronic devices is inherently dictated by physical layer differences. To be effective, the RFF features should exhibit [8]
- (1)
- Uniqueness—features should be different across the pool of devices to be identified.
- (2)
- Relative Stability—features should remain unchanged across the time period for which they are intended to be used.
- (3)
- Independence—features should be dominated by transmitter-induced effects and not depend on non-hardware effects such as bit-level information content and channel operating conditions.
1.1. Relationship to Prior Research
The foundation for work here includes methods noted in [8] for performing Internet of Things (IoT) device classification using statistical fingerprint features. These methods were subsequently adopted for Wireless Highway Addressable Remote Transducer (WirelessHART) device discrimination work in [9,10,11] which used statistic-bearing fingerprints generated from experimentally collected RF signals. Best-case higher classification accuracies in these works were obtained using a Gabor Transform (GTX) [12,13,14] to decompose the RF signals into a temporal–spectral matrix representation as part of the fingerprint generation process. The GTX-based fingerprints are then used to discriminate devices using a given classifier, such as the traditional Random Forest (RndF) and Convolutional Neural Network (CNN) classifiers used here for baseline comparisons.
The device collections in [10,11] were adopted in [1] to introduce the development of an RF eventization approach to RFF and to demonstrate the potential for the envisioned ‘RF Event Radio’. RF eventization effectively reduces the computational complexity of resultant fingerprints by forming event-based matrix representations of the RF signal, rather than using statistical fingerprint feature representations. These event-based fingerprints are compatible with both traditional classifiers (e.g., RndF and CNN) as well as emerging neuromorphic-friendly classifiers supporting low-energy neuromorphic processing objectives. This step marked the transition from conventional statistical features toward event-based fingerprints that reduce complexity while aligning with neuromorphic processing goals of the ‘RF Event Radio’.
The eventization work in [1] was expanded to include use of a traditional CNN classifier alongside a SNN classifier in [15]. The SNN architecture was derived using the CNN-to-SNN conversion method in [16]. The CNN and SNN classifiers were trained and tested using the same eventized fingerprints. A comparison of classifier performances showed that the CNN-derived SNN achieved similar classification accuracy while being more energy-efficient than the CNN. However, SNN performance relies on CNN pre-training. This limits its use in a fully neuromorphic event radio and underscores the need for natively neuromorphic classifiers.
Related advances in the broader neuromorphic literature include energy-efficient SNN segmenters for vision tasks [17], FPGA-based SNN acceleration [18], optimized edge toolchains [19], and domain-specific SNN classification in remote sensing [20]. Much of the broader related research has focused on higher-layer communications and data-intensive applications rather than on at-the-edge physical-layer RF fingerprinting. Examples include cloud-layer data management [21], virtual and augmented reality in the metaverse [22], and 5G/6G cybersecurity and communications [23,24]. Similar demands arise in critical infrastructure domains such as mining [25], transportation [26], power systems [27], and healthcare [28]. These areas all depend on reliable wireless connectivity, yet face increasing challenges when deployed under strict SWaP limits. By advancing neuromorphic RF fingerprinting at the edge, the approach presented here has the potential to extend reliable, low-latency, and energy-efficient wireless security into exactly these kinds of applications.
1.2. Paper Contribution
This paper advances device classification capabilities of a neuromorphic-friendly ‘RF Event Radio’ by:
- (1)
- Eliminating the need for CNN pre-training [15];
- (2)
- Avoiding rate-encoded fingerprints [16];
- (3)
- Enforcing temporal causality in fingerprint processing.
The proposed Time-Incremented Spiking Neural Network (TI-SNN) classifier is developed without a pre-training CNN development step and trained with eventized fingerprints being directly and sequentially input (no rate encoding). This allows for a more efficient and streamlined approach to device classification while achieving desirable classification accuracy. For purpose of comparison, an alternative Rate Encoded SNN (RE-SNN) is also introduced to highlight the energy efficiency of the proposed approach. The RE-SNN follows the rate encoding approach used in [15] without requiring CNN-to-SNN conversion. By emphasizing direct compatibility with eventized representations, the proposed TI-SNN approach more closely aligns with the neuromorphic system objectives surveyed across multiple application domains [17,18,19,20].
1.3. Paper Organization
The remainder of this paper is organized as follows: The Demonstration Methodology is presented in Section 2 and introduces the WirelessHART signal collection dataset, fingerprint generation, and GTX-based eventization. This section also includes details of the TI-SNN classifier, as well as the RE-SNN, RndF, and CNN classifiers used for baseline comparison. Device classification results are presented in Section 3, emphasizing TI-SNN performance relative to baseline classifiers. The paper concludes with a research summary and conclusions in Section 4.
2. Demonstration Methodology
The TI-SNN is evaluated against RndF, CNN, and RE-SNN classifiers on a common WirelessHART dataset. One-Dimensional (1D) time-domain signals are converted to GTX matrices, then to non-eventized (NonEV) and eventized (EV) fingerprints across thresholds 0–1. Comparisons are evaluated based on %C classification accuracy and fingerprint sparsity. The TI-SNN and RE-SNN are also compared based on the number of spikes per inference (). Figure 1 provides the methodology overview with implementation details provided in Section 2.1 for the WirelessHART dataset, Section 2.2 for the eventized fingerprint generation process, and Section 2.3 for the classifiers used for evaluation.
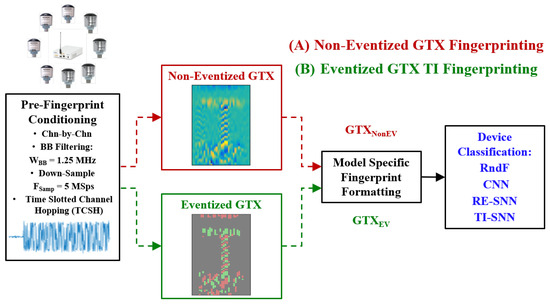
Figure 1.
Demonstration methodology showing the input WirelessHART dataset being used to generate non-eventized (NonEV) and eventized (EV) fingerprints to evaluate the TI-SNN classifier against baseline classifiers.
2.1. WirelessHART Signals
The experimental single-channel WirelessHART device collections used here originate from [9]. Table 1 summarizes the = 8 devices used to generate the dataset: four Siemens AW210 [29] and four Pepperl+Fuchs Bullet adapters [30]. The device transmissions were collected using a National Instruments N2952 Software Defined Radio (SDR) having an RF bandwidth of = 10 MHz and operating at a sample frequency of = 10 MSps in both the In-phase and Quadrature-phase (I/Q) channels. The SDR processing included baseband down-conversion, baseband filtering at a bandwidth of = 1.25 MHz and down-sampling to = 5 MSps [11] prior to data storage. Each collected burst preamble response used for fingerprinting included = 1251 samples spanning a duration 250.2 μs.

Table 1.
WirelessHART Device specifications for devices [9].
For comparison with earlier research [15], the Time-Slotted Channel Hopping (TSCH) bursts were Signal-to-Noise Ratio (SNR)-scaled to SNR = 20.0 dB prior to fingerprint generation by adding like-filtered ( = 1.25 MHz) Additive White Gaussian Noise (AWGN). There were a total of 8576 TSCH burst preamble responses collected per WirelessHART device, for a total of = 68,608 bursts used to generate fingerprints. This pool of available fingerprints was split into 60%/20%/20% sub-pools with approximately 60% (5145/device) used for model training, 20% (1715/device) used for model validation, and 20% (1715/device) held-out and used for model testing.
2.2. RF Signal Eventization Encoding
Each complex 1D burst is transformed to a complex Two-Dimensional (2D) GTX matrix with elements calculated using [12]
where is the th time domain sample of the 1D WirelessHART burst; is an energy-normalized Hamming window of width ; * denotes the complex conjugate; and are the row and column dimensions, respectively; and is the number of samples which is shifted between GTX calculations. The GTX in (1) can be generated under critical sampling conditions using and oversampling conditions using which is most beneficial when transforming noisy signals [31]. The GTX transform parameters used here included a Gaussian window width of = 0.01, = 75 time indices, = 75 frequency indices, and a window time shift of = 16 samples.
The fingerprinted GTX Region of Interest (ROI) was selected to focus on areas of higher signal activity and included magnitude elements for 1 75 and 21 54. The ROI matrix is a sub-matrix of the full dimension matrix and was processed as detailed in (2)–(5) to generate the non-eventized derivative and eventized matrices used for fingerprint generation. Both of these matrices are of dimension and have one fewer row than due to the time-differencing derivative operation used in (2).
The input matrix processing includes: time-differencing (row-wise derivative) in (2); centering (mean removal) in (3); and normalization in (4) to obtain the non-eventized real-valued float elements—the non-eventized fingerprint matrix.
Elements of in (4) were eventized using (5) to obtain the discrete elements. This eventization is effectively a 2D extension of the 1D threshold-based temporal coding method used in [32] for event-based classification of audio data sets. The eventized fingerprint matrix was formed using
where is the signum function, with = 0 by definition. The sign of provides an indication of event presence and polarity at a given time step and frequency bin pair. This includes indicating a negative event, indicating a positive event, and indicating no event was detected.
The effect of (2)–(5) processing is illustrated in Figure 2 for a representative preamble response of a WirelessHART TSCH burst. This figure shows pre-fingerprint formation processing for Figure 2a the burst magnitude matrix, Figure 2b the non-eventized derivative matrix per (4), and Figure 2c the eventized matrix per (5) for an eventization threshold of = 0.25.
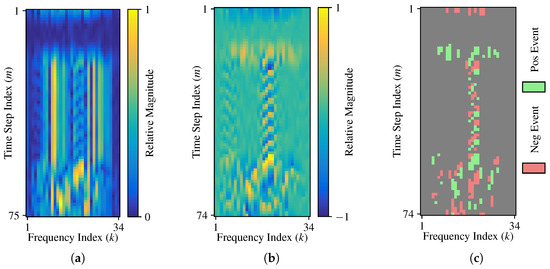
Figure 2.
Illustration of burst preprocessing stages showing responses for (a) the burst magnitude matrix, (b) the non-eventized derivative matrix, and (c) the eventized matrix for an eventization threshold of = 0.25.
To analyze the effects of eventization on classification accuracy, all classifiers were assessed using fingerprint features from both the non-eventized matrices and eventized matrices for normalized varied from 0-to-1 in steps of = 0.05. The range of normalized values in Figure 3 was empirically determined and accounts for all possible number of events per burst (). At , is maximized at . At , is minimized at 0. The average is defined here as the average number of non-zero elements in the eventized matrices with the average calculated using all bursts from all devices. for a given burst and eventization threshold is calculated as:
The Event Sparsity Ratio (ESR) for a given matrix is defined as the ratio of at a given vs. the total number of elements in and is calculated as:
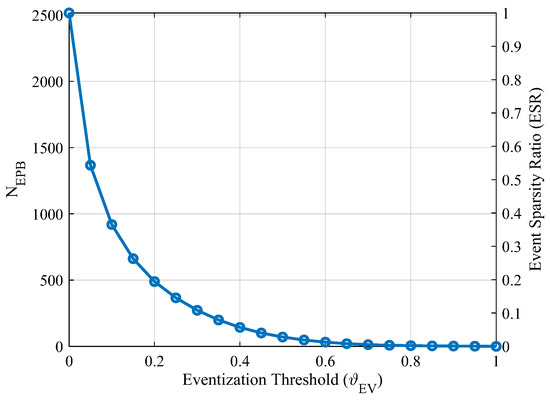
Figure 3.
Eventization threshold vs. (left vertical axis) and ESR (right vertical axis) averaged across all WirelessHART eventized fingerprints.
2.3. Classification Models
Traditional RndF and CNN classifiers were implemented to provide baselines for assessing TI-SNN classifier performance due to their common use in related RFF classification tasks [9,15]. Additionally, the RE-SNN is introduced given (1) it is one of the more recent advancements [33] used for SNN-based RFF classification [15], and (2) it supports the ability to quantitatively estimate and compare energy consumption of natively neuromorphic SNNs through spike counts. The RE-SNN uses rate encoding to convert the eventized matrices into spike trains for input to the SNN. Unlike [15], the RE-SNN does not rely on pre-training from a separate CNN classifier.
Other image-based discrimination alternatives such as You Only Look Once (YOLO) were initially considered as well. These were ultimately dismissed as options for the GTX fingerprint discrimination task given that discrimination between one fingerprint and another is the focus rather than object detecting within GTX fingerprints. Future work that requires localization (e.g., preamble–payload delimitation or multi-transmitter segmentation within larger GTX matrices) would warrant consideration of a detection model such as YOLO (or an SNN-adapted variant thereof).
The same hardware was used for all classifiers to enable direct comparisons. While processing was performed on an Apple M2 Pro, Sequoia 15.1 with Metal Performance Shaders (MPS) for Graphics Processing Unit (GPU) integration, all code developed has been verified to be portable for execution on NVIDIA Compute Unified Device Architecture (CUDA)-based Linux and Windows systems. The following subsections describe the implementation details of each classifier.
2.3.1. RndF Classifier
A traditional RndF classifier was implemented to provide the first baseline for assessing TI-SNN classifier performance. The RndF classifier was implemented in Python 3.11.9 using the scikit-learn 1.5.1 patch. The model-specific fingerprint formatting shown in Figure 1 for RndF classification included shaping the 2D ()-dimensional GTX matrices into (2516 × 1)-dimensional vectors. The RndF classifier was implemented using 100 trees (estimators), no max depth, a minimum of = 2 features per split, a minimum of = 1 feature per leaf, and a maximum of = 51 features per tree. Non-eventized classification provided the baseline for comparing with eventized classification with varying from 0-to-1 in steps of = 0.05. Once a RndF model was trained for each value the classification accuracy of the models were evaluated using the held-out test set.
2.3.2. CNN Classifier
A traditional CNN classifier was implemented to provide the second baseline for assessing TI-SNN classifier performance. The TI-SNN processes each fingerprint in sequential time increments while the entire fingerprint is input to the CNN classifier in one instance. Thus, no CNN-specific fingerprint formatting of is necessary. The CNN is tuned by adjusting the weight and bias of each neuron. The CNN classifier was implemented in Python 3.11.9 using the Tensorflow 2.17.0 platform with the same hardware implementation used for the RndF classifier.
The CNN classifier was implemented using two 2D convolution layers, with the first having = 36 Rectified Linear Unit (ReLU) nodes and the second having = 22 ReLU nodes. Both convolutional layers used a kernel size, and a stride. These layers were followed by a flattening layer and a softmax dense layer for classification. Values were chosen such that the CNN and TI-SNN had a comparable number of trainable parameters to models developed in [15]. Table 2 summarizes the structure of the CNN architecture. As with other classifiers, the hyperparameter was varied from 0-to-1 in steps of = 0.05 using a non-eventized fingerprint as a baseline.

Table 2.
CNN model architecture by layer, including trainable parameters.
CNN model training loss was based on categorical cross-entropy. Training was performed using a learning rate of 0.02 using Adam optimization in batches of 1024 fingerprints. Models were trained for a minimum of 20 epochs, 50 epochs maximum, with a patience of 10 epochs, such that if validation accuracy did not improve upon the best accuracy for 10 epochs, training would terminate and model parameters from the best epoch were saved. Once a CNN model was trained for each value of , the classification accuracy of the model was evaluated using the held-out test set.
2.3.3. TI-SNN Classifier
Rather than depending on an additional preprocessing step of rate encoding the eventized fingerprint, such as performed in [15] and the RE-SNN, the TI-SNN was designed to process eventized RF fingerprints in a time-incremental manner, i.e., one time step (GTX row) at a time. This approach is potentially more efficient than rate encoding by reducing the number of spikes required to represent the same information and reduces latency by enabling early time-increments of classification to begin before the entire fingerprint is available. The TI-SNN model was developed using Python 3.11.9, Pytorch 2.4.0 [34], and SNNTorch 0.9.1 [35].
While the TI-SNN preprocessing requirements are greatly reduced from the spike rate-encoding method used in [15], there remains two issues that had to be addressed to enable the TI-SNN classifier to process eventized fingerprints generated per (5) and depicted in Figure 2c. First, Pytorch does allow for negative spikes in SNN processing, but most neuromorphic hardware architectures only process positive spikes—only positive spikes are input to the TI-SNN classifier and exploiting negative spike information in Figure 2c is desired. Second, by design, the TI-SNN only processes a single row of frequency elements in during the mth timestep—all time steps need to be processed. To address these issues, the ()-dimensional eventized matrices such as depicted in Figure 2c are converted using the following steps:
where denotes input positive spike mapping, denotes input negative spike mapping, and ⋮ denotes concatenation. The resultant ()-dimensional fingerprint matrices are input to the TI-SNN classifier. The non-eventized ()-dimensional fingerprints are also positive element-only matrices formed by forgoing the eventization in (5) prior to concatenation. The TI-SNN is then able to process the resultant and fingerprint matrices row-by-row () where each row corresponds to time increment m.
As summarized in Table 3, the TI-SNN architecture is a dense 1D 4-layer Leaky Integrate-and-Fire (LIF) network that includes the input layer (), two hidden LIF layers ( and ), and the output LIF layer (). The per-layer and total number of SNN trainable parameters are also shown.

Table 3.
TI-SNN model architecture by layer, including trainable parameters.
The membrane potential for the nth neuron in the lth layer at time step m dictates the behavior of the LIF processing within the TI-SNN, and is given by [35]:
where:
- is the membrane decay rate.
- is the spiking threshold.
- is the number of neurons in the previous layer ( for ).
- is the spike output from the nth neuron in the previous layer.
For the input layer , the fingerprint matrix replaces the spike summation, where :
Spikes are generated using (13) with the membrane potential calculated from (12) for the first layer and (11) for subsequent dense layers. As indicated, when the nth-neuron in the lth-layer reaches the set threshold, the neuron fires and generates a spike, and the spike is passed to the next network layer.
After producing a spike, the neuron membrane potential is reset using a threshold subtraction reset method, i.e., threshold is subtracted from . While various reset methods were investigated, including reset-to-0 and reset-to-mean, the subtraction reset method was found to produce the best classification accuracy for the WirelessHART dataset. Note that while both and are adjusted during the TI-SNN training process, they are held fixed with respect to time-incrementation; and are not permitted to change at each time increment of a given fingerprint.
As the TI-SNN processes each of the fingerprint matrix time increments () according to the layers listed in Table 3, a sequence of output spikes is produced at the layer output for each class (device) (). The final class inference (estimate) is determined by the output neuron having the highest spike count once all of the time increments have been processed. This vote-tallied inference is made using
where n is the index of the output layer neuron and is the output spike indicator of neuron n at time step m.
The TI-SNN processing flow is illustrated using Figure 4 and Figure 5 using the matrix in Figure 2c and fingerprint from (10). Figure 4 shows TI-SNN time-increment selection of the mth row in used to form the output fingerprint vector that is input to the TI-SNN classifier.
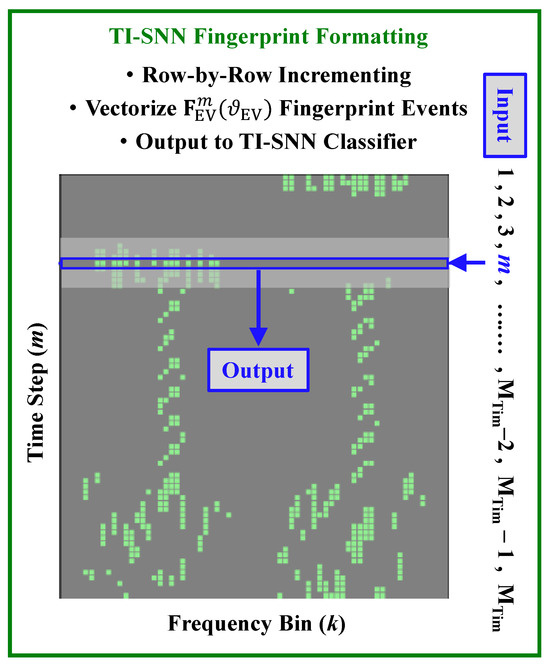
Figure 4.
TI-SNN GTX Fingerprint Time Increment Selection.
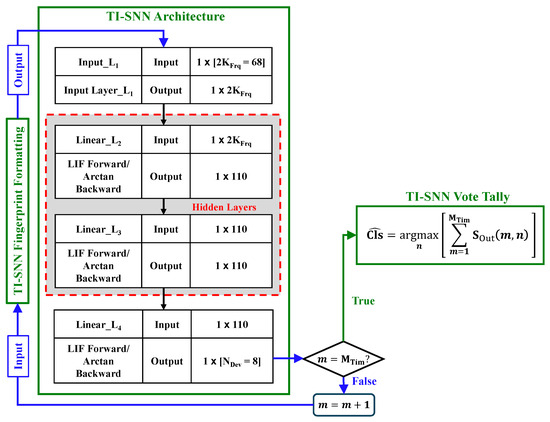
Figure 5.
TI-SNN Incremental Classification Flow.
The output row from Figure 4 is input to the TI-SNN classifier as shown in Figure 5. Sequential classifier processing continues until all time increments are processed. When the condition is satisfied, the class estimate () is formed using (14) as the TI-SNN vote tally output.
TI-SNN model training loss was calculated as the mean square error of the spike count. Ideally, a spike would be generated at the correct output node at every time increment for a given fingerprint. However, in practice, aiming for ideal output neuron firing can lead to dead neurons during training. As implemented, the loss function instead aimed to elicit the correct class in 90% of all time increments and the incorrect class in 10% of all time increments [35].
TI-SNN training was performed using a learning rate of 0.02 with Adam optimization and 1024 fingerprints per batch. As the spikes produced by the LIF neurons are non-differentiable, backpropagation of the network weights was performed using the arctangent function for surrogate gradients [35]. Models were trained for a minimum of 20 epochs, maximum of 50 epochs, with a patience of 10 epochs. Thus, when model validation accuracy did not improve upon the best accuracy across a sequential span of 10 epochs, model training was terminated and model parameters from the best epoch in that span were saved.
2.3.4. RE-SNN Classifier
The RE-SNN classifier was implemented to provide a baseline for assessing TI-SNN classifier performance—particularly in the context of SNN spike activity. The RE-SNN was developed using Python 3.11.9, Pytorch 2.4.0 [34], and SNNTorch 0.9.1 [35]. The RE-SNN requires the eventized fingerprint to be rate-encoded before input which introduces latency and may not fully exploit the temporal information present in the data. The RE-SNN is trained natively as a neuromorphic model and does not require CNN-toSNN conversion as performed in [15]. The RE-SNN model architecture was designed to have a comparable number of trainable parameters as the TI-SNN and CNN models.
The rate encoding process used here is similar to that described in [15], where each element of the eventized matrix is represented as a spike train over incremented time steps. For the RE-SNN, = 64 was empirically selected with sharply diminished improvements to occurring for > 64.
The architecture of the RE-SNN is identical to the CNN architecture summarized in Table 2, except that the activation functions in the convolutional and linear layers are replaced with LIF spiking neurons as detailed in Section 2.3.3. The RE-SNN model has a total of = 20,800 trainable parameters, which is comparable to the TI-SNN and CNN models.
The RE-SNN model training loss was calculated as the mean square error of the spike count, similar to the TI-SNN. The RE-SNN was trained using a learning rate of 0.02 with Adam optimization and 256 fingerprints per batch. Batch size was decreased compared to the TI-SNN to compensate for the increased dimensionality of the rate encoded features. Models were trained for a minimum of 20 epochs, maximum of 50 epochs, with a patience of 10 epochs. Once a RE-SNN model was trained for each value of , the classification accuracy of the model was evaluated using the held-out test set.
3. Results
This section presents device classification results for the proposed TI-SNN compared to the baseline RE-SNN, RndF, and CNN classifiers. Results are based on the WirelessHART dataset for = 8 devices operating in a TSCH mode. A total of = 8576 bursts are fingerprinted for each device corresponding to one of the = 8 classes. Thus, classification accuracies are provided for balanced dataset conditions which helps to ensure that the modeling does not favor a given majority class [36].
As detailed in Section 2, the WirelessHART TSCH bursts were GTX transformed using (2)–(4) to produce the 2D non-eventized matrix, . The corresponding 2D eventized matrix was produced using (5). The RndF, CNN, and TI-SNN classifiers were first trained and evaluated using to provide a baseline for comparing performance. All three classifiers were then retrained and evaluated using , with varying from 0-to-1 in steps of = 0.05. For statistical significance, the entire training and evaluation process was repeated a total of = 20 repetitions for each classifier using non-eventized and eventized fingerprints at each eventization threshold value.
Figure 6 shows representative TI-SNN model training and validation curves using Figure 6a non-eventized fingerprints and Figure 6b eventized fingerprints for a threshold of = 0.25. These results are consistent with what was obtained for other thresholds, demonstrating that validation accuracy converges towards a steady-state after approximately = 30 epochs without model over-fitting.
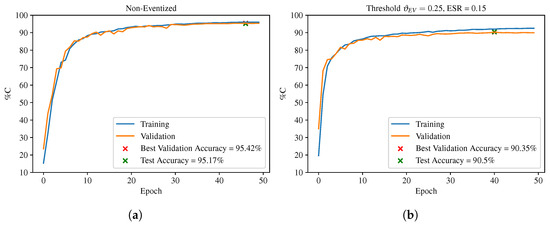
Figure 6.
Training curves for the TI-SNN classifier using (a) non-eventized fingerprints and (b) eventized fingerprints for .
Figure 7a shows classification accuracy (%C) for the WirelessHART dataset for a selected range of eventization threshold values. The corresponding non-eventized performances for each classifier are provided and used in the subsequent non-eventized vs. eventized performance comparisons. An arbitrary %C = 90% benchmark is likewise shown for reference and used for drawing conclusions. As shown, the CNN generally outperforms all other classifiers for a majority of values, with statistically equivalent CNN and RndF performance obtained for . The RndF and TI-SNN classifiers both reach the %C = 90% benchmark and achieve near-identical eventized accuracies of at = 0.25 where performance is maximum. The RE-SNN classifier does not exceed the %C = 90% benchmark for any value, achieving a maximum eventized accuracy of at = 0.05. All classifiers show a decrease in %C at as every nonzero element of the GTX matrix is treated as an event. Since each element can only be positive or negative, the encoding collapses into a binary choice between “positive event” and “negative event.” This eliminates the third possibility of “no event,” which normally emerges once the threshold is raised above zero.
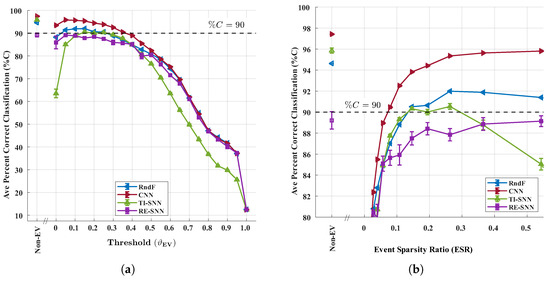
Figure 7.
Classification results using the WirelessHART dataset with error bars reflecting 95% confidence. Results for (a) %C vs. eventization threshold () for the TI-SNN, CNN, and RndF classifiers, and (b) %C vs. Event Sparsity Ratio (ESR) for the same classifiers.
Overall CNN %C classification superiority over the RndF, RE-SNN, and TI-SNN classifiers in Figure 7a is expected. The CNN contextualizes the entire 2D fingerprint matrix without enforcing temporal causality—activity and events occurring later in the burst sequence can affect the inference of earlier time steps. Practically, this means that all elements of the matrix must be available before CNN inference may begin. In contrast, the TI-SNN is the only classifier considered that enforces temporal causality—spikes occurring during later time increments within the burst do not affect inference during the earlier time increments. This allows the TI-SNN to begin classification as soon as the first row of the matrix is available. The decrease in RndF classification accuracy compared to the CNN is likewise expected as RndF input fingerprint vectorization removes temporal information. The RndF classifier does not benefit from the temporal causality enforced by the TI-SNN classifier.
Figure 7b reframes %C against ESR as defined in (7). denotes dense event fingerprints and denotes sparse fingerprints. For SNNs, lower ESR is desired as it generally implies lower spike activity and potential energy savings, whereas CNN and RndF do not directly benefit from sparsity.
The decrease in TI-SNN %C at higher ESR values is not of operational interest given that SNN processing using denser fingerprints requires more energy while producing lower %C. Of greater interest are the ESR values where the SNN classifiers achieve the highest %C classification accuracy. These ESR values lead to lower energy consumption while providing marginal %C classification accuracy loss when compared to traditional classifiers. The TI-SNN achieves maximum eventized accuracy at ESR = 0.146; approximately a 6.8× reduction in fingerprint event density compared to non-eventized fingerprints.
Figure 8 assesses classification accuracy of each classifier using non-eventized fingerprints (unfilled markers) and eventized fingerprints (filled markers) for = 0.25 and ESR = 0.15. The difference between the non-eventized and eventized fingerprint classification accuracies is denoted as the eventization loss, . Only the RE-SNN did not exceed the arbitrary %C = 90% benchmark. All classifiers incurred a loss in classification accuracy when transitioning from non-eventized to eventized fingerprints. However, the single-digit 5% degradation is consistent with prior eventization work and reasonably acceptable when considering energy efficiency benefits of neuromorphic-friendly eventization processing [1].
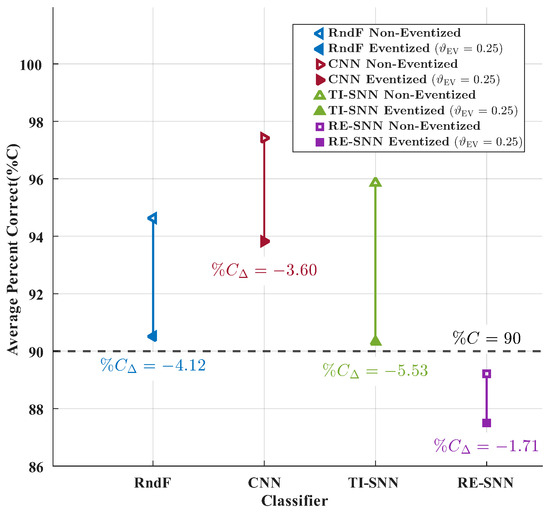
Figure 8.
WirelessHART eventization loss for all classifiers.
Figure 9 compares the average number of spikes generated by the TI-SNN and RE-SNN classifiers as a function of eventization threshold, . Over all values, the TI-SNN generates significantly fewer spikes compared to the RE-SNN with an average 70× reduction in spikes generated. This is expected given that the TI-SNN processes eventized fingerprints sequentially, while the RE-SNN processes the entire eventized fingerprint at every time step. The TI-SNN is able to leverage temporal causality to reduce the number of spikes generated during inference. This reduction in spikes is important as it directly correlates to energy consumption during inference [37]. Thus, the TI-SNN has the potential to be 70× more energy-efficient compared to the RE-SNN classifier. Of note for the TI-SNN, the non-eventized fingerprints produce a statistically similar number of spikes compared to = 0.25 eventized fingerprints, indicating that eventization at this threshold does not significantly reduce the number of spikes generated. However, eventization may still provide benefits in terms of reducing the quantization of data that needs to be processed, which can lead to lower latency and energy consumption [1].
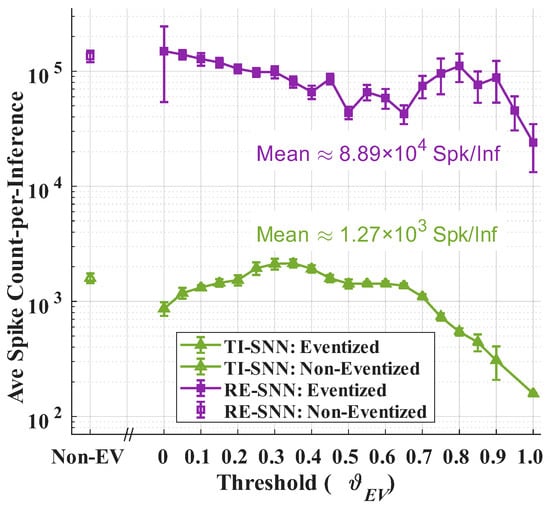
Figure 9.
Average number of spikes generated by the TI-SNN and RE-SNN classifiers as a function of eventization threshold, .
4. Summary and Conclusions
The discrimination of Radio Frequency (RF) electronic devices using Radio Frequency Fingerprinting (RFF) remains an area of multi-national interest. RFF implementation methods are as varied as the communication signals considered [7] and application within the Internet of Things (IoT) domain is no exception [8]. Common objectives include finding efficient processing methods using fingerprints having desirable features that are unique to devices, relatively stable over time, and independent of channel conditions. Efficiency improvement is addressed here using a Time-Incremented Spiking Neural Network (TI-SNN) that supports development of an envisioned ‘RF Event Radio’ concept that was introduced in [1]. Progress towards this goal was subsequently bolstered using a rate-encoded neuromorphic-friendly Spiking Neural Network (SNN) [15]. The Rate Encoded SNN (RE-SNN) presented here is a shift away from relying on pretraining from another classifier and is presented as a baseline of comparison to the proposed TI-SNN classifier. The TI-SNN enforces temporal causality, does not require pre-training from another classifier, and does not require rate encoding the Gabor Transform (GTX) fingerprint features.
While overall TI-SNN classification accuracy is lower than Convolutional Neural Network (CNN) accuracy using Eventized (EV) fingerprints, the TI-SNN provides greater potential for improving energy efficiency given its ability to limit energy consumption in proportion to eventized fingerprint sparsity. The TI-SNN achieves a maximum eventized classification accuracy of at . This Event Sparsity Ratio (ESR) value indicates a 6.8× reduction of event density in the fingerprint matrix through the process of eventization. Generally, an SNN only expends energy when processing events [37]. Thus, there is potential for the TI-SNN to achieve lower energy consumption compared to the CNN and Random Forest (RndF) classifiers, which process all data regardless of event density. The SNNs’ lower event density in the fingerprint matrix suggests that it may require less energy to process the same amount of information compared to the CNN and RndF. Compared to the RE-SNN, the TI-SNN generates 70× fewer spikes. This reduction in spikes is important as it directly correlates to energy consumption during inference for SNNs [37]. Thus, the TI-SNN has the potential to be 70× more energy-efficient compared to the RE-SNN classifier.
An additional benefit of the TI-SNN is the enforcement of temporal causality which allows for the classification process to begin as soon as the first row of the GTX fingerprint matrix is available. This contrasts with the CNN, RndF, and RE-SNN which require the entire GTX matrix to be available before classification can begin. Enforcing temporal causality may lead to lower latency in the classification process and make the TI-SNN more suitable for real-time applications.
The marginally lower accuracy of the TI-SNN classifier may render it unsuitable for all applications. However, it remains as a viable alternative that warrants continued development for applications where energy efficiency and latency are of primary concern. These applications include remote sensing in edge or near-edge low-power devices which must operate within Size, Weight, and Power (SWaP) constraints. The TI-SNN’s ability to process eventized fingerprints directly without the need for a pre-trained CNN classifier is a significant advantage in the development of an energy-efficient, end-to-end neuromorphic RF event radio classification system.
The 6.8× and 70× reduction provided here for fingerprint event density and the number of spikes per inference, respectively, suggests that future work is warranted to evaluate TI-SNN classifier energy consumption and latency performance using various hardware. This evaluation is particularly important for SWaP-constrained applications. TI-SNN classifier applicability and generalizability to other RF signal types should be investigated, as well as operation of these devices in different environments. Finally, integration of the TI-SNN architecture into a larger neuromorphic-centric RF-based classification system will be investigated—the goal includes demonstrating a fully neuromorphic RF event radio capability providing real-time, or near real-time, operation with lower latency and lower energy consumption.
Author Contributions
Conceptualization, D.L.W. and M.A.T.; data curation, M.A.T.; formal analysis, D.L.W., M.A.T. and B.J.B.; investigation, D.L.W.; methodology, D.L.W., M.A.T. and B.J.B.; project administration, M.A.T.; resources, M.A.T.; supervision, M.A.T.; graphic visualization, D.L.W. and M.A.T.; writing—original draft, D.L.W.; writing—review and editing, D.L.W., M.A.T. and B.J.B. All authors have read and agreed to the published version of the manuscript.
Funding
This research was funded in part by support funding received from the Spectrum Warfare Division, Sensors Directorate, U.S. Air Force Research Laboratory, Wright-Patterson AFB, Dayton OH, during U.S. Government Fiscal Years 2023–2025.
Institutional Review Board Statement
Not applicable.
Informed Consent Statement
Not applicable.
Data Availability Statement
The experimentally collected WirelessHART data used to obtain results were not approved for public release at the time of paper submission. Requests for release of these data to a third party should be directed to the corresponding author. Data distribution to a third party will be made on a request-by-request basis and is subject to public affairs approval.
Acknowledgments
The views and conclusions contained in this document are those of the authors and should not be interpreted as representing the official policies, either expressed or implied, of the United States Air Force or the U.S. Government. This paper is approved for public release, Case Number 88ABW-2025-0554.
Conflicts of Interest
The authors declare no conflicts of interest. The funders had no role in the design of the study; in the collection, analyses, or interpretation of data; in the writing of the manuscript, or in the decision to publish the results.
Abbreviations
The following abbreviations are used in this manuscript:
| 1D | One-Dimensional |
| 2D | Two-Dimensional |
| AWGN | Additive White Gaussian Noise |
| CNN | Convolutional Neural Network |
| CUDA | Compute Unified Device Architecture |
| ESR | Event Sparsity Ratio |
| EV | Eventized |
| GPU | Graphics Processing Unit |
| GTX | Gabor Transform |
| IoT | Internet of Things |
| LIF | Leaky Integrate-and-Fire |
| MPS | Metal Performance Shaders |
| NonEV | Non-Eventized |
| ReLU | Rectified Linear Unit |
| RE-SNN | Rate-Encoded Spiking Neural Network |
| RF | Radio Frequency |
| RFF | Radio Frequency Fingerprinting |
| RndF | Random Forest |
| ROI | Region of Interest |
| SDR | Software Defined Radio |
| SNN | Spiking Neural Network |
| SNR | Signal-to-Noise Ratio |
| SWaP | Size, Weight, and Power |
| TI-SNN | Time-Incremented Spiking Neural Network |
| TSCH | Time-Slotted Channel Hopping |
| WirelessHART | Wireless Highway Addressable Remote Transducer |
| YOLO | You Only Look Once |
References
- Smith, M.J.; Temple, M.A.; Dean, J.W. Effects of RF Signal Eventization Encoding on Device Classification Performance. Electronics 2024, 13, 2020. [Google Scholar] [CrossRef]
- Gallego, G.; Delbrück, T.; Orchard, G.; Bartolozzi, C.; Taba, B.; Censi, A.; Leutenegger, S.; Davison, A.J.; Conradt, J.; Daniilidis, K.; et al. Event-Based Vision: A Survey. IEEE Trans. Pattern Anal. Mach. Intell. 2022, 44, 154–180. [Google Scholar] [CrossRef]
- Davies, M.; Srinivasa, N.; Lin, T.H.; Chinya, G.; Cao, Y.; Choday, S.H.; Dimou, G.; Joshi, P.; Imam, N.; Jain, S.; et al. Loihi: A Neuromorphic Manycore Processor with On-Chip Learning. IEEE Micro 2018, 38, 82–99. [Google Scholar] [CrossRef]
- Serinken, N.; Üreten, O. Generalised Dimension Characterisation of Radio Transmitter Turn-on Transients. Electron. Lett. 2000, 36, 1064–1066. [Google Scholar] [CrossRef]
- Hall, J.; Barbeau, M.; Kranakis, E. Detection of Transient in Radio Frequency Fingerprinting Using Signal Phase. In Proceedings of the IASTED International Conference on Wireless and Optical Communications, Benalmadena, Spain, 8–10 September 2003. [Google Scholar]
- Ureten, O.; Serinken, N. Wireless Security through RF Fingerprinting. Can. J. Electr. Comput. Eng. 2007, 32, 27–33. [Google Scholar] [CrossRef]
- Soltanieh, N.; Norouzi, Y.; Yang, Y.; Karmakar, N.C. A Review of Radio Frequency Fingerprinting Techniques. IEEE J. Radio Freq. Identif. 2020, 4, 222–233. [Google Scholar] [CrossRef]
- Xie, L.; Peng, L.; Zhang, J.; Hu, A. Radio Frequency Fingerprint Identification for Internet of Things: A Survey. Secur. Saf. 2024, 3, 2023022. [Google Scholar] [CrossRef]
- Rondeau, C.M.; Temple, M.A.; Kabban, C.S. DNA Feature Selection for Discriminating WirelessHART IIoT Devices. In Proceedings of the Annual Hawaii International Conference on System Sciences, Maui, HI, USA, 7–10 January 2020; pp. 6387–6396. [Google Scholar] [CrossRef]
- Gutierrez del Arroyo, J.A.; Borghetti, B.J.; Temple, M.A. Considerations for Radio Frequency Fingerprinting across Multiple Frequency Channels. Sensors 2022, 22, 2111. [Google Scholar] [CrossRef]
- Maier, M.J.; Hayden, H.S.; Temple, M.A.; Fickus, M.C. Ensuring the Longevity of WirelessHART Devices in Industrial Automation and Control Systems using Distinct Native Attribute Fingerprinting. Int. J. Crit. Infrastruct. Prot. 2023, 43, 100641. [Google Scholar] [CrossRef]
- Bastiaans, M.J. Gabor’s Expansion of a Signal into Gaussian Elementary Signals. Proc. IEEE 1980, 68, 538–539. [Google Scholar] [CrossRef]
- Bastiaans, M.J.; Geilen, M.C. On the Discrete Gabor Transform and the Discrete Zak Transform. Signal Process. 1996, 49, 151–166. [Google Scholar] [CrossRef]
- Qian, S.; Chen, D. Discrete Gabor Transform. IEEE Trans. Signal Process. 1993, 41, 2429–2438. [Google Scholar] [CrossRef]
- Smith, M.; Temple, M.; Dean, J. Development of a Neuromorphic-Friendly Spiking Neural Network for RF Event-Based Classification. In Proceedings of the Annual Hawaii International Conference on System Sciences, Big Island, HI, USA, 7–10 January 2020; pp. 7092–7101. Available online: https://hdl.handle.net/10125/109699 (accessed on 15 September 2025).
- Auge, D.; Hille, J.; Mueller, E.; Knoll, A. A Survey of Encoding Techniques for Signal Processing in Spiking Neural Networks. Neural Process. Lett. 2021, 53, 4693–4710. [Google Scholar] [CrossRef]
- Zhang, H.; Fan, X.; Zhang, Y. Energy-Efficient Spiking Segmenter for Frame and Event-Based Images. Biomimetics 2023, 8, 356. [Google Scholar] [CrossRef] [PubMed]
- López-Asunción, S.; Ituero, P. Enabling Efficient On-Edge Spiking Neural Network Acceleration with Highly Flexible FPGA Architectures. Electronics 2024, 13, 1074. [Google Scholar] [CrossRef]
- Xue, J.; Xie, L.; Chen, F.; Wu, L.; Tian, Q.; Zhou, Y.; Ying, R.; Liu, P. EdgeMap: An Optimized Mapping Toolchain for Spiking Neural Network in Edge Computing. Sensors 2023, 23, 6548. [Google Scholar] [CrossRef] [PubMed]
- Jiang, X.; Xie, H.; Lu, Z.; Hu, J. Energy-Efficient and High-Performance Ship Classification Strategy Based on Siamese Spiking Neural Network in Dual-Polarized SAR Images. Remote Sens. 2023, 15, 4966. [Google Scholar] [CrossRef]
- Wu, Y.; Cai, C.; Bi, X.; Xia, J.; Gao, C.; Tang, Y.; Lai, S. Intelligent resource allocation scheme for cloud-edge-end framework aided multi-source data stream. EURASIP J. Adv. Signal Process. 2023, 56. [Google Scholar] [CrossRef]
- Baidya, T.; Moh, S. Comprehensive Survey on Resource Allocation for Edge-Computing-Enabled Metaverse. Comput. Sci. Rev. 2024, 54, 100680. [Google Scholar] [CrossRef]
- Adil, M.; Song, H.; Khan, M.K.; Farouk, A.; Jin, Z. 5G/6G-enabled Metaverse Technologies: Taxonomy, Applications, and Open Security Challenges with Future Research Directions. J. Netw. Comput. Appl. 2024, 223, 103828. [Google Scholar] [CrossRef]
- Sarah, A.; Nencioni, G.; Khan, M.I. Resource Allocation in Multi-access Edge Computing for 5G-and-Beyond Networks. Comput. Netw. 2023, 227, 109720. [Google Scholar] [CrossRef]
- Ahmad, I.; Gentili, A.; Singh, R.; Ahonen, J.; Suomalainen, J.; Horsmanheimo, S.; Keranen, H.; Harjula, E. Edge computing for critical environments: Vision and existing solutions. Itu J. Future Evol. Technol. 2023, 4, 697–710. [Google Scholar] [CrossRef]
- Zhang, S.; Tong, X.; Chi, K.; Gao, W.; Chen, X.; Shi, Z. Stackelberg Game-Based Multi-Agent Algorithm for Resource Allocation and Task Offloading in MEC-Enabled C-ITS. IEEE Trans. Intell. Transp. Syst. 2025, 1–12. [Google Scholar] [CrossRef]
- Yıldırım, F.; Yalman, Y.; Bayındır, K.Ç.; Terciyanlı, E. Comprehensive Review of Edge Computing for Power Systems: State of the Art, Architecture, and Applications. Appl. Sci. 2025, 15, 4592. [Google Scholar] [CrossRef]
- Suraci, C.; Chukhno, O.; Muntean, G.M.; Molinaro, A.; Araniti, G. Migrate or Not: Medical Digital Twins in the Era of 6G Edge-Based Networks. IEEE Access 2025, 13, 85641–85651. [Google Scholar] [CrossRef]
- Siemens Industry Online Support. WirelessHART Adapter SITRANS AW210—7MP3111. Available online: https://support.industry.siemens.com/cs/document/61527553/wirelesshart-adapter-sitrans-aw210-7mp3111 (accessed on 15 September 2025).
- Pepperl and Fuchs. BULLET—WirelessHART Adapter. Available online: https://www.pepperl-fuchs.com/en/products-gp25581/90287 (accessed on 15 September 2025).
- Zibulski, M.; Zeevi, Y. Oversampling in the Gabor scheme. IEEE Trans. Signal Process. 1993, 41, 2679–2687. [Google Scholar] [CrossRef]
- Forno, E.; Fra, V.; Pignari, R.; Macii, E.; Urgese, G. Spike encoding techniques for IoT time-varying signals benchmarked on a neuromorphic classification task. Front. Neurosci. 2022, 16, 29. [Google Scholar] [CrossRef] [PubMed]
- Yan, Z.; Tang, K.; Zhou, J.; Wong, W. Low Latency Conversion of Artificial Neural Network Models to Rate-Encoded Spiking Neural Networks. IEEE Trans. Neural Netw. Learn. Syst. 2025, 36, 14107–14118. [Google Scholar] [CrossRef]
- Paszke, A.; Gross, S.; Massa, F.; Lerer, A.; Google, J.B.; Chanan, G.; Killeen, T.; Lin, Z.; Gimelshein, N.; Antiga, L.; et al. PyTorch: An Imperative Style, High-Performance Deep Learning Library. Adv. Neural Inf. Process. Syst. 2019, 32, 1–12. [Google Scholar] [CrossRef]
- Eshraghian, J.K.; Ward, M.; Neftci, E.O.; Wang, X.; Lenz, G.; Dwivedi, G.; Bennamoun, M.; Jeong, D.S.; Lu, W.D. Training Spiking Neural Networks Using Lessons from Deep Learning. Proc. IEEE 2023, 111, 1016–1054. [Google Scholar] [CrossRef]
- Goodfellow, I.; Bengio, Y.; Courville, A. Deep Learning; MIT Press: Cambridge, MA, USA, 2016. [Google Scholar]
- Esser, S.K.; Merolla, P.A.; Arthur, J.V.; Cassidy, A.S.; Appuswamy, R.; Andreopoulos, A.; Berg, D.J.; McKinstry, J.L.; Melano, T.; Barch, D.R.; et al. Convolutional Networks for Fast, Energy-Efficient Neuromorphic Computing. Proc. Natl. Acad. Sci. USA 2016, 113, 11441–11446. [Google Scholar] [CrossRef] [PubMed]
Disclaimer/Publisher’s Note: The statements, opinions and data contained in all publications are solely those of the individual author(s) and contributor(s) and not of MDPI and/or the editor(s). MDPI and/or the editor(s) disclaim responsibility for any injury to people or property resulting from any ideas, methods, instructions or products referred to in the content. |
© 2025 by the authors. Licensee MDPI, Basel, Switzerland. This article is an open access article distributed under the terms and conditions of the Creative Commons Attribution (CC BY) license (https://creativecommons.org/licenses/by/4.0/).