

Multi-Task Deep Learning for Lung Nodule Detection and Segmentation in CT Scans: A Review


Abstract
1. Introduction
2. Evaluation Metrics
2.1. IQA Metrics
2.2. Task Performance Metrics for Detection and Segmentation
3. Datasets for Lung Nodule Analysis
4. Image Preprocessing
5. Lung Segmentation
6. Lung Nodule Detection
6.1. Traditional Methods
6.2. Deep Learning-Based Detection
7. Lung Nodule Segmentation
7.1. Traditional Methods
7.2. Deep Learning-Based Segmentation
8. MTL in Medical Image Analysis
8.1. Overview of MTL
8.2. Applications in Medical Imaging
8.3. MTL in Lung Nodule Detection and Segmentation
9. Research Gaps and Future Directions
10. Conclusions
Author Contributions
Funding
Data Availability Statement
Conflicts of Interest
References
- Riquelme, D.; Akhloufi, M.A. Deep learning for lung cancer nodules detection and classification in CT scans. Ai 2020, 1, 28–67. [Google Scholar] [CrossRef]
- Marinakis, I.; Karampidis, K.; Papadourakis, G. Pulmonary Nodule Detection, Segmentation and Classification Using Deep Learning: A Comprehensive Literature Review. BioMedInformatics 2024, 4, 2043–2106. [Google Scholar] [CrossRef]
- Cancer Research UK. Lung Cancer Statistics. 2025. Available online: https://www.cancerresearchuk.org/health-professional/cancer-statistics/statistics-by-cancer-type/lung-cancer#lung_stats1 (accessed on 5 June 2025).
- Wang, Y.; Mustaza, S.M.; Ab-Rahman, M.S. Pulmonary Nodule Segmentation using Deep Learning: A Review. IEEE Access 2024, 12, 119039–119055. [Google Scholar] [CrossRef]
- MacMahon, H.; Naidich, D.P.; Goo, J.M.; Lee, K.S.; Leung, A.N.; Mayo, J.R.; Mehta, A.C.; Ohno, Y.; Powell, C.A.; Prokop, M.; et al. Guidelines for management of incidental pulmonary nodules detected on CT images: From the Fleischner Society 2017. Radiology 2017, 284, 228–243. [Google Scholar] [CrossRef]
- Zheng, L.; Lei, Y. A review of image segmentation methods for lung nodule detection based on computed tomography images. MATEC Web Conf. 2018, 232, 02001. [Google Scholar] [CrossRef]
- Pehrson, L.M.; Nielsen, M.B.; Ammitzbøl Lauridsen, C. Automatic pulmonary nodule detection applying deep learning or machine learning algorithms to the LIDC-IDRI database: A systematic review. Diagnostics 2019, 9, 29. [Google Scholar] [CrossRef] [PubMed]
- Alshayeji, M.H.; Abed, S. Lung cancer classification and identification framework with automatic nodule segmentation screening using machine learning. Appl. Intell. 2023, 53, 19724–19741. [Google Scholar] [CrossRef]
- Li, R.; Xiao, C.; Huang, Y.; Hassan, H.; Huang, B. Deep learning applications in computed tomography images for pulmonary nodule detection and diagnosis: A review. Diagnostics 2022, 12, 298. [Google Scholar] [CrossRef]
- El-Baz, A.; Beache, G.M.; Gimel farb, G.; Suzuki, K.; Okada, K.; Elnakib, A.; Soliman, A.; Abdollahi, B. Computer-aided diagnosis systems for lung cancer: Challenges and methodologies. Int. J. Biomed. Imaging 2013, 2013, 942353. [Google Scholar] [CrossRef]
- Zhu, Z.; Sun, Y.; Honarvar Shakibaei Asli, B. Early Breast Cancer Detection Using Artificial Intelligence Techniques Based on Advanced Image Processing Tools. Electronics 2024, 13, 3575. [Google Scholar] [CrossRef]
- Sun, Y.; Zhu, Z.; Asli, B.H.S. Automated Classification and Segmentation and Feature Extraction from Breast Imaging Data. Electronics 2024, 13, 3814. [Google Scholar] [CrossRef]
- Zhang, G.; Jiang, S.; Yang, Z.; Gong, L.; Ma, X.; Zhou, Z.; Bao, C.; Liu, Q. Automatic nodule detection for lung cancer in CT images: A review. Comput. Biol. Med. 2018, 103, 287–300. [Google Scholar] [CrossRef]
- Tang, H.; Zhang, C.; Xie, X. Nodulenet: Decoupled false positive reduction for pulmonary nodule detection and segmentation. In Proceedings of the Medical Image Computing and Computer Assisted Intervention–MICCAI 2019: 22nd International Conference, Shenzhen, China, 13–17 October 2019; Proceedings, Part VI 22. Springer: Berlin/Heidelberg, Germany, 2019; pp. 266–274. [Google Scholar]
- Song, G.; Nie, Y.; Zhang, J.; Chen, G. Multi-task weakly-supervised learning model for pulmonary nodules segmentation and detection. In Proceedings of the 2020 International Conference on Innovation Design and Digital Technology (ICIDDT), Zhenjing, China, 5–6 December 2020; IEEE: Piscataway, NJ, USA, 2020; pp. 343–347. [Google Scholar]
- Luo, D.; He, Q.; Ma, M.; Yan, K.; Liu, D.; Wang, P. ECANodule: Accurate Pulmonary Nodule Detection and Segmentation with Efficient Channel Attention. In Proceedings of the 2023 International Joint Conference on Neural Networks (IJCNN), Gold Coast, Australia, 18–23 June 2023; IEEE: Piscataway, NJ, USA, 2023; pp. 1–8. [Google Scholar]
- Zhang, Y.; Yang, Q. A survey on multi-task learning. IEEE Trans. Knowl. Data Eng. 2021, 34, 5586–5609. [Google Scholar] [CrossRef]
- Thung, K.H.; Wee, C.Y. A brief review on multi-task learning. Multimed. Tools Appl. 2018, 77, 29705–29725. [Google Scholar] [CrossRef]
- Zhao, Y.; Wang, X.; Che, T.; Bao, G.; Li, S. Multi-task deep learning for medical image computing and analysis: A review. Comput. Biol. Med. 2023, 153, 106496. [Google Scholar] [CrossRef] [PubMed]
- Chow, L.S.; Paramesran, R. Review of medical image quality assessment. Biomed. Signal Process. Control 2016, 27, 145–154. [Google Scholar] [CrossRef]
- Kang, S.H.; Park, M.; Yoon, M.S.; Lee, Y. Quantitative evaluation of total variation noise reduction algorithm in CT images using 3D-printed customized phantom for femur diagnosis. J. Korean Phys. Soc. 2022, 81, 450–459. [Google Scholar] [CrossRef]
- Wang, Z.; Bovik, A.C. Mean squared error: Love it or leave it? A new look at signal fidelity measures. IEEE Signal Process. Mag. 2009, 26, 98–117. [Google Scholar] [CrossRef]
- Lei, Y.; Niu, C.; Zhang, J.; Wang, G.; Shan, H. CT image denoising and deblurring with deep learning: Current status and perspectives. IEEE Trans. Radiat. Plasma Med. Sci. 2023, 8, 153–172. [Google Scholar] [CrossRef]
- Setio, A.A.A.; Traverso, A.; De Bel, T.; Berens, M.S.; Van Den Bogaard, C.; Cerello, P.; Chen, H.; Dou, Q.; Fantacci, M.E.; Geurts, B.; et al. Validation, comparison, and combination of algorithms for automatic detection of pulmonary nodules in computed tomography images: The LUNA16 challenge. Med. Image Anal. 2017, 42, 1–13. [Google Scholar] [CrossRef]
- Armato III, S.G.; McLennan, G.; Bidaut, L.; McNitt-Gray, M.F.; Meyer, C.R.; Reeves, A.P.; Zhao, B.; Aberle, D.R.; Henschke, C.I.; Hoffman, E.A.; et al. The lung image database consortium (LIDC) and image database resource initiative (IDRI): A completed reference database of lung nodules on CT scans. Med. Phys. 2011, 38, 915–931. [Google Scholar] [CrossRef] [PubMed]
- Trial Summary—Learn—NLST—The Cancer Data Access System. Available online: https://cdas.cancer.gov/learn/nlst/trial-summary/ (accessed on 14 July 2025).
- Van Ginneken, B.; Armato III, S.G.; de Hoop, B.; van Amelsvoort-van de Vorst, S.; Duindam, T.; Niemeijer, M.; Murphy, K.; Schilham, A.; Retico, A.; Fantacci, M.E.; et al. Comparing and combining algorithms for computer-aided detection of pulmonary nodules in computed tomography scans: The ANODE09 study. Med. Image Anal. 2010, 14, 707–722. [Google Scholar] [CrossRef] [PubMed]
- ELCAP Public Lung Image Database. Available online: http://www.via.cornell.edu/lungdb.html (accessed on 14 July 2025).
- Organizers., A.T.C. Tianchi Medical AI Competition Dataset. 2017. Available online: https://tianchi.aliyun.com/competition/entrance/231601/information (accessed on 14 July 2025).
- Halder, A.; Dey, D.; Sadhu, A.K. Lung nodule detection from feature engineering to deep learning in thoracic CT images: A comprehensive review. J. Digit. Imaging 2020, 33, 655–677. [Google Scholar] [CrossRef] [PubMed]
- Asuntha, A.; Srinivasan, A. Deep learning for lung Cancer detection and classification. Multimed. Tools Appl. 2020, 79, 7731–7762. [Google Scholar] [CrossRef]
- Mridha, M.; Prodeep, A.R.; Hoque, A.M.; Islam, M.R.; Lima, A.A.; Kabir, M.M.; Hamid, M.A.; Watanobe, Y. A comprehensive survey on the progress, process, and challenges of lung cancer detection and classification. J. Healthc. Eng. 2022, 2022, 5905230. [Google Scholar] [CrossRef]
- Chen, B.; Kitasaka, T.; Honma, H.; Takabatake, H.; Mori, M.; Natori, H.; Mori, K. Automatic segmentation of pulmonary blood vessels and nodules based on local intensity structure analysis and surface propagation in 3D chest CT images. Int. J. Comput. Assist. Radiol. Surg. 2012, 7, 465–482. [Google Scholar] [CrossRef]
- Soltaninejad, S.; Keshani, M.; Tajeripour, F. Lung nodule detection by KNN classifier and active contour modelling and 3D visualization. In Proceedings of the 16th CSI International Symposium on Artificial Intelligence and Signal Processing (AISP 2012), Shiraz, Iran, 2–3 May 2012; IEEE: Piscataway, NJ, USA, 2012; pp. 440–445. [Google Scholar]
- Tun, K.M.M.; Soe, K.A. Feature extraction and classification of lung cancer nodule using image processing techniques. Int. J. Eng. Res. Technol. 2014, 3, 2204–2210. [Google Scholar]
- Sangamithraa, P.; Govindaraju, S. Lung tumour detection and classification using EK-Mean clustering. In Proceedings of the 2016 International Conference on Wireless Communications, Signal Processing and Networking (WiSPNET), Chennai, India, 23–25 March 2016; IEEE: Piscataway, NJ, USA, 2016; pp. 2201–2206. [Google Scholar]
- Namin, S.T.; Moghaddam, H.A.; Jafari, R.; Esmaeil-Zadeh, M.; Gity, M. Automated detection and classification of pulmonary nodules in 3D thoracic CT images. In Proceedings of the 2010 IEEE International Conference on Systems, Man and Cybernetics, Istanbul, Turkey, 10–13 October 2010; IEEE: Piscataway, NJ, USA, 2010; pp. 3774–3779. [Google Scholar]
- Rossetto, A.M.; Zhou, W. Deep learning for categorization of lung cancer ct images. In Proceedings of the 2017 IEEE/ACM International Conference on Connected Health: Applications, Systems and Engineering Technologies (CHASE), Philadelphia, PA, USA, 17–19 July 2017; IEEE: Piscataway, NJ, USA, 2017; pp. 272–273. [Google Scholar]
- Young, I.T.; Van Vliet, L.J. Recursive implementation of the Gaussian filter. Signal Process. 1995, 44, 139–151. [Google Scholar] [CrossRef]
- Neycenssac, F. Contrast enhancement using the Laplacian-of-a-Gaussian filter. CVGIP: Graph. Model. Image Process. 1993, 55, 447–463. [Google Scholar] [CrossRef]
- Elaiyaraja, G.; Kumaratharan, N.; Chandra Sekhar Rao, T. Fast and efficient filter using wavelet threshold for removal of Gaussian noise from MRI/CT scanned medical images/color video sequence. IETE J. Res. 2022, 68, 10–22. [Google Scholar] [CrossRef]
- Khireddine, A.; Benmahammed, K.; Puech, W. Digital image restoration by Wiener filter in 2D case. Adv. Eng. Softw. 2007, 38, 513–516. [Google Scholar] [CrossRef]
- Ashwin, S.; Ramesh, J.; Kumar, S.A.; Gunavathi, K. Efficient and reliable lung nodule detection using a neural network based computer aided diagnosis system. In Proceedings of the 2012 International Conference on Emerging Trends in Electrical Engineering and Energy Management (ICETEEEM), Chennai, India, 13–15 December 2012; IEEE: Piscataway, NJ, USA, 2012; pp. 135–142. [Google Scholar]
- Punithavathy, K.; Ramya, M.; Poobal, S. Analysis of statistical texture features for automatic lung cancer detection in PET/CT images. In Proceedings of the 2015 International Conference on Robotics, Automation, Control and Embedded Systems (RACE), Chennai, India, 18–20 February 2015; IEEE: Piscataway, NJ, USA, 2015; pp. 1–5. [Google Scholar]
- Mehrotra, R.; Namuduri, K.R.; Ranganathan, N. Gabor filter-based edge detection. Pattern Recognit. 1992, 25, 1479–1494. [Google Scholar] [CrossRef]
- Liu, X.; Hou, F.; Qin, H.; Hao, A. Multi-view multi-scale CNNs for lung nodule type classification from CT images. Pattern Recognit. 2018, 77, 262–275. [Google Scholar] [CrossRef]
- Li, Y.; Sixou, B.; Peyrin, F. A review of the deep learning methods for medical images super resolution problems. IRBM 2021, 42, 120–133. [Google Scholar] [CrossRef]
- Pham, C.H.; Tor-Díez, C.; Meunier, H.; Bednarek, N.; Fablet, R.; Passat, N.; Rousseau, F. Multiscale brain MRI super-resolution using deep 3D convolutional networks. Comput. Med. Imaging Graph. 2019, 77, 101647. [Google Scholar] [CrossRef]
- Song, Y.; Ermon, S. Generative modeling by estimating gradients of the data distribution. Adv. Neural Inf. Process. Syst. 2019, 32. Available online: https://proceedings.neurips.cc/paper/2019/hash/3001ef257407d5a371a96dcd947c7d93-Abstract.html?ref=https://githubhelp.com (accessed on 15 June 2025).
- Chen, Y.; Shi, F.; Christodoulou, A.G.; Xie, Y.; Zhou, Z.; Li, D. Efficient and accurate MRI super-resolution using a generative adversarial network and 3D multi-level densely connected network. In Proceedings of the International Conference on Medical Image Computing and Computer-Assisted Intervention, Granada, Spain, 16–20 September 2018; Springer: Berlin/Heidelberg, Germany, 2018; pp. 91–99. [Google Scholar]
- Simonyan, K.; Zisserman, A. Very deep convolutional networks for large-scale image recognition. arXiv 2014, arXiv:1409.1556. [Google Scholar]
- Li, Y.; Iwamoto, Y.; Lin, L.; Xu, R.; Tong, R.; Chen, Y.-W. VolumeNet: A Lightweight Parallel Network for Super-Resolution of MR and CT Volumetric Data. arXiv 2020, arXiv:2010.08357. [Google Scholar] [CrossRef]
- Fang, C.; Wang, L.; Zhang, D.; Xu, J.; Yuan, Y.; Han, J. Incremental cross-view mutual distillation for self-supervised medical CT synthesis. In Proceedings of the IEEE/CVF Conference on Computer Vision and Pattern Recognition, New Orleans, LA, USA, 18–24 June 2022; pp. 20677–20686. [Google Scholar]
- Hu, X.; Mu, H.; Zhang, X.; Wang, Z.; Tan, T.; Sun, J. Meta-SR: A magnification-arbitrary network for super-resolution. In Proceedings of the IEEE/CVF Conference on Computer Vision and Pattern Recognition, Long Beach, CA, USA, 15–20 June 2019; pp. 1575–1584. [Google Scholar]
- Hu, X.; Zhang, Z.; Shan, C.; Wang, Z.; Wang, L.; Tan, T. Meta-USR: A unified super-resolution network for multiple degradation parameters. IEEE Trans. Neural Netw. Learn. Syst. 2020, 32, 4151–4165. [Google Scholar] [CrossRef]
- Cascio, D.; Magro, R.; Fauci, F.; Iacomi, M.; Raso, G. Automatic detection of lung nodules in CT datasets based on stable 3D mass–spring models. Comput. Biol. Med. 2012, 42, 1098–1109. [Google Scholar] [CrossRef]
- Valente, I.R.S.; Cortez, P.C.; Neto, E.C.; Soares, J.M.; de Albuquerque, V.H.C.; Tavares, J.M.R. Automatic 3D pulmonary nodule detection in CT images: A survey. Comput. Methods Programs Biomed. 2016, 124, 91–107. [Google Scholar] [CrossRef]
- da Silva Sousa, J.R.F.; Silva, A.C.; de Paiva, A.C.; Nunes, R.A. Methodology for automatic detection of lung nodules in computerized tomography images. Comput. Methods Programs Biomed. 2010, 98, 1–14. [Google Scholar] [CrossRef]
- Gupta, A.; Saar, T.; Martens, O.; Moullec, Y.L. Automatic detection of multisize pulmonary nodules in CT images: Large-scale validation of the false-positive reduction step. Med. Phys. 2018, 45, 1135–1149. [Google Scholar] [CrossRef]
- Saien, S.; Pilevar, A.H.; Moghaddam, H.A. Refinement of lung nodule candidates based on local geometric shape analysis and Laplacian of Gaussian kernels. Comput. Biol. Med. 2014, 54, 188–198. [Google Scholar] [CrossRef]
- Hu, S.; Hoffman, E.A.; Reinhardt, J.M. Automatic lung segmentation for accurate quantitation of volumetric X-ray CT images. IEEE Trans. Med. Imaging 2001, 20, 490–498. [Google Scholar] [CrossRef]
- Silveira, M.; Nascimento, J.; Marques, J. Automatic segmentation of the lungs using robust level sets. In Proceedings of the 2007 29th Annual International Conference of the IEEE Engineering in Medicine and Biology Society, Lyon, France, 22–26 August 2007; IEEE: Piscataway, NJ, USA, 2007; pp. 4414–4417. [Google Scholar]
- Shi, Y.; Qi, F.; Xue, Z.; Chen, L.; Ito, K.; Matsuo, H.; Shen, D. Segmenting lung fields in serial chest radiographs using both population-based and patient-specific shape statistics. IEEE Trans. Med. Imaging 2008, 27, 481–494. [Google Scholar] [PubMed]
- Annangi, P.; Thiruvenkadam, S.; Raja, A.; Xu, H.; Sun, X.; Mao, L. A region based active contour method for x-ray lung segmentation using prior shape and low level features. In Proceedings of the 2010 IEEE International Symposium on Biomedical Imaging: From Nano to Macro, Rotterdam, The Netherlands, 14–17 April 2010; IEEE: Piscataway, NJ, USA, 2010; pp. 892–895. [Google Scholar]
- Campadelli, P.; Casiraghi, E.; Artioli, D. A fully automated method for lung nodule detection from postero-anterior chest radiographs. IEEE Trans. Med. Imaging 2006, 25, 1588–1603. [Google Scholar] [CrossRef]
- Hofmanninger, J.; Prayer, F.; Pan, J.; Röhrich, S.; Prosch, H.; Langs, G. Automatic lung segmentation in routine imaging is primarily a data diversity problem, not a methodology problem. Eur. Radiol. Exp. 2020, 4, 1–13. [Google Scholar] [CrossRef] [PubMed]
- Tan, J.; Jing, L.; Huo, Y.; Li, L.; Akin, O.; Tian, Y. LGAN: Lung segmentation in CT scans using generative adversarial network. Comput. Med. Imaging Graph. 2021, 87, 101817. [Google Scholar] [CrossRef] [PubMed]
- Hu, Q.; Souza, L.F.d.F.; Holanda, G.B.; Alves, S.S.; Silva, F.H.d.S.; Han, T.; Reboucas Filho, P.P. An effective approach for CT lung segmentation using mask region-based convolutional neural networks. Artif. Intell. Med. 2020, 103, 101792. [Google Scholar] [CrossRef]
- Henschke, C.I. Early lung cancer action project: Overall design and findings from baseline screening. Cancer 2000, 89, 2474–2482. [Google Scholar] [CrossRef]
- Camarlinghi, N. Automatic detection of lung nodules in computed tomography images: Training and validation of algorithms using public research databases. Eur. Phys. J. Plus 2013, 128, 110. [Google Scholar] [CrossRef]
- Armato, S.G.; Giger, M.L.; Moran, C.J.; Blackburn, J.T.; Doi, K.; MacMahon, H. Computerized detection of pulmonary nodules on CT scans. Radiographics 1999, 19, 1303–1311. [Google Scholar] [CrossRef]
- Aresta, G.; Cunha, A.; Campilho, A. Detection of juxta-pleural lung nodules in computed tomography images. In Proceedings of the Medical Imaging 2017: Computer-Aided Diagnosis, Orlando, FL, USA, 11–16 February 2017; SPIE: Bellingham, WA, USA, 2017; Volume 10134, pp. 952–958. [Google Scholar]
- Zawish, M.; Siyal, A.A.; Shahani, S.H.; Junejo, A.Z.; Khalil, A. Brain tumor segmentation through region-based, supervised and unsupervised learning methods: A literature survey. J. Biomed. Eng. Med. Imaging 2019, 6, 8–26. [Google Scholar]
- Suárez-Cuenca, J.J.; Guo, W.; Li, Q. Automated detection of pulmonary nodules in CT: False positive reduction by combining multiple classifiers. In Proceedings of the Medical Imaging 2011: Computer-Aided Diagnosis, Lake Buena Vista, FL, USA, 15–17 February 2011; SPIE: Bellingham, WA, USA, 2011; Volume 7963, pp. 927–932. [Google Scholar]
- Suiyuan, W.; Junfeng, W. Pulmonary nodules 3D detection on serial CT scans. In Proceedings of the 2012 Third Global Congress on Intelligent Systems, Kota Kinabalu, Malaysia, 6–8 November 2012; IEEE: Piscataway, NJ, USA, 2012; pp. 257–260. [Google Scholar]
- Parveen, S.S.; Kavitha, C. Detection of lung cancer nodules using automatic region growing method. In Proceedings of the 2013 Fourth International Conference on Computing, Communications and Networking Technologies (ICCCNT), Tiruchengode, India, 4–6 July 2013; IEEE: Piscataway, NJ, USA, 2013; pp. 1–6. [Google Scholar]
- Zhang, Y.F.; Mao, J.L.; Xiong, Z.Y. An efficient clustering algorithm. In Proceedings of the 2003 International Conference on Machine Learning and Cybernetics, Xi’an, China, 2–5 November 2003; (IEEE Cat. No. 03EX693). IEEE: Piscataway, NJ, USA, 2003; Volume 1, pp. 261–265. [Google Scholar]
- Javaid, M.; Javid, M.; Rehman, M.Z.U.; Shah, S.I.A. A novel approach to CAD system for the detection of lung nodules in CT images. Comput. Methods Programs Biomed. 2016, 135, 125–139. [Google Scholar] [CrossRef]
- Cao, W.; Wu, R.; Cao, G.; He, Z. A comprehensive review of computer-aided diagnosis of pulmonary nodules based on computed tomography scans. IEEE Access 2020, 8, 154007–154023. [Google Scholar] [CrossRef]
- Naqi, S.M.; Sharif, M.; Lali, I.U. A 3D nodule candidate detection method supported by hybrid features to reduce false positives in lung nodule detection. Multimed. Tools Appl. 2019, 78, 26287–26311. [Google Scholar] [CrossRef]
- Fotin, S.V.; Yankelevitz, D.F.; Henschke, C.I.; Reeves, A.P. A multiscale Laplacian of Gaussian (LoG) filtering approach to pulmonary nodule detection from whole-lung CT scans. arXiv 2019, arXiv:1907.08328. [Google Scholar]
- Hua, K.L.; Hsu, C.H.; Hidayati, S.C.; Cheng, W.H.; Chen, Y.J. Computer-aided classification of lung nodules on computed tomography images via deep learning technique. Oncotargets Ther. 2015, 8, 2015–2022. [Google Scholar]
- Kumar, D.; Wong, A.; Clausi, D.A. Lung nodule classification using deep features in CT images. In Proceedings of the 2015 12th Conference on Computer and Robot Vision, Halifax, NS, Canada, 3–5 June 2015; IEEE: Piscataway, NJ, USA, 2015; pp. 133–138. [Google Scholar]
- Ciompi, F.; de Hoop, B.; van Riel, S.J.; Chung, K.; Scholten, E.T.; Oudkerk, M.; de Jong, P.A.; Prokop, M.; van Ginneken, B. Automatic classification of pulmonary peri-fissural nodules in computed tomography using an ensemble of 2D views and a convolutional neural network out-of-the-box. Med. Image Anal. 2015, 26, 195–202. [Google Scholar] [CrossRef] [PubMed]
- Ramachandran, S.; George, J.; Skaria, S.; Varun, V.V. Using YOLO based deep learning network for real time detection and localization of lung nodules from low dose CT scans. In Proceedings of the Medical Imaging 2018: Computer-Aided Diagnosis, Houston, TX, USA, 12–15 February 2018; SPIE: Bellingham, WA, USA, 2018; Volume 10575, pp. 347–355. [Google Scholar]
- Trajanovski, S.; Mavroeidis, D.; Swisher, C.L.; Gebre, B.G.; Veeling, B.S.; Wiemker, R.; Klinder, T.; Tahmasebi, A.; Regis, S.M.; Wald, C.; et al. Towards radiologist-level cancer risk assessment in CT lung screening using deep learning. Comput. Med. Imaging Graph. 2021, 90, 101883. [Google Scholar] [CrossRef] [PubMed]
- Xie, H.; Yang, D.; Sun, N.; Chen, Z.; Zhang, Y. Automated pulmonary nodule detection in CT images using deep convolutional neural networks. Pattern Recognit. 2019, 85, 109–119. [Google Scholar] [CrossRef]
- Dou, Q.; Chen, H.; Yu, L.; Qin, J.; Heng, P.A. Multilevel contextual 3-D CNNs for false positive reduction in pulmonary nodule detection. IEEE Trans. Biomed. Eng. 2016, 64, 1558–1567. [Google Scholar] [CrossRef]
- Anirudh, R.; Thiagarajan, J.J.; Bremer, T.; Kim, H. Lung nodule detection using 3D convolutional neural networks trained on weakly labeled data. In Proceedings of the Medical Imaging 2016: Computer-Aided Diagnosis, San Diego, CA, USA, 14–16 September 2016; SPIE: Bellingham, WA, USA, 2016; Volume 9785, pp. 791–796. [Google Scholar]
- Huang, W.; Xue, Y.; Wu, Y. A CAD system for pulmonary nodule prediction based on deep three-dimensional convolutional neural networks and ensemble learning. PLoS ONE 2019, 14, e0219369. [Google Scholar] [CrossRef]
- Ali, I.; Hart, G.R.; Gunabushanam, G.; Liang, Y.; Muhammad, W.; Nartowt, B.; Kane, M.; Ma, X.; Deng, J. Lung nodule detection via deep reinforcement learning. Front. Oncol. 2018, 8, 108. [Google Scholar] [CrossRef] [PubMed]
- Paul, R.; Hawkins, S.H.; Schabath, M.B.; Gillies, R.J.; Hall, L.O.; Goldgof, D.B. Predicting malignant nodules by fusing deep features with classical radiomics features. J. Med. Imaging 2018, 5, 011021. [Google Scholar] [CrossRef] [PubMed]
- Kamble, B.; Sahu, S.P.; Doriya, R. A review on lung and nodule segmentation techniques. In Advances in Data and Information Sciences: Proceedings of ICDIS 2019; Springer: Berlin/Heidelberg, Germany, 2020; pp. 555–565. [Google Scholar]
- Yamashita, R.; Nishio, M.; Do, R.K.G.; Togashi, K. Convolutional neural networks: An overview and application in radiology. Insights Imaging 2018, 9, 611–629. [Google Scholar] [CrossRef] [PubMed]
- Jardim, S.; António, J.; Mora, C. Image thresholding approaches for medical image segmentation-short literature review. Procedia Comput. Sci. 2023, 219, 1485–1492. [Google Scholar] [CrossRef]
- Zhao, B.; Yankelevitz, D.; Reeves, A.; Henschke, C. Two-dimensional multi-criterion segmentation of pulmonary nodules on helical CT images. Med. Phys. 1999, 26, 889–895. [Google Scholar] [CrossRef]
- Zhao, B.; Reeves, A.P.; Yankelevitz, D.; Henschke, C.I. Three-dimensional multi-criterion automatic segmentation of pulmonary nodules of helical computed tomography images. Opt. Eng. 1999, 38, 1340–1347. [Google Scholar]
- Yankelevitz, D.F.; Gupta, R.; Zhao, B.; Henschke, C.I. Small pulmonary nodules: Evaluation with repeat CT—Preliminary experience. Radiology 1999, 212, 561–566. [Google Scholar] [CrossRef]
- Yankelevitz, D.F.; Reeves, A.P.; Kostis, W.J.; Zhao, B.; Henschke, C.I. Small pulmonary nodules: Volumetrically determined growth rates based on CT evaluation. Radiology 2000, 217, 251–256. [Google Scholar] [CrossRef]
- Wiemker, R.; Zwartkruis, A. Optimal thresholding for 3D segmentation of pulmonary nodules in high resolution CT. In Proceedings of the International Congress Series; Elsevier: Amsterdam, The Netherlands, 2001; Volume 1230, pp. 653–658. [Google Scholar]
- Kubota, T.; Jerebko, A.K.; Dewan, M.; Salganicoff, M.; Krishnan, A. Segmentation of pulmonary nodules of various densities with morphological approaches and convexity models. Med. Image Anal. 2011, 15, 133–154. [Google Scholar] [CrossRef]
- Halder, A.; Chatterjee, S.; Dey, D.; Kole, S.; Munshi, S. An adaptive morphology based segmentation technique for lung nodule detection in thoracic CT image. Comput. Methods Programs Biomed. 2020, 197, 105720. [Google Scholar] [CrossRef] [PubMed]
- Dehmeshki, J.; Amin, H.; Valdivieso, M.; Ye, X. Segmentation of pulmonary nodules in thoracic CT scans: A region growing approach. IEEE Trans. Med. Imaging 2008, 27, 467–480. [Google Scholar] [CrossRef] [PubMed]
- Soltani-Nabipour, J.; Khorshidi, A.; Noorian, B. Lung tumor segmentation using improved region growing algorithm. Nucl. Eng. Technol. 2020, 52, 2313–2319. [Google Scholar] [CrossRef]
- Ronneberger, O.; Fischer, P.; Brox, T. U-net: Convolutional networks for biomedical image segmentation. In Proceedings of the Medical Image Computing and Computer-Assisted Intervention–MICCAI 2015: 18th International Conference, Munich, Germany, 5–9 October 2015; proceedings, part III 18. Springer: Berlin/Heidelberg, Germany, 2015; pp. 234–241. [Google Scholar]
- Tong, G.; Li, Y.; Chen, H.; Zhang, Q.; Jiang, H. Improved U-NET network for pulmonary nodules segmentation. Optik 2018, 174, 460–469. [Google Scholar] [CrossRef]
- Milletari, F.; Navab, N.; Ahmadi, S.A. V-net: Fully convolutional neural networks for volumetric medical image segmentation. In Proceedings of the 2016 Fourth International Conference on 3D Vision (3DV), Stanford, CA, USA, 25–28 October 2016; IEEE: Piscataway, NJ, USA, 2016; pp. 565–571. [Google Scholar]
- Ma, X.; Song, H.; Jia, X.; Wang, Z. An improved V-Net lung nodule segmentation model based on pixel threshold separation and attention mechanism. Sci. Rep. 2024, 14, 4743. [Google Scholar] [CrossRef]
- Xu, W.; Fu, Y.L.; Zhu, D. ResNet and its application to medical image processing: Research progress and challenges. Comput. Methods Programs Biomed. 2023, 240, 107660. [Google Scholar] [CrossRef]
- Cao, H.; Liu, H.; Song, E.; Hung, C.C.; Ma, G.; Xu, X.; Jin, R.; Lu, J. Dual-branch residual network for lung nodule segmentation. Appl. Soft Comput. 2020, 86, 105934. [Google Scholar] [CrossRef]
- Wang, S.; Zhou, M.; Gevaert, O.; Tang, Z.; Dong, D.; Liu, Z.; Jie, T. A multi-view deep convolutional neural networks for lung nodule segmentation. In Proceedings of the 2017 39th Annual International Conference of the IEEE Engineering in Medicine and Biology Society (EMBC), Jeju Island, Republic of Korea, 11–15 July 2017; IEEE: Piscataway, NJ, USA, 2017; pp. 1752–1755. [Google Scholar]
- Liu, C.; Liu, H.; Zhang, X.; Guo, J.; Lv, P. Multi-scale and multi-view network for lung tumor segmentation. Comput. Biol. Med. 2024, 172, 108250. [Google Scholar] [CrossRef]
- Alhajim, D.; Ansari-Asl, K.; Akbarizadeh, G.; Soorki, M.N. Improved lung nodule segmentation with a squeeze excitation dilated attention based residual UNet. Sci. Rep. 2025, 15, 3770. [Google Scholar] [CrossRef]
- Bruntha, P.M.; Pandian, S.I.A.; Sagayam, K.M.; Bandopadhyay, S.; Pomplun, M.; Dang, H. Lung_PAYNet: A pyramidal attention based deep learning network for lung nodule segmentation. Sci. Rep. 2022, 12, 20330. [Google Scholar] [CrossRef]
- Goodfellow, I.; Pouget-Abadie, J.; Mirza, M.; Xu, B.; Warde-Farley, D.; Ozair, S.; Courville, A.; Bengio, Y. Generative adversarial networks. Commun. ACM 2020, 63, 139–144. [Google Scholar] [CrossRef]
- Tyagi, S.; Talbar, S.N. CSE-GAN: A 3D conditional generative adversarial network with concurrent squeeze-and-excitation blocks for lung nodule segmentation. Comput. Biol. Med. 2022, 147, 105781. [Google Scholar] [CrossRef] [PubMed]
- Wang, S.; Jiang, A.; Li, X.; Qiu, Y.; Li, M.; Li, F. DPBET: A dual-path lung nodules segmentation model based on boundary enhancement and hybrid transformer. Comput. Biol. Med. 2022, 151, 106330. [Google Scholar] [CrossRef] [PubMed]
- Usman, M.; Shin, Y.G. Deha-net: A dual-encoder-based hard attention network with an adaptive roi mechanism for lung nodule segmentation. Sensors 2023, 23, 1989. [Google Scholar] [CrossRef] [PubMed]
- Suganyadevi, S.; Seethalakshmi, V.; Balasamy, K. A review on deep learning in medical image analysis. Int. J. Multimed. Inf. Retr. 2022, 11, 19–38. [Google Scholar] [CrossRef]
- Nandakumar, N.; D’Souza, N.S.; Manzoor, K.; Pillai, J.J.; Gujar, S.K.; Sair, H.I.; Venkataraman, A. A multi-task deep learning framework to localize the eloquent cortex in brain tumor patients using dynamic functional connectivity. In Proceedings of the Machine Learning in Clinical Neuroimaging and Radiogenomics in Neuro-Oncology: Third International Workshop, MLCN 2020, and Second International Workshop, RNO-AI 2020, Held in Conjunction with MICCAI 2020, Lima, Peru, 4–8 October 2020; Proceedings 3. Springer: Berlin/Heidelberg, Germany, 2020; pp. 34–44. [Google Scholar]
- Zhou, T.; Fu, H.; Chen, G.; Shen, J.; Shao, L. Hi-net: Hybrid-fusion network for multi-modal MR image synthesis. IEEE Trans. Med. Imaging 2020, 39, 2772–2781. [Google Scholar] [CrossRef]
- Park, S.; Kim, G.; Oh, Y.; Seo, J.B.; Lee, S.M.; Kim, J.H.; Moon, S.; Lim, J.K.; Ye, J.C. Multi-task vision transformer using low-level chest X-ray feature corpus for COVID-19 diagnosis and severity quantification. Med. Image Anal. 2022, 75, 102299. [Google Scholar] [CrossRef]
- Zhang, L.; Zhong, L.; Li, C.; Zhang, W.; Hu, C.; Dong, D.; Liu, Z.; Zhou, J.; Tian, J. Knowledge-guided multi-task attention network for survival risk prediction using multi-center computed tomography images. Neural Netw. 2022, 152, 394–406. [Google Scholar] [CrossRef]
- Jafari, M.H.; Girgis, H.; Van Woudenberg, N.; Liao, Z.; Rohling, R.; Gin, K.; Abolmaesumi, P.; Tsang, T. Automatic biplane left ventricular ejection fraction estimation with mobile point-of-care ultrasound using multi-task learning and adversarial training. Int. J. Comput. Assist. Radiol. Surg. 2019, 14, 1027–1037. [Google Scholar] [CrossRef] [PubMed]
- Yu, C.; Gao, Z.; Zhang, W.; Yang, G.; Zhao, S.; Zhang, H.; Zhang, Y.; Li, S. Multitask learning for estimating multitype cardiac indices in MRI and CT based on adversarial reverse mapping. IEEE Trans. Neural Netw. Learn. Syst. 2020, 32, 493–506. [Google Scholar] [CrossRef] [PubMed]
- Keshwani, D.; Kitamura, Y.; Ihara, S.; Iizuka, S.; Simo-Serra, E. TopNet: Topology preserving metric learning for vessel tree reconstruction and labelling. In Proceedings of the Medical Image Computing and Computer Assisted Intervention–MICCAI 2020: 23rd International Conference, Lima, Peru, 4–8 October 2020; Proceedings, Part VI 23. Springer: Berlin/Heidelberg, Germany, 2020; pp. 14–23. [Google Scholar]
- Du, B.; Liao, J.; Turkbey, B.; Yan, P. Multi-task learning for registering images with large deformation. IEEE J. Biomed. Health Informatics 2020, 25, 1624–1633. [Google Scholar] [CrossRef]
- Zhang, Y.; Yang, Q. An overview of multi-task learning. Natl. Sci. Rev. 2018, 5, 30–43. [Google Scholar] [CrossRef]
- Wu, T.H.; Lian, C.; Lee, S.; Pastewait, M.; Piers, C.; Liu, J.; Wang, F.; Wang, L.; Chiu, C.Y.; Wang, W.; et al. Two-stage mesh deep learning for automated tooth segmentation and landmark localization on 3D intraoral scans. IEEE Trans. Med. Imaging 2022, 41, 3158–3166. [Google Scholar] [CrossRef]
- Malhotra, A.; Mittal, S.; Majumdar, P.; Chhabra, S.; Thakral, K.; Vatsa, M.; Singh, R.; Chaudhury, S.; Pudrod, A.; Agrawal, A. Multi-task driven explainable diagnosis of COVID-19 using chest X-ray images. Pattern Recognit. 2022, 122, 108243. [Google Scholar] [CrossRef]
- Xu, X.; Lian, C.; Wang, S.; Zhu, T.; Chen, R.C.; Wang, A.Z.; Royce, T.J.; Yap, P.T.; Shen, D.; Lian, J. Asymmetric multi-task attention network for prostate bed segmentation in computed tomography images. Med. Image Anal. 2021, 72, 102116. [Google Scholar] [CrossRef]
- Wang, X.; Jiang, L.; Li, L.; Xu, M.; Deng, X.; Dai, L.; Xu, X.; Li, T.; Guo, Y.; Wang, Z.; et al. Joint learning of 3D lesion segmentation and classification for explainable COVID-19 diagnosis. IEEE Trans. Med. Imaging 2021, 40, 2463–2476. [Google Scholar] [CrossRef]
- Nguyen, T.C.; Nguyen, T.P.; Cao, T.; Dao, T.T.P.; Ho, T.N.; Nguyen, T.V.; Tran, M.T. MANet: Multi-branch attention auxiliary learning for lung nodule detection and segmentation. Comput. Methods Programs Biomed. 2023, 241, 107748. [Google Scholar] [CrossRef] [PubMed]


| Type | Metric | Description | Formula |
|---|---|---|---|
| FR | MSE | Calculates the Mean Squared Error between images. A smaller MSE indicates higher image similarity. A lower value indicates better quality. | , where and are corresponding pixel values in the two images, and N is the total number of pixels. |
| SSIM | Assesses perceptual similarity based on luminance, contrast, and structure. | , where , are the mean intensities of images x and y, respectively; , are their standard deviations; is the cross-covariance. and are constants to stabilize the division. | |
| PSNR | Measures signal fidelity between two images. PSNR is inversely related to MSE; as MSE decreases toward zero, PSNR increases, indicating better image quality. | , where is the maximum possible pixel value of the image. | |
| NR | PIQE | Evaluates perceptual quality based on block-level distortion. It analyzes local blocks for artifacts and noise. Lower PIQE indicates better quality. | , where is blockiness measure and is noise measure. |
| NIQE | Estimates deviation from natural image statistics. A lower value indicates better quality. | , where , and , are the mean vectors and covariance matrices of the test and natural images. | |
| BRISQUE | Predicts image quality using natural scene statistics. A lower score means better quality. | , where and are local mean and standard deviation from MSCN coefficients. Features are modeled using AGGD, and quality is predicted via SVR. |
| Metric | Description | Formula |
|---|---|---|
| Accuracy (ACC) | Correct predictions among all cases. | |
| Sensitivity (Recall) | True positive rate. | |
| Specificity | True negative rate. | |
| Precision (PPV) | Positive predictions that are correct. | |
| F1-Score | Harmonic mean of precision and recall. | |
| Dice Similarity Coefficient (DSC) | Similarity between prediction and ground truth. | |
| Intersection over Union (IoU) | Overlap ratio of prediction and ground truth. | |
| AUC | Area under ROC curve. | – |
| ROC Curve | True positive rate vs. false positive rate. | – |
| FROC Curve | Sensitivity vs. false positives per scan. | – |
| CPM | Average sensitivity at 7 FPs/scan. | – |
| Mean Average Precision (mAP) | Mean of AP over all classes. |
| Dataset | Modality | Annotation Type | Size | Notes |
|---|---|---|---|---|
| LIDC-IDRI [25] | CT, DX, CR | Bounding boxes, malignancy ratings (4 readers) | 1018 scans | Multi-reader annotated; basis for many derived datasets |
| LUNA16 [24] | CT | Filtered nodules ≥3 mm from LIDC-IDRI | 888 scans | High-quality subset of LIDC-IDRI; used for 10-fold CV |
| NLST [26] | CT, X-ray | Patient outcome, lesion info | 54,000+ participants | Large-scale clinical trial; mortality-focused |
| ANODE09 [27] | CT | True nodules and irrelevant findings | 55 scans | Partially annotated; used for CAD evaluation |
| ELCAP [28] | CT | Nodule locations | 50 scans | Early low-dose CT dataset; used for CAD benchmarking |
| Tianchi [29] | CT | 3D nodule boxes, clinical labels | 1000+ scans | 5–30 mm nodules annotated by 3 doctors |
| Layer | Properties | Previous Layer (s) |
|---|---|---|
| 1. Image input | - Img: 10 nod, 3proj | |
| 2. Conv Layer + BN | (), stride 1 | 1. |
| 3. Conv Layer + BN | (), stride 1 | 2. |
| 4. Conv Layer + BN | (), stride 1 | 3. |
| 5. Conv Layer + BN | (), stride 1 | 1. |
| 6. Addition/Merge + BN | – | 4., 5. |
| 7. Dropout + BN | – | 6. |
| 8. Dense + BN | (64) | 7. |
| 9. Dropout + BN | – | 8. |
| 10. Dense + BN | (64) | 9. |
| 11. Numeric input | - Radius | |
| 12. Numeric input | - nodule coordinates | |
| 13. Numeric input | - confidence score | |
| 14. Addition/Merge | – | 10., 11., 12., 13. |
| 15. Dense + sigmoid | (1) | 14. |
| 16. GlobalMaxPool | (10) | 15. |
| Type | Model/Method | Dataset | ACC (%) | Sens. (%) | AUC | Notes |
|---|---|---|---|---|---|---|
| 2D CNN-based | DetectNet [85] | LIDC-IDRI | 93.00 | 89.00 | – | F1-score = 90.96, single-stage |
| Faster R-CNN Variant [87] | LUNA16 | – | 86.42 | 95.4 | Deconv + dual RPN | |
| 3D CNN-based | Multilevel CNN [88] | LUNA16 | – | 94.40 | – | Multi-context fusion |
| Point-supervised [89] | LUNA16 | – | 80.00 | – | Weak supervision | |
| Hybrid | 3D CNN + VGG + Radiomics [92] | NLST | 76.79 | – | 78 | Feature-level fusion |
| Type | Model/Method | Dataset | DSC (%) | Sens. (%) | Notes |
|---|---|---|---|---|---|
| 2D CNN-based | Improved U-Net [106] | LUNA16 | 73.6 | – | Residual connections, batch normalization, skip connections |
| 3D CNN-based | Improved Dig-CS-VNet [108] | LUNA16, LNDb | 94.9, 81.1 | 92.7, 76.9 | Feature separation, 3D attention blocks |
| ResNet-based | DB-ResNet [110] | LIDC-IDRI | 89.40 | – | Dual-branch structure, intensity pooling, modular ResBlocks |
| Multi-view CNN | MV-CNN [111] | LIDC-IDRI | 82.74 | – | Axial/coronal/sagittal branches, late fusion |
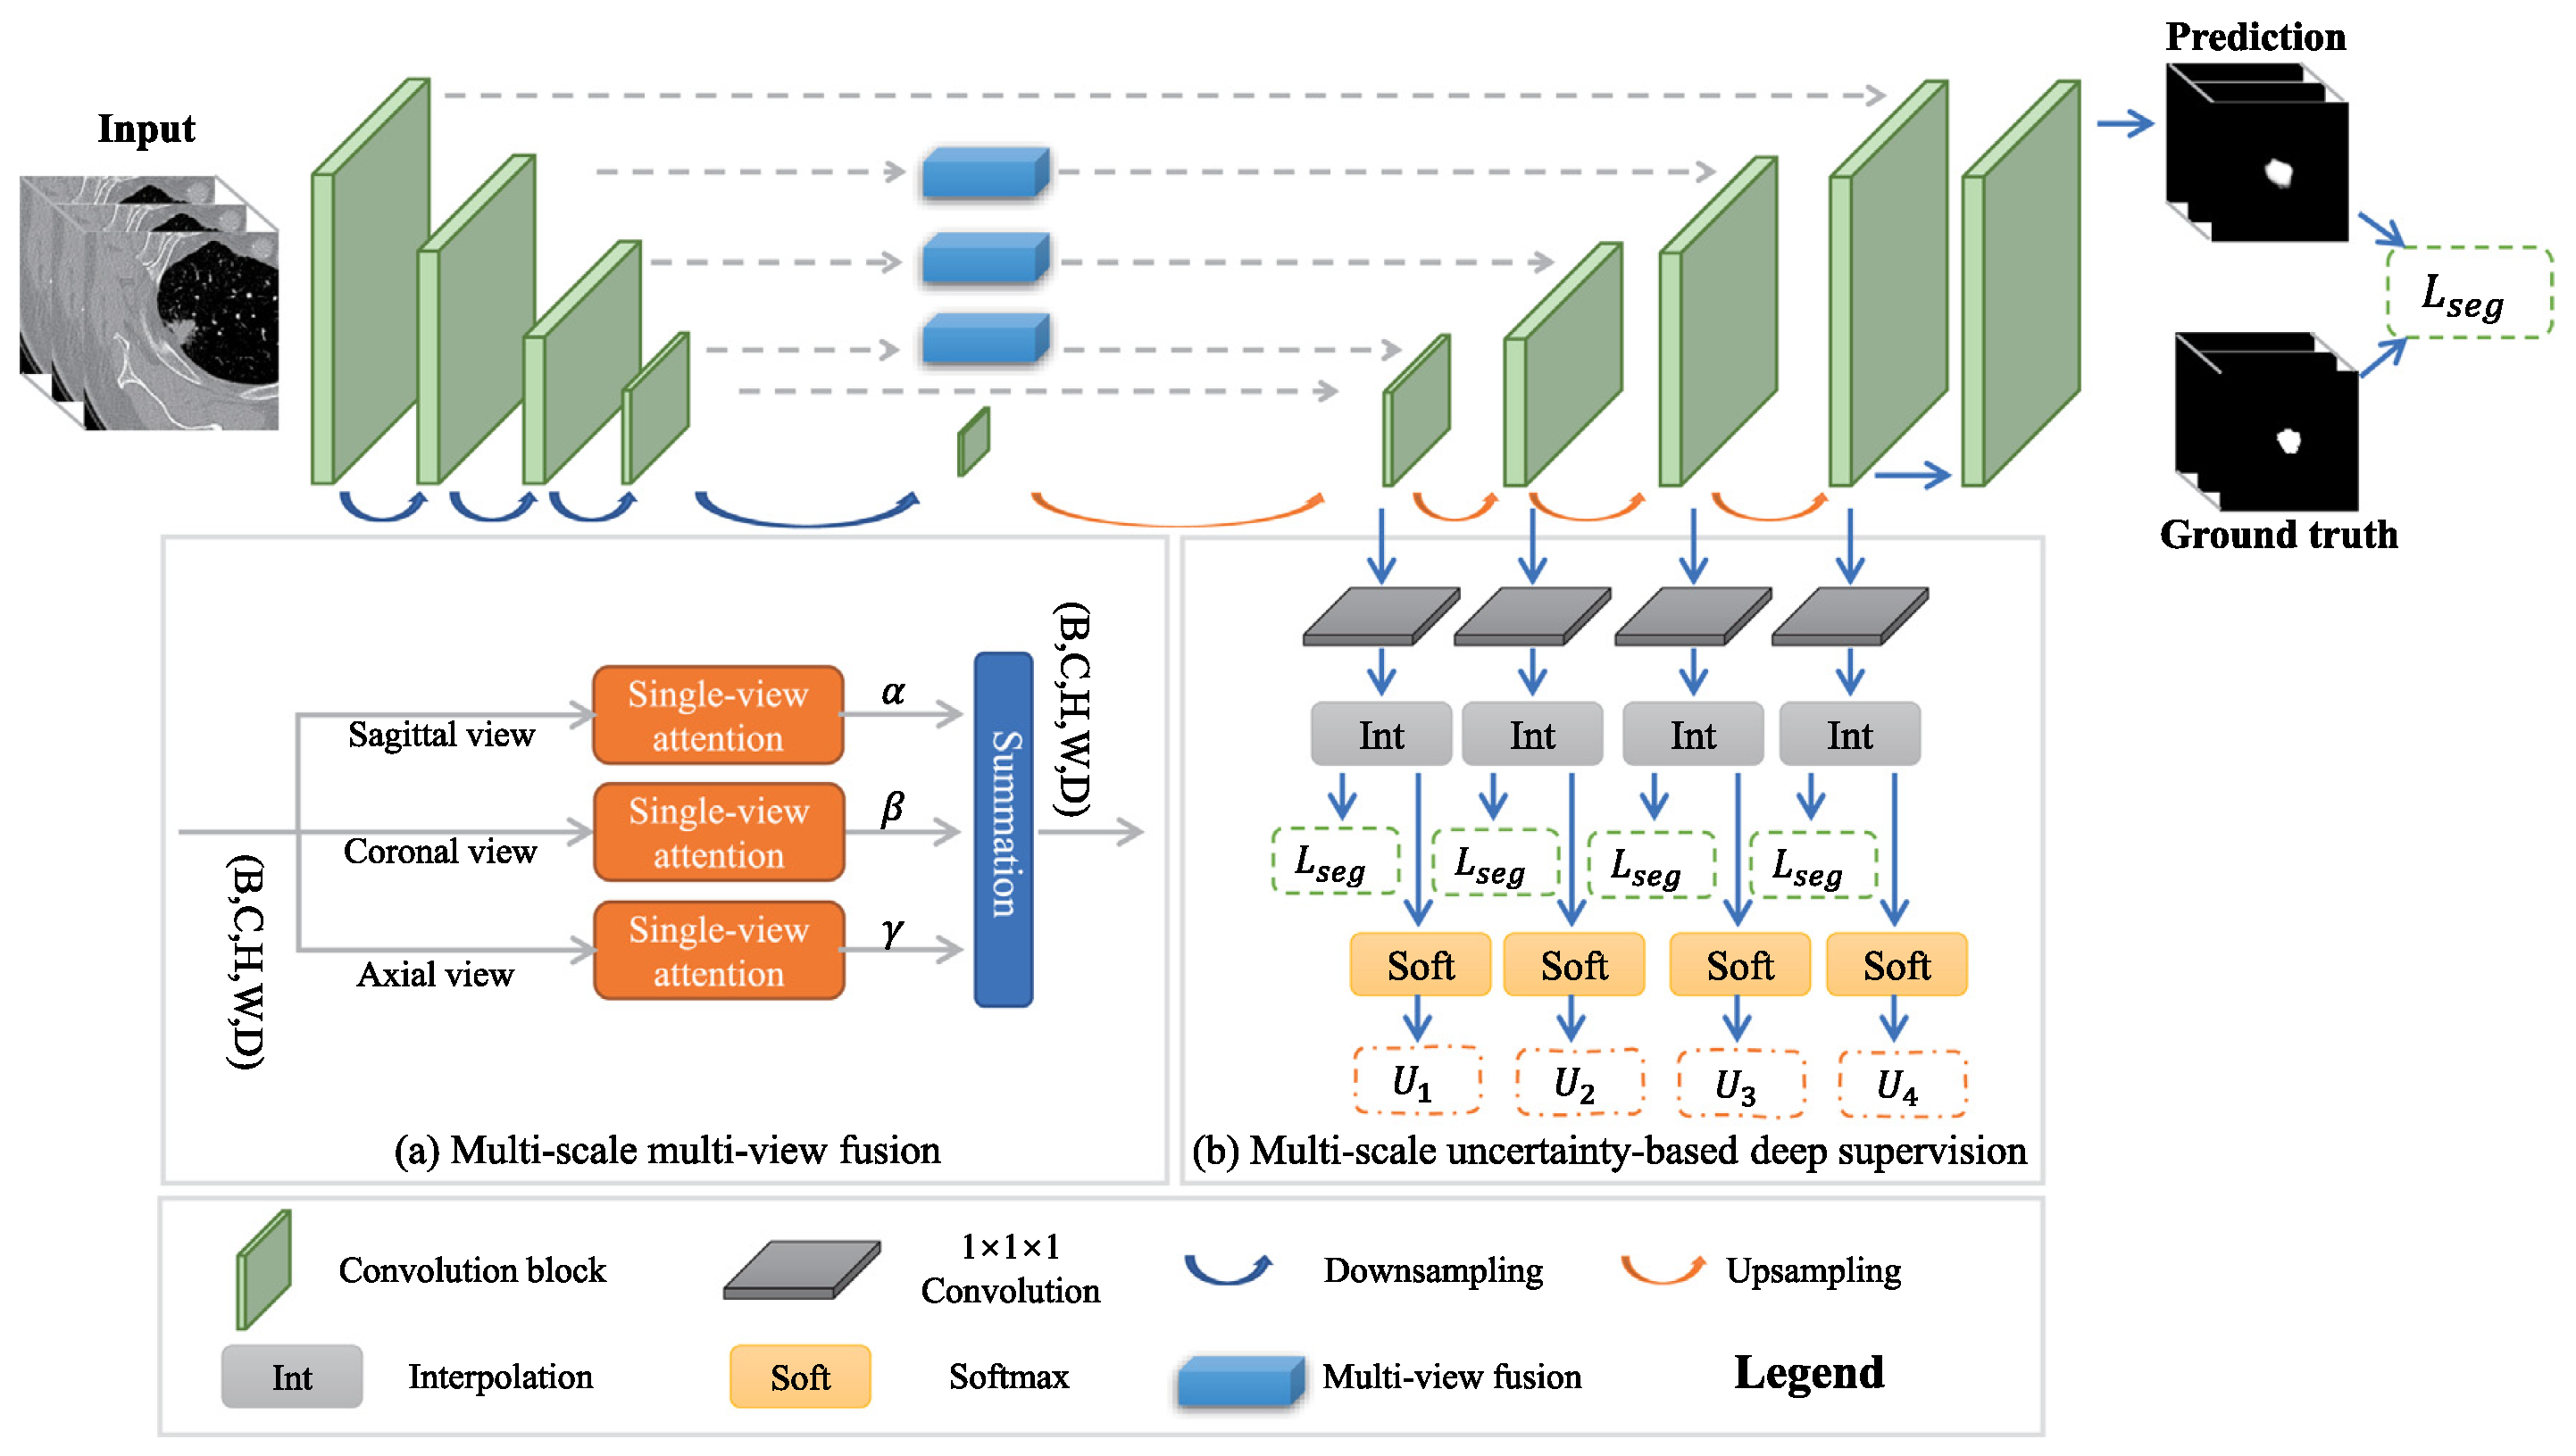
| Multi-scale + view | MSMV-Net [112] | LUNA16, MSD | 55.60, 59.94 | – | 2D view fusion, attention-weighted deep supervision |
| GAN-based | CSE-GAN [116] | LUNA16, ILND | 80.74, 76.36 | 85.46, 82.56 | 3D U-Net + CSE attention, sScE discriminator |
| Transformer-based | DEHA-Net [118] | LIDC-IDRI | 87.91 | 90.84 | Dual-encoder, transformer modules, hard attention |
| Architecture | Description and Usage | Example | Formula |
|---|---|---|---|
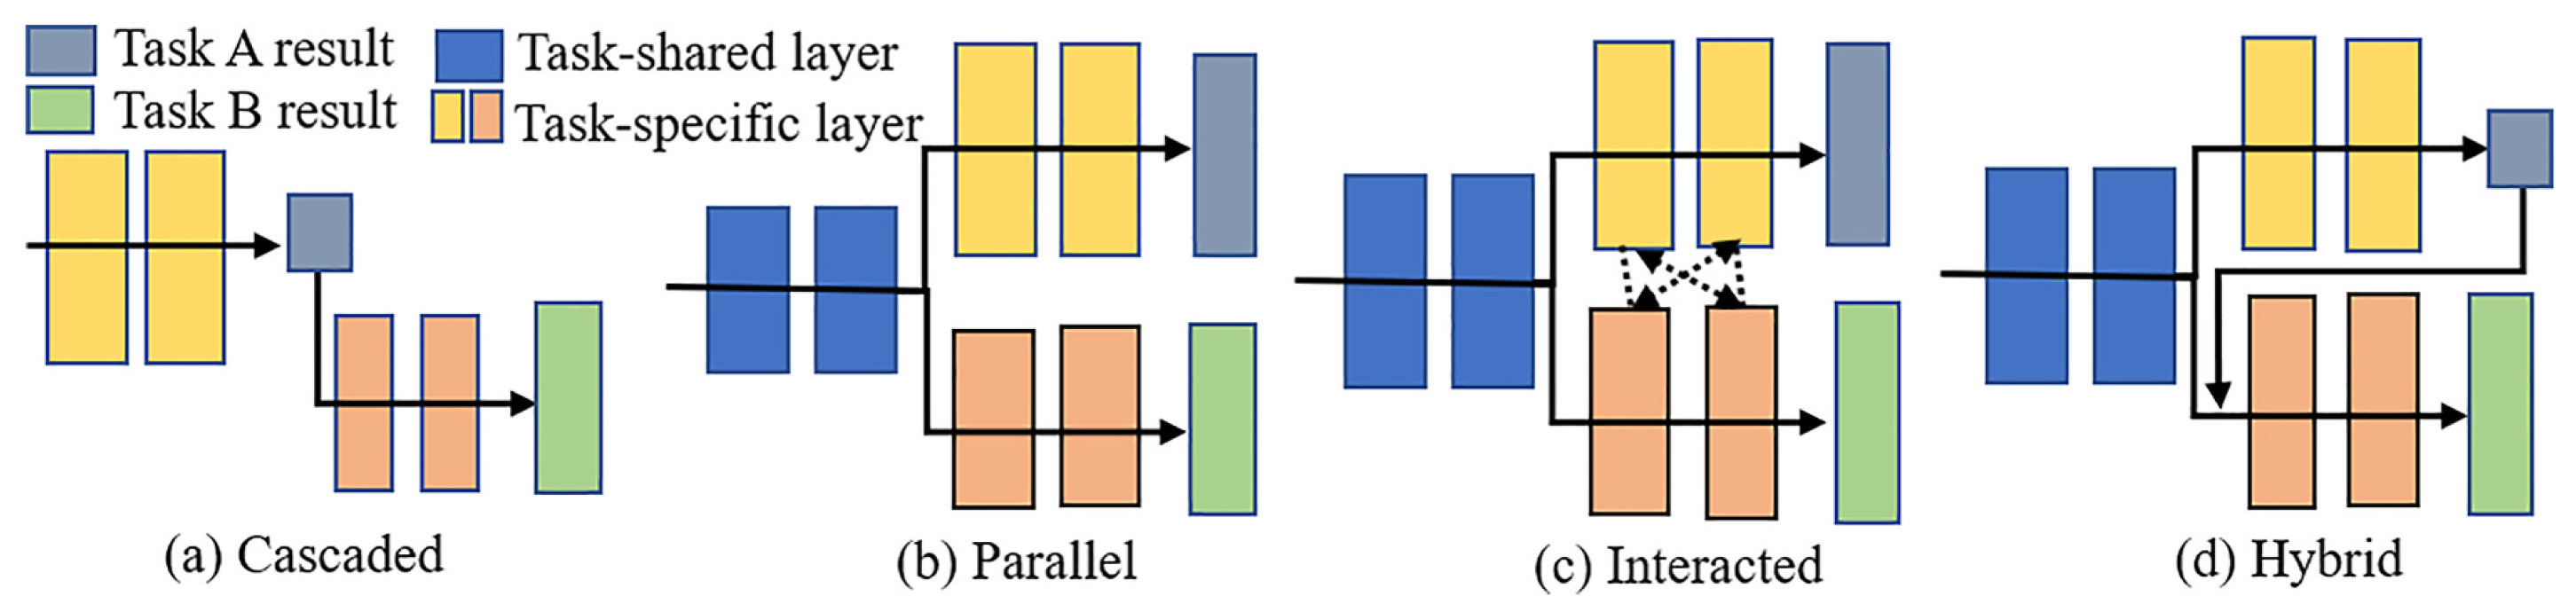
| Cascaded | Tasks run one by one. The following task builds upon the outcome of the preceding task. Best for strong task dependency. | TS-MDL framework first segments teeth with iMeshSegNet, then detects landmarks with PointNet-Reg based on segmentation output [129]. | , where . |
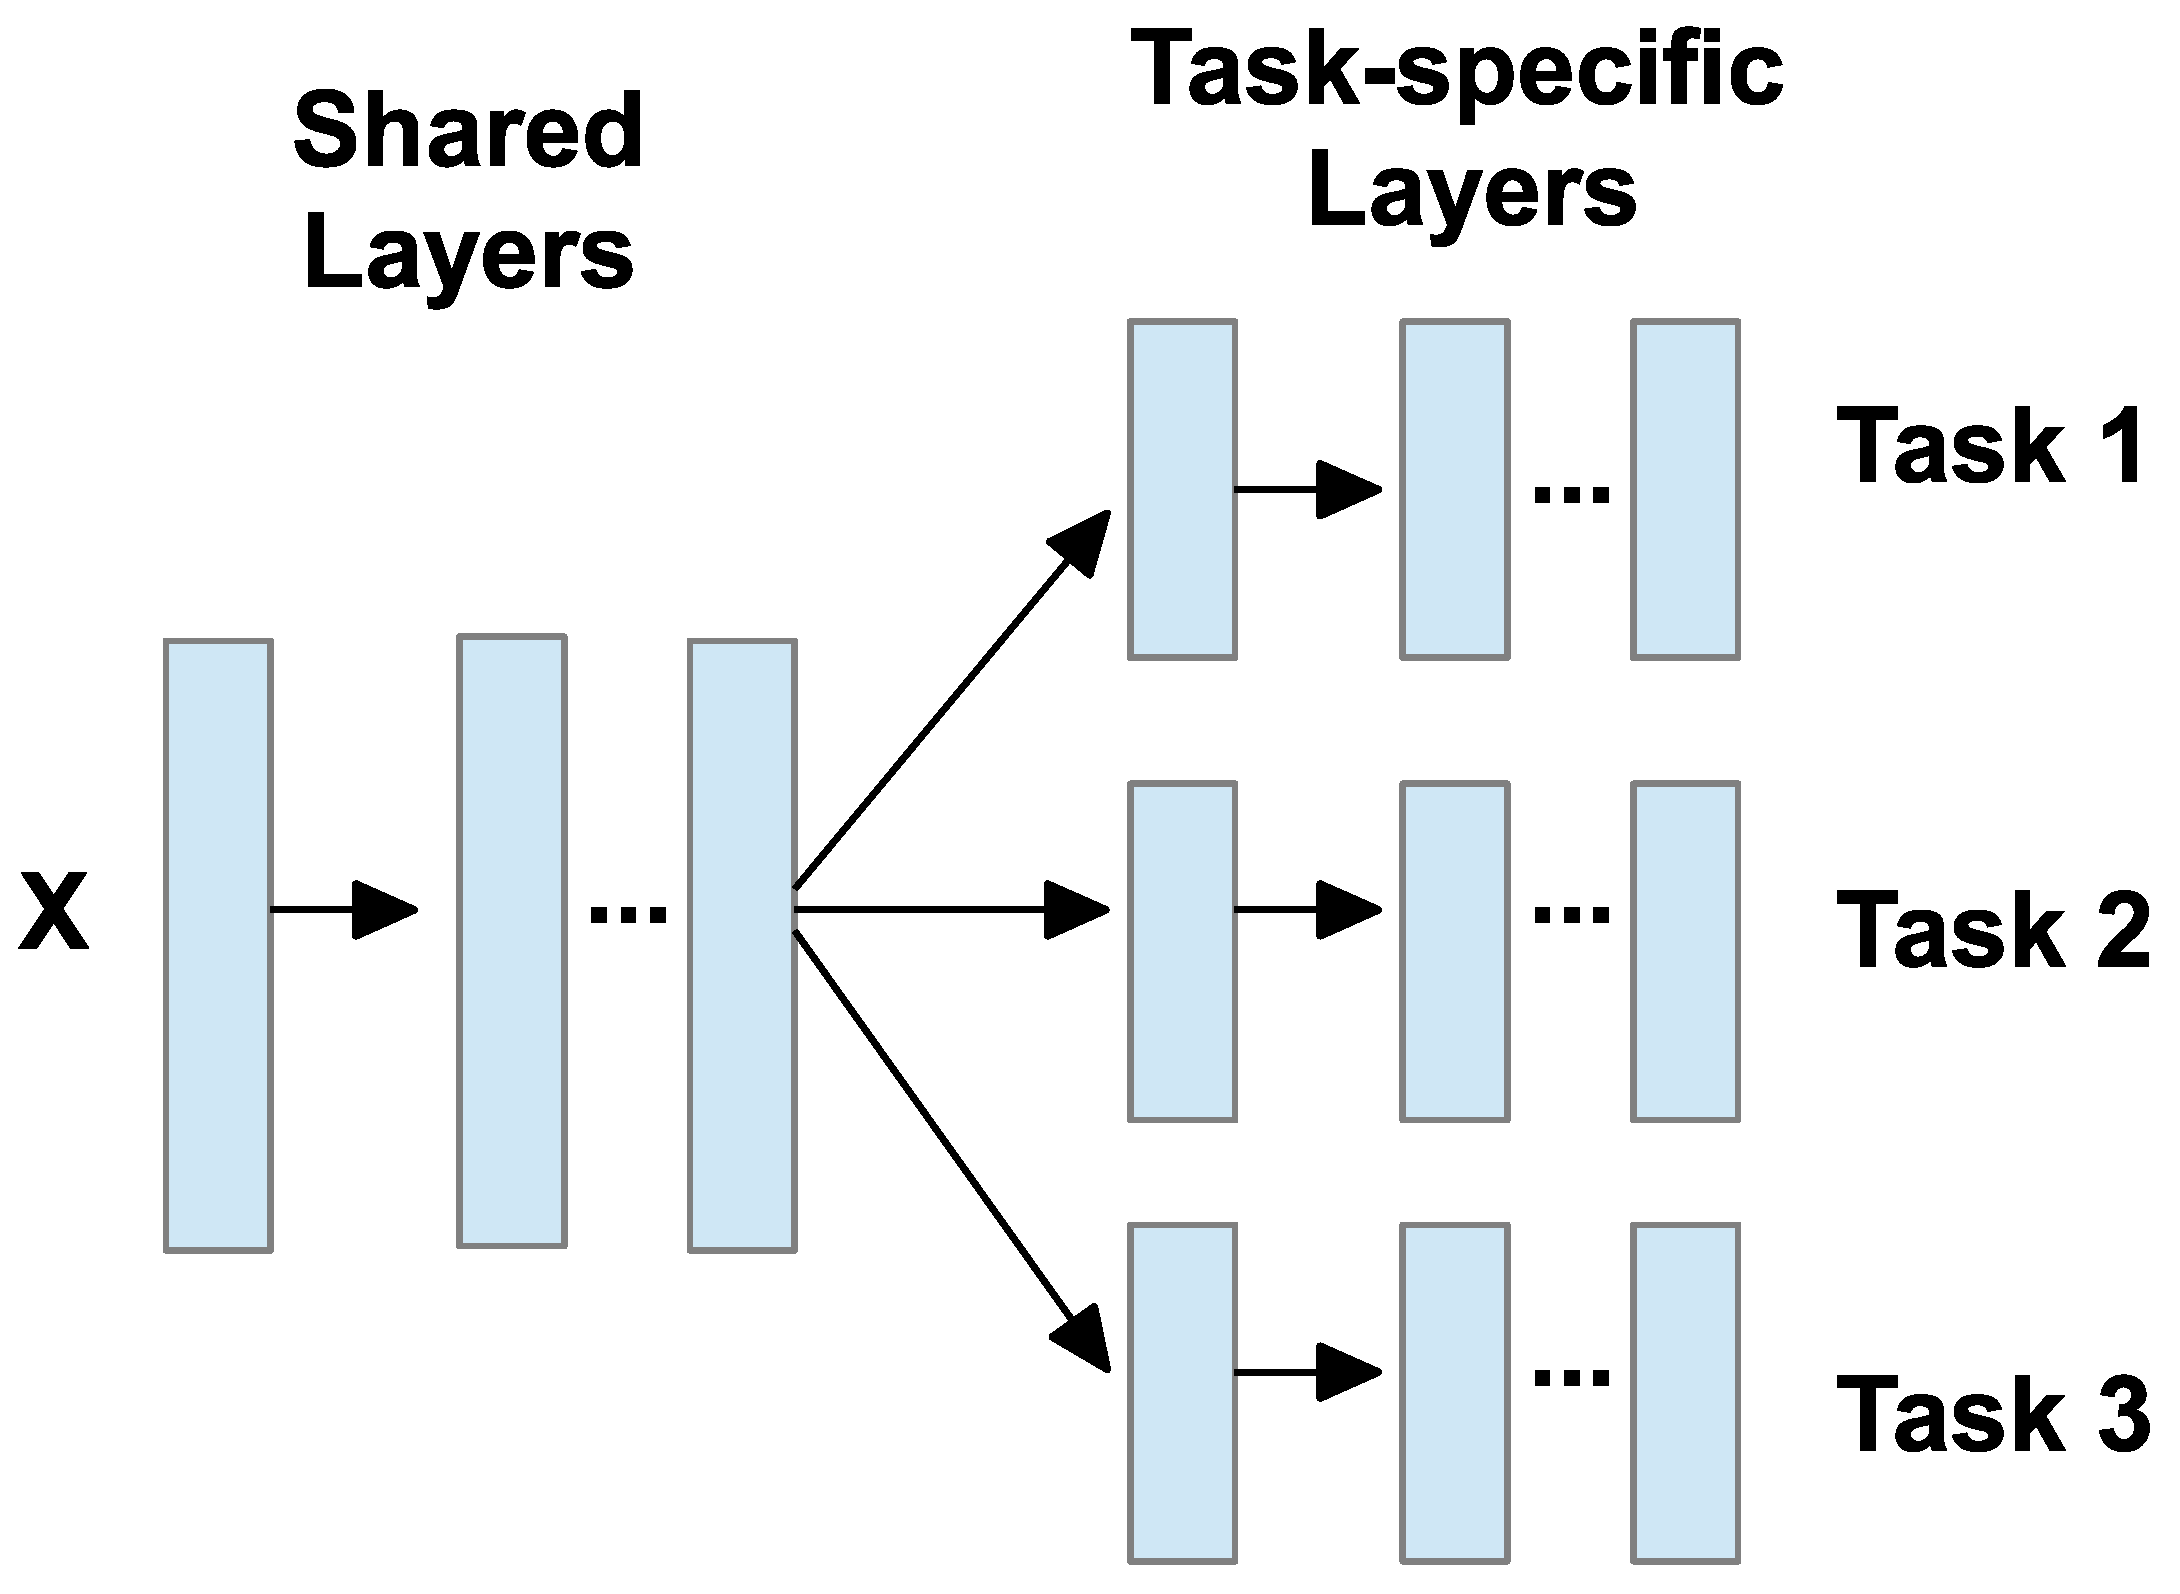
| Parallel | A shared encoder feeds multiple separate decoders. Tasks are related but not dependent. | COMiT-Net uses one encoder for CXR images and separate decoders for COVID classification and segmentation [130]. | , . |
| Interacted | Task-specific layers exchange features. Useful when tasks benefit from each other. | AMTA-Net segments bladder and rectum first, then uses attention to guide prostate bed segmentation [131]. | , where . |
| Hybrid | Mix of cascaded, parallel, and/or interaction. Suited for complex task combinations. | DeepSC-COVID jointly performs 3D lesion segmentation and COVID diagnosis using multiple interacting subnets [132]. | , where . |
| Type | Model/Method | Dataset | FROC (%) | DSC (%) | Key Features |
|---|---|---|---|---|---|
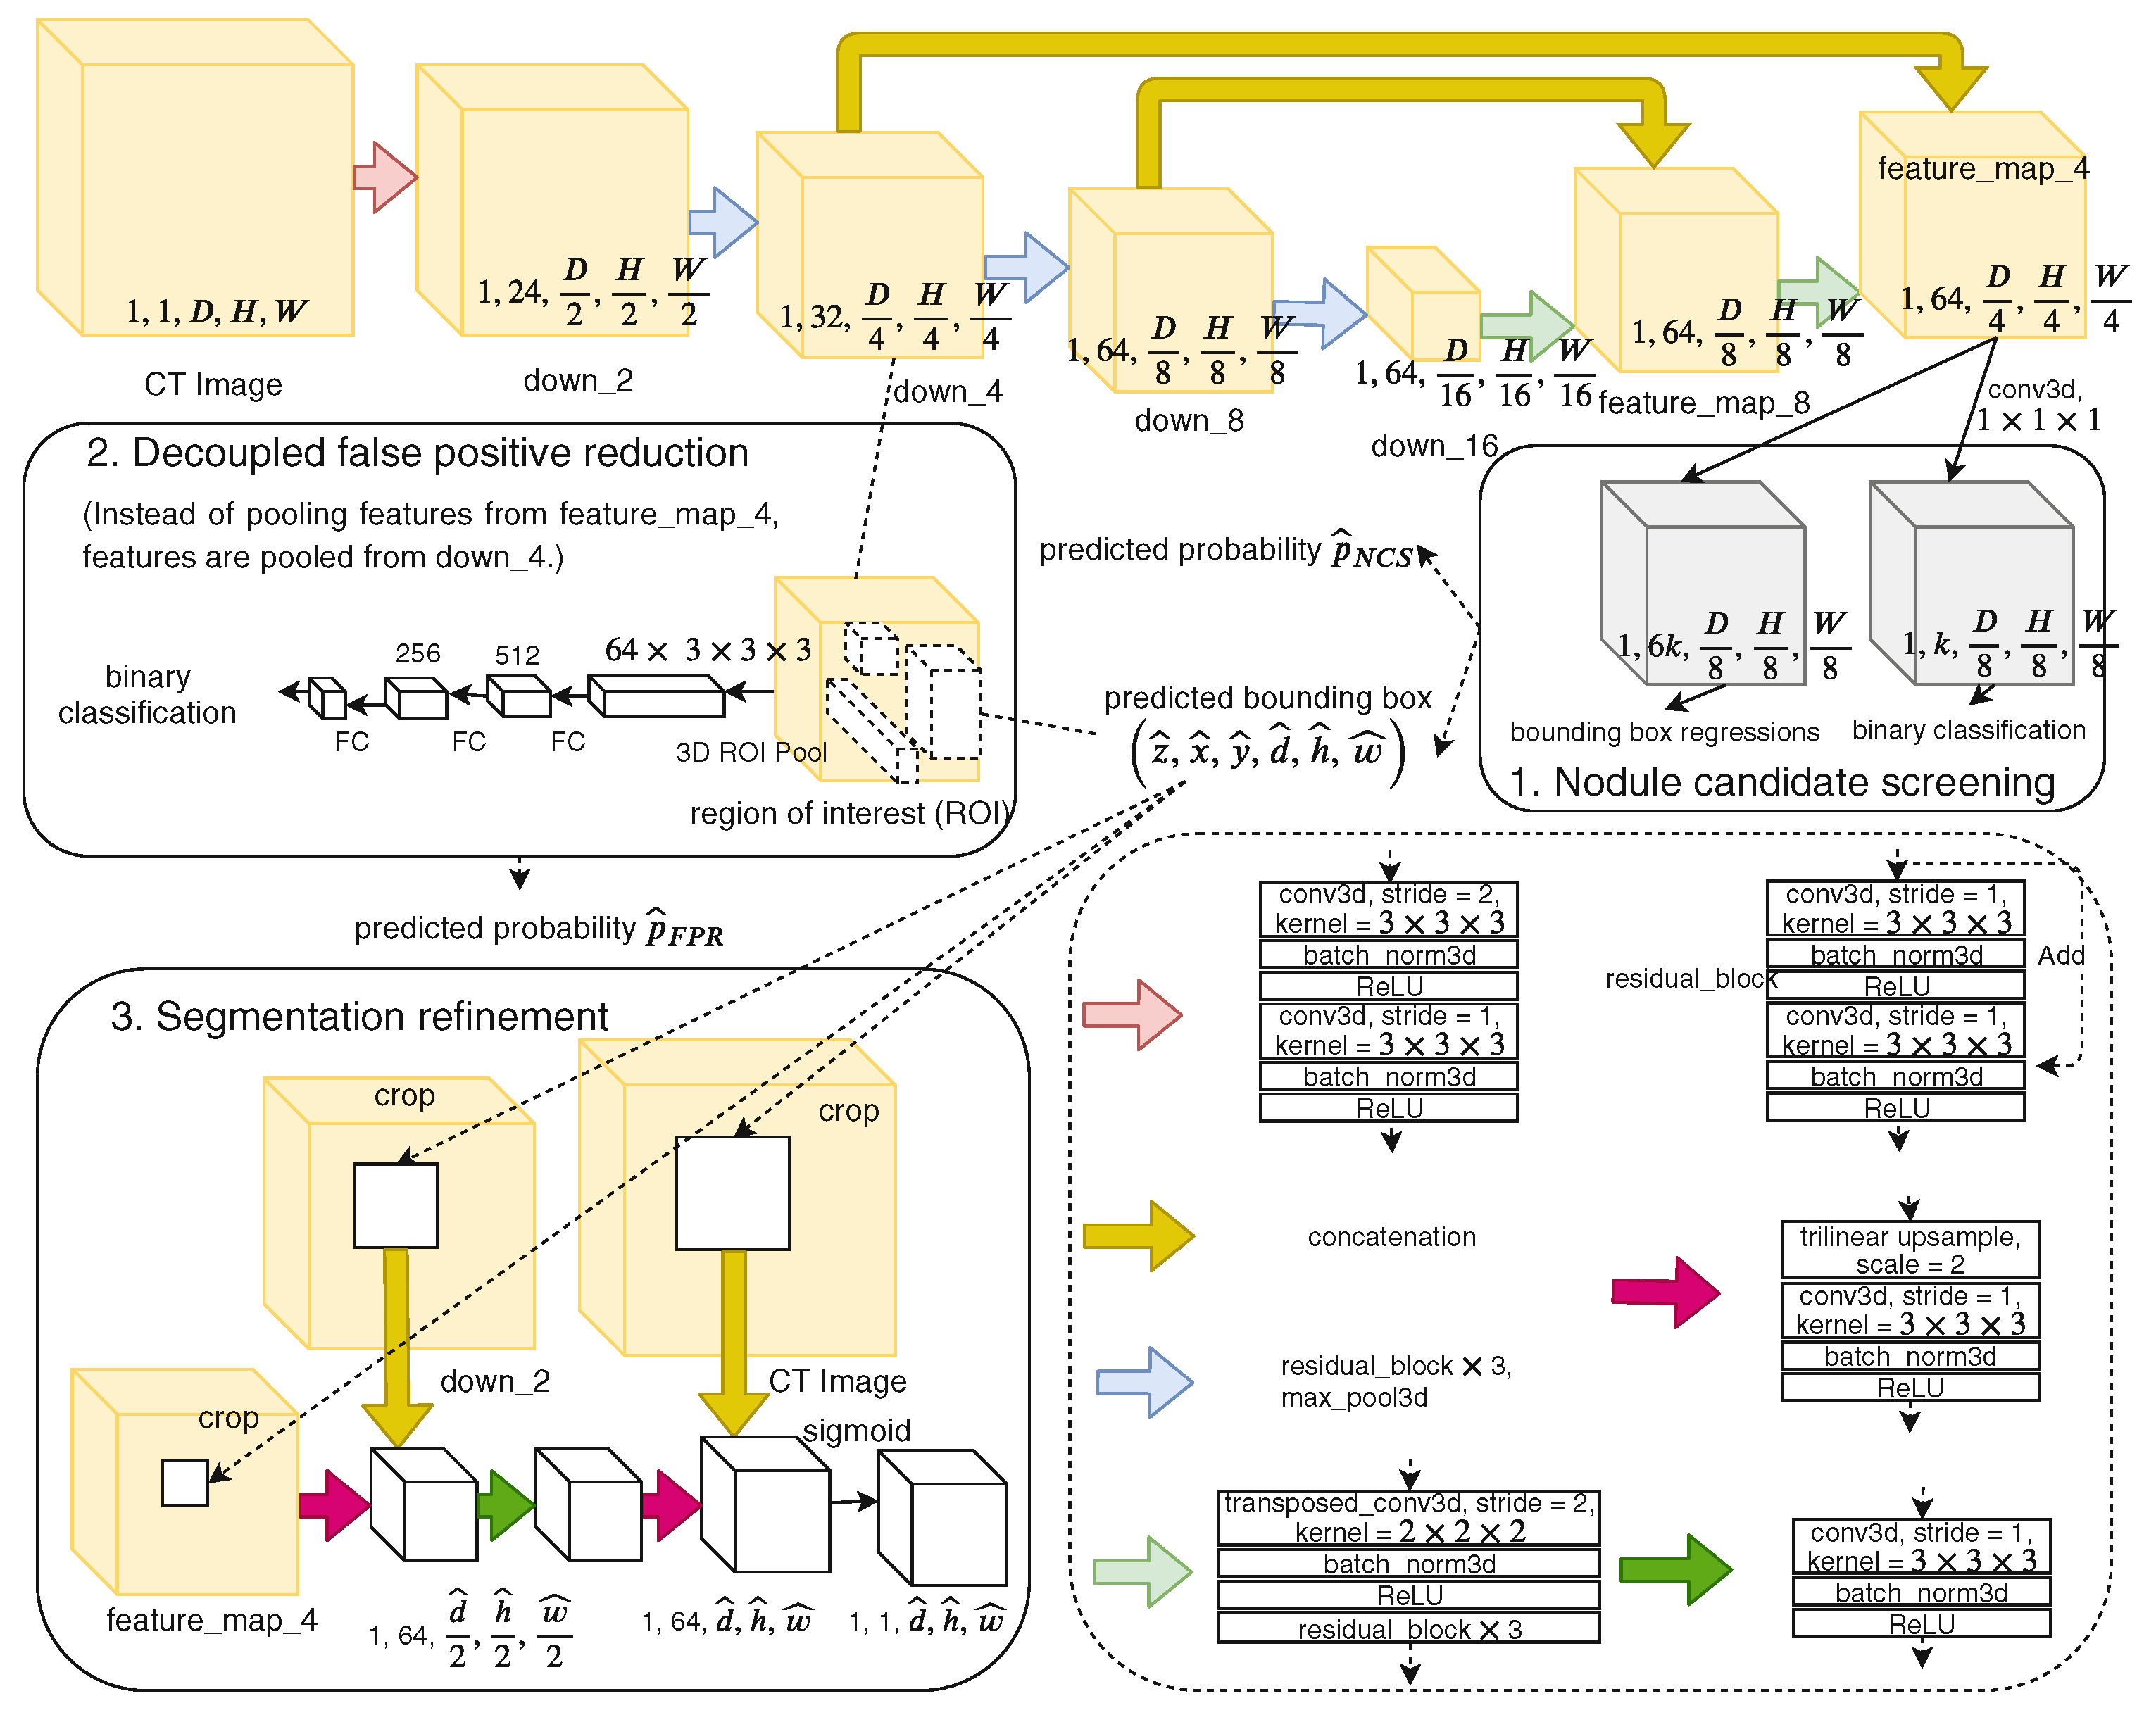
| Cascaded | NoduleNet [14] | LIDC-IDRI | +10.27% vs. single-task | 83.1 | Decoupled tasks, FP reduction, segmentation refinement module |
| Parallel (Weakly-sup.) | Multi-branch U-net + ConvLSTM [15] | LIDC-IDRI | +6.89% vs. single-task | 82.26 | Sequential context, dynamic loss weighting, weak labels |
| Hybrid | ECANodule [16] | LIDC-IDRI | 91.1 | 83.4 | Dense skip connections, attention, OHEM training |
| Hybrid (Deep-attention) | MANet [133] | LIDC-IDRI | 88.11 | 82.74 | Deep supervision, multi-branch attention, boundary enhancement |
Disclaimer/Publisher’s Note: The statements, opinions and data contained in all publications are solely those of the individual author(s) and contributor(s) and not of MDPI and/or the editor(s). MDPI and/or the editor(s) disclaim responsibility for any injury to people or property resulting from any ideas, methods, instructions or products referred to in the content. |
© 2025 by the authors. Licensee MDPI, Basel, Switzerland. This article is an open access article distributed under the terms and conditions of the Creative Commons Attribution (CC BY) license (https://creativecommons.org/licenses/by/4.0/).
Share and Cite
Li, R.; Honarvar Shakibaei Asli, B. Multi-Task Deep Learning for Lung Nodule Detection and Segmentation in CT Scans: A Review. Electronics 2025, 14, 3009. https://doi.org/10.3390/electronics14153009
Li R, Honarvar Shakibaei Asli B. Multi-Task Deep Learning for Lung Nodule Detection and Segmentation in CT Scans: A Review. Electronics. 2025; 14(15):3009. https://doi.org/10.3390/electronics14153009
Chicago/Turabian StyleLi, Runhan, and Barmak Honarvar Shakibaei Asli. 2025. "Multi-Task Deep Learning for Lung Nodule Detection and Segmentation in CT Scans: A Review" Electronics 14, no. 15: 3009. https://doi.org/10.3390/electronics14153009
APA StyleLi, R., & Honarvar Shakibaei Asli, B. (2025). Multi-Task Deep Learning for Lung Nodule Detection and Segmentation in CT Scans: A Review. Electronics, 14(15), 3009. https://doi.org/10.3390/electronics14153009