Abstract
Liver tumors negatively affect vital functions such as digestion and nutrient storage, significantly reducing patients’ quality of life. Therefore, early detection and accurate treatment planning are of great importance. This study aims to support physicians by automatically identifying the type and location of tumors, enabling rapid diagnosis and treatment. The segmentation process was carried out using deep learning methods based on artificial intelligence, particularly the U-Net architecture, which is designed for biomedical imaging. U-Net was modified by adding residual blocks, resulting in a deeper architecture called ResUNet. Due to the limited availability of medical data, both normal data fusion and discrete wavelet transform (DWT) methods were applied during the data preprocessing phase. A total of 131 liver tumor images, resized to 120 × 120 pixels, were analyzed. The DWT-based fusion method achieved more successful results, with a dice coefficient of 94.45%. This study demonstrates the effectiveness of artificial intelligence-supported approaches in liver tumor segmentation and suggests that such applications will become more widely used in the medical field in the future.
1. Introduction
The liver is a vital organ that fulfills important functions such as digestion and storage of nutrients and is connected to other organs in the living body. Liver diseases are considered to be important health problems. Liver cancer is one of the most known cancers in the world and has many negative effects [1]. Tumors, also referred to as cancer, are divided into two types: benign and malignant. While benign tumors do not affect the life of the person very much, malignant tumors affect the life of the person extremely negatively and may result in death if no precautions are taken. Regardless of whether a tumor in the liver is benign or malignant, it should be regularly imaged with various imaging techniques, such as computed tomography (CT), mammography, magnetic resonance (MR), ultrasound, and X-ray, and interpreted by a specialist.
The structure and diseases of the liver are analyzed by specialists using manual or automated segmentation methods. Liver segmentation is used to obtain information about the organ structure from medical images. Imaging techniques such as CT and MR allow the shape and texture of the tumor to be defined.
In the segmentation process, determining the type and location of abnormal tissues is the most important step in diagnosing the disease and planning treatment. Performing segmentation manually is difficult because it requires expertise and time. It is prone to errors. Doctors’ personal habits or scanning methods cause significant variations and shifts in the scanned data distribution. Furthermore, it is costly to transfer medical images from one medium to another. With the algorithms developed today, artificial data is generated from real data. Increasing the number of samples provides positive results for segmentation. In recent years, deep learning techniques have been used to create a fast detection system in medical image analysis with preprocessing, feature generation, segmentation, and classification stages [2].
Semantic segmentation is the process of matching each pixel of medical images such as CT to a class. It categorizes images into classes [3]. Since there are differences even in tissues of the same class, it is difficult to detect tumors in histopathological images [4]. Pixel-based segmentation methods are more preferred for medical image segmentation. Various deep learning architectures based on convolutional neural network (CNN) architecture such as U-Net and ResNet have been developed for segmentation of these images. While the U-Net architecture facilitates information propagation between high- and low-level features, the ResNet architecture provides various advantages that reduce computational difficulties even in a multi-layer structure thanks to residual blocks. Since medical image data is limited, data fusion methods can be used to extract important features and increase the number of samples.
In this study, normal data fusion and DWT-based data fusion were used in the ResUNet model, which is applied for medical image segmentation, to increase data diversity. Data fusion led to a significant expansion in the data space. In the Related Works Section, sample studies on data fusion and segmentation were discussed. The Materials and Methods Section presents a detailed explanation of the study. In the Results Section, the outcomes of the application are presented in a table. The Discussion Section evaluates the findings of the study. Finally, the Conclusions Section summarizes the study and its contributions.
2. Related Works
The liver is a soft organ whose shape and size vary from patient to patient. Due to its location, it is very difficult to distinguish this organ from other organs around it. Detection of the liver and related diseases can be carried out by segmentation methods. Some of the methods used for liver tumor segmentation are described below.
Organ cancers have a high mortality rate and segmentation is a difficult process due to the erratic shape of the organs [5]. During its development, the architecture ANU-Net creates dense jump connections between nested convolution blocks and a full-resolution feature map. In the segmentation process, the weight of the target region is increased while blocking out the background. In this study, CT scan images from the LiTS dataset and MR images from the Chaos dataset were used. For liver segmentation, a 98.15% dice coefficient value was obtained with the LiTS dataset and a 93.55% dice coefficient value was obtained with the Chaos dataset.
CT scans are widely used to diagnose hepatic anomalies [6]. HFRU-Net is basically an architecture derived from the U-Net architecture, consisting of high-level features, reconstructing detailed contextual information and modifying jump paths. In this study, the HFRU-Net model was analyzed with the LiTS dataset. It achieved a 95% dice coefficient value for liver segmentation and a 61.4% dice coefficient value for liver tumor segmentation.
Two different architectures for segmentation were compared: a single neural network and two consecutive fully convolutional neural networks [7]. The first architecture segmented the liver while the second architecture segmented the tumor. The model was trained with a subset of the LiTS dataset and tested with data from a private radiology center. It achieved 93.85% IoU for liver lesion evaluation and 79.17% IoU for tumor detection.
The ResUNet model was applied to segment the liver using the Ircadb01 dataset [8]. In the study, the ResUNet model achieved 99.23% accuracy for liver segmentation and 99.27% accuracy for tumor segmentation.
Deep learning techniques are widely used for classification and segmentation [9]. In this study, 66 MR data points were classified into four classes as normal, glioblastoma, sarcoma, and metastatic using a deep neural network (DNN). Image segmentation was performed using a fuzzy method. Feature extraction was performed using DWT. Component reduction was performed using principal component analysis (PCA). As the last step, classification was performed with the DNN model. The implemented system is similar to CNN architecture and requires less hardware.
Upon examining studies in the literature, it was observed that the shape, texture, and types of tumors could be analyzed with deep learning methods. In this study, we aimed to segment liver tumors with the ResUNet model. Data fusion was applied to increase the performance of the model and the number of samples.
3. Materials and Methods
In this study, CT-based liver images were resized to 120 × 120 pixels to preserve sufficient tumor information while reducing processing time, lowering memory usage, and enabling faster model training. Data fusion was applied to increase data diversity, enhancing the variety of samples available for training. Following this, analyses were performed using the ResUNet model to segment and identify the liver tumors. This process is illustrated in the flowchart shown in Figure 1, starting from image preprocessing, through data fusion, and ending with model training and evaluation.
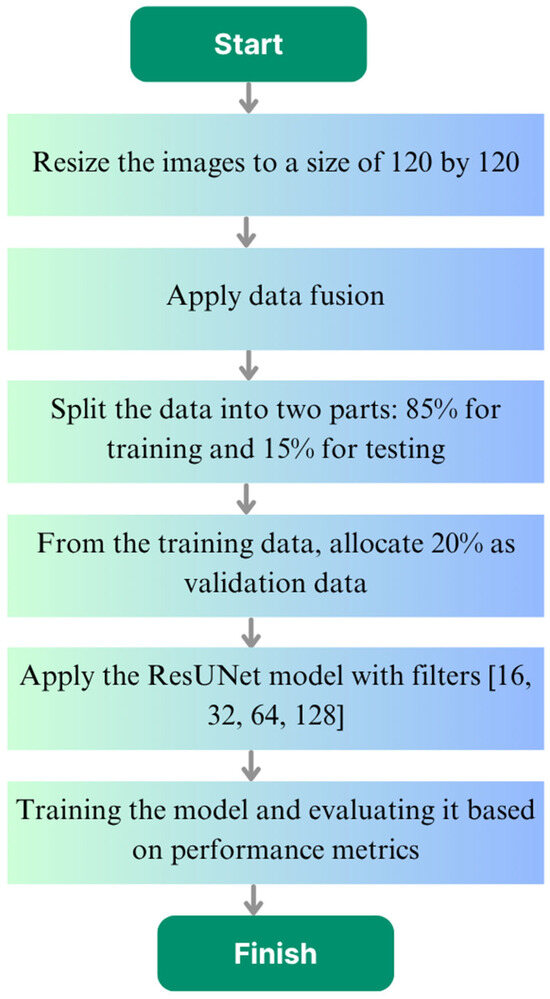
Figure 1.
Flowchart of the study.
3.1. DWT-Based Data Fusion
Image fusion is the process of combining multiple images while preserving certain features [10]. Image fusion encompasses algorithms that emphasize the interesting features of an image and limit the unimportant features. PCA and DWT-based methods are widely preferred for image fusion.
In the DWT method, detailed information is extracted from a single image and injected into another image. Wavelets have the ability to select and process frequencies over time. Similar to a neural network, feature-level image fusions can be created through wavelets. In medical image processing, wavelets provide consistent and well-characterized features [11]. By using discrete wavelet transform, the image is decomposed into bands [12].
The use of DWT in feature-level fusion offers several advantages for medical image segmentation tasks. By decomposing input data into multi-resolution frequency sub-bands, DWT enables the preservation of both spatial and frequency information. This allows for more effective integration of complementary features, enhancing the model’s ability to detect fine structural details such as tumor boundaries. Moreover, DWT helps suppress noise by isolating high-frequency components, resulting in cleaner fused representations.
In this study, a multi-level three-dimensional discrete wavelet transform (3D-DWT) was applied to the combined volumetric image data. The Haar wavelet was chosen for this transformation due to its computational efficiency and its effectiveness in capturing structural variations. The Haar wavelet is the most basic wavelet function that decomposes a signal into approximation and detail components. Mathematically, it is a short-support, orthogonal basis function, allowing it to effectively represent both the global structure (approximation coefficients) and the local variations (detail coefficients) of the data. When applied to 3D image data, the Haar wavelet decomposes the volume into multi-level, three-dimensional frequency components. This decomposition reveals both the low-frequency general structure and the high-frequency details. The wavelet coefficients obtained from the transformation reflect the multi-scale and multidimensional nature of the volumetric data, providing a more meaningful and rich representation of the structural features in the images. Consequently, this contributes to more accurate and effective delineation of complex tissues and boundaries, particularly in medical image segmentation.
3.2. U-Net Model
The success of CNN architecture is sometimes limited due to reasons such as the training set and the size of the network [13]. Therefore, in 2015, Olaf Ronneberger and colleagues proposed the U-Net architecture based on CNN. This architecture provides precise and end-to-end semantic segmentation. In semantic segmentation, knowledge of low-level details is crucial for high-level semantic information.
The U-Net architecture uses hopping connections [14] to reduce the size of the feature map [15]. This architecture groups each pixel into a specific category. It extracts low-level features and combines them with higher-level features. Since the network resembles a U-shape, it allows contextual information to be spread over higher resolution layers. Downsampling is used to gradually display environmental information and upsampling is used to restore detailed information. It has a symmetric network structure with an encoder and a decoder. The encoder captures the context of the image by downsampling the input. The decoder performs upsampling and converts the output resolution to the input resolution. It performs pixel-wise classification and divides the image into real and fake regions [16,17]. In the decoding phase, the size of the feature map is restored and a symmetric form is created. This symmetric form unifies the feature map at the same level and allows the feature map to be reused [18].
3.3. ResNet Model
The ResNet architecture was developed to further facilitate training by adding a shortcut connection at both layers to a network similar to the VGG architecture [19]. An important advantage is that it can provide deep network training with more than 1000 layers. The identity shortcut connections used in the architecture provide an advanced degree of optimization [20,21]. The residual block structure is shown in Figure 2.
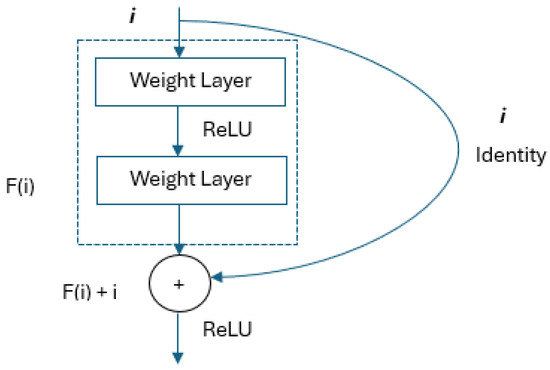
Figure 2.
Residual block structure [22].
3.4. Implementation of the ResUNet Model
In this study, we applied feature-level data fusion to make better use of the information coming from different image sources or modalities. This approach is commonly used in medical imaging, especially when combining complementary data from multiple modalities. The process starts by extracting feature vectors (embeddings) from each modality using deep learning models such as CNNs. Each modality is processed individually, and the resulting feature representations are then concatenated to form a single, unified feature vector. We preferred concatenation because it preserves the unique information from each modality without losing any details. It is also a flexible and simple method, allowing us to combine features even if they come from networks with different dimensions. This way, the model benefits from the rich, complementary information provided by each modality and can make more accurate predictions overall. In feature-level fusion, concatenation refers to the process of combining feature vectors extracted from different modalities side by side to form a single high-dimensional vector.
The liver tumor dataset [23] contains medical images with the NIfTI (.nii.gz) extension, which contains multimodal CT scans. Binary data fusion and DWT-based data fusion were applied to the dataset. The 130 images in the liver tumor dataset were transformed into a new dataset of 21,282 data points. This method significantly expanded the dataset in the feature space solely through feature-level fusion, without applying any conventional data augmentation techniques. As a result, a larger and more diverse set of training samples was created from a relatively small number of original images, enhancing the model’s ability to generalize. Altogether, 18,089 data points were used for training and 3193 data points were used for testing. The liver images were resized to 120*120. A sample liver image for liver tumor segmentation is shown from x, y, and z angles in Figure 3.
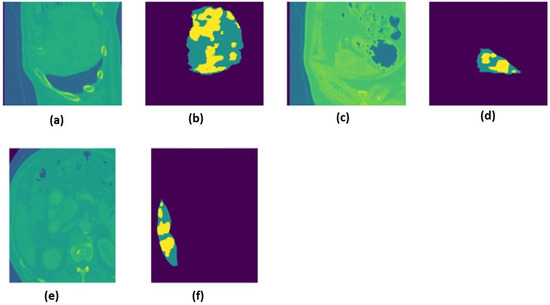
Figure 3.
The liver and mask images from the x, y, and z angles are presented as follows: (a) liver image in the z-axis; (b) mask image in the z-axis; (c) liver image in the y-axis; (d) mask image in the y-axis; (e) liver image in the x-axis; (f) mask image in the x-axis.
The hybrid ResUNet model created for 120*120 images is shown in Figure 4.
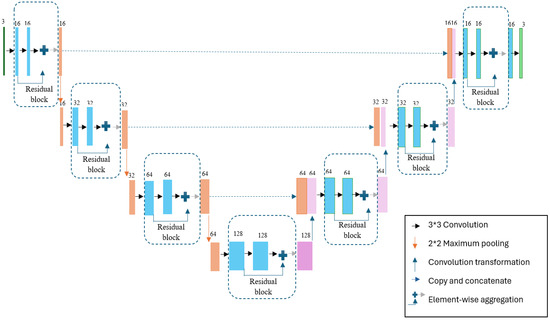
Figure 4.
Designed hybrid model.
Since the images used in the study were resized to 120 × 120 pixels, the model utilized four different filter sizes: 16, 32, 64, and 128. The architecture follows a U-Net-like encoder–decoder structure enhanced with residual connections to facilitate better gradient flow and more stable training. The network consists of four downsampling and four upsampling stages. Each convolutional block in the encoder and decoder paths includes two convolutional layers with 3 × 3 kernels, followed by batch normalization and ReLU activation. Downsampling is performed using 2 × 2 max-pooling operations, while upsampling is achieved via transposed convolution layers. Residual connections are applied by summing the input of each block with the output after the second convolutional layer. The final layer uses a sigmoid activation function to produce binary segmentation outputs. During training, the batch size was fixed at 32. The “Adam” optimizer was employed for the optimization process, with the learning rate set to 0.001. As the loss function, “binary_crossentropy” was used, which is commonly applied in binary classification tasks. The data was randomly split into training and testing sets, and the model was trained for 35 epochs.
3.5. Activation Functions Used in the Model
The activation function is the non-linear layer that generally follows the convolution layer. It allows the network to learn non-linear mappings to increase robustness. In architectures such as CNN and U-Net, activation functions such as sigmoid, tanh, and ReLU are used. The sigmoid function is often used in feed-forward neural networks. The output value of this function takes a value between 0 and 1. Its formula is shown in Equation (1) [24].
ReLU is an unsaturated activation function used to eliminate any negative value. It is very useful in CNN and its sub-architectures as it eliminates negative gradients when the threshold value is zero. This function, which provides fast convergence and ease of programming, is shown in Equation (2) [25,26].
4. Experimental Results
Table 1 shows the technical feature of the appliance on which the application was performed.

Table 1.
Technical feature of the appliance on which the application is performed.
Evaluation of Segmentation Results
The evaluation of semantic segmentation is quite complex. The performance of segmentation is not only measured by common metrics such as accuracy. In models such as U-Net and ResNet, metrics such as the dice coefficient are more preferred for measuring the performance of segmentation.
Performance measurement methods, such as a confusion matrix using actual and predicted values, are used to evaluate model results. The ratios of predicted and actual values are shown as elements of a class in the complexity matrix as shown in Figure 5.
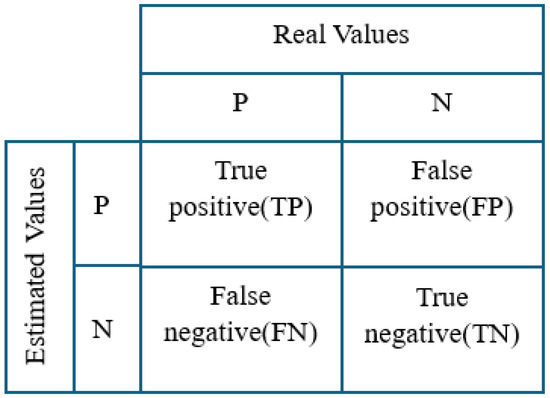
Figure 5.
Confusion matrix.
Performance metrics guide the modeling process and are very important in the evaluation of segmentation. In this study, precision, sensitivity, the f-measure, the dice coefficient, and metrics were used to measure the performance of the model.
Precision: This metric, which is used to evaluate samples and calculate them as a ratio, is shown in Equation (3).
Sensitivity: Sensitivity is a valid and popular metric expressed as the ability of the model to predict positive samples. It is less sensitive than metrics based on the F-score and it is shown in formula Equation (4) [27].
F-measure: The F-measure is the harmonic mean of the precision and sensitivity values and its formula is shown in Equation (5) [28].
Dice Coefficient: The dice coefficient is a statistical metric used to measure the matching quality of object pairs [29]. It can properly evaluate uncertainty due to missing data used in complex methods and image segmentation [30], it overcomes the problem of class imbalance [31], and it describes the similarity between two objects in a range between 0 and 1 [32]. Its formula is shown in Equation (6) [33,34].
The dice coefficient plot of the ResUNet model is shown in Figure 6.
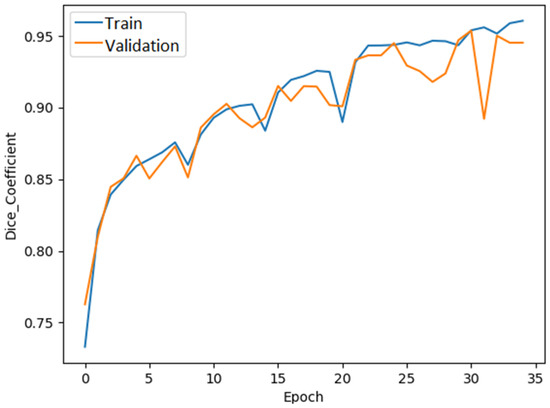
Figure 6.
ResUNet dice coefficient graph.
The loss plot of the ResUNet model is shown in Figure 7.
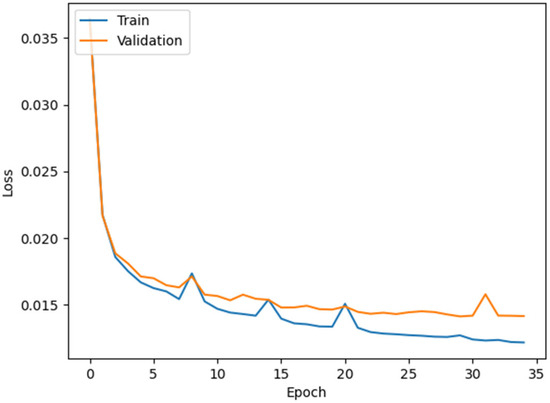
Figure 7.
ResUNet loss graph.
Figure 8 shows a sample image and the extracted tumor region.
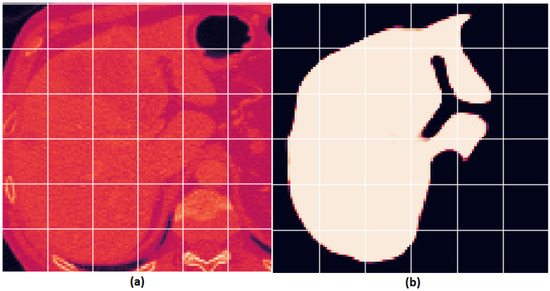
Figure 8.
An example liver image and the segmented result presented as follows: (a) original liver image; (b) segmented image with the tumor region extracted.
Table 2 shows the normal and DWT-based data fusion methods applied for liver tumor segmentation and their analysis with the ResUNet model.
Table 2.
Data fusion methods used for liver tumor segmentation and the test results with the ResUNet model.
The results of studies in the literature that investigated liver tumor segmentation are shown in Table 3.
Table 3.
Comparison of studies for liver tumor segmentation according to the literature.
5. Discussion
In this study, we worked with a limited dataset to examine liver tumor segmentation. We observed that available datasets in this field are quite scarce, mainly due to ethical concerns and the difficulties of annotation. Therefore, to use our data more effectively and increase its diversity, we applied both traditional and DWT-based data fusion techniques. The ability of DWT to decompose the data into both its general structure and detailed components helped the model learn features more effectively.
At the feature level, we increased the model’s learning capacity by combining multiple feature maps obtained from different sources. This allowed the model to be trained on a richer and more comprehensive representation space. We chose the Haar wavelet due to its computational efficiency and its ability to capture abrupt structural changes in images effectively. Its short support and orthogonal structure allowed it to represent both the overall structure and local details of the data effectively.
We preferred the ResUNet architecture because residual blocks enable deeper learning and prevent issues like gradient vanishing. This particularly improved segmentation performance on low-resolution images.
There are some limitations in our study. Specifically, due to the small size of our dataset, we were unable to perform cross-validation. More extensive testing with stronger hardware could overcome this limitation in the future. Additionally, investigating how our model performs on different datasets and under varying conditions is an important topic for future research.
6. Conclusions
Organs in the living body are groups of tissues responsible for performing specific functions. One of these organs, the liver, has a number of important vital functions such as digestion, storing nutrients, and balancing hormones. The liver is similar in shape, texture, and density to the organs around it. Because of this similarity, detecting disease in the liver is a very difficult process. To analyze medical images, methods such as manual segmentation based on expert knowledge or automatic segmentation based on artificial intelligence are used. Liver segmentation is an important step in detecting lesions and diagnosing liver-related diseases. Automated segmentation methods based on deep learning and machine learning are not as time-consuming and laborious as manual methods for segmenting the liver into lesions or locating the tumor. Deep learning offers the opportunity to build more powerful and accurate models for generating predictions. It produces more deeply transformative and analyzable predictions. Since medical images require many features such as a suitable environment and adequate hardware, the availability of data is limited. Due to this limitation, the number of data points can be increased with artificial intelligence-based algorithms. In this study, normal data fusion and DWT-based data fusion methods were used to increase the number of samples of the liver dataset. The fusion images for liver tumor segmentation were analyzed using the ResUNet model. It provided remarkable results in the form of the dice coefficient value, which is one of the key metrics for medical image segmentation. It is expected that in the coming years, artificial intelligence-based applications for medical image segmentation will become more widespread and will provide experts with preliminary information for diagnosis and treatment.
Author Contributions
Conceptualization, Ü.Ş.E. and H.K.; methodology, Ü.Ş.E.; software, Ü.Ş.E.; validation, Ü.Ş.E.; formal analysis, Ü.Ş.E.; investigation, Ü.Ş.E.; resources, Ü.Ş.E.; data curation, H.K.; writing—original draft preparation, Ü.Ş.E. and H.K.; writing—review and editing, Ü.Ş.E. and H.K.; visualization, Ü.Ş.E. All authors have read and agreed to the published version of the manuscript.
Funding
This research received no external funding.
Data Availability Statement
All of the data are included in the article.
Acknowledgments
The authors are grateful to all colleagues and institutions that contributed to this research and made it possible to publish its results.
Conflicts of Interest
The authors declare no conflicts of interest.
Abbreviations
The following abbreviations are used in this manuscript:
| DWT | Discrete wavelet transform |
| CT | Computed tomography |
| MR | Magnetic resonance |
| CNN | Convolutional neural network |
| DNN | Deep neural network |
| 3D-DWT | Three-dimensional discrete wavelet transform |
References
- Ghaffar, S.; Naqvi, M.A.; Fayyaz, A.; Abid, M.K.; Khayitov, K.N.; Jalil, A.T.; Nouri, M. What is the influence of grape products on liver enzymes? A systematic review and meta-analysis of randomized controlled trials. Complement. Ther. Med. 2022, 69, 102845. [Google Scholar] [CrossRef] [PubMed]
- Hashemzehi, R.; Mahdavi, S.J.S.; Kheirabadi, M.; Kamel, S.R. Detection of brain tumors from MRI images based on deep learning using hybrid model CNN and NADE. Biocybern. Biomed. Eng. 2020, 40, 1225–1232. [Google Scholar] [CrossRef]
- Karayeğen, G. Segmentation on Brain MR Images by Using Deep Learning Network and 3D Modelling. 2021. Available online: https://tez.yok.gov.tr/UlusalTezMerkezi/ (accessed on 10 December 2024).
- Bozdağ, Z.; Talu, M.F. Histopatolojik görüntülerde kanser tespit ve lokasyon yöntemleri. Avrupa Bilim Teknol. Derg. 2021, 23, 608–616. [Google Scholar] [CrossRef]
- Li, C.; Tan, Y.; Chen, W.; Luo, X.; He, Y.; Gao, Y.; Li, F. ANU-Net: Attention-based nested U-Net to exploit full resolution features for medical image segmentation. Comput. Graph. 2020, 90, 11–20. [Google Scholar] [CrossRef]
- Kushnure, D.T.; Talbar, S.N. HFRU-Net: High-level feature fusion and recalibration UNet for automatic liver and tumor segmentation in CT images. Comput. Methods Programs Biomed. 2022, 213, 106501. [Google Scholar] [CrossRef]
- Gruber, N.; Antholzer, S.; Jaschke, W.; Kremser, C.; Haltmeier, M. A joint deep learning approach for automated liver and tumor segmentation. In Proceedings of the 2019 13th International Conference on Sampling Theory and Applications (SampTA), Bordeaux, France, 8–12 July 2019; IEEE: Piscataway, NJ, USA, 2019; pp. 1–5. [Google Scholar]
- Rahman, H.; Bukht, T.F.N.; Imran, A.; Tariq, J.; Tu, S.; Alzahrani, A. A deep learning approach for liver and tumor segmentation in CT images using ResUNet. Bioengineering 2022, 9, 368. [Google Scholar] [CrossRef]
- Mohsen, H.; El-Dahshan, E.S.A.; El-Horbaty, E.S.M.; Salem, A.B.M. Classification using deep learning neural networks for brain tumors. Future Comput. Inform. J. 2018, 3, 68–71. [Google Scholar] [CrossRef]
- Wang, J.; Li, X.; Ma, Z. Multi-Scale Three-Path Network (MSTP-Net): A new architecture for retinal vessel segmentation. Measurement 2025, 250, 117100. [Google Scholar] [CrossRef]
- Yadav, S.P.; Yadav, S. Image fusion using hybrid methods in multimodality medical images. Med. Biol. Eng. Comput. 2020, 58, 669–687. [Google Scholar] [CrossRef]
- Ashwanth, B.; Swamy, K.V. Medical image fusion using transform techniques. In Proceedings of the 2020 5th International Conference on Devices, Circuits and Systems (ICDCS), Coimbatore, India, 5–6 March 2020; IEEE: Piscataway, NJ, USA, 2020. [Google Scholar]
- Song, Y.; Liu, Y.; Lin, Z.; Zhou, J.; Li, D.; Zhou, T.; Leung, M.F. Learning from AI-generated annotations for medical image segmentation. IEEE Trans. Consum. Electron. 2024, 71, 1473–1481. [Google Scholar] [CrossRef]
- Vuola, A.O.; Akram, S.U.; Kannala, J. Mask-RCNN and U-net ensembled for nuclei segmentation. In Proceedings of the 2019 IEEE 16th International Symposium on Biomedical Imaging (ISBI 2019), Venice, Italy, 8–11 April 2019; IEEE: Piscataway, NJ, USA, 2019. [Google Scholar]
- Khanna, A.; Londhe, N.D.; Gupta, S.; Semwal, A. A deep residual U-Net convolutional neural network for automated lung segmentation in computed tomography images. Biocybern. Biomed. Eng. 2020, 40, 1314–1327. [Google Scholar] [CrossRef]
- Schonfeld, E.; Schiele, B.; Khoreva, A. A U-Net based discriminator for generative adversarial networks. In Proceedings of the IEEE/CVF Conference on Computer Vision and Pattern Recognition, Seattle, WA, USA, 13–19 July 2020; IEEE: Piscataway, NJ, USA, 2021. [Google Scholar]
- Zhang, J.; Li, C.; Kosov, S.; Grzegorzek, M.; Shirahama, K.; Jiang, T.; Li, H. LCU-Net: A novel low-cost U-Net for environmental microorganism image segmentation. Pattern Recognit. 2021, 115, 107885. [Google Scholar] [CrossRef]
- Gurrola-Ramos, J.; Dalmau, O.; Alarcón, T.E. A residual dense U-Net neural network for image denoising. IEEE Access 2021, 9, 31742–31754. [Google Scholar] [CrossRef]
- Li, S.; Jiao, J.; Han, Y.; Weissman, T. Demystifying ResNet. arXiv 2016, arXiv:1611.01186. [Google Scholar]
- Targ, S.; Almeida, D.; Lyman, K. ResNet in ResNet: Generalizing residual architectures. arXiv 2016, arXiv:1603.08029. [Google Scholar]
- He, K.; Zhang, X.; Ren, S.; Sun, J. Deep residual learning for image recognition. In Proceedings of the IEEE Conference on Computer Vision and Pattern Recognition, Las Vegas, NV, USA, 27–30 June 2016; IEEE: Piscataway, NJ, USA, 2016; pp. 770–778. [Google Scholar]
- Jian, L.; Yang, X.; Liu, Z.; Jeon, G.; Gao, M.; Chisholm, D. SEDRFuse: A symmetric encoder–decoder with residual block network for infrared and visible image fusion. IEEE Trans. Instrum. Meas. 2020, 70, 5002215. [Google Scholar] [CrossRef]
- Sks-zod. Resized Liver Tumor. 2024. Available online: https://www.kaggle.com/datasets/skszod/resized-liver-tumor (accessed on 10 December 2024).
- Szandała, T. Review and comparison of commonly used activation functions for deep neural networks. In Bio-Inspired Neurocomputing; Springer: Berlin/Heidelberg, Germany, 2021; pp. 203–224. [Google Scholar]
- Kirana, K.C.; Wibawanto, S.; Hidayah, N.; Cahyono, G.P.; Asfani, K. Improved neural network using integral-RELU based prevention activation for face detection. In Proceedings of the 2019 International Conference on Electrical, Electronics and Information Engineering (ICEEIE), Denpasar, Indonesia, 3–4 October 2019; IEEE: Piscataway, NJ, USA, 2019; Volume 6, pp. 260–263. [Google Scholar]
- Wang, S.H.; Muhammad, K.; Hong, J.; Sangaiah, A.K.; Zhang, Y.D. Alcoholism identification via convolutional neural network based on parametric ReLU, dropout, and batch normalization. Neural Comput. Appl. 2020, 32, 665–680. [Google Scholar] [CrossRef]
- Valero-Carreras, D.; Alcaraz, J.; Landete, M. Comparing two SVM models through different metrics based on the confusion matrix. Comput. Oper. Res. 2023, 152, 106131. [Google Scholar] [CrossRef]
- Chicco, D.; Jurman, G. The advantages of the Matthews correlation coefficient (MCC) over F1 score and accuracy in binary classification evaluation. BMC Genom. 2020, 21, 6. [Google Scholar] [CrossRef]
- Anuar, N.; Sultan, A.B.M. Validate conference paper using dice coefficient. Comput. Inform. Sci. 2010, 3, 139. [Google Scholar] [CrossRef][Green Version]
- Jha, S.; Kumar, R.; Priyadarshini, I.; Smarandache, F.; Long, H.V. Neutrosophic image segmentation with dice coefficients. Measurement 2019, 134, 762–772. [Google Scholar] [CrossRef]
- To, M.N.N.; Vu, D.Q.; Turkbey, B.; Choyke, P.L.; Kwak, J.T. Deep dense multi-path neural network for prostate segmentation in magnetic resonance imaging. Int. J. Comput. Assist. Radiol. Surg. 2018, 13, 1687–1696. [Google Scholar] [CrossRef] [PubMed]
- Liang, S.; Tang, F.; Huang, X.; Yang, K.; Zhong, T.; Hu, R.; Zhang, Y. Deep-learning-based detection and segmentation of organs at risk in nasopharyngeal carcinoma computed tomographic images for radiotherapy planning. Eur. Radiol. 2019, 29, 1961–1967. [Google Scholar] [CrossRef]
- Guindon, B.; Zhang, Y. Application of the dice coefficient to accuracy assessment of object-based image classification. Can. J. Remote Sens. 2017, 43, 48–61. [Google Scholar] [CrossRef]
- Rajasree, R.; Columbus, C.C.; Shilaja, C. Multiscale-based multimodal image classification of brain tumor using deep learning method. Neural Comput. Appl. 2021, 33, 5543–5553. [Google Scholar] [CrossRef]
- Li, J.; Liu, K.; Hu, Y.; Zhang, H.; Heidari, A.A.; Chen, H.; Elmannai, H. Eres-UNet++: Liver CT image segmentation based on high-efficiency channel attention and Res-UNet++. Comput. Biol. Med. 2023, 158, 106501. [Google Scholar] [CrossRef]
- Yuan, Y. Hierarchical convolutional-deconvolutional neural networks for automatic liver and tumor segmentation. arXiv 2017, arXiv:1710.04540. [Google Scholar]
- Zhang, Y.; Yang, J.; Liu, Y.; Tian, J.; Wang, S.; Zhong, C.; He, Z. Decoupled pyramid correlation network for liver tumor segmentation from CT images. Med. Phys. 2022, 49, 7207–7221. [Google Scholar] [CrossRef]
- Li, Q.; Song, H.; Zhang, W.; Fan, J.; Ai, D.; Lin, Y.; Yang, J. CC-DenseUNet: Densely connected U-Net with criss-cross attention for liver and tumor segmentation in CT volumes. In Proceedings of the 2021 IEEE International Conference on Bioinformatics and Biomedicine (BIBM), Houston, TX, USA, 9–12 December 2021; IEEE: Piscataway, NJ, USA, 2021; pp. 966–971. [Google Scholar]
- Özcan, F.; Uçan, O.N.; Karaçam, S.; Tunçman, D. Fully automatic liver and tumor segmentation from CT image using an AIM-Unet. Bioengineering 2023, 10, 215. [Google Scholar] [CrossRef]
Disclaimer/Publisher’s Note: The statements, opinions and data contained in all publications are solely those of the individual author(s) and contributor(s) and not of MDPI and/or the editor(s). MDPI and/or the editor(s) disclaim responsibility for any injury to people or property resulting from any ideas, methods, instructions or products referred to in the content. |
© 2025 by the authors. Licensee MDPI, Basel, Switzerland. This article is an open access article distributed under the terms and conditions of the Creative Commons Attribution (CC BY) license (https://creativecommons.org/licenses/by/4.0/).