Abstract
The intelligent connected vehicle (ICV) industry encounters substantial challenges related to technology, policies, and funding. Its development relies not only on the close collaboration and technological innovation between carmakers and technology companies but also on the support of government’s incentive policies. Therefore, this paper establishes a tripartite evolutionary game model that involves governments, carmakers, and technology companies to investigate the stability equilibrium strategy of multi-party participation in promoting the development of the ICV industry. In addition, by analyzing relevant regulations and company annual reports, this paper conducts a simulation analysis to examine how government incentive policies and benefit distribution mechanisms impact the evolutionary trajectory. Several insightful and practical conclusions are drawn. First, in the early stages of industrial development, the government’s infrastructure investment could promote the cross-border innovation cooperation between carmakers and technology companies, thereby accelerating the advancement of ICVs; however, the long-term impact of the sustained investment remains limited. Second, the incremental government subsidies for carmakers and technology companies within limits could increase the probability of them choosing to cooperate and innovate with each other. Still, the excessive subsidies could result in unstable industry growth. Finally, the increase in the benefit distribution ratio for carmakers with professional technology in automotive technology and vehicle design has a positive effect on the development of the ICV industry. This paper expands the research scope of ICVs and provides theoretical insights for promoting the sustainable development of the ICV industry from policy and market viewpoints.
1. Introduction
The electrification and automotive revolution in transportation are crucial for achieving carbon neutrality [1]. As the main direction of the automotive industry towards digital, green, and low-carbon development, intelligent connected vehicles (ICVs) have promoted profound changes in the form of the automotive industry, transportation mode, energy consumption structure, and social operation mode. ICVs, which refer to the organic combination of the internet of vehicles and intelligent vehicles, are a new generation of vehicles that carry on-board sensors, controllers, actuators, and other advanced equipment [2]. It integrates modern communication and network technologies to enable intelligent information exchange and sharing among cars, people, other vehicles, and roads [3]. At present, the development of ICVs is in a critical and key period. According to the data of Statista, it is estimated that 96% of new cars worldwide will be ICVs by 2030 [4]. From 2019 to 2024, the scale of the ICV industry in China has shown a continuous upward trend. In 2022, the scale of the ICV industry increased to CNY 125.9 billion, at a compound annual growth rate of 25.56%. It is estimated that the scale of the ICV industry will reach CNY 215.2 billion in 2024, as shown in Figure 1 [5].
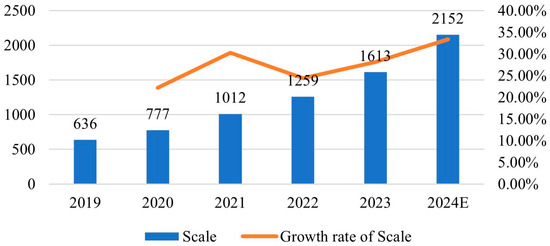
Figure 1.
The scale of China’s ICV industry from 2019 to 2024 (units: hundred million yuan).
ICVs do not only include the development of the automotive technology but also the deep integration of the traditional industries, digital economy, and intelligent economy. The technical elements of ICVs could be divided into about 50% of network technology and information technology (such as the new generation of mobile communication technology, Internet of Things, cloud computing, big data, etc.), about 30% of artificial intelligence technology, and about 20% of automotive manufacturing technology [6]. Hence, due to specialized divisions among different companies, some carmakers with automotive production qualifications have chosen to partner with technology companies in Internet services, artificial intelligence, cloud computing, and other areas [7], such as SAIC Motor and Alibaba, Chana Automobile and Baidu, Dongfeng Motor and Tencent, and BAIC Group and Huawei, as shown in Table 1. Carmakers lack familiarity with the intellectualization and interconnection of automobiles, while technology companies lack expertise in the main vehicle motorization technologies and the automotive supply chain [8]. The cross-border innovation cooperation between carmakers and technology companies integrates the technological expertise of various industries and jointly promotes the development of the ICV industry [9].

Table 1.
The cross-border innovation cooperation between carmakers and technology companies.
However, there is still a lack of extensive and in-depth cooperation between carmakers and technology companies in China [18]. Most carmakers and technology companies are still adopting a wait-and-see approach toward the production of ICVs. Some have experienced terminated partnerships. For example, Guangzhou Automobile Corporation suspended deep cooperation with Huawei, and both parties only maintained a procurement relationship. Similarly, BYD abandoned the agreement to equip its electric vehicles with Baidu’s autonomous driving technology and will focus on developing in-house intelligent car software instead. Hence, governments at various levels have introduced policy measures and financial incentives for the cooperative development of carmakers and technology companies [19]. For example, Pudong New Area has constructed the first roads open to test self-driving vehicles in the downtown areas of a megacity in China—the Jinqiao Intelligent Connected Vehicle Testing Demonstration Zone, with road sections available for 29.3 km. Additionally, Pudong New Area has established the Fund for the Development of Science and Technology to support the joint technological development of carmakers and technology companies, which provides a maximum funding limit of CNY 2 million for a single project. Except for the infrastructure investment and the government subsidies, the reasonable benefit distribution serves as another primary motivation for the cooperative development of carmakers and technology companies. The reasonable benefit distribution could not only promote the operation process of enterprise technological innovation cooperation but also stimulate enthusiasm and creativity among enterprises, thereby improving overall performance [20]. For example, Baidu and Geely established Jidu Auto, accounting for 55% and 45% of the shares, respectively [21]. By cross-shareholding, they build a closer cooperative relationship and promote the mass production and landing of automotive robots.
It is thus clear that the development of the ICV industry is a long-term systematic project, which requires the joint participation of multiple entities. Therefore, this paper proposes an analytical framework that describes the dynamic interaction among governments, carmakers, and technology companies, where governments have an either–or strategy (incentive; non-incentive) and so do technology companies and carmakers (cooperation or non-cooperation with each other). The analysis tool of evolutionary game theory is used to construct a game model among governments, carmakers, and technology companies, explore the evolution mechanism among them, and empirically examine the impact of the incentive policy and the benefit distribution on the evolution of the system. The research contributes to the development of new ideas and methods for governments, carmakers, and technology companies in their promotion and development of China’s ICV industry.
In this paper, evolutionary game theory provides a new perspective for analyzing and understanding the development of the ICV industry, especially its unique advantages in dealing with the replicator dynamics and evolutionary stability strategy (ESS). It reveals micro-level cooperation dynamics between carmakers and technology companies, as well as the role of government incentive policy, by simulating the interaction between participants and the dynamic process of the game. These aspects not only enhance the research content of ICV but also broaden and deepen the theoretical exploration of cooperative games among innovative subjects.
This paper answers the following key questions.
- (1)
- Does high government investment in infrastructure contribute to the long-term cooperative development of ICVs?
- (2)
- How does the amount of government subsidies affect the cross-border innovation cooperation between carmakers and technology companies?
- (3)
- How do carmakers and technology companies decide on the profit distribution to achieve the best combination of strategies, with the government’s industrial incentive policies? Who holds the dominant position during the cooperation process?
The remainder of the paper is organized as follows. Section 2 reviews the related literature studies. Section 3 introduces the evolutionary game theory and its methods. Section 4 describes the issue with its corresponding assumption and builds the evolutionary game model. Section 5 uses the dynamic evolution and simulation to analyze the game among governments, carmakers, and technology companies. Section 6 discusses the sensitivity analysis of the selected key parameters in detail. Section 7 concludes the study and highlights related managerial implications.
2. Related Studies
With the rapid development and wide application of mobile Internet, big data, cloud computing, and other new-generation information technologies, the automotive industry is inevitably developing toward intelligence and networking. ICVs have become one of the hot spots in academic research. Currently, academic studies on ICVs primarily focus on the R&D (Research and Development) and application of key technologies in the ICV industry and the development status of the ICV industry. In terms of R&D, and the application of key technologies, researchers have primarily concentrated on control and adjustment systems, including an intelligent automatic control system [22,23], remote monitoring system [24], and seatbelt intelligent adjustment system [25]. Safety-critical tasks that autonomous vehicles must perform include motion planning in a dynamic environment shared with other vehicles and pedestrians and their robust execution through feedback control [26]. Therefore, as an important part of ICVs, vehicle motion planning and control have gained the researchers’ attention. Motion planning consists of path planning (space) and trajectory planning (time). The sequence points or curves connecting the starting position and the ending position are called paths. The strategy of forming paths is called path planning. Silva et al. [27] pointed out that intelligent vehicles need an effective method to calculate the feasible path connecting their current location to the target point and proposed a road network model based on an urban scenario. Yanumula et al. [28] developed a path planning algorithm for ICVs driving on a lane-free highway to achieve effective vehicle advancement and avoid collisions with other vehicles. In addition, a trajectory is a sequence of states visited by the vehicle, parameterized by time and velocity (probably) [29]. Trajectory planning is to add time series information to path planning, which is to plan the speed and acceleration of the vehicle when performing tasks. As the most critical part of intelligent vehicles development, trajectory planning is of great significance for the realization of automatic driving [30]. There are various methods for trajectory generation in trajectory planning, including the curve fitting algorithm [31], the dynamic programming algorithm [32], the artificial potential field algorithm [33], the Gauss pseudo-spectral method [34], etc. Meanwhile, some scholars discussed the trajectory planning and optimization methods of intelligent vehicles from the perspectives of emergency lane-changing [30] and autonomous parking [35].
In terms of the development status of the ICV industry, with the deep integration of automotive information and communication, artificial intelligence, the Internet, and other industries, the ICV industry has entered a new stage of rapid technological evolution and accelerated industrial layout. According to the research report of the ITF and OECD, the widespread use of shared and autonomous vehicles could decrease carbon dioxide emissions by 73% and reduce congestion by 24% in 2050 [36]. Major countries and regions in the world are accelerating the development of the ICV industry since it is an important strategic direction of national development [37]. The European Union initiated a strategy for Cooperative Intelligent Transport Systems (C-ITS) in 2016 to enhance cooperation, connectivity, and automated mobility [38], with plans for the large-scale deployment of automated mobility by 2030 [39]. In 2000, the United States launched the ITS National Intelligent Transportation Systems Program Plan to advance intelligent infrastructure and vehicles [40]. In 2024, the United States introduced a significant national deployment plan for V2X (vehicle-to-everything) technology to accelerate its commercialization and implementation [41]. Scholars have begun discussing the development of autonomous vehicle policies across various countries [42], data governance in connected vehicles [43], and the acceptance of autonomous vehicles among different stakeholders [44]. Focused on the development history and current situation of the ICV industry, many scholars analyze the problems faced by the development of the ICV industry, and draw the upgrading path and key aspects of the ICV industry in China [45,46]. From the perspective of value chains, Kuang et al. [47] analyzed the profound impact and changes that the upgrade of the ICV industry would bring to different links of the automotive industry value chain, and emphasized the importance of IT enterprises strengthening cooperation with traditional automotive enterprises. Tang et al. [48] also pointed out that accelerating the integration and development of the automotive industry and information technology is the key to promoting the rapid development and commercialization of ICVs in China, which could give full play to the scale advantages of the automotive industry and the innovation advantages of the Internet industry in China. A comprehensive analysis of existing research shows that although scholars at home and abroad have carried out many studies on the ICV industry, most of them focus on technology and application, and less on the changes in the ecosystem of the ICV industry when intelligent technology and connected technology are organically combined, especially considering the cross-border innovation cooperation between carmakers and technology companies. The cross-border innovation cooperation between carmakers and technology companies is generally more diverse and inclusive than traditional partnerships. It involves ongoing interactions between various explicit and implicit supply and demand dynamics, as well as the continuous absorption and spillover of knowledge [49].
It is possible to analyze the dynamic process of the cross-border innovation cooperation in the ICV industry more thoroughly and realistically by developing a model that could simultaneously consider the interests of various stakeholders. The evolutionary game model is an invaluable tool for studying these issues; it has been used to analyze the cross-border innovation cooperation among different entities and describe the dynamic evolution of their behavioral strategies. Hao et al. [50] established a tripartite evolutionary game model to analyze the evolutionary mechanism of the cross-border cooperation among enterprises, university-research institutes, and supplementary innovation organizations in the recycled resources industry. Ning et al. [51] adopted a method based on cooperative and evolutionary game models, analyzing the dynamic evolution process of renewable energy power plants, renewable energy selling enterprises, and government, and obtaining the win–win conditions for the three parties in the digital transformation of renewable energy enterprises. Cao et al. [52] analyzed the decisions of manufacturers and retailers to enter the remanufacturing industry based on the evolutionary game theory. They proposed that the government policies and incentives play an important role in promoting industrial development. Tang et al. [48] used an evolutionary game model to analyze the cross-border collaborative innovation development mode of traditional automotive enterprises and technology platform providers. However, they ignored the key role of governments as an influential external motive force. Governments have accelerated the R&D of key core technologies through policy tools such as subsidies and tax incentives, which are conducive to the rapid expansion of the ICV industry [53].
In conclusion, although existing studies have laid a good foundation and reference for this paper, there are still some shortcomings that need to be addressed. First, most studies mainly focus on the technological development, the macro-policies, and the business applications of the ICV industry. Exploring the driving mechanism of the cross-border innovation cooperation in the ICV industry from a micro-perspective becomes a new research focal point. Second, although some scholars have analyzed the cross-border innovation cooperation between traditional automobile enterprises and technology platform providers, they have not clarified the support of governments in the ICV industry. Third, the behavior of multiple entities in the cross-border innovation cooperation has been analyzed in the literature. However, few studies have explored the positioning of the role of multiple entities in cooperation.
In order to tackle the aforementioned issues, this paper categorizes the main stakeholders as governments, carmakers, and technology companies. It examines the selection strategies of the main stakeholders and develops an evolutionary game model. This study utilizes evolutionary game analysis and simulation to investigate how the infrastructure investment, the government subsidies, and the benefit distribution influence the strategic decisions of governments, carmakers, and technology companies in various scenarios. Different from previous studies, the highlights in this paper are as follows: (1) based on the bounded rationality, this paper constructs a tripartite evolutionary game model to analyze the strategic choices of participants in the cross-border innovation cooperation in the ICV industry and uses a combination of empirical research and mathematical derivation; (2) this paper examines the support of governments, focusing on the infrastructure investment and the government subsidies, with specific policy implications; (3) in the context of simulation, this paper examines the benefit distribution from collaboration strategies between carmakers and technology companies. The practical application of the research findings in actual situations is discussed in this section.
3. Methodology
Evolutionary game theory was initially generated in biology, which focuses on how individuals with bounded rationality can continuously optimize their payoffs by adaptive learning in the process of a repeated game [54,55]. The two central concepts in evolutionary game theory are the replicator dynamic and ESS. The replicator dynamic dynamically describes and analyzes the continuous optimization process of individual strategies with bounded rationality [56]. Equation (1) expresses the general form of the replicator dynamic.
where represents the strategy set of the population in the evolutionary game, represents the proportion of participants who choose at time , represents the expected utility of participants when they choose in the game, and represents the average expected utility of the entire population.
Meanwhile, ESS refers to the process in which individuals continuously adjust their strategies to achieve greater interests and achieve dynamic equilibrium states among them. A successful strategy (with an ESS) must be effective against competitors and successful in defending itself [57]. In evolutionary games, each individual interacts with others based on their strategies to achieve certain benefits. These strategies can represent solutions in the Nash equilibrium or other concepts from game theory, as well as ESSs that have emerged from stochastic processes, genetic algorithms, or learning mechanisms.
In evolutionary game theory, the stability of a system is analyzed by using the Jacobian matrix [57]. According to Lyapunov’s stability theory, if all the eigenvalues of the Jacobian matrix are negative, the equilibrium point (EP) of the system is classified as an ESS [58]. Furthermore, the research by Ritzberger et al. [59] has demonstrated that the ESS in multi-agent evolutionary games can only be a pure strategy. This finding provides a crucial theoretical foundation for understanding the dynamic processes and outcomes of multi-agent games discussed in this paper.
4. Evolutionary Game Model
4.1. Market Structure
As a cross-technology, cross-industry, and multi-domain emerging automotive system, the network effect and value of the ICV industry are inseparable from the participation of all parties. The development of the ICV industry needs the joint efforts of governments, carmakers, and technology companies. Carmakers and technology companies provide an internal driving force for promoting industrial development, while governments at various levels provide an external motive force for boosting industrial development. The relationships among governments, technology companies, and carmakers are shown in Figure 2.
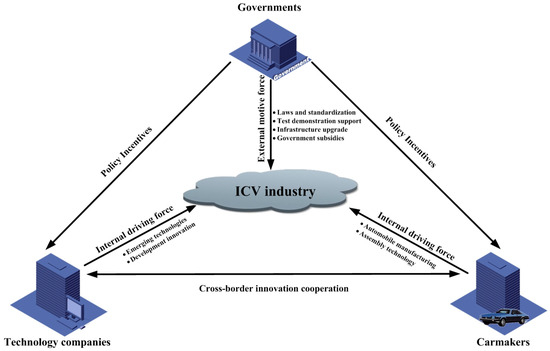
Figure 2.
Internal logic of the three entities in the ICV industry.
As the external motive force of the ICV industry, governments could provide R&D subsidies and establish infrastructure to effectively overcome the application limitations of key technologies and facilitate the commercialization process of ICVs. However, governments may also encounter significant financial burdens in the promotion process. As the internal driving force of the ICV industry, carmakers could benefit from cooperating with technology companies to take advantage of their expertise in areas such as the Internet of Things and artificial intelligence. This cooperation could enhance large-scale data collection, perception analysis, intelligent decision-making, and other technologies needed for ICVs, maximizing the value of automotive networking and intelligence. Similarly, technology companies could benefit from cooperating with carmakers to take advantage of their expertise in automotive hardware, development processes, quality assurance systems, and other aspects. However, both carmakers and technology companies would consider cooperation if it brought potential benefits to them. Complex interactions between them form a mutual contact and mutual checks and balances.
Therefore, this paper mainly takes governments, carmakers, and technology companies as the research object of game analysis, without focusing on the behavior strategies of other auxiliary subjects (i.e., financial institutions, traditional component enterprises, etc.). Using the evolutionary game theory, this paper builds the evolutionary game model among governments, carmakers, and technology companies, studies the influence of behavior interaction among all stakeholders, and analyzes the evolutionary stability and influencing factors of the system under different situations.
4.2. Model Assumptions
In the evolutionary game, governments, carmakers, and technology companies are three different entities that interact with each other. As shown in Figure 3, governments take two behavior strategies, incentive and non-incentive (I and NI), while carmakers and technology companies also take two behavior strategies: cooperation and non-cooperation (C and NC). Therefore, the strategic combinations of governments, carmakers, and technology companies could be categorized into eight types, namely (I, C, C), (I, C, NC), (I, NC, C), (I, NC, NC), (NI, C, C), (NI, C, NC), (NI, NC, C) and (NI, NC, NC). In the following sections, this paper uses notations (I), (NI), (C), and (NC) to represent the strategies adopted by governments, carmakers, and technology companies for simplicity.
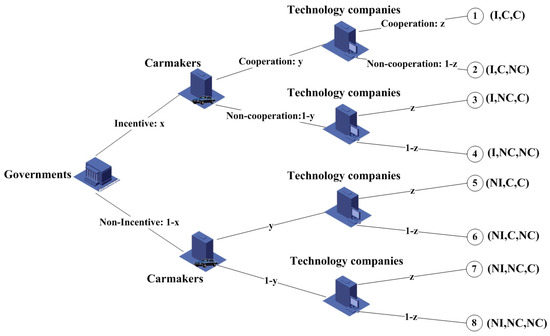
Figure 3.
A decision tree demonstrating the three entities’ strategies.
Based on the above background, the following assumptions are proposed.
Assumption 1.
Governments, carmakers, and technology companies participating in the game are all bounded rationality, that is, they constantly adjust their strategy selection according to their own benefits in the game process [55]. Governments, carmakers, and technology companies choose their behaviors with a certain probability. In the initial stage of the tripartite game, let represent the proportion of governments with the choice of (I), and represent the proportion of governments with the choice of (NI). In addition, denote and as the proportion of carmakers with the choice of (C) or (NC), respectively, and and as the proportion of technology companies with the choice of (C) or (NC), respectively.
Assumption 2.
If carmakers adopt (NC), they obtain the basic benefit , that is, the basic benefit from daily operation. If carmakers adopt (C), they also obtain the cooperation benefit , where represents the total cooperation benefit, and represents the benefit distribution ratio (). They also need to invest in the total cost to cooperate with technology companies to develop ICVs. This includes R&D expenses, operating costs, depreciation, amortization, etc. Let denote the R&D expenses of carmakers, where represents the proportion of the R&D expense to the total cost (). The cross-border innovation cooperation benefits carmakers and technology companies by increasing profits, enhancing competitiveness, and promoting technological development. However, it also brings challenges, such as a loss of competitive advantage [60] and data breaches [61]. Therefore, let denote the cooperation risk faced by carmakers, where represents the probability of the cooperation risk (), and represents the maximum cooperation risk. Similarly, technology companies obtain the cooperation benefit and the basic benefit . They also need to invest in the cost to cooperate with carmakers and face the cooperation risk , where represents the probability of the cooperation risk ), and represents the maximum cooperation risk. Denote as the R&D expenses of technology companies, where represents the proportion of the R&D expense to the total cost ().
Assumption 3.
Due to the externalities of R&D expenditures [62], the participation of carmakers in the cross-border innovation cooperation impacts not only their profits but also results in the knowledge spillovers that benefit other entities, whether they are part of the cooperation. Much of the same is true for technology companies. The benefits generated by each other’s knowledge spillover are and , where and represent the knowledge conversion rate (, ). In this paper, assuming that both carmakers and technology companies adopt (C), there are and .
Assumption 4.
For governments, in order to promote the green low-carbon transformation of automobile industry (S), they provide plow funds into laws and standardization, test demonstration support, and relevant infrastructure upgrades for the ICV industry and give a certain proportion of subsidies to carmakers and technology companies adopting (C). It is assumed that the infrastructure investment for the ICV industry is T, and the subsidies for carmakers and technology companies are and , where represents the subsidy intensity. Under the hypothesis of this paper, the government subsidies are related to the R&D expenses invested by carmakers (or technology companies). To a certain extent, the higher the R&D expenses invested by carmakers (or technology), the higher the government subsidies they obtain. It is similar to the extra tax deduction on R&D expenses that governments adopt for enterprises in China.
Meanwhile, governments could directly obtain the social benefits from promoting the development of the ICV industry. The development and application of ICVs not only help reduce dependence on fossil fuels and decrease greenhouse gas emissions but also promote technological innovation in the automotive industry [63], which could have a positive impact on the environment and national security. In addition, carmakers and technology companies investing in the R&D of ICVs provide a significant economic benefit for governments. For example, the cross-border innovation cooperation between carmakers and technology companies could drive the development of related industrial chains, create employment opportunities, and promote economic growth. When governments do not implement subsidy policies (NI), their benefits are zero.
4.3. Model Framework
According to Figure 3, and the aforementioned assumptions, a payoff matrix for all entities under different strategies is shown in Table 2.
Table 2.
Payoff matrix for all entities.
Therefore, the replicator dynamic equations of behavior strategies of governments, carmakers, and technology companies are constructed as follows.
The expected utility of governments is computed by Equations (2) or (3), when they adopt (I) or (NI), respectively. Thus, the average expected utility is aggregated in Equation (4) by the strategy choosing ratios. Then, the replicator dynamic equation is formulated in Equation (5) for governments.
Similarly, the expected utility of carmakers is computed by Equations (6) or (7), when they adopt (C) or (NC), respectively. The average expected utility is in Equation (8). Then, the replicator dynamic equation is given in Equation (9) for carmakers.
And the expected utility of technology companies is computed by Equations (10) or (11), when they adopt (C) or (NC), respectively. The average expected utility is in Equation (12). Then, the replicator dynamic equation is given in Equation (13) for technology companies.
The evolutionary game model combines Equations (4), (8), and (12), which forms a dynamic system.
5. Model Analysis
This paper analyzes the evolutionary game model on two levels. First, the EPs of the model are analyzed to reveal the evolutionary trends of the system in Section 5.1. Second, in Section 5.2, it is further investigated whether these EPs are ESSs when considering various constraints.
5.1. Equilibrium Points
The EPs of the system reveal the existence conditions of possible ESSs. Set Equations (5), (9), and (13) to 0 and solve the equations; three solutions are obtained, as Equations (14)–(16).
(1) When , and take the value of either 0 or 1, it implies , and , so the dynamic system is always stable.
(2) According to Equation (5), if and , when and , it implies and . And if , is further obtained to be zero. So is an EP. When and , it implies and . And if , and is an EP.
(3) According to Equation (9), if and , when and , it implies and . And if , and is an EP. When and , it implies and . And if , and is an EP. When and , and are derived. And if , and is an EP.
(4) According to Equation (13), if and , when and , and are obtained. And if , and is an EP.
Therefore, , , , , , , , , , , , , , and are EPs.
According to the research of Ritzberger et al., only the pure strategies need to be discussed in this paper.
5.2. ESS Analysis
From the above three dynamic replication equations, the Jacobian matrix can be obtained as shown in Equation (17).
where ,
- ,
- ,
- ,
- ,
- ,
- ,
- , and
- .
Then, the Lyapunov stability theory is used to examine the stability of the system. The pure strategies are brought into the Jacobian matrix of the system, and the eigenvalues of the Jacobian matrix are shown in Table 3. Due to the presence of positive values in the eigenvalues of corresponding to and , they will not be analyzed in the following scenarios.
Table 3.
The eigenvalues of the Jacobian matrix.
This paper analyzes the stability of the system in the following three cases.
Case 1.
When , that is, the social benefits that governments obtain are less than the infrastructure investment for the ICV industry, the ESSs of the system exist in and . It means that no matter the strategies chosen by carmakers or technology companies, governments’ strategies remain consistently focused on non-incentive. For carmakers and technology companies, if , the system may be stable at . This equilibrium indicates that without the government’s industrial incentive policies, if the total benefits from cooperation between carmakers and technology companies exceed those from non-cooperation, then the two will choose to engage in cross-border innovation cooperation.
Case 2.
When , that is, the social benefits exceed the infrastructure investment but are less than the combined total of the infrastructure investment and the government subsidies, the system’s ESSs exist in and . This indicates that any strategy adopted by governments at this time would not influence the strategic choices of carmakers and technology companies. If and , meaning that the government subsidies for carmakers and technology companies are less than the total costs of cooperation and innovation, the system may be stable at .
Case 3.
When , that is, the social benefits exceed the combined total of the infrastructure investment and the government subsidies, the system’s ESSs exist in , , and . This shows that, regardless of carmakers or technology companies choosing their strategies, governments’ strategies remain consistently focused on incentive. If , is the only ESS and corresponds to the strategy combination of (I, C, C). This indicates that with the government’s industrial incentive policies, if the total benefits from cooperation between carmakers and technology companies exceed those from non-cooperation, then the two will choose to engage in cross-border innovation cooperation.
5.3. Empirical Analysis and Simulation
In order to further validate and test the promoted models, an empirical analysis is conducted using MATLAB R2023b, with parameters assigned based on open data related to announcements from relevant regulations, annual reports of companies, and similar studies. Additionally, based on the benchmark of empirical analysis, the sensitivity analysis of different parameters could provide deeper management implications for the research problem, which is performed in Section 6.
As a Chinese AI giant with a strong Internet foundation, Baidu fully plays to its technological advantages, cooperates with many carmakers, and explores innovation in intelligent networking, automatic driving, intelligent transportation systems, and cloud computing. As mentioned in the Introduction, in 2021, Baidu and Geely established a joint venture called Jidu Auto, with a registered capital of CNY 2 billion, to focus on the development of ICVs. Baidu and Geely hold 55% and 45% of the shares, respectively. Jidu Auto officially released its first-ever robocar, ROBO-01 Lunar Edition (Level-4 autonomous driving technology), on 27 October 2022. Coming with a limited availability of 2000 units, the vehicle is priced at CNY 399,800 [64]. Therefore, this paper sets the basic parameter values as follows: , , and in CNY 100 million, and . Jiading District, where Jidu Auto is located, is the first national-level pilot demonstration zone for ICVs in Shanghai. In July 2022, Jiading District invested CNY 1 billion to promote the coordinated development of smart city infrastructure and intelligent connected vehicles. In May 2024, it attracted 17 new intelligent connected vehicle projects with a total investment of CNY 3.24 billion [65]. Thus, the initial values of and are assumed to be 30 and 10 in CNY 100 million, respectively.
“The Innovative Development Strategy for Intelligent Vehicles” states that enterprises engaged in the research, development, and manufacturing of intelligent vehicles will benefit from preferred pre-tax additional deductions for R&D expenses [66]. From 2021 to 2022, technology enterprises enjoyed a 175% super deduction for eligible R&D expenses, while manufacturing enterprises enjoyed a 200% super deduction for eligible R&D expenses [67,68]. Thus, the initial values of and are all set as 2 and 1.75, respectively. According to Tang et al. [48], this paper sets the remaining parameters and corresponding initial values as shown in Table 4.
Table 4.
Initial values of the key parameters.
The effectiveness of the stability analysis for the system evolution is verified by substituting the initial values into the model for simulation. This paper conducts an empirical test over a two-year span, with the time unit set at one month. The results are shown in Figure 4. It shows that under the parameter settings, the system eventually evolves to , which is consistent with the conclusion of case 3. The simulation analysis verifies the findings in the stability analysis of Section 5.2, which manifests the validity of the model. This model holds significant practical guidance for governments, carmakers, and technology companies.
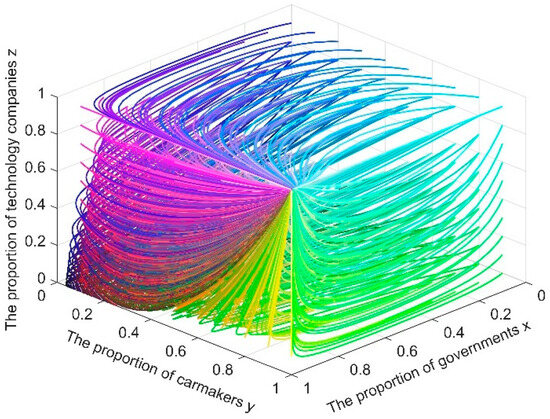
Figure 4.
Simulation results of the evolutionary path over a two-year span.
In April 2018, the Ministry of Industry and Information Technology, the Ministry of Public Security, and the Ministry of Transport jointly released “Specification for Road Test Management of Intelligent Connected Vehicles (for Trial Implementation)”, which has played a positive guiding role in China. In total, 27 provinces (cities) in China have issued management rules and built 16 intelligent connected vehicle test demonstration areas [69]. It can be seen that governments have invested a lot of policy, human, and material resources in the early stage of the ICV industry. Thus, let the initial value of be 0.59. According to a 2022 report from market research firm iResearch [70], the penetration of the Advanced Driving Assistance System (ADAS) in new vehicles in China was about 32%, with Level-1 and Level-2 accounting for approximately 20% and 12%, respectively, and Level-3 and above accounting for 0%. Thus, let the initial value of and be 0.32. In order to provide a more targeted decision-making basis for the direction and effort strength of governments, carmakers, and technology companies to develop the ICV industry, this paper takes (0.59, 0.32, 0.32) as the initial value to analyze the sensitivity of some specific parameters, and the values of other parameters are consistent with the empirical analysis in Section 6.
6. Sensitivity Analysis and Discussion
In this section, the main focus is on how to evaluate the impact of the government’s infrastructure investment, the subsidy intensity, and the benefit distribution ratio on the system evolution. This paper takes the empirical analysis as the benchmark, and when analyzing the sensitivity of a parameter, the values of other parameters are consistent with the empirical analysis. It could provide a more targeted decision-making basis for the effort direction and effort strength of governments, carmakers, and technology companies to develop the ICV industry.
6.1. Infrastructure Investment
To study the impact of the government’s infrastructure investment on the system evolution, the value of is changed over the interval in incremental steps of two. The evolution of the system is depicted in Figure 5 and Figure 6. In Figure 5, it can be observed that an individual change in the infrastructure investment has a direct effect on the evolution of the system. As the value of increases, the system evolves to in the beginning. Meanwhile, according to the analysis of simulation data in Figure 6, it can be seen that the evolution speeds in the four sets of values are not significantly different in the beginning. When the value of is 12, the system gradually evolves from to . It suggests that as the infrastructure investment increases, the willingness of governments to provide support diminishes. However, this increment in infrastructure investment could stimulate the cross-border innovation cooperation between carmakers and technology companies, particularly during the early stages of development. The development of ICVs requires substantial investment in R&D, as well as in infrastructure construction. However, this investment cannot be borne solely by carmakers and technology companies. Additionally, the market for ICVs is not fully developed, leading to limited returns on investment, making it difficult to recoup the investment completely. This situation could dampen the enthusiasm of both carmakers and technology companies to collaborate and participate in this field. As a result, many infrastructure projects have begun across the country alongside the emergence of the ICV industry. By the end of 2023, more than 22,000 km of testing roads for ICVs had been opened nationwide, with a total road-testing mileage of over 88 million kilometers [71]. In 2024, China identified 20 cities (consortiums) as participants in a pilot program for the application of “vehicle–road–cloud” integration for ICVs [72]. For example, Beijing has approved a planned project for vehicle–road–cloud infrastructure construction with an investment of CNY 9.94 billion, which will upgrade 6050 road intersections within 2324 square kilometers of the city [73]. The United States has also invested nearly USD 60 million to promote the deployment of V2X technology, targeting 100% coverage on highways and 85% coverage at intersections in 75 metro areas by 2036 [41]. Unlike the support provided by China and the United States, which primarily focuses on key technologies and infrastructure construction for ICVs, the European Union emphasizes research innovation and clean solutions. From 2025 to 2026, the European Union plans to allocate EUR 570 million to develop the charging and hydrogen refueling infrastructure [74].
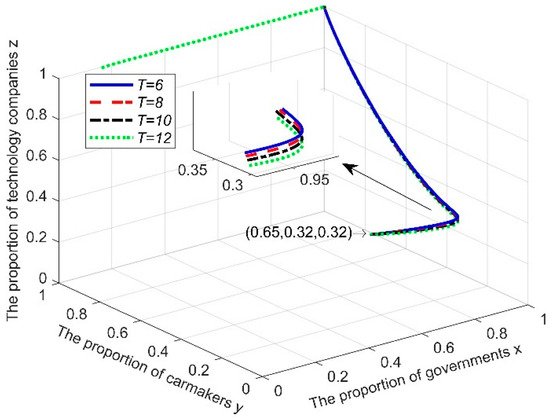
Figure 5.
Simulation results of the evolutionary path when changes.
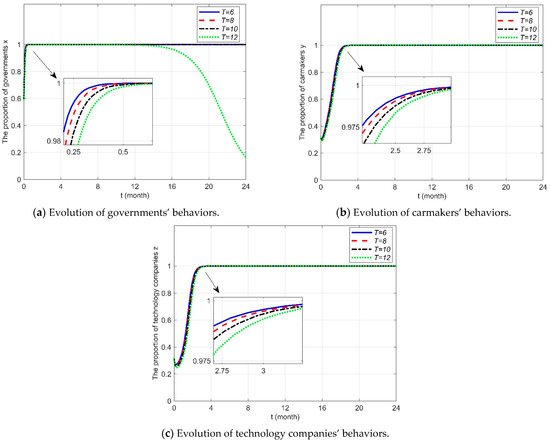
Figure 6.
Players’ evolutionary game behaviors with different infrastructure construction costs.
To further verify the impact of the government’s infrastructure investment on long-term development, the value of is set as 13. The simulation results in improved situations are as shown in Figure 7. Based on Figure 7a, it is evident that when , the trajectory of the replicator dynamic system forms a circle over time, and there is no asymptotic ESS. Figure 7b shows that the proportions of the three entities constantly change, indicating that the population scales of governments, carmakers, and technology companies are unstable. When the value of increases from 13 to 15, another trajectory of the replicator dynamic system is shown in Figure 8. In Figure 8a, it is evident that the system initially evolves to but ultimately evolves to . In Figure 8b, it is also observed that compared to the case with (Figure 7b), the fluctuating amplitudes of the proportion of carmakers and the proportion of technology companies lead to a gradual decline and then tend toward non-cooperation. However, the opposite is true for governments, which ultimately tend toward incentive. Therefore, as the government’s infrastructure investment continues to increase, two situations may arise: either the development of the ICV industry will be unstable or governments will be in a rather helpless state. It also adds to the proof that higher government infrastructure investment may not necessarily benefit the long-term development of the ICV industry. In this situation, the key challenge is to mobilize the enthusiasm of carmakers and technology companies to participate. By engaging social capital in infrastructure construction, it not only relieves the financial pressure on governments but also encourages creativity and enthusiasm among all market participants. Beijing E-Town, in collaboration with the BAIC Group and BAIC New Energy, has established the National New Energy Vehicle Technology Innovation Center. This center focuses on the R&D of key technologies for intelligent vehicles. With an investment of over CNY 2 billion in R&D, the center has also leveraged more than CNY 7 billion in social funding [75]. It has established the first domestic automotive-grade chip testing and certification center and launched the first domestic automotive design software toolchain simulation cloud platform. These initiatives provide strong foundational support for the ICV industry.
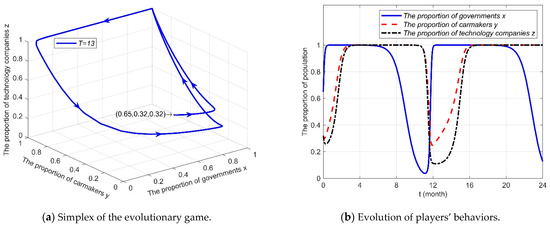
Figure 7.
Simulation results of the evolutionary populations and paths when .
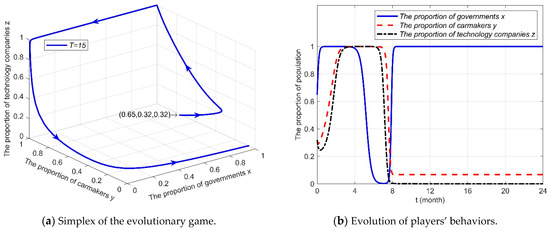
Figure 8.
Simulation results of the evolutionary populations and paths when .
In addition to considering the government’s infrastructure investment, how to mobilize the cross-border innovation cooperation between carmakers and technology companies plays a crucial role in promoting the development of the ICV industry. Therefore, Section 6.2 and Section 6.3 explore the impact of the government subsidies and the benefit distribution ratio on the cross-border innovation cooperation between carmakers and technology companies.
6.2. Subsidy Intensity
To study the impacts of the government subsidies on the system evolution, the value of is determined based on China’s R&D expense deduction policy while keeping other parameters constant. The specific values are shown in Table 5. The evolution of the system is depicted in Figure 9 and Figure 10.
Table 5.
The values of .
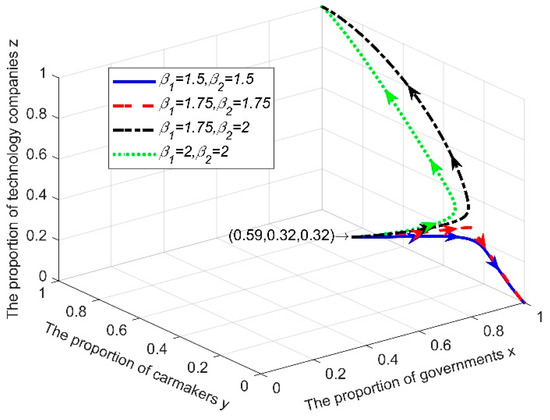
Figure 9.
Simulation results of the evolutionary path when changes.
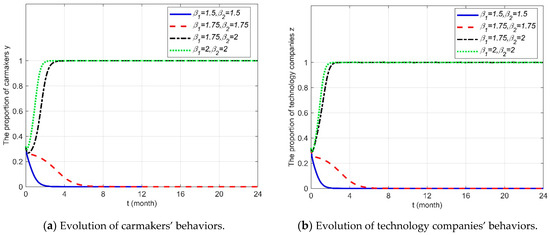
Figure 10.
Players’ evolutionary game behaviors with different subsidy intensities.
In Figure 9, it is found that when the value of the subsidy intensity is between 1.5 and 1.75, in addition to governments choosing to provide incentive policies, carmakers and technology companies will ultimately choose not to engage in cross-border innovation cooperation with each other. At this point, the system would eventually evolve to . When the subsidy intensity to carmakers or technology companies exceeds this critical value (), governments would still adopt providing incentive policies strategy, but carmakers and technology companies will have gradually evolved from unwillingness to cooperate to willingness to cooperate. At this point, the system would eventually evolve to . The development of ICVs requires significant R&D investment and talent support, leading many companies to experience substantial losses over the years. For instance, Cruise, a subsidiary of General Motors, has incurred losses exceeding USD 8 billion since 2017. Consequently, the willingness of carmakers and technology companies to collaborate and engage is relatively limited, indicating that the entire industry still needs more government subsidies during the initial development phase.
In addition, from Figure 10a, it can be seen that the evolution speed in the fourth set of data is higher than that in the third set of data . Similarly, the same conclusion can be drawn for technology companies from Figure 10b. This indicates that the higher the government subsidy intensity, the more willing carmakers or technology companies are to cooperate, but this is not the case. The parameters are changed to and . The simulation results in improved situations are shown in Figure 11.
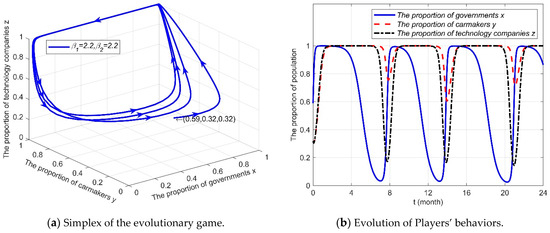
Figure 11.
Simulation results of the evolutionary populations and paths when .
Based on Figure 11a, it is evident that the trajectory of the replicator dynamic system follows a spiral shape over time, and there is no asymptotic ESS. In Figure 11b, it can be observed that the proportions of the three entities are in a constant state of change, which means that the population scales of governments, carmakers, and technology companies are unstable. Therefore, higher subsidy intensity may not necessarily benefit the development of the ICV industry. This situation does exist in the development of the ICV industry. Although the Chinese government has been actively promoting the development of the ICV industry, such as issuing the Action Plan for the Development of the Intelligent Connected Vehicle (ICV) Industry and implementing an R&D expense deduction policy, the cross-border innovation cooperation between carmakers and technology companies has not been smooth. For example, in 2023, GAC-controlled subsidiary AION’s AH8 project changed from joint development with Huawei to self-development. And both parties only retain the procurement relationship [78]. Hence, it is important for governments to establish appropriate subsidy levels to alleviate cost pressures on carmakers and technology companies. This approach could foster the cross-border innovation cooperation between carmakers and technology companies, as well as expedite the evolution of systems to . Beijing E-Town focuses on the development and application of ICV-related technology verification and innovation scenarios in cooperation between carmakers and technology companies, providing different types of subsidies, such as encouraging the secure utilization of automotive data, with a maximum annual support amount of CNY 1.5 million, supporting the demonstration application of autonomous driving in various fields, with a maximum annual support amount of CNY 3 million, strengthening the key technology and product R&D, with a maximum support amount of CNY 10 million per project [79].
6.3. Benefit Distribution Ratio
To study the impact of the benefit distribution ratio on the system evolution, this paper sets the benefit distribution ratio α change over the interval [0.25, 0.85] in incremental steps of 0.2, and Figure 12 is obtained by using MATLAB to simulate the processes of the evolution game. The x-axis indicates the probability that governments adopt (I), the y-axis indicates the probability that carmakers adopt (C), and the z-axis indicates the probability that technology companies adopt (C). In Figure 12, as the benefit distribution ratio α rises, the system continues evolving to and the evolution speed increases. Therefore, the change in the benefit distribution ratio does not impact the stable point of the system, whereas it does affect the rate at which the system evolves to the stable point.
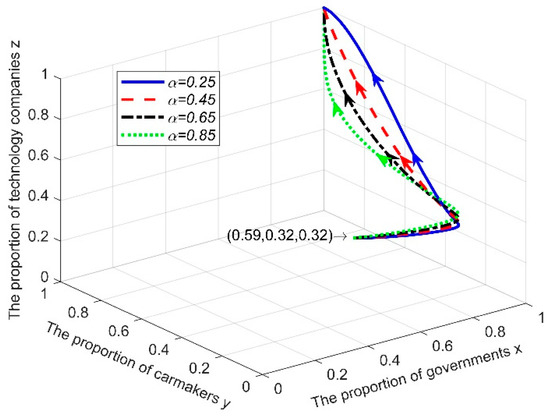
Figure 12.
Simulation results of the evolutionary path when changes.
The impact of the benefit distribution ratio α on carmakers and technology companies’ selection strategies is shown in Figure 13. In Figure 13a, it is observed that for carmakers, a higher benefit distribution ratio leads to a faster evolution speed. In Figure 13b, the data indicate that for technology companies, there is no significant change in the evolution speed as the benefit distribution ratio increases from 0.25 to 0.65. It is only when the benefit distribution ratio hits 0.85 that the evolution speed slows down. This suggests that, compared to carmakers, technology companies require a less rigorous benefit distribution to a certain extent. The automobile industry has high entry barriers due to design capabilities, manufacturing facilities, and distribution networks [80]. To address the challenges associated with production qualifications, many technology companies are shifting the leadership of collaborative innovation for ICVs to qualified carmakers. For example, in 2023, Geely restructured the Jidu partnership with Baidu, establishing the Jiyue marque with 65% ownership, while Baidu maintains a 35% minority stake [21]. Geely leads in product manufacturing, while Baidu offers AI services, including intelligent cockpit, intelligent driving, and Ernie Bot, to enhance the passenger vehicles produced by Geely. In 2024, the Jiyue 07 was officially launched. It claims to achieve Level-4 autonomous driving, allowing vehicles to perform all driving tasks in certain scenarios without human intervention [81]. Huawei has introduced two modes for collaboration with carmakers: the component supplier mode and the Huawei Inside (HI) mode. In these arrangements, carmakers take the lead in decision-making regarding products and customer experience, while Huawei focuses on providing the underlying intelligent driving technologies. This partnership includes collaborations with companies like the BAIC Group and Changan Automobile.
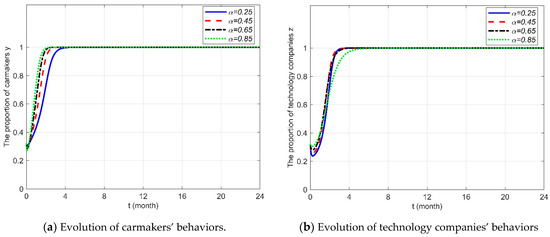
Figure 13.
Players’ evolutionary game behaviors with different distribution coefficients.
7. Conclusions and Management Implications
To solve the problem of how to encourage the cross-border innovation cooperation between carmakers and technology companies to promote the development of the ICV industry, this paper constructs an evolutionary game model and uses the replicator dynamic equation to explore the strategic choices of governments, carmakers, and technology companies and the ESSs of the system. In this paper, a simulation is performed through MATLAB to analyze the evolution and steady state changes in the main game players’ strategies. The conclusions and management implications are as follows.
First, during the initial phases of ICV development, the government’s infrastructure investment could foster the cross-border innovation cooperation between carmakers and technology companies. However, as the industry advances, the excessive investment may hinder the growth of the ICV industry, potentially leading to unstable partnerships between carmakers and technology companies or sole reliance on government incentive policy. Hence, governments should provide significant infrastructure investment to ease the financial burden on carmakers and technology companies in the early stages of the ICV industry. In the subsequent development stage, the focus should shift to formulating regulations and systems compatible with new technologies and products to encourage the cross-border innovation cooperation between carmakers and technology companies, promoting the commercialization of ICVs while reducing infrastructure investment. Additionally, governments could implement a market-oriented strategy to encourage different types of social capital to invest in critical areas and address weaknesses in the development of the ICV industry. This approach would help to enhance the vitality of social capital and facilitate its investment flow within the ICV industry.
Second, government subsidies play a guiding role in the strategic choices of carmakers and technology companies. Government subsidies could help the ICV industry develop in a healthy and organized manner. The incremental government subsidies within limits could encourage the cross-border innovation cooperation between carmakers and technology companies. However, the long-term provision of high subsidies by governments may lead to a lack of systematic ESSs and cyclical behaviors among stakeholders. Therefore, it is important for governments to establish an appropriate subsidy intensity for the future. For example, governments could dynamically adjust the technical standards and thresholds of subsidies based on industry maturity. They could refine these standards to focus on indicators that reflect core competitiveness, such as the self-sufficiency rate of essential components and basic materials. This approach aims to enhance inclusive R&D innovation incentive policies, promote market competition, and encourage a survival-of-the-fittest dynamic.
Finally, a high benefit distribution ratio is provided to carmakers, which would accelerate the convergence of the system to , that is, it is conducive to promoting the cross-border innovation cooperation between carmakers and technology companies. The higher the benefit distribution ratio, the more advantageous it is for carmakers to collaborate with technology companies. Technology companies, on the other hand, are not significantly affected by the change in the benefit distribution ratio and have been moving toward collaborating with carmakers. This finding implies that carmakers with automotive production qualifications, leading the actual process of ICV R&D, could more stably promote ICV diffusion. In fact, carmakers and technology companies could design different benefit-sharing agreements based on the different cooperation modes. One is the basic cooperation mode, in which technology companies provide technology products such as vehicle intelligent systems and cloud services to carmakers. This mode involves minimal participation from technology companies, which typically charge a one-time product purchase fee or a software license fee. The other is the joint development mode. In this scenario, carmakers and technology companies collaborate to leverage each other’s strengths and jointly develop automotive brands. Benefits are distributed based on the proportion of capital contribution.
This paper investigates the micro-level cooperation dynamics between carmakers and technology companies from the perspective of government incentive policy, thereby enhancing research related to ICV. The findings demonstrate how theoretical insights are applied in practice by integrating real-world cases.
For future research directions, three aspects will be mainly considered as follows.
First, this paper focuses on the impact of the government incentive policy on the behavior strategies of governments, carmakers, and technology companies in the ICV industry, without considering the impact of the government supervision mechanism on the ICV industry. The development of the ICV industry has faced various risks, including technological disruption, data security issues, and potential shocks from global market changes. For example, the lack of transparency in artificial intelligence poses significant safety risks. In addition, the widespread use of intelligent devices, such as in-car cameras, microphones, and positioning systems, also raises concerns about potential leaks of personal privacy data. Future research may include how to establish a long-term supervision mechanism by governments, which is worth researching.
Second, this paper only involves governments, carmakers, and technology companies in the evolutionary game. In fact, customers may also play an important role [82]. Although in the early stage of the ICV industry, industrial development and technological innovation are based on policy guidance, customers are ultimately the drivers of the whole business chain, such as R&D, production, manufacturing, and marketing. Therefore, it is worth studying the strategic interactions of all possible stakeholders and making the model more practical.
Third, in this paper, the value of the government subsidies is determined based on the R&D expense super deduction policy, which is also presented in the annual report of ICV-related enterprises. Around the world, governments have provided different subsidies for different types of enterprises to achieve targeted support and effectively promote the development of the ICV market. For example, the European Union has allocated EUR 1 billion under the Horizon Europe strategic plan for 2025–2027 to support ongoing research and innovation in connected and autonomous vehicles and battery technology [74]. Meanwhile, most of the data and cases in this paper originate from China. Future research should gather more extensive and detailed data from additional countries to draw more comprehensive conclusions.
Author Contributions
Conceptualization, R.Z.; methodology, R.Z. and Y.X.; software, R.Z. and Q.W.; validation, R.Z., Y.L. and Q.C.; formal analysis, R.Z.; data curation, R.Z.; writing—original draft preparation, R.Z.; writing—review and editing, R.Z. and Y.X.; visualization, R.Z. and Y.L.; supervision, R.Z.; project administration, R.Z.; funding acquisition, R.Z. All authors have read and agreed to the published version of the manuscript.
Funding
This research was supported by the Shanghai Philosophy and Social Science Planning Project [grant number 2021EGL005].
Data Availability Statement
All data generated or analyzed during this study are included in this manuscript.
Conflicts of Interest
The authors declare no conflicts of interest.
References
- Chan, C.C.; Han, W.; Tian, H.; Liu, Y.; Ma, T.; Jiang, C.Q. Automotive Revolution and Carbon Neutrality. Front. Energy 2023, 17, 693–703. [Google Scholar] [CrossRef]
- Yang, D.; Jiang, K.; Zhao, D.; Yu, C.; Cao, Z.; Xie, S.; Xiao, Z.; Jiao, X.; Wang, S.; Zhang, K. Intelligent and Connected Vehicles: Current Status and Future Perspectives. Sci. China-Technol. Sci. 2018, 61, 1446–1471. [Google Scholar] [CrossRef]
- Wang, Y.; Cai, Y.; Chen, L.; Wang, H.; He, Y.; Li, J. Design of Intelligent and Connected Vehicle Path Tracking Controller Based on Model Predictive Control. J. Mech. Eng. 2019, 55, 136–144. [Google Scholar] [CrossRef]
- Placek, M. Share of Connected Cars in Total New Car Shipments Globally 2020&2030. Available online: https://www.statista.com/statistics/1276018/share-of-connected-cars-in-total-new-car-sales-worldwide/ (accessed on 23 October 2024).
- AskCI Corporation Forecast and Analysis of the Market Size and Enterprise Characteristics of China’s Intelligent Connected Vehicles in 2024. Available online: https://www.askci.com/news/chanye/20240122/083845270588392427328485.shtml (accessed on 23 October 2024).
- Intelligence Research Group Analysis and Prediction of the Development Prospects and Innovation Direction of China’s Intelligent Connected Vehicle Industry in 2022. Available online: https://www.chyxx.com/industry/201912/819671.html (accessed on 23 October 2024).
- Li, X.; Li, B.; Xing, R. Technology Licensing Contract Design Considering Royalty Transparency and Demand Information Asymmetry with Downstream Co-Opetition. Expert Syst. Appl. 2024, 238, 122183. [Google Scholar] [CrossRef]
- Zhao, D.; Li, Y.; Wang, J.; Tang, J. How to Promote Traditional Automobile Companies’ Intelligent-Connected Transformation under the New Dual-Credit Policy? A Tripartite Evolutionary Game Analysis Combined with Funding Time Delay. Systems 2024, 12, 319. [Google Scholar] [CrossRef]
- Ma, M.; Sun, W.; Zhao, J.; Li, X. Strategic Interactions and Market Dynamics in the Intelligent Connected Vehicle Industry: An Analysis of Technology Sharing, Value Co-Creation, and Market Competition. Manag. Decis. Econ. 2024, 45, 4795–4813. [Google Scholar] [CrossRef]
- SAIC MOTOR Banma Network Becomes Unicorn Company After First Financing Round. Available online: https://www.saicmotor.com/e/latest_news/saic_motor/51426.shtml (accessed on 4 November 2024).
- SAIC MOTOR World’s First Electric Internet-Connected SUV Hits Market. Available online: https://www.saicmotor.com/english/latest_news/roewe/48856.shtml (accessed on 4 November 2024).
- Shapiro, D. IM AI: China Automaker SAIC Unveils IM Brand Electric Vehicles Powered by NVIDIA DRIVE Orin. Available online: https://blogs.nvidia.com/blog/saic-im-ev-nvidia-drive-orin/ (accessed on 4 November 2024).
- Gasgoo Changan Automobile, Baidu Bolster Cooperation in Autonomous Driving. Available online: https://autonews.gasgoo.com/Detail2020.aspx?ArticleId=70015070 (accessed on 4 November 2024).
- Gasgoo Changan Lamore Becomes First Mass-Produced Model to Carry Baidu’s ERNIE Bot. Available online: https://autonews.gasgoo.com/Detail2020.aspx?ClassId=11&ArticleId=70022485 (accessed on 4 November 2024).
- Gasgoo Dongfeng Motor, Tencent Join Hands to Deepen Deployment in Smart Mobility Service, ICV. Available online: https://autonews.gasgoo.com/m/70016100.html (accessed on 4 November 2024).
- Dongfeng Motor What? The Intelligent Connected System of DongFeng Forthing T5 Can Actually Play like This! Available online: https://www.fxauto.com.cn/index.php/news/newsinto?id=673 (accessed on 4 November 2024).
- BAIC Group Launching Arcfox αS HI—High-End Smart Pure Electric Car Jointly Developed by BAIC and Huawei. Available online: https://www.baicgroup.com.cn/en/news/22.1000.html (accessed on 4 November 2024).
- Wei, Y.; Huang, Z. Current status and developing strategy of the internet of vehicles industry. China Natl. Cond. Strength 2019, 28, 59–61. [Google Scholar] [CrossRef]
- Chen, Y.; Lin Lawell, C.-Y.C.; Wang, Y. The Chinese Automobile Industry and Government Policy. Res. Transp. Econ. 2020, 84, 100849. [Google Scholar] [CrossRef]
- Jiang, X.; Wang, L.; Cao, B.; Fan, X. Benefit Distribution and Stability Analysis of Enterprises’ Technological Innovation Cooperation Alliance. Comput. Ind. Eng. 2021, 161, 107637. [Google Scholar] [CrossRef]
- Doll, S. Geely Restructures JIDU Partnership with Baidu as ‘JI YUE’ to Bring ROBO-01 EV to Market. Available online: https://electrek.co/2023/08/15/geely-stake-baidu-jidu-robo-01-ev-market-new-ji-yue-brand-china/ (accessed on 4 November 2024).
- Bian, C.; Yin, G.; Xu, L.; Zhang, N. Bidirectional Adaptive Cruise Control for Intelligent Vehicles. Int. J. Heavy Veh. Syst. 2021, 28, 467–486. [Google Scholar] [CrossRef]
- Chu, W.; Wuniri, Q.; Du, X.; Xiong, Q.; Huang, T.; Li, K. Cloud Control System Architectures, Technologies and Applications on Intelligent and Connected Vehicles: A Review. Chin. J. Mech. Eng. 2021, 34, 139. [Google Scholar] [CrossRef]
- Song, X.; Lou, X.; Zhu, J.; He, D. Secure State Estimation for Motion Monitoring of Intelligent Connected Vehicle Systems. Sensors 2020, 20, 1253. [Google Scholar] [CrossRef]
- Zhou, C. Algorithm Design of Early Warning Seatbelt Intelligent Adjustment System Based on Neural Network and Big Data Analysis. Math. Probl. Eng. 2020, 2020, 7268963. [Google Scholar] [CrossRef]
- Paden, B.; Čáp, M.; Yong, S.Z.; Yershov, D.; Frazzoli, E. A Survey of Motion Planning and Control Techniques for Self-Driving Urban Vehicles. IEEE Trans. Intell. Veh. 2016, 1, 33–55. [Google Scholar] [CrossRef]
- Silva, J.A.R.; Grassi, V. Clothoid-Based Global Path Planning for Autonomous Vehicles in Urban Scenarios. In Proceedings of the 2018 IEEE International Conference on Robotics and Automation (ICRA), Brisbane, Australia, 21–25 May 2018; pp. 4312–4318. [Google Scholar]
- Yanumula, V.K.; Typaldos, P.; Troullinos, D.; Malekzadeh, M.; Papamichail, I.; Papageorgiou, M. Optimal Path Planning for Connected and Automated Vehicles in Lane-Free Traffic. In Proceedings of the 2021 IEEE International Intelligent Transportation Systems Conference (ITSC), Indianapolis, IN, USA, 19–22 September 2021; pp. 3545–3552. [Google Scholar]
- Katrakazas, C.; Quddus, M.; Chen, W.-H.; Deka, L. Real-Time Motion Planning Methods for Autonomous on-Road Driving: State-of-the-Art and Future Research Directions. Transp. Res. Part C Emerg. Technol. 2015, 60, 416–442. [Google Scholar] [CrossRef]
- Jiang, H.; Shi, K.; Cai, J.; Chen, L. Trajectory Planning and Optimisation Method for Intelligent Vehicle Lane Changing Emergently. IET Intell. Transp. Syst. 2018, 12, 1336–1344. [Google Scholar] [CrossRef]
- Sheng, P.; Ma, J.; Wang, D.; Wang, W.; Elhoseny, M. Intelligent Trajectory Planning Model for Electric Vehicle in Unknown Environment. J. Intell. Fuzzy Syst. 2019, 37, 397–407. [Google Scholar] [CrossRef]
- Yang, Y.; Ma, F.; Wang, J.; Zhu, S.; Gelbal, S.Y.; Kavas-Torris, O.; Aksun-Guvenc, B.; Guvenc, L. Cooperative Ecological Cruising Using Hierarchical Control Strategy with Optimal Sustainable Performance for Connected Automated Vehicles on Varying Road Conditions. J. Clean. Prod. 2020, 275, 123056. [Google Scholar] [CrossRef]
- Yuan, C.; Weng, S.; Shen, J.; Chen, L.; He, Y.; Wang, T. Research on Active Collision Avoidance Algorithm for Intelligent Vehicle Based on Improved Artificial Potential Field Model. Int. J. Adv. Robot. Syst. 2020, 17, 1729881420911232. [Google Scholar] [CrossRef]
- Zhu, Y.; Zhao, K.; Li, H.; Liu, Y.; Guo, Q.; Liang, Z. Trajectory Planning Algorithm Using Gauss Pseudo-Spectral Method Based on Vehicle-Infrastructure Cooperative System. Int. J. Automot. Technol. 2020, 21, 889–901. [Google Scholar] [CrossRef]
- Wu, B.; Qian, L.; Lu, M.; Qiu, D.; Liang, H. Optimal Control Problem of Multi-Vehicle Cooperative Autonomous Parking Trajectory Planning in a Connected Vehicle Environment. IET Intell. Transp. Syst. 2019, 13, 1677–1685. [Google Scholar] [CrossRef]
- ITF/OECD. Leveraging Digital Technology and Data for Human-Centric Smart Cities; ITF/OECD: Paris, France, 2020.
- Yang, L.; Liu, S. Analysis on the Development Status of ICV. In Proceedings of the 2021 International Wireless Communications and Mobile Computing (IWCMC), Harbin, China, 28 June–2 July 2021; pp. 2153–2156. [Google Scholar]
- European Commission. A European Strategy on Cooperative Intelligent Transport Systems, a Milestone Towards Cooperative, Connected and Automated Mobility; European Commission: Brussels, Belgium, 2016.
- European Commission. Sustainable and Smart Mobility Strategy—Putting European Transport on Track for the Future; European Commission: Brussels, Belgium, 2020.
- United States. Joint Program Office for Intelligent Transportation Systems. ITS National Intelligent Transportation Systems Program Plan: Five Year Horizon Plan; United States. Joint Program Office for Intelligent Transportation Systems: Washington, DC, USA, 2000.
- U.S. Department of Transportation. Saving Lives with Connectivity: A Plan to Accelerate V2X Deployment; U.S. Department of Transportation: Washington, DC, USA, 2024.
- Gavanas, N.; Anastasiadou, K.; Nathanail, E.; Basbas, S. Transport Policy Pathways for Autonomous Road Vehicles to Promote Sustainable Urban Development in the European Union: A Multicriteria Analysis. Land 2024, 13, 1807. [Google Scholar] [CrossRef]
- Andraško, J.; Hamuľák, O.; Mesarčík, M.; Kerikmäe, T.; Kajander, A. Sustainable Data Governance for Cooperative, Connected and Automated Mobility in the European Union. Sustainability 2021, 13, 10610. [Google Scholar] [CrossRef]
- dos Santos, F.L.M.; Duboz, A.; Grosso, M.; Raposo, M.A.; Krause, J.; Mourtzouchou, A.; Balahur, A.; Ciuffo, B. An Acceptance Divergence? Media, Citizens and Policy Perspectives on Autonomous Cars in the European Union. Transp. Res. Part A Policy Pract. 2022, 158, 224–238. [Google Scholar] [CrossRef]
- Li, Y.; Cao, Y.; Qiu, H.; Gao, L.; Du, Z.; Chen, S. Big Wave of the Intelligent Connected Vehicles. China Commun. 2016, 13, 27–41. [Google Scholar] [CrossRef]
- Zhang, R.; Zhong, W.; Wang, N.; Sheng, R.; Wang, Y.; Zhou, Y. The Innovation Effect of Intelligent Connected Vehicle Policies in China. IEEE Access 2022, 10, 24738–24748. [Google Scholar] [CrossRef]
- Kuang, X.; Zhao, F.; Hao, H.; Liu, Z. Intelligent Connected Vehicles: The Industrial Practices and Impacts on Automotive Value-Chains in China. Asia Pac. Bus. Rev. 2018, 24, 1–21. [Google Scholar] [CrossRef]
- Tang, J.; Wu, W.; Zhao, D.; Chen, X. Evolutionary Game and Simulation Analysis of Intelligent Connected Vehicle Industry with Cross-Border Collaborative Innovation. IEEE Access 2023, 11, 17721–17730. [Google Scholar] [CrossRef]
- Tang, H.; Zhang, R.; Li, D.; Tang, B. Research on cooperation development mechanism of intelligent & connected vehicles based on evolutionary game theory. J. Nat. Sci. Heilongjiang 2021, 38, 387–393. [Google Scholar] [CrossRef]
- Hao, X.; Liu, G.; Zhang, X.; Dong, L. The Coevolution Mechanism of Stakeholder Strategies in the Recycled Resources Industry Innovation Ecosystem: The View of Evolutionary Game Theory. Technol. Forecast. Soc. Change 2022, 179, 121627. [Google Scholar] [CrossRef]
- Ning, J.; Xiong, L. Analysis of the Dynamic Evolution Process of the Digital Transformation of Renewable Energy Enterprises Based on the Cooperative and Evolutionary Game Model. Energy 2024, 288, 129758. [Google Scholar] [CrossRef]
- Cao, J.; Chen, X.; Wu, S.; Kumar, S. Evolving Remanufacturing Strategies in China: An Evolutionary Game Theory Perspective. Environ. Dev. Sustain. 2021, 23, 14827–14853. [Google Scholar] [CrossRef]
- Feng, C. The development dilemma and coping strategy of China’s intelligent network automobile industry. Contemp. Econ. Manag. 2018, 40, 64–70. [Google Scholar] [CrossRef]
- Luo, J.; Hu, M.; Huang, M.; Bai, Y. How Does Innovation Consortium Promote Low-Carbon Agricultural Technology Innovation: An Evolutionary Game Analysis. J. Clean. Prod. 2023, 384, 135564. [Google Scholar] [CrossRef]
- Zhang, J.; Wu, M. Cooperation Mechanism in Blockchain by Evolutionary Game Theory. Complexity 2021, 2021, 1258730. [Google Scholar] [CrossRef]
- Vincent, T.L. Evolutionary Games. J. Optim. Theory Appl. 1985, 46, 605–612. [Google Scholar] [CrossRef]
- Friedman, D. Evolutionary Games in Economics. Econometrica 1991, 59, 637–666. [Google Scholar] [CrossRef]
- Fu, Z.-L.; Wang, L.; Xue, S.-J.; Ma, J.; Zhang, J.; Guo, W. Tripartite Evolutionary Game Analysis of the Collective Intelligence Design Ecosystem. J. Clean. Prod. 2022, 381, 135217. [Google Scholar] [CrossRef]
- Ritzberger, K.; Weibull, J.W. Evolutionary Selection in Normal-Form Games. Econometrica 1995, 63, 1371–1399. [Google Scholar] [CrossRef]
- Chen, J.; Sun, C.; Shi, J.; Liu, J. Technology R&D and Sharing in Carbon Emission Reduction in a Duopoly. Technol. Forecast. Soc. Change 2022, 183, 121936. [Google Scholar] [CrossRef]
- Zhang, C.; Zhang, T.; Zhao, Y.; Qiu, C.; Wang, X.; Lan, S.; Cao, J. SemanticICV: Endogenous Secure Full-Scenario Learning for Intelligent Connected Vehicles Driven by Semantics. IEEE Netw. 2024, 38, 156–163. [Google Scholar] [CrossRef]
- Dietzenbacher, E.; Los, B. Externalities of R&D Expenditures. Econ. Syst. Res. 2002, 14, 407–425. [Google Scholar] [CrossRef]
- Zhou, S.; Wang, J.; Xu, B. Innovative Coupling and Coordination: Automobile and Digital Industries. Technol. Forecast. Soc. Change 2022, 176, 121497. [Google Scholar] [CrossRef]
- Gasgoo JIDU Launches Limited ROBO-01 Lunar Edition Priced at 399,800 Yuan. Available online: https://autonews.gasgoo.com/Detail2020.aspx?ClassId=2&ArticleId=70021584 (accessed on 4 November 2024).
- Jiading District Shanghai’s Jiading Attracts 17 New Intelligent Connected Vehicle Projects. Available online: http://english.jiading.gov.cn/2024-04/09/c_978046.htm (accessed on 4 November 2024).
- National Development and Reform Commission. The Innovative Development Strategy for Intelligent Vehicles; National Development and Reform Commission: Beijing, China, 2020.
- Ministry of Finance of the People’s Republic of China; State Taxation Administration; Ministry of Science and Technology of the People’s Republic of China. Notice of the Ministry of Finance, the State of Taxation Administration and the Ministry of Science and Technology on Improving the Pre-Tax Super Deduction Ratio of R&D Expenses; Ministry of Finance of the People’s Republic of China; State Taxation Administration; Ministry of Science and Technology of the People’s Republic of China: Beijing, China, 2018.
- Ministry of Finance of the People’s Republic of China; State Taxation Administration. Announcement of the Ministry of Finance and the State Taxation Administration on Further Improving the Policy for Pre-Tax Additional Deductions for R&D Expenses; Ministry of Finance of the People’s Republic of China; State Taxation Administration: Beijing, China, 2021.
- Ministry of Science and Technology of the People’s Republic of China; Ministry of Public Security of the People’s Republic of China; Ministry of Transport of the People’s Republic of China. Notice of the Ministry of Industry and Information Technology, the Ministry of Public Security, and the Ministry of Transport on Issuing the “Specification for Road Test Management of Intelligent Connected Vehicles (for Trial Implementation)”; Ministry of Science and Technology of the People’s Republic of China; Ministry of Public Security of the People’s Republic of China; Ministry of Transport of the People’s Republic of China: Beijing, China, 2021.
- iResearch China Automotive Lidar Market Insight Report. Available online: https://www.iresearch.com.cn/Detail/report?id=3983&isfree=0 (accessed on 5 November 2024).
- UNECE (China) Beijing’s Initiatives on Autonomous Driving Industry in the Era of Interconnection of Everything. Available online: https://unece.org/transport/documents/2024/01/informal-documents/china-beijings-initiatives-autonomous-driving (accessed on 5 November 2024).
- Ministry of Industry and Information Technology of the People’s Republic of China; Ministry of Public Security of the People’s Republic of China; Ministry of Natural Resources of the People’s Republic of China; Ministry of Housing and Urban-Rural Development of the People’s Republic of China; Ministry of Transport of the People’s Republic of China. Notice of the Ministry of Industry and Information Technology, the Ministry of Public Security, the Ministry of Natural Resources, the Ministry of Housing and Urban-Rural Development, and the Ministry of Transport on Launching Pilot Cities for the Application of “Vehicle-Road-Cloud Integration” for Intelligent Connected Vehicles; Ministry of Industry and Information Technology of the People’s Republic of China; Ministry of Public Security of the People’s Republic of China; Ministry of Natural Resources of the People’s Republic of China; Ministry of Housing and Urban-Rural Development of the People’s Republic of China; Ministry of Transport of the People’s Republic of China: Beijing, China, 2024.
- Cao, Y. Testing on Public Roads a Leap Forward for L3 Autonomous Vehicles in China. Available online: https://europe.chinadaily.com.cn/a/202406/17/WS666f8a64a31095c51c5092fb.html (accessed on 5 November 2024).
- European Commission. Industrial Action Plan for the European Automotive Sector; European Commission: Brussels, Belgium, 2025.
- Beijing E-Town E-Town Capital: Capital Engine Supports Intelligent Connected Vehicles in Enhancing Performance. Available online: https://www.ncsti.gov.cn/kjdt/scyq/bjjjjskfq/jkdt/202410/t20241022_183007.html (accessed on 5 May 2025).
- State Taxation Administration. Notice of the State Taxation Administration on Administrative Measures for the Pre-Tax Deduction of Enterprise R&D Expenses (for Trial Implementation); State Taxation Administration: Beijing, China, 2008.
- Ministry of Finance of the People’s Republic of China; State Taxation Administration. Announcement of the Ministry of Finance and the State Taxation Administration on Further Improving the Pre-Tax Super Deduction Policy for R&D Expenses; Ministry of Finance of the People’s Republic of China; State Taxation Administration: Beijing, China, 2023.
- Gasgoo GAC Group Discontinues Joint Development with Huawei on AH8 Project. Available online: https://autonews.gasgoo.com/m/70022554.html (accessed on 5 November 2024).
- Beijing E-Town. Several Policies of Beijing E-Town on Promoting High Quality Development of Intelligent Connected Vehicle Industry; Beijing E-Town: Beijing, China, 2024. [Google Scholar]
- Thomas, V.J.; Maine, E. Market Entry Strategies for Electric Vehicle Start-Ups in the Automotive Industry—Lessons from Tesla Motors. J. Clean. Prod. 2019, 235, 653–663. [Google Scholar] [CrossRef]
- Andrews, M. Baidu Apollo Powered Jiyue 07 Electric Sedan Launches, Claims L4 Autonomous Driving. Available online: https://carnewschina.com/2024/09/11/baidu-apollo-powered-jiyue-07-electric-sedan-launches-and-claims-to-offer-l4-autonomous-driving/ (accessed on 5 November 2024).
- He, M.; Zhang, J.; Zhang, L.; Zhang, R. Evaluating User Experience for Intelligent Connected Vehicles: A Qualitative Study. In Engineering Psychology and Cognitive Ergonomics, Proceedings of the 21st International Conference, EPCE 2024, Held as Part of the 26th HCI International Conference, HCII 2024, Washington, DC, USA, 29 June–4 July 2024; Harris, D., Li, W.-C., Eds.; Springer Nature: Cham, Switzerland, 2024; Volume 14693, pp. 3–14. [Google Scholar]
Disclaimer/Publisher’s Note: The statements, opinions and data contained in all publications are solely those of the individual author(s) and contributor(s) and not of MDPI and/or the editor(s). MDPI and/or the editor(s) disclaim responsibility for any injury to people or property resulting from any ideas, methods, instructions or products referred to in the content. |
© 2025 by the authors. Licensee MDPI, Basel, Switzerland. This article is an open access article distributed under the terms and conditions of the Creative Commons Attribution (CC BY) license (https://creativecommons.org/licenses/by/4.0/).