Abstract
Recently, as the non-face-to-face society persists due to the coronavirus (COVID-19), the Internet usage rate continues to increase, and input devices, such as keyboards and mice, are mainly used to authenticate users in non-face-to-face environments. Due to the nature of the non-face-to-face environment, important personal data are processed, and since these personal data include authentication information, it is very important to protect them. As such, personal information, including authentication information, is entered mainly from the keyboard, and attackers use attack tools, such as keyloggers, to steal keyboard data in order to grab sensitive user information. Therefore, to prevent disclosure of sensitive keyboard input, various image-based user authentication technologies have emerged that allow sensitive information, such as authentication information, to be entered via mouse. To address mouse data stealing vulnerabilities via GetCursorPos() function or WM_INPUT message, which are representative mouse data attack techniques, a mouse data defense technique has emerged that prevents attackers from classifying real mouse data and fake mouse data by the defender generating fake mouse data. In this paper, we propose a mouse data attack technique using machine learning against a mouse data defense technique using the WM_INPUT message. The proposed technique uses machine learning models to classify fake mouse data and real mouse data in a scenario where the mouse data defense technique, utilizing the WM_INPUT message in image-based user authentication, is deployed. This approach is verified through experiments designed to assess its effectiveness in preventing the theft of real mouse data, which constitute the user’s authentication information. For verification purposes, a mouse data attack system was configured, and datasets for machine learning were established by collecting mouse data from the configured attack system. To enhance the performance of machine learning classification, evaluations were conducted based on data organized according to various machine learning models, datasets, features, and generation cycles. The results, highlighting the highest performance in terms of features and datasets were derived. If the mouse data attack technique proposed in this paper is used, attackers can potentially steal the user’s authentication information from various websites or services, including software, systems, and servers that rely on authentication information. It is anticipated that attackers may exploit the stolen authentication information for additional damages, such as voice phishing. In the future, we plan to conduct research on defense techniques aimed at securely protecting mouse data, even if the mouse data attack technique proposed in this paper is attempted.
1. Introduction
As there is non-face-to-face contact in society due to the recent coronavirus (COVID-19), the rate of Internet usage continues to increase [1]. In a non-face-to-face environment, input devices, such as a keyboard or mouse, are mainly used to authenticate users. Information entered by the user in this way includes user authentication information, and due to the nature of the non-face-to-face environment, personal information such as name, SSN (Social Security Number), and address is also included during the usage process [2]. Among this personal information, it is very important to protect information such as passwords and CVC (Card Security Code) [3]. For this reason, vulnerabilities have been discovered in which attackers use attack tools, such as keyloggers, to steal keyboard data, i.e., steal authentication information inputted from the keyboard [4].
To prevent keyboard data from being exposed, image-based authentication technologies have emerged that input authentication information from the mouse rather than from the keyboard [5]. These technologies use specific coordinates with the mouse contained in the image displayed on the screen as a password, and since authentication information is not entered from the keyboard, they solve the security threat of stealing keyboard data. Despite these efforts, attack techniques have emerged that steal mouse data input from mouse devices via the GetCursorPos() function or the WM_INPUT message [6,7,8]. To prevent exposure mouse data from being compromised by mouse data attack techniques, mouse data defense techniques have emerged using the SetCursorPos() function or the WM_INPUT message [9]. These techniques effectively protect mouse data by preventing attackers from classifying real mouse data and fake mouse data by interfering with the generation of fake mouse data by defenders. In this paper, when the mouse data defense technique using the WM_INPUT message is deployed, we propose a mouse data attack technique that classifies real mouse data and fake mouse data by utilizing machine learning technology [10], which has recently been applied in many fields.
The contributions of this study are as follows:
- Previous mouse data stealing attack techniques that steal mouse data do not neutralize defense techniques that use fake mouse data generation. Therefore, in this paper, we proposed a technique for classifying fake mouse data using a prior machine learning attack technique. It was verified that attack techniques that cannot be attacked using prior attack techniques have been confirmed to classify mouse data utilizing machine learning.
- Even if a defense technique using the existing WM_INPUT message is implemented, the mouse data theft vulnerability will be identified and verified if the proposed attack technique is used. As a result of the experiment, when the most effective gradient boosting model is used, the attack accuracy is over 99%, which means that it is almost impossible to completely steal the mouse data input. Moreover, we believe that the proposed use of machine learning attack techniques can be helpful in detecting other vulnerabilities and will be used in the future to study mouse data defense techniques.
The structure of this article is as follows. Section 2 introduces prior knowledge, such as the mouse data transfer process and machine learning models, as well as related work, such as mouse data attack and defense techniques. Section 3 describes the experimental results and analysis of the mouse data attack technique using machine learning models, while Section 4 concludes the paper with conclusions.
2. Prior Knowledge and Related Works
This section introduces the mouse data transfer process and machine learning models, which provide the background knowledge necessary to understand the mouse data theft attack technique using machine learning proposed in this paper and related works including mouse data attack techniques and defense techniques.
2.1. Prior Knowledge
This subsection describes the mouse data transfer process and machine learning models that provide the knowledge necessary to understand the latest mouse data attack techniques and defense techniques. This prior knowledge helps to understand the core technologies and to compare the performance and evaluate the proposed attack technique.
2.1.1. Mouse Data Transferring Process
To support interaction between the user and the computer, the operating system provides features such as moving and clicking the mouse cursor based on mouse data sent from the mouse device. Among the mouse data functions, the WM_INPUT message is one of the messages provided by the Windows operating system and is used to receive and process input data from hardware, such as the keyboard and mouse [11]. To provide these functions, the process of transferring mouse data from the mouse device to the application program was analyzed, and the analysis results are shown in Figure 1.
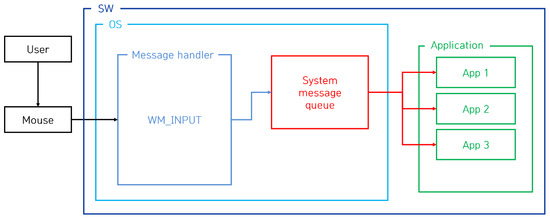
Figure 1.
The process of transferring mouse data using the WM_INPUT message.
The process of transferring mouse data via the WM_INPUT message is explained in detail as follows. When the user moves the mouse, the mouse generates mouse data corresponding to the movement and transfers these data to the operating system. During this process, if the WM_INPUT message is registered from the application, the operating system sends the received mouse data to the handler of the application that registered the WM_INPUT message. The handler retrieves the mouse data received from the operating system, and the data are the relative coordinates on the screen. According to this transfer process, if an attacker registers a WM_INPUT message and periodically steals mouse data, the attacker can track the user’s mouse movement, and, therefore, the attacker can steal the user’s input authentication information using image-based authentication.
2.1.2. Machine Learning Models
Machine learning is a field of artificial intelligence. It is a technology that allows computer systems to classify data and predict and evaluate results by learning from data and deriving patterns [12]. Machine learning is mainly divided into supervised learning, unsupervised learning and reinforcement learning, depending on the learning method. Supervised learning is a method of learning a model to predict the correct answer based on data given the correct answer [13], while unsupervised learning is a method of deriving or clustering patterns in data by analyzing data without a correct answer [14]. Reinforcement learning is a method in which an agent interacts with the environment, learns through rewards according to its actions, and selects actions that maximize rewards [15].
Through these various learning methods, machine learning models extract patterns from data and predict or classify new data [16]. The use of these machine learning models enables data-driven problem solving, which is used as a tool to make useful decisions in complex real-world situations [17]. In order to derive the machine learning model with the best performance in the attack technique proposed in this article, KNN (K-Nearest Neighbor) [18], logistics regression [19], decision tree [20], random forest [21], gradient boosting [22], and MLP (Multi-Layer Perception) models were used.
A KNN model is a supervised learning model used in classification or regression problems and determines the label of data based on the nearest neighbor data of a given data point. The logistics regression model is mainly used in binary classification problems and predicts the class of data by passing a linear combination through a logistic function to calculate the probability value. A decision tree model is a classification and regression algorithm that constructs decision rules based on the data characteristics. The data are divided and expressed in the form of a tree; each node represents a specific condition and is connected by branches. A random forest model is an ensemble technique that combines multiple decision trees to create a more powerful and stable prediction model. Each decision tree is trained using bootstrap sampling, and the results are combined by voting or averaging. The gradient boosting model is an ensemble technique that builds a strong prediction model by sequentially learning multiple weak learners (mainly a decision tree model). It operates on the principle of learning, compensating for the errors of the previous model. Lastly, an MLP model is a type of artificial neural network that has multiple hidden layers, and the neurons in each layer receive input and pass it on to the next layer. Because it has a deep structure, it can learn complex patterns.
2.2. Related Works
This subsection introduces state-of-the-art mouse data attack and defense techniques in image-based user authentication technology. Since this paper focuses on the WM_INPUT message, it essentially explains the attack techniques that utilize the WM_INPUT message among various mouse data attack techniques and the defense techniques that correspond to those attack techniques.
2.2.1. Mouse Data Attack Technique Using the WM_INPUT Message
The attack technique using the WM_INPUT message that is the subject of the paper is an attack that continuously steals the mouse’s relative coordinates by registering the WM_INPUT message and tracks the user’s input mouse movement based on the collected relative coordinates. The tracking process is as follows. Once launched, the attack program captures the user’s screen and extracts the absolute coordinates of the current mouse position. Afterwards, the WM_INPUT message handler is registered, and if the user moves the mouse, the operating system calls the WM_INPUT message handler registered by the attack program. Accordingly, the attacker steals the relative coordinates of the current mouse position from the WM_INPUT message handler. Based on the initially extracted absolute coordinates, the mouse movement is tracked by calculating the stolen relative coordinates. This attack process is shown in Figure 2 [23]. The attacker tracks the user’s mouse input based on the attack process shown in Figure 2, and the attack results are shown in Figure 3 [23].
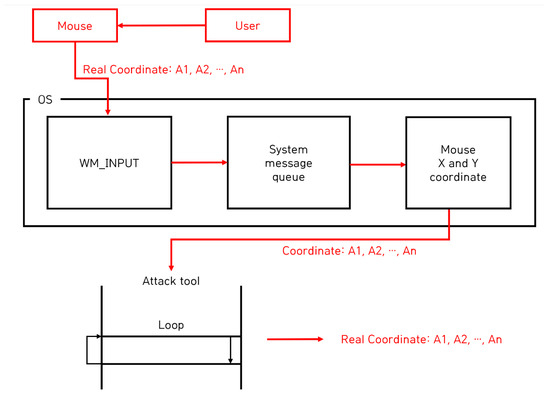
Figure 2.
The process of attacking mouse data using the WM_INPUT message.
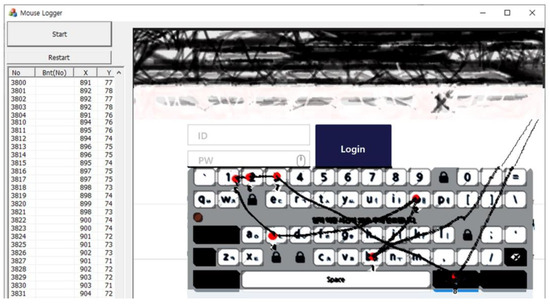
Figure 3.
An example of mouse data attack results using the WM_INPUT message.
To describe the attack results shown in the figures, when the attacker clicks the “Start” button in the attack program to start the attack, the image displayed on the screen is captured and displayed on the right screen. Afterwards, when the user moves the mouse, the cursor moves accordingly, and the movement is visualized as a black line. By visualizing the results, the tracking of the user’s mouse movements was verified. From an attacker’s perspective, an important part of stealing user credentials is the user’s click information on the displayed screen, and the attacker program visualizes the user’s click information by displaying red dots and click order. The list box on the left shows the actual mouse location and click information in order, informing the attacker of the coordinates. Finally, the attacker uses the stolen password to authenticate as the user, using this attack program to steal the “boss123” password inputted by the user.
2.2.2. Technique for Protecting Mouse Data Using the WM_INPUT Message
To counter the WM_INPUT mouse data attack technique, a defense technique that prevents exposure of real mouse data has been proposed [10]. The core technology of this defense technique is to prevent real mouse data from being revealed to attackers by generating fake mouse data. The defense process is as follows. The defense program randomly generates fake mouse data and transmits them to the attacker program by appending it to the WM_INPUT message, and the attacker program receives the fake mouse data generated by the defense program. During this process, if the user moves the mouse, the operating system transmits the WM_INPUT message containing the mouse data corresponding to the movement to the attack program. According to this defense process, the attacker program collects both the fake mouse data generated by the defense program and the real mouse data, which are the actual user input from the WM_INPUT message handler. However, the attacker does not distinguish which data are real mouse data and which are fake, and as a result, the defense program effectively prevents the mouse data from being exposed. The process of this defense technique is shown in Figure 4 [9], and an example implementation result is shown in Figure 5 [9].
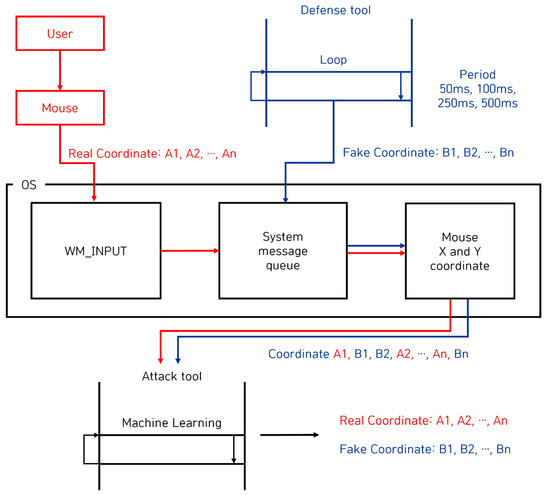
Figure 4.
The process of defending mouse data using the WM_INPUT message.
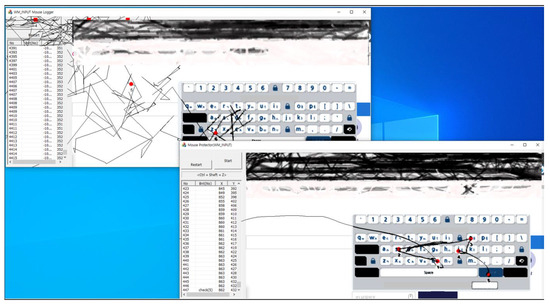
Figure 5.
An example of mouse data defense results using the WM_INPUT message.
To explain the defense results shown in Figure 5, the figure in the upper left corner shows the results of the attack program using the WM_INPUT message, and the figure in the lower right corner shows the result of the defense program using the WM_INPUT message. Upon analyzing the attack results from the attacker’s perspective, the attack program displays the position of the hijacked mouse, but it appears to be an unusual and abnormal movement. This happens because the attack program collects both real mouse data inputted by the user and the fake mouse data generated by the defense program. Therefore, due to the false mouse data, the attack program does not distinguish between the real mouse data and shows abnormal movements. As a result of this attack, the attack program does not steal the user’s real mouse data input, so the attack fails.
On the other hand, since the defense program must allow the user to successfully input the password, it must output mouse movements based on actual user input rather than fake mouse data generated by the defense program. The defense program filters out the fake mouse data it generates from the mouse data received from the WM_INPUT message handler because the defense program knows the fake mouse data it generated. The filtered result ultimately collects only the real mouse data inputted by the user, excluding fake mouse data generated by the defense program, allowing the user to successfully enter the password. Therefore, we verified whether the user inputted the password “bsoj” safely without exposing it to attacks.
2.2.3. Intrusion Detection Using Mouse Dynamics
This study [24] aims to enhance account security by identifying unique mouse usage patterns for intruder detection and providing a non-intrusive and continuous monitoring alternative to traditional biometrics. For the experiment, the authors used the Balabit Mouse Challenge Dataset, which contains detailed mouse data usage data, such as movements, clicks, and drag-and-drop movements of 10 users. Specifically, focusing on user authentication, the authors extracted features from these mouse movements and used machine learning models. The results of this study demonstrate the efficacy of mouse dynamics as a biometric tool for intruder detection and highlight the necessity for larger and more diverse datasets for broader application. This highlights the importance of reproducibility with other security measures for improved system robustness.
2.2.4. An Empirical Evaluation of Online Continuous Authentication and Anomaly Detection Using Mouse Clickstream Data Analysis
This study [25] proposed strengthening the security of online platforms by continuous authentication and anomaly detection using mouse clickstream to solve the limitations of existing password-based systems. The experiment involved collecting mouse clickstream data from 20 participants and extracting about 87 different features from mouse movement and point-and-click actions. For data analysis, the authors used various machine learning and deep learning models, including decision tree, KNN, random forest, and convolutional neural networks (CNN). This study defined the following features, namely velocity of mouse pointer, acceleration, jerk, angle of movement, angular velocity, number of pixels travelled, curvature, and curvature change rate, and these features were used to analyze user behavior. The experimental results showed that the CNN model accurately distinguished between genuine and fraudulent users with high accuracy, and they concluded that mouse clickstream can be effectively used for continuous authentication and anomaly detection in online security systems.
3. Proposal of a Mouse Attack Technique on Data Using Machine Learning
In this section, we describe a mouse data theft attack technique using machine learning when a mouse data defense technique using the WM_INPUT message is deployed. This attack technique aims to steal user’s real mouse data by classifying real mouse data and fake mouse data using machine learning, even if both real mouse data entered by the user and fake mouse data generated by the defense program are collected. To this end, the attack possibility was verified by configuring the attack system and datasets and evaluating its performance.
3.1. Configuration of the Attack System and Datasets
This subsection describes the proposed attack system, feature definitions, and dataset configuration. The attack system was configured to collect both real and fake mouse data while running a mouse data defense program using the WM_INPUT message, and the collected mouse data were defined as features for use in machine learning among data analysis techniques. Finally, we describe the dataset configured based on the collected mouse data.
3.1.1. Attack System
An attack system was designed to be used in machine learning to overcome the limitations of the failed attack technique when a defense technique using the WM_INPUT message described in recent related works was deployed. The configured attack system was designed to collect both real user-entered mouse data and fake mouse data generated by the defense program, and the collection process is shown in Figure 6.
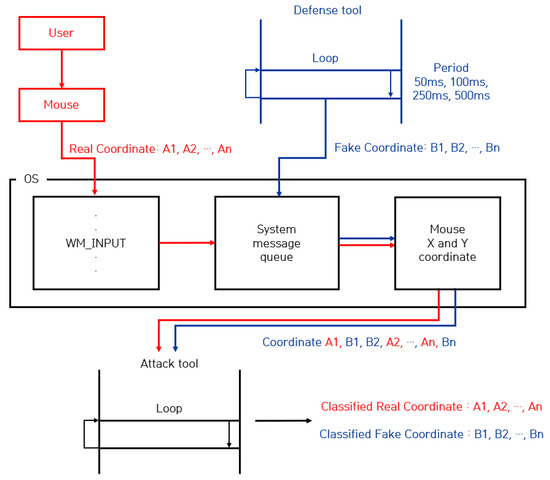
Figure 6.
Setting up a mouse data attack system using machine learning.
The configured attack system utilizes the WM_INPUT message to collect the real mouse data A1, A2, ∙∙∙, and An input from the mouse device, and in the process, random fake mouse data B1, B2, ∙∙∙, and Bn generated by the defense program are also collected. As a result, this attack system collects both the user’s real mouse data and fake mouse data generated by the defense program A1, B1, B2, A2, ∙∙∙, An, and Bn, with the ultimate goal of classifying these data using machine learning. Moreover, because the performance of machine learning models that analyze data may vary depending on the collected data, in order to compare the performance according to various datasets, the data generation cycle of the fake mouse was set to 50 ms, 100 ms, 250 ms, and 500 ms, and the data were collected according to each mouse data generation cycle.
3.1.2. Feature Definition
In data science fields such as machine learning, defined features have a close impact on performance, so it is important to extract useful features from the data. This subsection describes the characteristics defined to utilize mouse data collected from a configured attack system for machine learning. In particular, since the generation cycle of fake mouse data is expected to affect the data analysis performance, the cycle of fake mouse data is set to 50 ms, 100 ms, 250 ms, and 500 ms to configure the dataset.
Accordingly, the data that can be collected from the attack system configured in this article are the elapsed time, the X coordinate, and the Y coordinate. However, these features alone were considered insufficient for data analysis, so the distance between the X coordinates and the distance between the Y coordinates were defined as additional features. Therefore, a total of five features are defined as features: elapsed time, X coordinate, Y coordinate, distance between X coordinates, and distance between Y coordinates. These features are used to configure and learn the dataset.
3.1.3. Dataset Configuration
As mentioned above, the generation cycle was set to 50 ms, 100 ms, 250 ms, and 500 ms, and the collected mouse data were configured into datasets. The configured datasets are divided into seven subsets of data according to the ratio of real mouse data to fake mouse data for each generation cycle, and the 50 ms generation cycle consisted of data subsets from 1-1 to 1-7. Likewise, the 100 ms generation cycle consisted of data subsets from 2-1 to 2-7, the 250 ms generation cycle consisted of data subsets from 3-1 to 3-7, and the 500 ms generation cycle consisted of data subsets from 4-1 to 4-7. Each subset of data contains 20,000 data, and the entire configured datasets are shown in Table 1.

Table 1.
Dataset configuration for experimenting with the proposed mouse data attack technique.
Each dataset has a different generation cycle and a different ratio of real mouse data to fake mouse data. The number of real mouse coordinates varies for each data subset, and datasets from 1-1 to 1-7 include 16,003, 14,009, 12,005, 10,282, 8011, 6000, and 4004, respectively. Likewise, the number of real mouse coordinates in data subsets from 2-1 to 4-7 was also configured differently. We believe that this will enable us to derive the dataset or model with the best performance in various situations. Moreover, the number of fake mouse coordinates has been configured differently for each data subset, and datasets from 1-1 to 1-7 include 3997, 5991, 7995, 9718, 11,989, 14,000, and 15,996, respectively. Likewise, the number of fake mouse coordinates in data subsets from 2-1 to 4-7 was also configured differently.
To obtain the dataset or model with the best performance in various situations, the ratio of real mouse coordinates to fake mouse coordinates in the dataset was also changed. From Dataset 1 to Dataset 7, in each dataset, the real mouse coordinates and fake mouse coordinates were configured with the ratios 8:2, 7:3, 6:4, 5:5, 4:6, 3:7, and 2:8, respectively. This ratio configuration is expected to be used to evaluate performance based on the ratio of real mouse coordinates to fake mouse coordinates.
3.2. Experimental Results of the Proposed Attack Technique on Mouse Data
In this subsection, we describe the results of experiments that classify real mouse data and fake mouse data when a defense technique using the WM_INPUT message is deployed using machine learning based on configured datasets. The results of these classification experiments are ultimately directly related to the success of the mouse data attack. If an attacker is highly likely to be able to distinguish between real mouse data and fake mouse data, then the attacker is stealing the user’s authentication information by stealing the user’s entered mouse data. To classify mouse data, this paper uses representative machine learning models, such as KNN, logistics regression, decision tree, random forest, gradient boosting, and MLP.
Through experiments, a best-performing dataset is obtained by comparing and analyzing the comprehensive performance evaluation results of collected datasets from 1-1 to 4-7 based on the features defined in this paper: elapsed time, X coordinate, Y coordinate, distance between X coordinates, and distance between Y coordinates. The first experiment describes performance evaluation results of datasets defined by elapsed time, X coordinate, and Y coordinate, and the second experiment describes performance evaluation results of datasets defined by elapsed time, distance between X coordinates, and distance between Y coordinates. Finally, the third experiment describes the performance evaluation results of datasets defined by elapsed time, X coordinate, Y coordinate, distance between X coordinates, and distance between Y coordinates.
3.2.1. First Experiment Results According to Datasets
The first dataset-based experiment compares and evaluates the performance of datasets from 1-1 to 4-7, which define elapsed time, X coordinate, and Y coordinate as features. For the experiment, the training set, validation set, and test set consisted of different ratios of 6:2:2, thereby preventing underfitting and overfitting problems by constructing each set to contain random data. Moreover, to avoid performance evaluation based on a small number of experimental results, the average performance was derived from a total of five experimental results, and the initial values were set in such a way that each experiment did not contain the same data but included random data.
Based on this experimental setup in machine learning, the performance varies depending on the hyperparameters of the learning model, so the best-performing hyperparameters were derived for each learning model. The hyperparameters for each derived learning model are n_neighbors for KNN, C and penalty for logistics regression, max_depth for the decision tree, n_estimators for the random forest, max_depth and learning_rate for gradient boosting, and max_iter and alpha for MLP. Based on dataset 1-1, the optimal hyperparameters with the best mouse data attack performance were derived, and the results are shown in Table 2.
Table 2.
Optimal hyperparameter derivation results for mouse data attack technique (dataset 1-1).
Analysis of the experimental results of dataset 1-1, KNN, random forest, and gradient boosting models showed the highest score of 1 according to the set of hyperparameters in the training set. In the validation set, KNN, decision tree, random forest, and gradient boosting models were found to have the highest score of 0.99, and lastly, in the test set, KNN, decision tree, random forest, and gradient boosting models showed the highest score of 0.99. Based on these results, the optimal hyperparameters were derived on dataset 1-1, and using these hyperparameters, cross-validation, accuracy, precision, recall, F1-score, and AUC were evaluated for the entire datasets from 1-1 to 4-7. The results are shown in Figure 7, Figure 8, Figure 9 and Figure 10.
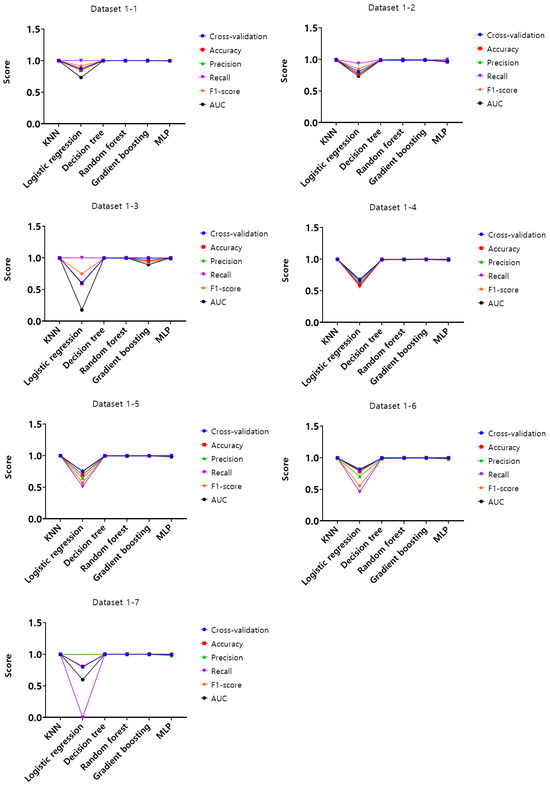
Figure 7.
Performance evaluation results of the first experiment according to the dataset (Dataset 1).
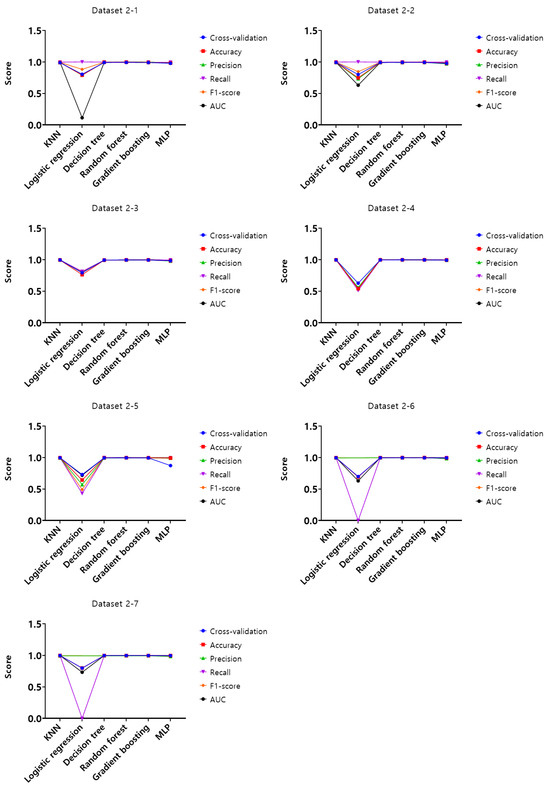
Figure 8.
Performance evaluation results of the first experiment according to the dataset (Dataset 2).
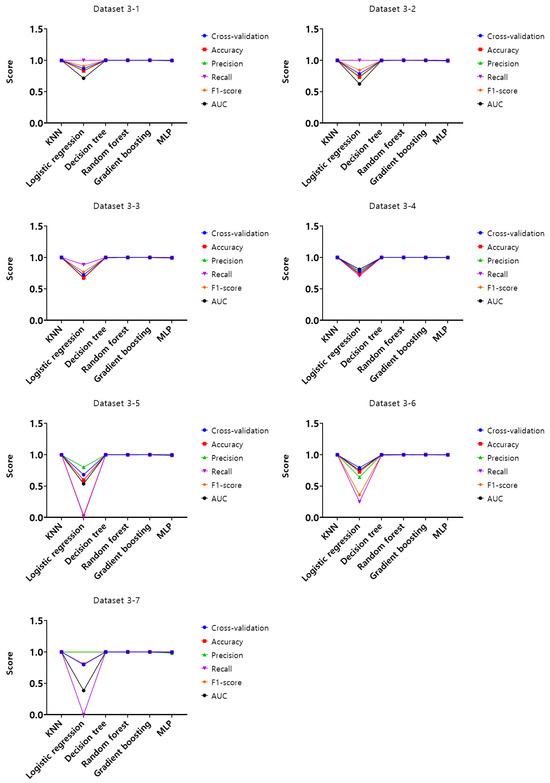
Figure 9.
Performance evaluation results of the first experiment according to the dataset (Dataset 3).
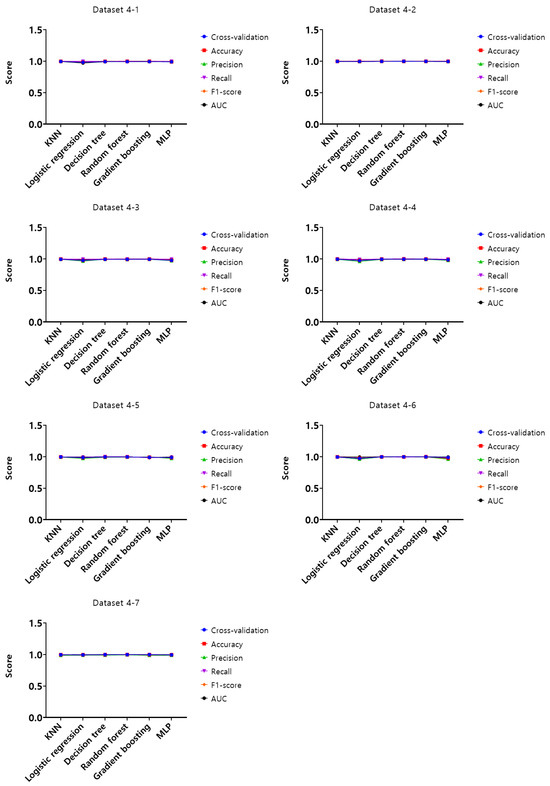
Figure 10.
Performance evaluation results of the first experiment according to the dataset (Dataset 4).
Analysis of cross-validation performance scores, accuracy, precision, recall, F1-score, and AUC for datasets from 1-1 to 4-7 in the first experiment according to the dataset of the mouse data attack technique, performance evaluation result of datasets from 1-1 to 1-7 with a 50 ms generation cycle showed that most of the performance was close to 1, while the logistic regression model showed relatively low performance compared to the other models. In this generation cycle, dataset 1-6 showed the highest performance, and the model with the highest performance was the gradient boosting model. The performance evaluation results of datasets from 2-1 to 2-7 with a generation cycle of 100 ms showed that most of the performance was close to 1, while the logistic regression model showed relatively low performance compared to other models. In this generation cycle, dataset 2-6 showed the highest performance, and the best-performing model was the random forest model. The performance evaluation results of datasets from 3-1 to 3-7 with a generation cycle of 250 ms showed that most of the performance was close to 1, while the logistic regression model showed relatively low performance compared to other models. In this generation cycle, dataset 3-6 showed the highest performance, and the best-performing model was the random forest model. The performance evaluation results of datasets from 4-1 to 4-7 with a generation cycle of 500 ms showed performance close to 1 for most models and showed the highest performance in all datasets.
The performance evaluation results for each dataset in the first experiment are summarized in Table 3. Among all datasets, the highest performing dataset is dataset 2-6 among the datasets with a generation cycle of 100 ms, while the lowest performing dataset is dataset 3-5 among datasets with a generation cycle of 250 ms. To summarize the performance evaluation results according to the learning models, the model with the highest performance is the random forest model, while the model with the lowest performance is the logistic regression model.
Table 3.
Summary of first experimental performance evaluation results of the mouse data attack technique.
3.2.2. Second Experiment Results According to Datasets
The second experiment compared the datasets and evaluated the performance of datasets from 1-1 to 4-7, which have elapsed time, distance between X coordinates, and distance between Y coordinates as features. To evaluate the attack performance according to the datasets, cross-validation, accuracy, precision, recall, F1-score, and AUC were performed on the entire datasets from 1-1 to 4-7, and the results are shown in Figure 11, Figure 12, Figure 13 and Figure 14.
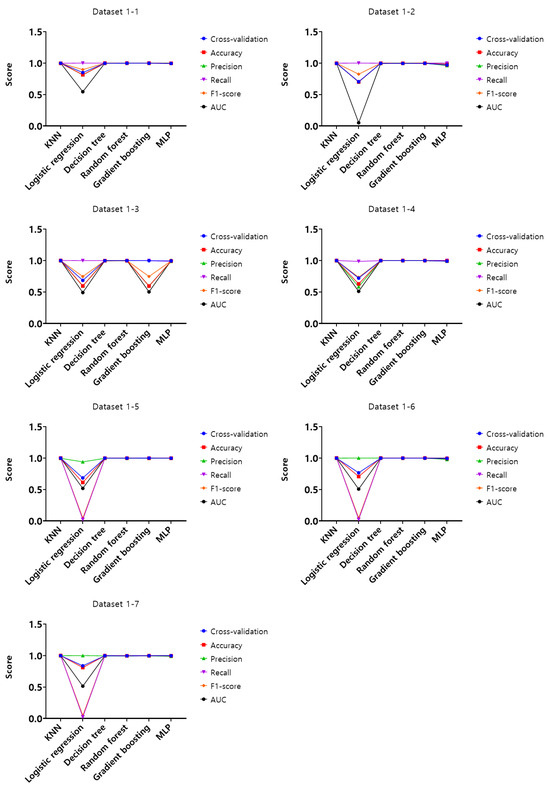
Figure 11.
Performance evaluation results of the second experiment according to the dataset (Dataset 1).
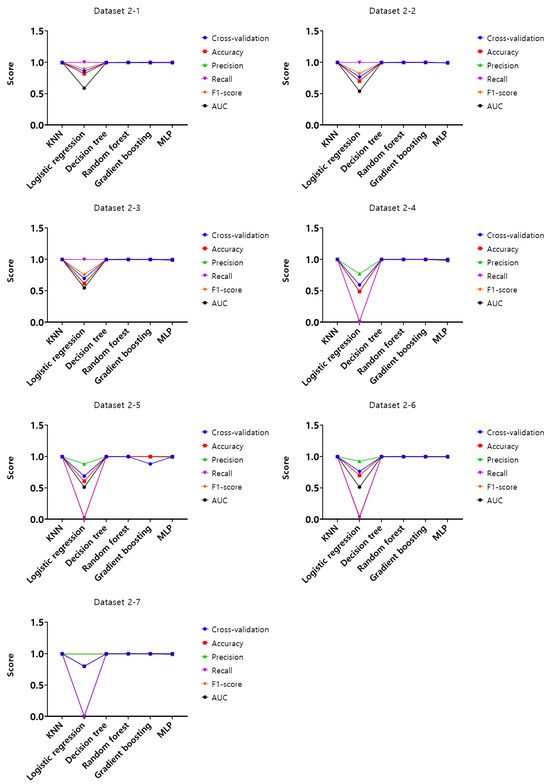
Figure 12.
Performance evaluation results of the second experiment according to the dataset (Dataset 2).
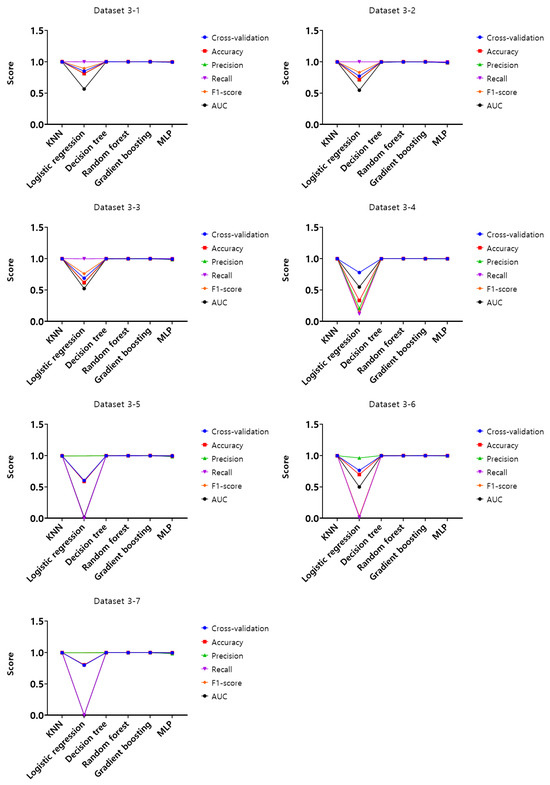
Figure 13.
Performance evaluation results of the second experiment according to the dataset (Dataset 3).
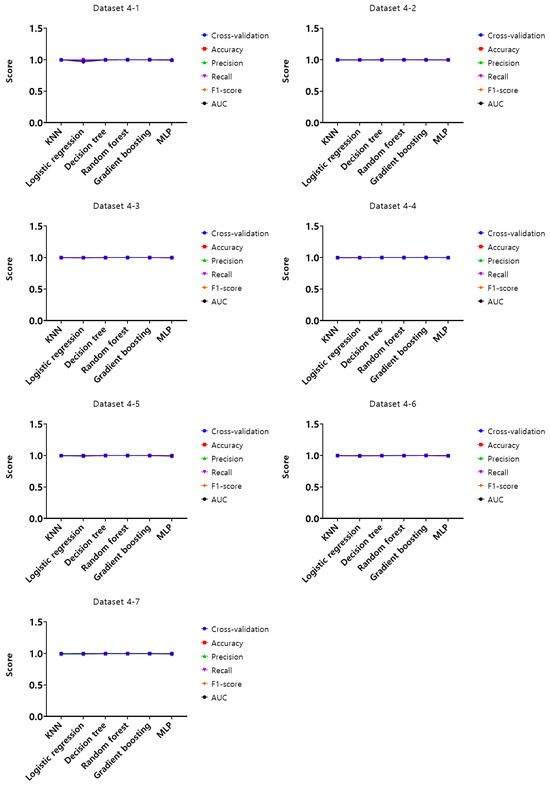
Figure 14.
Performance evaluation results of the second experiment according to the dataset (Dataset 4).
Upon analysis of cross-validation performance results, accuracy, precision, recall, F1-score, and AUC for datasets from 1-1 to 4-7 in the first experiment according to the dataset of the mouse data attack technique, the performance evaluation score of datasets from 1-1 to 1-7 with a 50 ms generation cycle showed that most of the performance was close to 1, while the logistic regression model showed relatively low performance compared to the other models. In this generation cycle, dataset 1-1 showed the highest performance, and the best-performing model was the random forest model. The performance evaluation results of datasets from 2-1 to 2-7 with a generation cycle of 100 ms showed that most of the performance was close to 1, while the logistic regression model showed relatively low performance compared to other models. In this generation cycle, dataset 2-6 showed the highest performance, and the model with the highest performance was the random forest model. The performance evaluation results of datasets from 3-1 to 3-7 with a generation cycle of 250 ms showed that most of the performance was close to 1, while the logistic regression model showed relatively low performance compared to other models. In this generation cycle, dataset 3-6 showed the highest performance, and the best-performing model was the gradient boosting model. The performance evaluation results of datasets from 4-1 to 4-7 with a generation cycle of 500 ms showed performance close to 1 for most models and showed the highest performance on all datasets.
The performance evaluation results for each dataset in the second experiment are summarized in Table 4. Among all the datasets, the highest performing dataset is dataset 4-6 among datasets with a generation cycle of 500 ms, while the dataset with the lowest performance is dataset 2-7 among the datasets with a generation cycle of 100 ms. To summarize the performance evaluation results according to the learning models, the model with the highest performance is the gradient boosting model, while the model with the lowest performance is the logistic regression model.
Table 4.
Summary of results from the second experimental performance evaluation of the mouse data attack technique.
3.2.3. Third Experiment Results According to Datasets
The second experiment is to compare and evaluate the performance of datasets from 1-1 to 4-7, which have elapsed time, X coordinate, Y coordinate, distance between X coordinates, and distance between Y coordinates as features. To evaluate the effectiveness of the attack on the datasets, cross-validation, accuracy, precision, recall, F1-score, and AUC were performed on the entire datasets from 1-1 to 4-7, and the results are shown in Figure 15, Figure 16, Figure 17 and Figure 18.
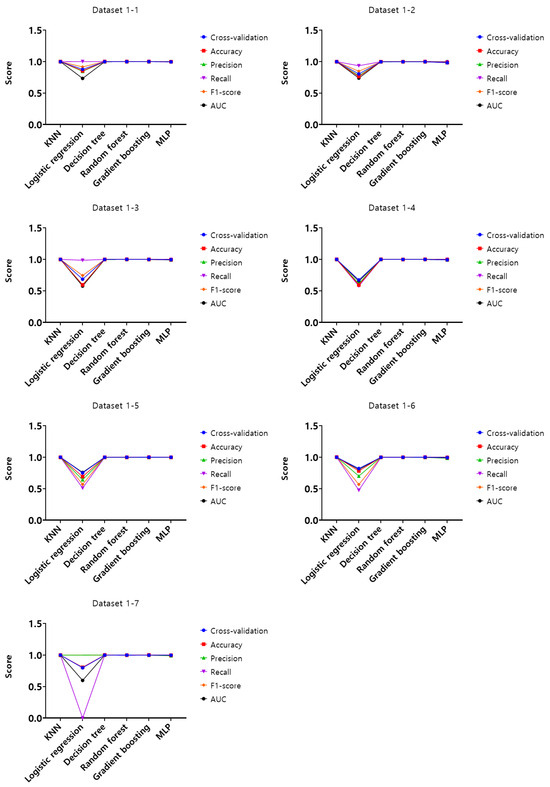
Figure 15.
Performance evaluation results of the third experiment according to the dataset (Dataset 1).
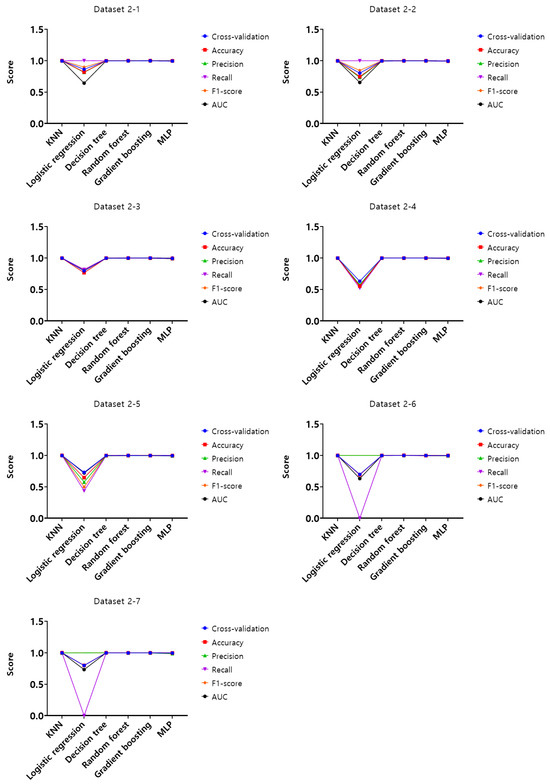
Figure 16.
Performance evaluation results of the third experiment according to the dataset (Dataset 2).
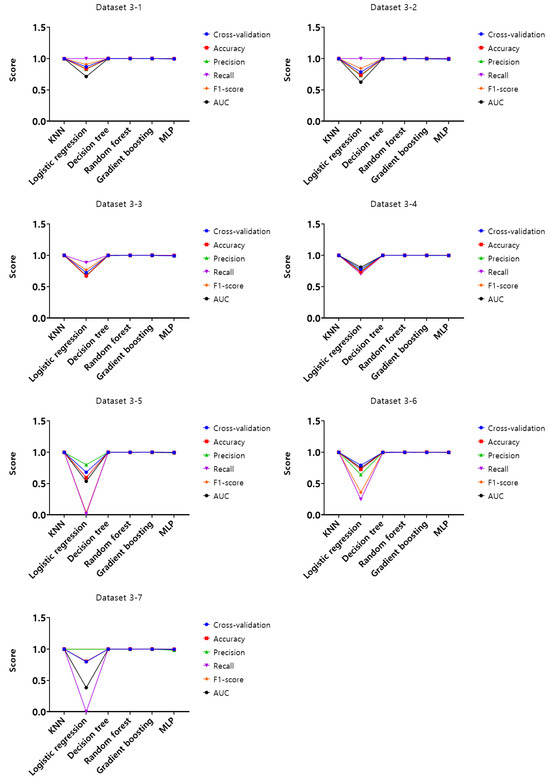
Figure 17.
Performance evaluation results of the third experiment according to the dataset (Dataset 3).

Figure 18.
Performance evaluation results of the third experiment according to the dataset (Dataset 4).
Upon analysis of cross-validation performance results, accuracy, precision, recall, F1-score, and AUC for datasets from 1-1 to 4-7 in the first experiment according to the dataset of the mouse data attack technique, the performance evaluation results of datasets from 1-1 to 1-7 with a generation cycle of 50 ms showed that most of the performance was close to 1, while the logistic regression model showed relatively low performance compared to the other models. In this generation cycle, datasets 1-6 and 1-7 showed the highest performance, and the models with the highest performance were the KNN, decision tree, and gradient boosting models. The performance evaluation results of datasets from 2-1 to 2-7 with a generation cycle of 100 ms showed that most of the performance was close to 1, while the logistic regression model showed relatively low performance compared to other models. In this generation cycle, dataset 2-1 showed the highest performance, and the model with the highest performance was the gradient boosting model. The performance evaluation results of datasets from 3-1 to 3-7 with a generation cycle of 250 ms showed that most of the performance was close to 1, while the logistic regression model showed relatively low performance compared to other models. In this generation cycle, dataset 3-6 showed the highest performance, and the model with the highest performance was the gradient boosting model. The performance evaluation results of datasets from 4-1 to 4-7 with a 500 ms generation cycle showed performance close to 1 for most models and showed the highest performance on all datasets.
The performance evaluation results for each dataset in the third experiment are summarized in Table 5. Among all datasets, the highest performing datasets are dataset 4-6 among datasets with a 500 ms generation cycle and datasets 1-6 and 1-7 among the datasets with a 50 ms generation cycle, while the dataset with the lowest performance is dataset 3-7 among datasets with a generation cycle of 250 ms. To summarize the performance evaluation results according to the learning models, the top-performing models are the gradient boosting model and random forest model in dataset 4-6, the KNN model in dataset 1-6, and the decision model and gradient boosting model in dataset 1-7, while the model with the lowest performance is the logistic regression model.
Table 5.
Summary of third experimental performance evaluation results of the mouse data attack technique.
3.2.4. Summary of Overall Experiment Performance Evaluation Results
Upon analyzing the overall performance evaluation results according to dataset, models, features, and the generation cycle, which synthesizes all the experiment results, the generation cycle with the highest performance in the performance evaluation results according to generation cycle and features is 500 ms, and the third experiment showed the highest performance in the 500 ms generation cycle. In the third experiment, elapsed time, X coordinate, Y coordinate, distance between X coordinates, and distance between Y coordinates were defined as features. On the other hand, the generation cycle with the lowest performance was 50 ms, and the lowest-performance experiment with a 50 ms generation cycle was the first experiment. The first experiment defines the passage of time, the distance between X coordinates, and the distance between Y coordinates as features.
Upon analyzing the performance evaluation results according to datasets and models, the best-performing dataset is dataset 4-6, and the best-performing model is the gradient boosting model. On the other hand, the dataset with the lowest performance is dataset 1-3, and the model with the lowest performance is the logistic regression model. The performance evaluation results of all the above experiments are summarized in Table 6.
Table 6.
Summary of overall performance evaluation results of the mouse data attack technique.
According to the experimental results, performance evaluation using datasets models, and generation cycle for the mouse data attack technique, features such as elapsed time, X coordinate, Y coordinate, distance between X coordinates, and distance between Y coordinates were defined. The gradient boosting model was employed for learning. The results indicate that an attacker can achieve mouse data theft with an attack accuracy exceeding 99%, representing the best performance. This result means that the classification of real mouse data and fake mouse data is almost perfect for all mouse data. Accordingly, it is concluded that even in scenarios where a defense technique using the WM_INPUT message is deployed, if an attacker uses a machine learning model, users’ authentication information can be successfully stolen.
4. Conclusions
In this paper, we have presented an attack technique that classifies real mouse data and fake mouse data using machine learning, while a mouse data defense technique using the WM_INPUT message in image-based authentication is deployed. The attack performance was evaluated by experiments based on machine learning models, datasets, features, accuracy, precision, recall, F1-score, and AUC. As a result of the performance evaluation, if the elapsed time, X coordinate, Y coordinate, distance between X coordinates, and distance between Y coordinates are defined as features and the gradient boosting model is used for learning, we checked whether an attacker steals the mouse data with an attack accuracy of over 99%. Therefore, when the mouse-based data defense technique using the WM_INPUT message is deployed, if attackers use the machine learning model, they steal the user’s sensitive information such as password, social security number, and card security code.
Similarly, if an attacker uses the mouse data attack technique described in this article, even for users in a financial work environment that processes multiple authentication information or uses common online authentication, the user’s authentication information will be stolen, and the stolen authentication information will be used to cause secondary damage in the form of additional attacks, such as voice phishing. Moreover, if sensitive information is exposed by an attack, it can cause serious harm to individuals, and an attack that results in the disclosure of a user’s personal information or malicious behavior is expected to be possible by analyzing the obtained user’s mouse data pattern.
As a result of this article, it was confirmed that the mouse data defense technique using the WM_INPUT message can almost completely steal real mouse data, so we believe that research on defense techniques is necessary to protect mouse data security. Therefore, in the future, we plan to research preventing attacks by classifying real and fake mouse data by generating and utilizing fake mouse data in various sophisticated ways.
Author Contributions
Conceptualization, W.J. and K.L.; methodology, W.J. and K.L.; software, W.J.; validation, W.J.; data curation, W.J. and K.L.; writing—original draft preparation, W.J. and K.L.; writing—review and editing, S.H. and K.L.; supervision, K.L.; project administration, K.L. All authors have read and agreed to the published version of the manuscript.
Funding
This work was mainly (50%) supported by a National Research Foundation of Korea (NRF) grant funded by the Korea government(MSIT) (NRF-2021R1A4A2001810). This work was also partly (50%) supported by the “Regional Innovation Strategy (RIS)” through the National Research Foundation of Korea (NRF), funded by the Ministry of Education (MOE) (2021RIS-002, 1345370809).
Data Availability Statement
The data presented in this study are available on request from the corresponding author. The data are not publicly available due to privacy.
Conflicts of Interest
The author Wontae Jung was employed by the Company A3 Security. The remaining authors declare that the research was conducted in the absence of any commercial or financial relationships that could be construed as a potential conflict of interest.
References
- Candela, M.; Luconi, V.; Vecchio, A. Impact of the COVID-19 pandemic on the Internet latency: A large-scale study. Comput. Netw. 2020, 182, 107495. [Google Scholar] [CrossRef] [PubMed]
- Park, S.; Choi, G.; Ko, H. Information Technology–Based Tracing Strategy in Response to COVID-19 in South Korea—Privacy Controversies. JAMA Netw. 2020, 323, 2129–2130. [Google Scholar] [CrossRef] [PubMed]
- Long, W.; Quek, M. Personal data privacy protection in an age of globalization: The US-EU safe harbor compromise. J. Eur. Public Policy 2011, 9, 325–344. [Google Scholar] [CrossRef]
- Lee, K.; Yim, K. Password Sniff by Forcing the Keyboard to Replay Scan Codes. In Proceedings of the 5th Joint Workshop on Information Security (JWIS), Guangzhou, China, 5–6 August 2010; pp. 9–11. [Google Scholar]
- Solairaj, A.; Prabanand, S.; Mathalairaj, J.; Prathap, C.; Vignesh, L. Keyloggers software detection techniques. In Proceedings of the 2016 10th International Conference on Intelligent Systems and Control (ISCO), Coimbatore, India, 7–8 January 2016; pp. 1–6. [Google Scholar]
- Lee, K.; Yim, K. Keyboard Security: A Technological Review. In Proceedings of the 2011 5th International Conference on Innovative Mobile and Internet Services in Ubiquitous Computing (IMIS), Seoul, Republic of Korea, 30 June–2 July 2011; pp. 9–15. [Google Scholar]
- MSDN. Available online: https://learn.microsoft.com/en-us/windows/win32/inputdev/wm-input (accessed on 19 December 2023).
- Quang, D.; Martini, B.; Choo, R. The role of the adversary model in applied security research. Comput. Secur. 2019, 81, 156–181. [Google Scholar]
- Oh, I.; Lee, K.; Yim, K. A Protection Technique for Screen Image-based Authentication Protocols Utilizing the SetCursorPos function. In Proceedings of the 18th International Workshop on Information Security Applications (WISA), Jeju Island, Republic of Korea, 24–26 August 2017; pp. 236–245. [Google Scholar]
- Liakos, K.; Busato, P.; Moshou, D.; Pearson, S.; Bochtis, D. Machine Learning in Agriculture: A Review. Sensors 2018, 18, 2674. [Google Scholar] [CrossRef] [PubMed]
- Lee, K.; Yim, K. A Protection Technique for Screen Image-based Authentication Utilizing the WM_INPUT message. In Proceedings of the Korean Society of Computer Information Conference, Busan, Republic of Korea, 26–28 June 2018; Volume 26, pp. 177–178. [Google Scholar]
- Jordan, M.; Mitchell, T. Machine learning: Trends, perspectives, and prospects. Science 2015, 349, 255–260. [Google Scholar] [CrossRef]
- Olson, D.L.; Delen, D. Support Vector Machines. In Advanced Data Mining Techniques; Springer: Berlin/Heidelberg, Germany, 2008; Available online: https://link.springer.com/book/10.1007/978-3-540-76917-0#toc (accessed on 18 August 2023).
- Barlow, H. Unsupervised Learning. Neural Comput. 1989, 1, 295–311. [Google Scholar] [CrossRef]
- Sutton, R.; Barto, A. Reinforcement Learning: An Introduction. IEEE Trans. Neural Netw. 1998, 9, 1054. [Google Scholar] [CrossRef]
- Mosavi, A.; Ozturk, P.; Chau, K. Flood Prediction Using Machine Learning Models: Literature Review. Water 2018, 10, 1536. [Google Scholar] [CrossRef]
- Siryan, J.; Tanju, B.; Eveleigh, T. A Machine Learning Decision-Support System Improves the Internet of Things’ Smart Meter Operations. IEEE Internet Things J. 2017, 4, 1056–1066. [Google Scholar] [CrossRef]
- Zhang, M.; Zhou, Z. ML-KNN: A Lazy Learning Approach to Multi-Label Learning. Pattern Recognit. 2007, 40, 2038–2048. [Google Scholar] [CrossRef]
- Cheng, W.; Hüllermeier, E. Combining instance-based learning and logistic regression for multilabel classification. Mach. Learn. 2009, 76, 211–225. [Google Scholar] [CrossRef]
- Sinclair, C.; Pierce, L.; Matzner, S. An Application of Machine Learning to Network Intrusion Detection. In Proceedings of the 15th Annual Computer Security Applications Conference (ACSAC), Phoenix, AZ, USA, 6–10 December 1999; pp. 371–377. [Google Scholar]
- Yin, C.; Zhu, Y.; Fei, J.; He, X. A Deep Learning Approach for Intrusion Detection Using Recurrent Neural Networks. IEEE Access 2007, 5, 21954–21961. [Google Scholar] [CrossRef]
- Banfield, R.; Hall, L.; Bowyer, K.; Kegelmeyer, W. A Comparison of Decision Tree Ensemble Creation Techniques. IEEE Trans. Pattern Anal. Mach. Intell. 2007, 29, 173–180. [Google Scholar] [CrossRef] [PubMed]
- Lee, K.; Yim, K. Vulnerability analysis on the image-based authentication: Through the WM_INPUT message. Concurr. Comput. Pract. Exp. 2019, 32, e5596. [Google Scholar] [CrossRef]
- Antal, M.; Egyed-Zsigmond, E. Intrusion detection using mouse dynamics. IET Biom. 2019, 8, 285–294. [Google Scholar] [CrossRef]
- Almalki, S.; Assery, N.; Roy, K. An empirical evaluation of online continuous authentication and anomaly detection using mouse clickstream data analysis. Appl. Sci. 2021, 11, 6083. [Google Scholar] [CrossRef]
Disclaimer/Publisher’s Note: The statements, opinions and data contained in all publications are solely those of the individual author(s) and contributor(s) and not of MDPI and/or the editor(s). MDPI and/or the editor(s) disclaim responsibility for any injury to people or property resulting from any ideas, methods, instructions or products referred to in the content. |
© 2024 by the authors. Licensee MDPI, Basel, Switzerland. This article is an open access article distributed under the terms and conditions of the Creative Commons Attribution (CC BY) license (https://creativecommons.org/licenses/by/4.0/).