Abstract
This study introduces the Bi-Level Source-Grid-Load Synergistic Optimization (BL_SGLSO) model, which effectively balances the competing objectives of water conservation and carbon emission reduction in the power industry. The model aims to establish a clean and low-carbon electric power system by harmoniously reconciling these two critical goals. Through the application of bi-level programming, the BL_SGLSO model adeptly manages the preferences and conflicts of decision makers at various levels while capturing regional interactions and the intricacies of electricity transmission. Key findings reveal that non-fossil energy conversion technologies are poised to become the dominant force in electricity generation, accounting for an impressive 89.34% share by 2050. To mitigate the spatial mismatch between power load and resource allocation, the development of new transmission pathways and the expansion of the “power transmission from west to east” initiative are paramount. Furthermore, the implementation of a carbon-reducing power system offers significant potential for conserving water resources and alleviating water stress. These insights provide invaluable guidance for decision makers seeking to optimize multi-regional electric power systems for both water efficiency and low-carbon outcomes while simultaneously promoting the adoption of renewable energy sources and fostering synergistic development across regions.
1. Introduction
Electricity plays a crucial role in facilitating global industrialization, urbanization, and informatization, thereby making substantial contributions to socio-economic growth [1,2]. In China, there has been a considerable surge in power demand, fueled by a strong focus on electricity substitution to propel economic development and satisfy the escalating needs of the populace [3]. In 2020, the nation’s electricity consumption amounted to 7.5 trillion kWh, supported by an installed capacity of 2.2 billion kW [4]. Projections suggest that by 2060, China’s societal electricity consumption will exceed 15 trillion kWh, representing a more than twofold increase compared to 2020 figures [5]. Nevertheless, the heavy dependence on fossil fuels, particularly coal, has posed significant challenges, including air pollution, the greenhouse effect, and escalated water usage [6,7,8]. Presently, China’s energy-related carbon emissions amount to approximately 10 billion tons annually, comprising roughly a third of global carbon emissions [9,10]. Notably, the power industry, being the largest consumer of coal and a significant emitter of carbon in China, accounts for over 40% of the nation’s total carbon emissions [11].
Various strategies have been proposed to address these environmental challenges, with a focus on reducing carbon emissions and conserving water resources [12,13,14,15,16]. However, in the pursuit of carbon emission reduction, the power industry has increasingly faced a trade-off between water conservation and carbon reduction [17,18,19]. For instance, studies reveal that coal-fired power generation in water-stressed regions, especially in northern and northwestern China, increased significantly from 2000 to 2015, further aggravating water scarcity in the western coal mining and power generation hubs [18,20,21,22]. While phasing out or upgrading outdated thermal power plants and expanding the use of renewable energy sources like wind and solar power can mitigate both carbon emissions and water usage, some technologies, such as dry cooling systems, may indirectly lead to higher carbon emissions despite saving water [23,24]. Additionally, regional disparities in economic development, technological capabilities, and resource availability result in uneven electricity generation and demand across different regions [25]. In China, the mismatch between the distribution of primary energy sources (e.g., coal, natural gas, and hydropower) and spatially diverse power consumption patterns poses a challenge. While the economically prosperous eastern coastal regions account for over 60% of the national electricity consumption, certain provinces struggle with significant power production shortages. In contrast, the central and western regions, with lower power demand but abundant energy resources, offer opportunities for cost-effective, high-capacity power generation [26,27]. Research indicates that the technical configuration of each region plays a pivotal role in shaping the water-carbon nexus of the multi-regional electric power system [23]. Hence, achieving a delicate balance between water and carbon trade-offs and pursuing synergistic optimization of the multi-regional source-grid-load system is paramount for establishing a clean, low-carbon electric power system.
The evolution of synergistic optimization models for multi-regional electric power systems can be traced back to the 1980s. During this period, the scale and intricacy of power systems escalated, rendering single-region optimization techniques insufficient in terms of tackling the complexities inherent in multi-regional systems. Consequently, scholars embarked on developing diverse methodologies and models aimed at achieving synergistic optimization within these interconnected systems. Over the ensuing decades, a plethora of approaches emerged, encompassing mathematical programming, game theory, and intelligent optimization algorithms, amongst others [28,29,30,31,32,33,34,35]. Furthermore, technological advancements in computing have empowered researchers to manage more extensive multi-regional electric power systems and craft increasingly sophisticated and efficient optimization models. Rogers et al. (1989) prioritized cost minimization in their multi-period and multi-regional linear programming model for the Canadian electricity supply, yet they overlooked potential environmental impacts despite considering technological choices and trade aspects [33]. This narrow focus on costs contrasts sharply with Hoster’s (1999) interregional dynamic optimization model, which balanced both economic and environmental concerns [36]. However, Hoster’s study lacked a macroeconomic perspective, failing to integrate the power model with a broader economic framework. Chen et al. (2014) contributed an intricate electricity dispatch model that optimized, multi-regional, power system operations but neglected demand-side effects due to data limitations [37]. This approach differs from Wang et al. (2014), who developed a comprehensive optimization model for China’s power sector, emphasizing regional variations and interconnections [38]. Nevertheless, Wang et al. also focused primarily on minimizing system costs, neglecting the complex trade-offs between various decision makers and the interlinkages between emission reduction and water conservation. Cheng et al. (2015) introduced a multi-regional optimization model that balanced resource availability and transmission capacity to minimize the overall cost of the power sector [39]. This holistic approach stands in contrast to the LoMLoG models developed by Guo et al. (2015, 2017), which accurately represented various aspects of the electricity sector but were limited to achieving single-layer objectives [26,27,40,41,42]. Koeva et al. (2023) further expanded the scope by incorporating long-term seasonal storage strategies into electricity market adjustments, highlighting the importance of integrating renewable energy sources into the grid [43]. Despite these advances, a significant gap remains in understanding the interconnected multi-regional electric power system. Most studies have either focused on quantitative analyses of local subsystems or qualitative explorations of the entire system, neglecting the complex interactions between regions at multiple levels. This limited scope of research hinders a comprehensive understanding of the overall characteristics and challenges facing the interconnected power system, emphasizing the need for more holistic and integrated approaches in future studies.
Recent years have witnessed an increasing interest in multi-objective programming methods that aim to achieve multiple environmental goals, including carbon peaking, carbon neutrality, and emission control. These methods enable the simultaneous pursuit of diverse objectives, facilitating a smooth transition to a low-carbon paradigm while ensuring efficient management of emissions. Previous research, such as that conducted by Pratama et al. (2017), has emphasized the advantages of a multi-regional optimization approach in providing a deeper understanding of regional distinctiveness when compared to a singular-regional perspective [44]. Similarly, Zhang et al. (2022) introduced a dual-objective optimization framework that effectively mitigates national energy and water stressors, highlighting the importance of spatial resource reallocation in highly stressed regions [45]. Rasool et al. (2023) further contributed to this field by presenting a comparative multi-objective framework for evaluating the sizing techniques of bi- and tri-objective functions in grid balancing and non-balancing modes. Their findings revealed that the non-balancing mode, despite having a smaller decision variable space, underestimated energy costs by 18–30% in comparison to the grid balancing mode, thereby shedding light on the suitability and adaptability of modeling processes for large-scale grid-interactive hybrid renewable energy systems [46]. However, despite their effectiveness, multi-objective programming methods face challenges when dealing with hierarchically structured multi-regional interconnected electric power systems. This is primarily attributed to the absence of prioritization among decision makers [47,48,49]. To address this gap, bi-level programming (BLP) has emerged as a promising solution for hierarchical decision making involving conflicting objectives [50,51,52]. Based on the Stackelberg games concept, BLP facilitates effective decision making by arranging decision makers in a preset hierarchy. For instance, Du et al. (2022) utilized BLP to propose a co-expansion planning model aimed at minimizing the costs associated with investment and operation while incorporating demand response constraints [52]. Furthermore, Lv et al. (2021) employed an interval bi-level joint-probabilistic programming approach to formulate a strategic plan for China’s long-term energy-water nexus system spanning from 2021 to 2050 [53]. Nevertheless, this model was limited to a national scale and could not reflect the energy interdependence of interconnected regions below the national level. Gong et al. (2022) addressed this limitation by developing an integrated bi-level model for China’s complex multi-regional energy system. This model offered valuable insights for optimizing the system in a cost-effective and sustainable manner [54]. While the model could illustrate the power import and export situations of multi-regional interconnected systems, it failed to depict the direction of electricity flow. Nasiri et al. (2023) contributed to this field by proposing a two-level scheduling model for new energy systems in the context of multiple energy service providers participating in the integrated market for electricity and natural gas [55]. Their model, which utilized an iterative two-step algorithm, demonstrated a 4.39% reduction in procurement costs for electricity and natural gas through the utilization of flexible energy. Notably, many studies have primarily focused on reducing carbon emissions in electricity generation, often overlooking the substantial impact of electricity production on water resources. It is, therefore, imperative to recognize the intricate relationship between power production and water resources and integrate synergistic optimization techniques into multi-regional electric power systems. By achieving a harmonious equilibrium between water conservation and carbon reduction, we can facilitate the simultaneous achievement of sustainable water management and low-carbon development objectives.
The objectives of this study center on navigating the synergies and tensions between water conservation and carbon emission reduction within the power industry, ultimately striving for a delicate equilibrium between water usage and carbon emissions. The introduction of the Bi-Level Source-Grid-Load Synergistic Optimization (BL_SGLSO) model presents several advantages, including streamlined complexity, reduced computational time, and heightened accuracy in optimizing the multi-regional electric power system. By accounting for regional interactions and the nuances of electricity transmission, this model sheds light on the path toward a clean, low-carbon electric power system that is simultaneously water-efficient and environmentally sustainable. The primary contributions of this research are threefold: (i) augmenting the conventional single-level optimization framework of the electric energy system with the BLP method, enabling more effective management of preferences and conflicts among diverse decision-making levels; (ii) capturing the comprehensiveness of the multi-region interconnected power grid structure alongside the fundamental physical characteristics of electricity transmission; and (iii) promoting water conservation and low-carbon progress through a synergistic optimization approach.
The remaining sections of this study are organized as follows: Section 2 presents the methodology adopted in this research. Section 3 provides an overview of the BL_SGLSO model’s formulation, highlighting the objectives and constraints considered. In Section 4, the analysis of results and the policy implications derived from this study are discussed. Finally, Section 5 concludes the research and outlines potential avenues for future studies.
2. Methodology
The BLP method is a nested optimization approach characterized by a dual-level hierarchical structure [48]. In this method, there are two decision makers, each responsible for a distinct set of decision variables and having separate objective functions and constraints [50]. Here, let us denote the decision variables controlled by the upper and lower decision makers as and , respectively. Correspondingly, the objective functions are set as , , and the constraint conditions as . The general BLP model can be formulated as follows [50]:
Upper-level objective:
Lower-level objective:
Subject to:
BLP examines the orderly and non-cooperative interaction of hierarchical decision makers with distinct preferences [48]. The upper-level decision makers lead the process, while lower-level decision makers respond based on the information and constraints provided by the upper level, offering their feedback in return [50]. This iterative feedback prompts adjustments from the upper-level decision makers, leading to the eventual attainment of a satisfactory solution. This hierarchical decision-making process is characterized by hierarchy, independence, conflict, and priority, often resulting in non-convex NP-hard problems that pose challenges for obtaining the global Pareto optimal solution. To address the complexity and efficiency of the solution, we employed an interactive fuzzy algorithm, utilizing a triangular membership function, to obtain the highest level of overall satisfaction. The detailed steps of the solution process are as follows [50]:
Upper-level objective:
Lower-level objective:
Subject to:
, , and are coefficients of the objective functions and constraints. First, based on the interactive fuzzy algorithm, the upper and lower submodels are solved, respectively, so as to obtain the corresponding solutions (, , ) and (, , ) of each submodel. However, since both upper-level decision variables and lower-level decision variables tend to minimize their respective objective functions, there is often a conflict between these two objectives, and the respective optimal solutions of the upper and lower submodels are not mutually accepted. To maximize the overall satisfaction and achieve a satisfactory solution, the upper-level decision makers (ULDMs) allow for a certain tolerance in the decision variables, enabling the lower-level decision makers (LLDMs) to find the optimal solution within a broader feasible range while satisfying the preferences of the ULDMs as much as possible. Following this rule, the LLDMs should obtain the decision-making scheme that aligns with their objectives while prioritizing the preferences of the ULDMs. The solution of should fluctuate within the range , where is the optimal value of the decision variable obtained by solving the upper-level model, is the maximum tolerance value, and represent the minimum and maximum acceptable values of the variable, respectively [50].
The satisfaction would increase linearly within the range and decrease linearly within the range . Decision makers do not accept values outside of this range, resulting in a satisfactory degree of. The membership function of can be expressed as follows [53]:
For each decision maker at every level, the ULDMs are completely satisfied with the decision-making scheme when . Conversely, they are completely dissatisfied when . The LLDMs incorporate their optimal solution into the upper-level objective function to provide their feedback and establish a reference value . Subsequently, the membership function can be expressed as follows:
Similarly, the membership degree of the lower-level objective function can be calculated using the following formula:
Therefore, the optimal solution that satisfies the overall satisfaction of Equations (4)–(7) can be obtained by solving the following equations:
Subject to:
where represents the overall satisfactory degree of the model, is a column vector with all elements equal to 1, and its dimension is the same as that of or . By solving Equations (11)–(17), the solution of and , the objective function values and corresponding to the upper level and the lower level, can be obtained [53].
3. Synthesis of BL_SGLSO Model
3.1. Modeling Formulation
This study utilizes a BLP approach to develop the BL_SGLSO model, which addresses the issues of water resource withdrawal and carbon emissions in China’s provincial electric power system. The model takes into account the intricate interplay between inter-provincial electricity transmission, water resource constraints, and carbon emission reduction policies. It consists of two decision-making layers, with the upper level focused on minimizing the total carbon emissions of the national electric power system, while the lower level aims to control costs and minimize the overall system cost. These objectives are in conflict, as reducing carbon emissions may potentially increase system costs. Both decision-making levels are subject to various constraints related to energy, water, and carbon, including factors such as energy resource availability, power supply-demand balance, power generation capacity, expansion limits, purchased electricity upper limits, inter-provincial transmission balance, water resource availability, and limits on air pollutants and carbon emissions.
This study investigates three spatial scales of China’s power grids: the National Grid (NG), Subnational Grids (SNGs), and Provincial Grids (PGs) [25]. Figure 1 shows the study area of China’s electric power system, including seven State Grid Networks (SNGs): the North China Grid (NCG), the Northeast China Grid (NEG), the East China Grid (ECG), the Central China Grid (CCG), the Northwest China Grid (NWG), the Southwest China Grid (SWG), and the China Southern Power Grid (CSG). Each SNG encompasses several neighboring Provincial Grids (PGs), totaling 31 PGs under consideration, excluding Hong Kong, Macao, and Taiwan. The analysis includes nine power production technologies, such as coal, gas, nuclear, hydro, wind, solar, and biomass power. Furthermore, 117 inter-provincial electricity transmission relationships are incorporated, based on previous research. On the load side, this study considers various electricity demand sectors, including agriculture, industry, construction, transportation, service, residents, and others [25]. The electricity demand sectors considered on the load side include agriculture, industry, construction, transportation, service, residents, and others. The planning period for this study spans from 2021 to 2050, divided into six 5-year planning periods. The framework of the BL_SGLSO modeling formulation is presented in Figure 2. The primary objective is to strike a balance between water and carbon, satisfying the goals of two-level decision makers, while optimizing electricity generation, inter-provincial electricity transmission, water withdrawal, and carbon emissions.
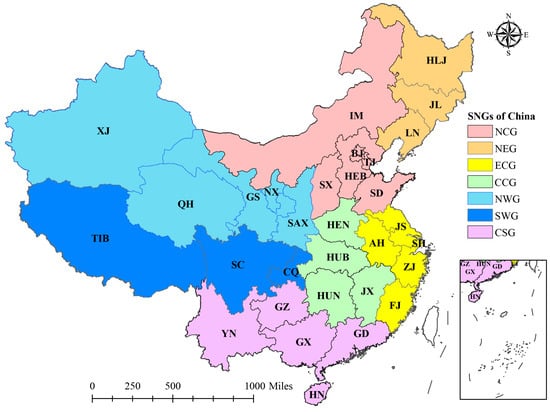
Figure 1.
Study area of China’s electric power system.
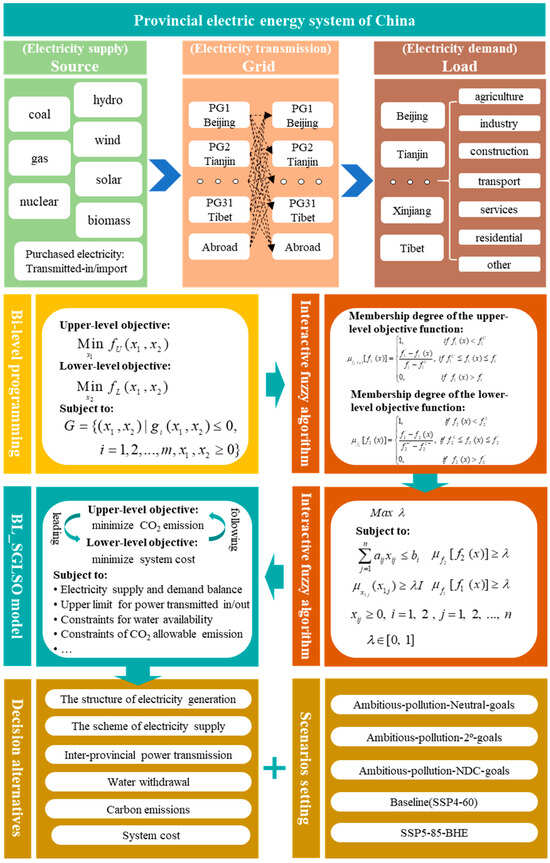
Figure 2.
Framework of the BL_SGLSO modeling formulation.
The upper-level objective of the study is to reduce the overall carbon emissions generated by the national electric energy system, which includes both coal and gas-fired power plants. A lower-level objective is to minimize the costs associated with the system, encompassing expenses related to fossil energy extraction, electricity generation and transmission/import, conversion technology expansion, and reductions in pollutants and carbon emissions. The BL_SGLSO model is formulated as follows:
Upper-level objective:
Lower-level objective:
Cost for energy resources exploitation
Cost for electricity transmitted-in
Cost for imported electricity
Revenue of electricity transmitted-out
Revenue of exported electricity
Cost for energy conversion (fixed cost and variable cost)
Cost for environmental protection
Cost for CO2 emission reduction:
Subject to:
Constraints for energy resources availability
Constraints for electricity supply and demand balance
Upper limit constraints for electricity transmitted in/out
Upper limit constraints for electricity import/export
Balance constraints for electricity transmitted in/out
Constraints for energy conversion
Constraints for water availability
Constraints of air pollutants allowable emission
Constraints of CO2 allowable emission
The selection of the BL_SGLSO model was based on several key criteria, which also offer conceptual advantages over recently published learning-based algorithms [56,57,58].
Explicit integration of water-carbon nexus: Unlike the learning-based algorithms, our scheme explicitly integrates the water-carbon nexus, recognizing the intricate relationship between power production and water resources. We emphasize the significance of achieving a balance between water conservation and carbon reduction, ultimately leading to a sustainable and low-carbon electric power system.
Consideration of bi-level decision making: The BL_SGLSO model accommodates the hierarchical decision-making structure present in the power industry, where decision makers at different levels have varying preferences and objectives. It enables effective coordination between upper-level and lower-level decision makers, facilitating conflict resolution and alignment of objectives. This hierarchical structure sets our scheme apart from the learning-based algorithms and provides a unique and robust optimization framework.
Accounting for regional interactions: The BL_SGLSO model accurately captures the interactions and complexities of electricity transmission among different regions. It considers the spatial disparities between power load and resource allocation, providing insights into the optimization of multi-regional electric power systems.
Ability to reflect regional characteristics: The BL_SGLSO model takes into account the diverse characteristics of different regions in terms of economic development, technological conditions, and resource availability. This flexibility allows for the development of customized strategies tailored to the unique power generation and consumption patterns of each region.
Overall, the BL_SGLSO model was chosen for its ability to address the water-carbon trade-off, accommodate multi-level decision making, capture regional interactions, and reflect regional characteristics. These criteria align with the objectives of our study, enabling comprehensive and effective analysis and optimization of the multi-regional electric power system.
In this study, we utilized Lingo 18.0, a powerful optimization toolkit, to solve the BL_SGLSO model. Lingo streamlines the development and resolution of linear, non-linear, and integer optimization models, offering enhanced efficiency and ease of use. It provides a comprehensive package that includes a modeling language for expressing optimization models, a robust environment for constructing and editing problem formulations, and a high-speed built-in solver. Leveraging the interactive fuzzy algorithm, we decomposed the BL_SGLSO model into multiple linear optimization models, which were efficiently solved using the General solver available in Lingo. The computational setup comprised a machine running Windows 10 Pro as the operating system, powered by an Intel(R) Core(TM) i9-9880H CPU @ 2.30 GHz processor, with 16.0 GB RAM.
3.2. Data Sources and Scenarios Setting
The economic parameters for each province in the BL_SGLSO model are represented by the national average, incorporating a discount factor to account for influences such as inflation and other financial dynamics [59]. On the other hand, the technical parameters are uniquely determined for each province based on their respective statistical yearbooks and previous research conducted by the author’s group. This model takes into account the unique variations that exist in resource availability, production capacity, energy efficiency, and water extraction levels across different provinces [60]. Furthermore, the model considers future technological advancements and the expected decrease in energy consumption and water extraction intensity throughout the planning period [54]. Comprehensive information on China’s electric power production, including cost and technical data, is obtained from a compilation of statistical data, annual development reports, official government reports, and relevant literature studies conducted in China’s electric power industry [60,61]. The model also incorporates water usage during the extraction, processing, and generation of energy resources, represented by the water withdrawal coefficient. It is important to note that operational losses such as steam and sewage are not included in this parameter. Lv et al. (2020) provide a detailed explanation of this coefficient, and our study aligns with their findings [50]. To account for the influence of carbon emission reduction policies on China’s electric energy system, the model established a connection with the shared socio-economic pathways (SSPs) and representative concentration pathways (RCPs). This link enables the simulation of future changes in atmospheric component emissions in China, considering various socio-economic scenarios and climate target constraints [62,63]. The study further utilizes carbon emission data from the power generation industry in each province. These data are obtained from Tsinghua University’s Dynamic Projection model for Emissions in China (DPEC, http://meicmodel.org, accessed on 3 June 2022). The DPEC model currently offers two sets of emission data (V1.0 and V1.1) comprising a total of 12 scenarios. For the purposes of this research, five scenarios were selected: ambitious pollution-neutral goals (Scenario 1, S1); ambitious pollution 2° goals (Scenario 2, S2); ambitious pollution NDC goals (Scenario 3, S3); baseline (Scenario 4, S4); and SSP5-85-BHE (Scenario 5, S5) [62,63]. Table 1 presents the carbon emissions of China’s power generation process across these five scenarios. These scenarios serve as the parameters for carbon emission quotas within the model, thus effectively integrating the aspect of environmental sustainability into the planning process.

Table 1.
The amounts of CO2 emission in DEPC model (108 tons).
4. Results and Policy Implications
4.1. Power Generation
The comprehensive overview presented in Figure 3 delves into the intricacies of power generation strategies and the structural nuances of diverse energy conversion technologies across five distinct scenarios from 2021 to 2050. These scenarios not only chart the anticipated progress of the power generation landscape over three decades but also shed light on the transition from fossil fuels to renewable energy sources. Even in the conservative scenario S5, which portrays the slowest advancement towards renewable energy, a considerable transformation in the power generation mix is evident. Notably, the share of power derived from fossil fuels is anticipated to decline by 8.16%, culminating in a reduced share of 53.31% by 2050. This substantial decrease underscores the national momentum towards phasing out fossil fuels, albeit at a relatively slower rate compared to other more ambitious scenarios. Conversely, scenario S1 emerges as the frontrunner in terms of renewable energy integration. It showcases the most substantial shift in the power mix, with a remarkable surge in the proportion of power generated from renewable sources. Scenarios S2, S3, and S4 follow suit, exhibiting progressively lower levels of renewable energy adoption. This spectrum of scenarios highlights the versatility of energy transition pathways, contingent upon the unique strategies and targets adopted by various provinces or regions. As China increasingly prioritizes the attainment of low carbon emissions, non-fossil energy sources are poised to usurp coal-fired power as the dominant energy supply. By 2050, the projections indicate that non-fossil energy power generation will account for a substantial chunk of the total power output across all scenarios. More specifically, scenario S1 leads the pack with a projected share of 89.34%, closely followed by scenario S2 with 84.34%. Scenarios S3 and S4 lag slightly behind, with projected shares of 75.83% and 74.24%, respectively. The prominence of scenario S1 is further underscored by its stringent carbon emission limits, underscoring the feasibility of ambitious renewable energy targets in driving decarbonization efforts. In essence, the analysis presented in Figure 3 illustrates the diverse yet converging paths toward a sustainable energy future. While the pace and scale of renewable energy integration may vary across scenarios, the overall trend towards reduced reliance on fossil fuels is unequivocal.
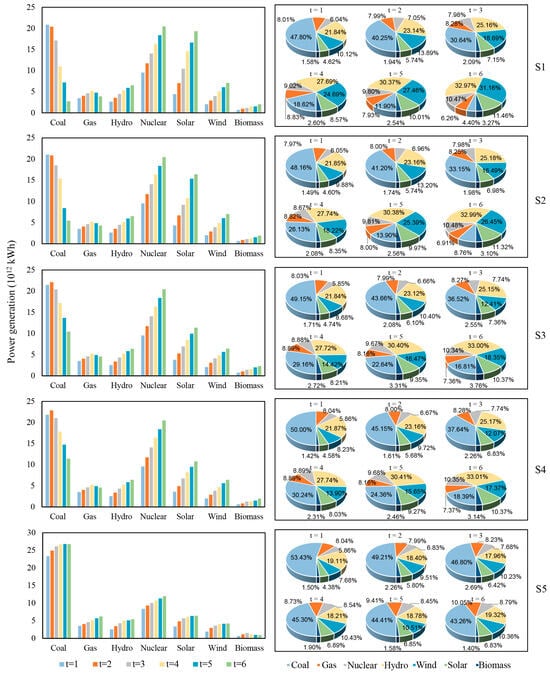
Figure 3.
Power generation schemes during the planning period.
A more nuanced analysis of the non-fossil energy power generation structure in scenario S1 reveals a dominance of hydropower and wind power. Specifically, hydropower is anticipated to contribute 32.97% to the total power generation, while wind power is expected to account for 31.36%. This significant contribution highlights the crucial role of these renewable energy sources in the transition away from fossil fuels. Solar and nuclear power also occupy notable positions in the energy mix, with solar power contributing 11.46% and nuclear power accounting for 10.47% of total power generation. These contributions emphasize the diversity of the renewable energy portfolio and the complementary roles played by different energy sources. Biomass energy, despite being a renewable energy source, is projected to have a smaller impact, contributing approximately 3.27% to total power generation. This limited contribution could be attributed to various factors, including technological challenges, economic considerations, and environmental impacts associated with biomass energy production. Regarding power conversion technologies, a notable trend emerges across the scenarios. In both scenarios, S1 and S2, coal-fired power generation is expected to decline significantly throughout the planning period. However, the rate of decline differs between the two scenarios. In scenario S1, power generation from coal is expected to decrease by a substantial 86.93%, indicating a more rapid transition away from fossil fuels. In contrast, scenario S2 projects a slower decline of 74.18%, suggesting a more gradual phasing out of coal-fired power generation. Under scenarios S3 and S4, coal-fired power generation is expected to peak during the 2026–2030 planning period before experiencing a decrease. Specifically, scenario S3 projects a decrease of 51.48%, while scenario S4 anticipates a slightly lower decrease of 47.75%. This gradual decline highlights the challenges and complexities involved in transitioning from fossil fuels, particularly in regions or sectors where coal remains a significant energy source. Surprisingly, scenario S5 bucks the overall trend by projecting an increase in coal-fired power generation of 14.63%. This counterintuitive development underscores the complex dynamics of the energy transition and the influence of various factors, such as technological advancements, policy interventions, and market forces, on energy trends. In contrast to the declining trend in coal-fired power generation, wind power generation is projected to increase significantly in all scenarios. The growth rates in scenarios S1 to S5 are impressive, ranging from 3.37 times the base year in scenario S1 to 0.91 times the base year in scenario S5. This upward trend underscores the growing recognition of wind power’s potential as a major source of renewable energy and its increasing cost-competitiveness compared to fossil fuels. However, the intermittent nature of renewable energy, particularly wind and solar power, poses significant challenges to the stability and reliability of electric power systems. As the power generation mix evolves toward a higher share of renewable energy sources, effective strategies and technologies to manage this intermittency will become increasingly critical to ensure a smooth and reliable energy transition.
Figure 4 depicts the anticipated power generation structures across China’s 31 provinces in the forthcoming three decades, with a specific focus on S1. A thorough analysis of the research findings reveals several noteworthy trends. Firstly, there is a consistent downward trend in fossil fuel-based power generation. This decline is particularly evident in regions such as Beijing (BJ), Shanghai (SH), and Tianjin (TJ), where gas-fired power generation is expected to remain dominant, accounting for over 50% of total power generation by 2050. This reliance on gas can be attributed to the availability of natural gas resources and the existing infrastructure supporting gas-fired power plants in these urban centers. In contrast, several coastal provinces, including Guangdong (GD), Fujian (FJ), and Zhejiang (ZJ), are projected to primarily rely on nuclear power. Nuclear power generation in these regions is expected to constitute a significant portion of their overall power supply. This shift towards nuclear energy can be explained by favorable conditions such as proximity to coastal areas and suitable geological conditions for nuclear plant construction. Additionally, government policies aimed at reducing dependence on fossil fuels and promoting low-carbon energy sources have further supported the development of nuclear power in these provinces. Another key finding is the heavy reliance on hydropower in provinces like Sichuan (SC), Guizhou (GZ), and Tibet (TIB). Hydropower is expected to account for over 90% of their total power generation, leveraging their abundant water resources and favorable topography for the construction of large-scale hydropower plants. This alignment with regional advantages contributes to their renewable energy targets and promotes sustainable energy development. Meanwhile, Inner Mongolia (IM) and Xinjiang (XJ) are poised to primarily harness wind power, which is anticipated to contribute over 70% of their total power generation. These provinces boast vast land areas and favorable wind conditions, making them ideal locations for establishing large-scale wind farms. The significant proportion of wind power in their energy mix underscores their commitment to tapping into their renewable energy potential and reducing reliance on fossil fuels. Solar power also emerges as a substantial energy source in Qinghai (QH) and Ningxia (NX), where it is expected to account for over 30% of total power generation. These provinces are rich in solar resources and are actively pursuing solar power projects to diversify their energy sources and mitigate greenhouse gas emissions. Lastly, biomass power contributes relatively insignificantly to the overall power generation mix, accounting for less than 10% across all provinces. This limited contribution can be attributed to factors such as the limited availability of biomass resources, technological constraints, and higher costs associated with biomass power generation. Despite its potential as a renewable energy source, biomass power still faces scalability and cost-effectiveness challenges that hinder its widespread adoption.
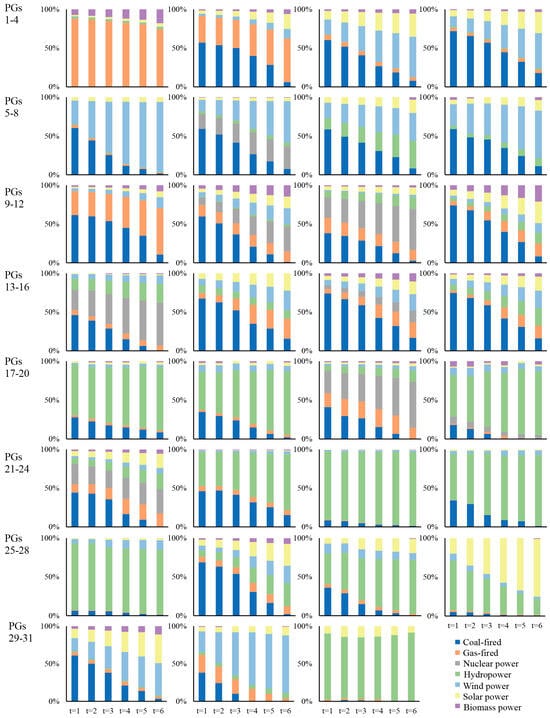
Figure 4.
Power generation structures of 31 provinces under S1.
Figure 5 provides a detailed picture of the projected total power production trends across China’s 31 provinces from 2021 to 2050, as outlined in S1. This comprehensive projection incorporates various power generation sources, revealing the notable contributions of specific provinces in distinct energy sectors. In the coal-fired power generation domain, Shandong (SD), Inner Mongolia (IM), Henan (HEN), Jiangsu (JS), and Shanxi (SX) stand out as the key contributors, collectively contributing 43.45% of the national coal power output. Shandong (SD), in particular, is projected to be the largest contributor, accounting for a substantial 28.94% of the national coal-fired power generation. This significant share underscores Shandong (SD)’s pivotal role in the country’s coal energy production, driven by its extensive coal reserves and robust power generation infrastructure. When considering natural gas resources, the focus shifts to coastal and inland provinces with abundant natural gas reserves. Guangdong (GD), Jiangsu (JS), Shandong (SD), Zhejiang (ZJ), and Xinjiang (XJ) are identified as the major players, expected to drive 56.06% of the national gas-fired power output. Guangdong (GD)’s anticipated contribution of 16.45% of the national total highlights its prominent position in the gas-fired power generation sector. Nuclear power plants are predominantly located in coastal regions, including Jiangsu (JS), Zhejiang (ZJ), Liaoning (LN), Fujian (FJ), Shandong (SD), Guangdong (GD), Guangxi (GX), and Hainan (HN). Guangdong (GD), Zhejiang (ZJ), and Fujian (FJ), are projected to account for approximately 67.99% of the national nuclear power generation. This concentration in coastal areas reflects the strategic importance of these regions in China’s energy landscape, leveraging their proximity to water sources for cooling purposes and potential for safer waste disposal. Hydropower generation, another crucial component of China’s energy mix, is primarily concentrated in provinces along the Yangtze River Basin, particularly Sichuan (SC), Hubei (HUB), and Hunan (HUN). Other notable areas include Yunnan (YN), due to the Lancang River, and Tibet (TIB). Sichuan (SC) leads in hydropower capacity and is anticipated to maintain its dominant position, contributing 24.43% of the national hydropower generation. This significant contribution is attributed to Sichuan (SC)’s favorable geographical features, including high altitude and steep river gradients, which facilitate efficient hydropower generation. Regarding wind power generation, Inner Mongolia (IM), Hebei (HEB), and Xinjiang (XJ) are identified as key contributors due to their unique geographical characteristics and abundant wind energy reserves. Inner Mongolia (IM), in particular, stands out as the leader in this sector, often referred to as the “Three Gorges in the sky and the capital of wind power”. The province is projected to contribute 40.27% of the national wind power output, highlighting its commitment to renewable energy development and exploitation of its vast wind resources. Solar power generation, a crucial element of renewable energy, thrives in regions characterized by arid and semi-arid climates with ample sunshine and high radiation intensity. Qinghai (QH) and Xinjiang (XJ), with their arid climates and high solar radiation levels, are considered ideal regions for solar power generation in China. While Inner Mongolia (IM) and Hebei (HEB) may not enjoy the same ideal conditions, they are actively pursuing solar power technologies and making considerable progress in this sector, demonstrating the versatility and adaptability of solar power generation. Finally, in terms of biomass power generation, Jiangsu (JS) and Shandong (SD) emerge as the primary contributors. These provinces are projected to account for a notable 37.63% of the national biomass power output. Biomass power generation, which utilizes organic matter such as wood waste and agricultural byproducts, offers a renewable and environmentally friendly alternative to fossil fuels. The significant contribution of Jiangsu (JS) and Shandong (SD) in this sector underscores their commitment to sustainable energy practices and the potential of biomass power generation in China’s energy landscape.
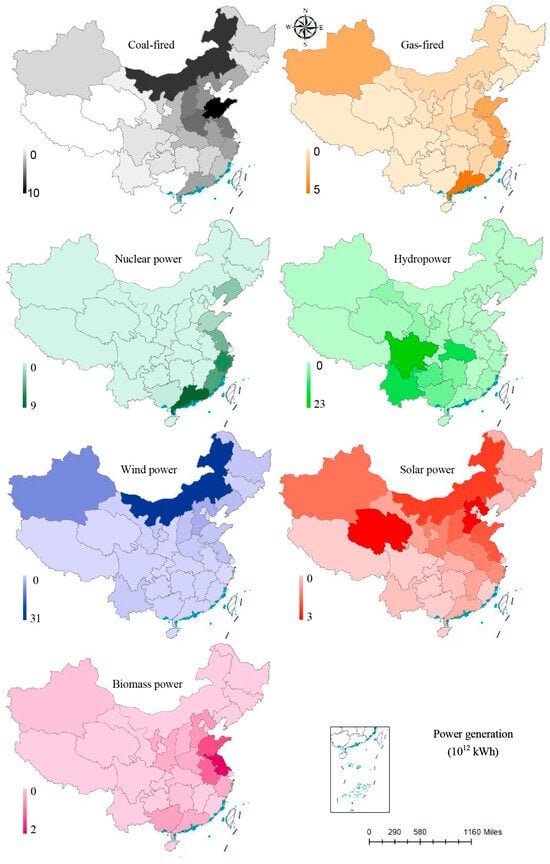
Figure 5.
Power generation by different energy conversion technologies under S1.
4.2. Inter-Provincial Electricity Transmission
Figure 6 presents a comprehensive picture of the power supply strategies implemented in all 31 provinces of China under S1. These strategies, encompassing power generation, inter-provincial electricity transmission, and import/export activities, are designed to ensure a reliable and sustainable power supply amidst growing energy demands. A notable aspect of the analysis is the projected substantial growth in national power generation over the planning period. Specifically, total electricity generation in China is expected to increase by 42.05% compared to the base year. This significant increase reflects the continuous evolution and optimization of power technologies and energy policies in the country. It underscores the effectiveness of strategic measures aimed at meeting energy demands while ensuring a dependable power supply. Among the provinces, Qinghai (QH), Inner Mongolia (IM), Guangxi (GX), and Hubei (HUB) have emerged as leaders in power generation growth. Their respective growth rates of 2.05, 1.52, 1.08, and 1.07 times compared to the base year highlight their contributions to the overall expansion of power generation in China. These provinces have leveraged their unique resources and characteristics to implement successful power supply strategies. Qinghai (QH), for instance, has capitalized on its abundant renewable energy resources, particularly hydropower and solar energy, leading to a notable increase in power generation capacity. Inner Mongolia (IM), with its vast wind resources, has established a strong presence in wind power generation, significantly contributing to its growth in this sector. Guangxi (GX), benefiting from a diverse energy mix and strategic geographical location, has expanded its power generation capacity through the development of various energy sources. Hubei (HUB), on the other hand, has achieved significant growth in power generation through the establishment of large-scale power plants, particularly in the coal and hydroelectric sectors. The growth in power generation observed in these provinces not only contributes to the overall increase in national power generation but also plays a pivotal role in meeting the energy needs of their respective regions. This growth underscores the importance of localized power supply strategies tailored to the unique characteristics and resources of each province. The substantial increase in power generation across these provinces carries profound implications for infrastructure development, capacity expansion, and strategic planning. As these provinces continue to enhance their power generation capabilities, there is a pressing need for investment to sustain and strengthen their electricity production. This investment should focus on upgrading existing infrastructure, expanding capacity, and harnessing the growth potential of renewable energy sources. Furthermore, the remarkable growth observed in Qinghai (QH), Inner Mongolia (IM), Guangxi (GX), and Hubei (HUB) positions them as potential major contributors to the national power grid. Their integration into the strategic planning of the country’s power supply is crucial to ensure a dependable and sustainable energy provision for the entire nation. This integration should involve collaboration and coordination among provinces to optimize resource allocation, minimize transmission losses, and maximize the efficiency of the national power grid.
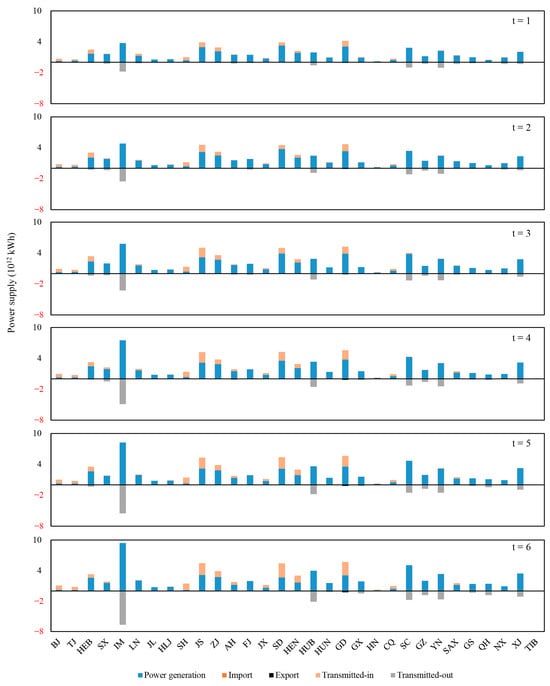
Figure 6.
Power supply scheme under scenario S1.
Figure 7 presents a detailed visual representation of the complex dynamics involved in inter-provincial electricity transmission under S1. The data reveal that several provinces, namely Inner Mongolia (IM), Hubei (HUB), Sichuan (SC), Yunnan (YN), Xinjiang (XJ), and Qinghai (QH), play pivotal roles in generating and supplying electricity to other regions. Conversely, provinces such as Guangdong (GD), Shandong (SD), Jiangsu (JS), Shanghai (SH), and Zhejiang (ZJ) are identified as major importers of electricity, highlighting their crucial position on the receiving end. A deeper analysis of these data uncovers the interconnected nature of power distribution across these regions. The extensive network facilitating the smooth functioning of the country’s power supply is evident, with ultra-high voltage (UHV) transmission lines playing a vital role. In recent years, there has been a rapid expansion of UHV lines, particularly in provinces like Inner Mongolia (IM), Shanxi (SAX), and the Northwest China grid (NWG). This development has significantly increased their power transmission capacities, especially towards the densely populated southeastern coastal areas. The shift in transmission patterns observed is a direct response to the growing power demand in these regions. It underscores the dynamic nature of power supply and demand in the country and the need for continuous adaptation and optimization of the power grid. Projections indicate a steady upward trend in total electricity transmission, with expectations of a 1.24-fold increase by the end of the planning period compared to the base year. This projected growth emphasizes the importance of enhancing power connectivity across regions to maintain a balance between power supply and demand. Achieving spatial alignment between these factors requires expanding inter-provincial and inter-regional power connectivity, establishing grid interconnections, promoting regional collaboration, and enhancing large-scale power distribution capacity. Taking a closer look at specific regions, Inner Mongolia (IM) stands out as a key player in future electricity transmission and export, driven by its abundant coal, wind, and solar resources. In contrast, the Northeast China grid (NEG) and Shandong face relatively higher fossil fuel costs, necessitating substantial electricity imports to meet their power demands. However, despite Xinjiang (XJ)’s ample power resources, the region faces challenges related to the high cost and line losses associated with long-distance UHV transmission. To address these challenges and ensure efficient utilization of power resources, policymakers should prioritize investments in transmission infrastructure. Such investments should aim to incentivize efficient electricity transmission across provinces and regions, thereby enhancing power connectivity, improving energy reliability, and fostering sustainable development in the power sector. Additionally, providing policy support for Xinjiang (XJ)’s electricity transmission is imperative to avoid squandering investments in transmission lines and contribute to the overall efficiency of the power system.
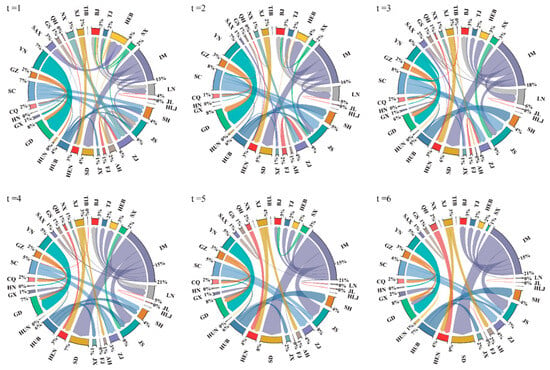
Figure 7.
Inter-provincial electricity transmission in different periods under scenario S1.
4.3. Water Withdrawal
The results presented in Figure 8 offer a comprehensive examination of water withdrawal for power generation in China over the next 30 years. A detailed analysis of the data, categorized by various scenarios, reveals notable disparities in the total volume of water withdrawal. Specifically, the volume of water withdrawal soars to an astonishing 1.96 trillion tons in S5, making it the highest among all scenarios. This is followed by S4 with 1.53 trillion tons, S3 with 1.51 trillion tons, S2 with 1.34 trillion tons, and S1 with the lowest volume of 1.22 trillion tons. A crucial observation is that, under most scenarios, the withdrawal of water for power generation is anticipated to reach its peak between 2026 and 2030. Subsequently, a downward trend is projected. However, a notable exception is the S5 scenario, wherein water withdrawal continues to escalate unchecked throughout the entire planning period. This deviation highlights the significance of considering various factors and their potential impact on water withdrawal patterns. To delve deeper into these patterns, we analyzed water withdrawal for power generation across the 31 provinces of China. Our findings unveil intriguing insights. Notably, provinces that are heavily reliant on water extraction for electricity generation are predominantly situated in the Yangtze River Basin and the coastal basin. Among these provinces, Jiangsu (JS) emerges as the top contributor, accounting for a substantial 16.79% of the overall total water withdrawal. This is closely followed by Hubei (HUB), with 8.41%, Guangdong (GD), with 8.00%, Anhui (AH), with 7.36%, Fujian (FJ), with 7.28%, and Hunan (HUN), with 6.78%. The concentration of water extraction in these provinces can be primarily attributed to the abundant reserves of fresh water in Jiangsu (JS), which extensively utilizes once-through cooling methods in its coal-fired and gas-fired power generation facilities. This underscores the need for sustainable water management strategies in power generation, particularly in regions with high water extraction. Looking ahead, our analysis reveals an expected general reduction in water consumption for power generation across all provinces during the planning period. Nevertheless, certain provinces stand out for their significant decreases. Specifically, Inner Mongolia (IM), Fujian (FJ), Jiangsu (JS), Guangdong (GD), and Anhui (AH) are projected to experience notable reductions of 83.53%, 80.82%, 78.47%, 75.26%, and 74.76%, respectively. These findings underscore the potential benefits of transitioning to a power system focused on carbon abatement, which can lead to substantial emission reductions while also conserving water resources and alleviating water stress. In light of these findings, several policy implications emerge. Firstly, it is imperative to prioritize and promote sustainable water management strategies in power generation to mitigate the environmental impact of water withdrawal. Secondly, policymakers should encourage the adoption of alternative cooling technologies, such as closed-loop systems, which can significantly reduce water consumption in power production. Finally, fostering a structural transformation of the power sector towards low-carbon technologies can yield multiple benefits, including emissions reduction, water savings, and improved water resource management. These policy measures demonstrate the multifaceted benefits of transitioning to a low-carbon power system not only for environmental sustainability but also for economic growth and social welfare.
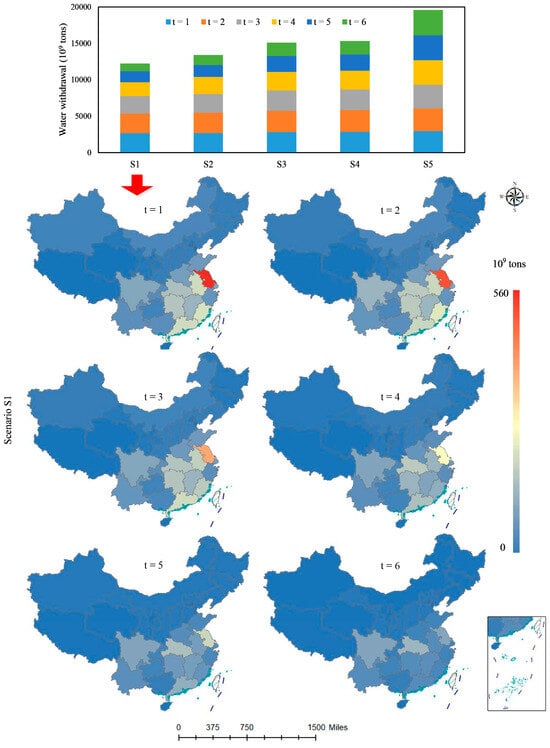
Figure 8.
Water withdrawal from power generation under different scenarios.
4.4. Carbon Emissions
Figure 9 provides a holistic view of the CO2 emissions generated by China’s electric power system across multiple scenarios, each representing distinct policy and operational frameworks. These scenarios offer invaluable insights into the country’s carbon footprint in the power sector over the coming decades. A detailed statistical breakdown reveals significant differences in projected emissions across the scenarios. Specifically, scenario S5 stands out with the highest anticipated total CO2 emissions, amounting to 142.7 billion tons. This is followed closely by scenario S4, which estimates emissions at 103.7 billion tons. In contrast, scenarios S3, S2, and S1 project relatively lower emissions, totaling 100.1 billion tons, 60.8 billion tons, and 57.5 billion tons, respectively. These figures highlight the substantial variations in emissions projections across the different scenarios. A closer examination of the trends reveals a consistent decline in CO2 emissions in scenarios S1 and S2. This decline is particularly notable, with reductions of 89.47% and 74.05%, respectively. These significant decreases suggest the potential for substantial carbon mitigation under these scenarios, likely due to the implementation of effective emission reduction policies and measures. While scenarios S3 and S4 also show a decrease in CO2 emissions, the rate of decline is relatively slower, at 47.83% and 45.39%, respectively. This slower decline can be attributed to an initial surge in emissions around the year 2030, driven primarily by increased coal power generation. However, even with this surge, the overall trend in these scenarios still points to a reduction in emissions over time. In contrast to the declining emissions observed in other scenarios, scenario S5, which lacks mandatory emission reduction policies or measures, projects a gradual increase in CO2 emissions. By the end of the planning period, emissions under this scenario are expected to rise by 18.65%. This increase underscores the critical importance of implementing robust emission reduction policies and measures to mitigate the growth of CO2 emissions.
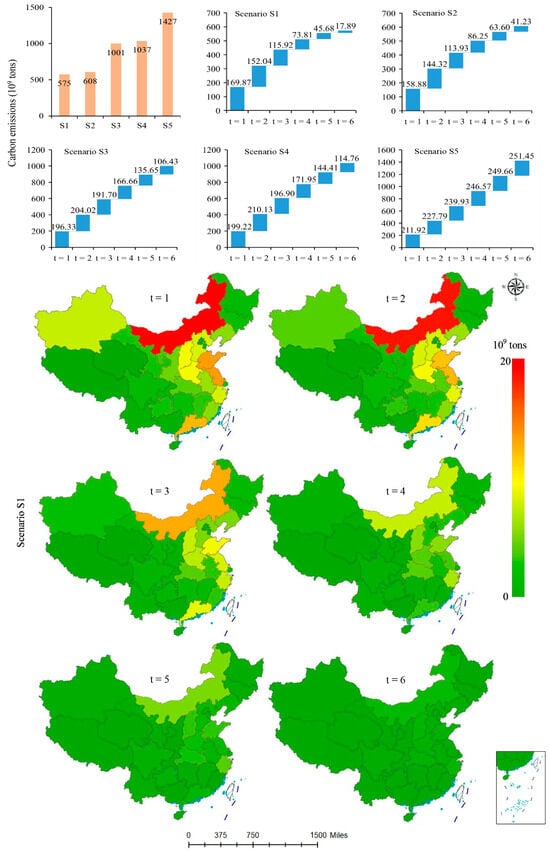
Figure 9.
CO2 emissions from power generation under different scenarios.
To gain a deeper understanding of the variations and characteristics among provinces, a more detailed analysis was conducted using scenario S1 as a case study. The results indicate that Inner Mongolia had the highest CO2 emissions, accounting for 11.75% of the national total. Shandong and Jiangsu followed closely, contributing 8.23% and 7.39% of the total emissions, respectively. Other provinces, including Zhejiang, Shanxi, and Guangdong, also made notable contributions, comprising approximately 6.86%, 6.71%, and 6.69% of the national emissions, respectively. Importantly, all provinces consistently exhibited a downward trajectory in CO2 emissions throughout the planning period. Significant reductions were observed in Inner Mongolia (IM), Jiangsu (JS), Guangdong (GD), and Shandong (SD). By 2050, these four provinces are projected to achieve substantial reductions in CO2 emissions, estimated at 1.761 billion tons, 1.286 billion tons, 1.249 billion tons, and 1.237 billion tons, respectively. These reductions can be attributed to several factors, including advancements in nuclear power technology, the increased deployment of renewable energy sources, and the successful implementation of carbon capture and storage (CCS) technology. The findings of this study have significant policy implications for China and its carbon mitigation strategies. First, they highlight the need for the widespread implementation of emission reduction policies and measures, particularly in scenarios like S5, where the absence of such policies poses a significant challenge to mitigating emissions growth. Second, the results underscore the importance of targeting provinces with high emissions, such as Inner Mongolia (IM), Shandong (SD), and Jiangsu (JS), for transitioning to cleaner energy sources and embracing CCS technology. By prioritizing these actions, China can make remarkable strides in achieving its emission reduction goals and play a leading role in the global effort to combat climate change.
4.5. Discussion
Upon comparing the BL_SGLSO model with the prevalent single-level optimization model aimed at minimizing costs, notable strengths of our proposed BL_SGLSO model became evident. Firstly, the integration of a bi-level programming approach within the BL_SGLSO model adeptly manages conflicting objectives and decision-making preferences across different levels. This allows for a more nuanced and precise optimization of the power system. Conversely, the single-level model, with its singular optimization framework, may overlook the intricate interplay and distinct regional attributes of the multi-regional electric power system. Secondly, the BL_SGLSO model leverages an interactive fuzzy algorithm to attain a maximally satisfactory overall solution. This algorithm enables decision makers to strike a harmonious balance between competing objectives and achieve a satisfactory middle ground. In contrast, the single-level model lacks a comparable mechanism for addressing conflicting objectives and decision-making preferences. In summary, the comparative analysis underscores that the BL_SGLSO model surpasses the single-level model in terms of efficiency, accuracy, and its proficiency in balancing the water-carbon trade-off within multi-regional electric power systems. These insights highlight the distinctive merits of our proposed methodology and its potential for optimizing the power system to achieve both water efficiency and low carbon emissions.
The BL_SGLSO model strives for a balanced approach between water conservation and carbon emission reduction in the multi-regional electric power system, considering the complex interplay of inter-provincial electricity transmission, water resource constraints, and carbon reduction policies. Nevertheless, it is essential to recognize the model’s underlying assumptions and limitations.
Simplified representation: The model simplifies the complex multi-regional electric power system for manageability, but this simplification may not capture all real-world intricacies.
Data availability: Its accuracy and reliability hinge heavily on data availability and quality, with potential uncertainties in energy resources, generation capacity, demand, and water resources data.
Single-objective focus: While the model prioritizes minimizing carbon emissions and costs, it does not explicitly incorporate other significant factors like social, economic, and environmental considerations.
Fixed planning period: The model assumes a fixed planning period from 2021 to 2050, divided into six 5-year intervals, without addressing future uncertainties beyond this timeframe.
Regarding the implementation of the algorithm and potential sensitivity analyses, we recognize the significance of further investigating these aspects to strengthen the methodology’s robustness. Future research could explore detailed implementation aspects, including optimization techniques and solution algorithms. Additionally, conducting sensitivity analyses under diverse scenarios and parameter variations would provide insights into the model’s robustness and reliability, aiding in its practical application and refinement.
5. Conclusions
In this study, we developed the BL_SGLSO model to strike a harmonious balance between water conservation and carbon emission reduction within China’s multi-regional electric power systems. Through bi-level programming, the model effectively navigates the preferences and conflicts of decision makers at various levels, capturing the intricacies of regional interactions and electricity transmission. Its ultimate objective is to establish a clean and low-carbon electric power system.
Our key findings indicate that under the ambitious pollution-neutral goals scenario, non-fossil energy conversion technologies are poised to become the dominant source of electricity generation, accounting for an impressive 89.34% share by 2050. To address the spatial mismatch between power demand and resource allocation, the development of new transmission pathways and the expansion of the “power transmission from west to east” initiative are crucial. Furthermore, a carbon-mitigation-oriented electric power system offers significant potential for water conservation and pressure alleviation. These insights provide invaluable guidance for decision makers seeking to optimize the multi-regional electric power system for both water efficiency and low-carbon outcomes while simultaneously promoting the adoption of renewable energy and fostering regional synergy.
While this study offers valuable insights into the synergistic optimization of multi-regional electric power systems, several promising avenues for future research emerge. Firstly, a deeper exploration of the economic implications and feasibility of implementing the proposed strategies is warranted. This could involve rigorous cost-benefit analyses and a consideration of the financial ramifications of transitioning to a clean and low-carbon electric power system. Additionally, comprehensive studies on the social and environmental impacts of these strategies are crucial for ensuring sustainable power industry development. An understanding of the broader effects on communities, ecosystems, and public health is essential. Furthermore, as technology and policy landscapes evolve, updates to the BL_SGLSO model will be necessary. Future research can focus on integrating cutting-edge technologies, such as energy storage systems and smart grids, into the optimization framework. Moreover, as policies and regulations change, the model can be adapted to reflect these updates and provide decision makers with relevant recommendations.
In conclusion, the BL_SGLSO model establishes a solid foundation for further exploring the intricate interplay between water conservation, carbon reduction, and regional electricity systems. By continuously refining and expanding upon this work, we can contribute to the advancement of sustainable and efficient electric power systems that meet both environmental and societal demands.
Author Contributions
T.L.: conceptualization, formal analysis, writing—original draft preparation, visualization; J.L.: conceptualization, investigation, formal analysis, writing—review and editing, resources; Y.L. (Yanlei Li): conceptualization, investigation, formal analysis, writing—review and editing, resources; Y.L. (Yanfeng Li): supervision, formal analysis, investigation, writing—review and editing, resources, funding acquisition. All authors have read and agreed to the published version of the manuscript.
Funding
This research was funded by the Science & Technology Project of State Power Investment Corporation Limited, Research on synergetic optimization of provincial-level interconnected power systems with “dual carbon” goal orientation, grant number 37-2023-52-Q0053, and the National Natural Science Foundation, grant number U2040212.
Data Availability Statement
The data presented in this study are available in this article.
Acknowledgments
The authors would like to thank the editor and anonymous reviewers for their contributions towards improving the quality of this paper.
Conflicts of Interest
Tao Liu, Jingru Liu was employed by Shandong Electric Power Engineering Consulting Institute Co., Ltd., and Yanlei Li was employed by State Power Investment Group Beijing Electric Power Co., Ltd. The remaining author declare that the research was conducted in the absence of any commercial or financial relationships that could be construed as a potential conflict of interest.
Nomenclature
Nomenclatures for Variables and Parameters
| Subscripts | |
| type of energy resources exploitation with = 1, 2 for raw coal and natural gas, respectively. | |
| type of energy conversion with = 1, 2, …, 9 for coal-fired power, coal-fired combined heat and power generation, natural gas-fired power, gas-fired combined heat and power generation, nuclear power, hydropower, wind power, solar power, biomass power generation, respectively. | |
| planning period with = 1, 2, …, 6 for 2021–2025, 2026–2030, 2031–2035, 2036–2040, 2041–2045, 2046–2050, respectively. | |
| provincial grid (PG) area in China with = 1, 2, …, 31 for Beijing (BJ), Tianjin (TJ), Hebei (HEB), Shanxi (SX), Inner Mongolia (IM), Liaoning (LN), Jilin (JL), Heilongjiang (HLJ), Shanghai (SH), Jiangsu (JS), Zhejiang (ZJ), Anhui (AH), Fujian (FJ), Jiangxi (JX), Shandong (SD), Henan (HEN), Hubei (HUB), Hunan (HUN), Guangdong (GD), Guangxi (GX), Hainan (HN), Chongqing (CQ), Sichuan (SC), Guizhou (GZ), Yunnan (YN), Shaanxi (SAX), Gansu (GS), Qinghai (QH), Ningxia (NX), Xinjiang (XJ), Tibet (TIB), respectively. | |
| provincial power grid area in China (the same as ). | |
| type of power end user with = 1, 2, …, 7 for agriculture, industry, construction, transportation, services, residential and other sectors, respectively. | |
| Parameters | |
| exploitation cost of energy resource in period (¥/t or ¥/108 m3). | |
| cost for electricity transmitted-in during period (¥/kWh). | |
| cost for imported electricity during period (¥/kWh). | |
| revenue of electricity transmitted-out during period (¥/kWh). | |
| revenue of exported electricity during period (¥/kWh). | |
| fixed operation and maintenance cost of conversion technology in period (¥104/104 kW). | |
| variable operation and maintenance cost of conversion technology in period (¥104/104 kWh). | |
| cost of capacity expansion for conversion technology in period (¥104/104 kW). | |
| SO2 emission factor of conversion technology in period (104 t/104 kWh). | |
| NOx emission factor of conversion technology in period (104 t/104 kWh). | |
| PM emission factor of conversion technology in period (104 t/104 kWh). | |
| CO2 emission factor of conversion technology in period (104 t/104 kWh). | |
| mitigation ratio of SO2 for end user in period (%). | |
| mitigation ratio of NOx for end user in period (%). | |
| mitigation ratio of PM for end user in period (%). | |
| mitigation ratio of CO2 for end user in period (%). | |
| mitigation cost of SO2 in period (¥/t). | |
| mitigation cost of NOx in period (¥/t). | |
| mitigation cost of PM in period (¥/t). | |
| mitigation cost of CO2 in period (¥/t). | |
| maximum capacity for exploitation of energy reource in period (104 t or 108 m3). | |
| maximum availability for hydropower of province in period (104 kW). | |
| maximum availability for photovoltaic power of province in period (104 kW). | |
| maximum availability for wind power of province in period (104 kW). | |
| energy resource consumption per unit of electricity generation for conversion technology of province in period (t or m3/kWh). | |
| the ratio of transmission loss in period (%). | |
| electricity demand for end user in period (104 kWh). | |
| maximum availability for electricity transmitted from province to province in period (104 kWh). | |
| electricity transmitted from province to province in period (104 kWh). | |
| maximum availability for imported electricity of province in period (104 kWh). | |
| maximum availability for exported electricity of province in period (104 kWh). | |
| retired capacity of conversion technology of province in period (104 kW). | |
| maximum capacity of conversion technology of province in period (104 kW). | |
| annual effective operation time of electricity conversion technology of province in period (h). | |
| amount of water resources required by per unit of energy conversion type of province in period (104 t). | |
| amount of water availability for electricity generation of province in period (104 t). | |
| limitation for SO2 emission of province in period (104 t). | |
| limitation for NOx emission of province in period (104 t). | |
| limitation for PM emission of province in period (104 t). | |
| limitation for CO2 emission of province in period (104 t). | |
| Decision variables | |
| electricity transmitted in province in period (104 kWh). | |
| electricity transmitted out of province in period (104 kWh). | |
| electricity generation amount of conversion technology for province in period (104 kWh). | |
| exploitation amount of energy resource i in period (104 t or 106 m3). | |
| imported electricity of province in period (104 kWh). | |
| exported electricity of province in period (104 kWh). | |
| installed capacity of conversion technology for province in period . | |
| expanded capacity of conversion technology for province in period . | |
References
- Yalew, S.G.; van Vliet, M.T.H.; Gernaat, D.E.H.J.; Ludwig, F.; Miara, A.; Park, C.; Byers, E.; De Cian, E.; Piontek, F.; Iyer, G.; et al. Impacts of climate change on energy systems in global and regional scenarios. Nat. Energy 2020, 5, 794–802. [Google Scholar] [CrossRef]
- Mei, H.; Li, Y.P.; Lv, J.; Chen, X.J.; Lu, C.; Suo, C.; Ma, Y. Development of an integrated method (Mgcms-sca-fer) for assessing the impacts of climate change—A case study of jing-jin-ji region. J. Environ. Inform. 2021, 38, 145–161. [Google Scholar]
- Wu, W.; Cheng, Y.; Lin, X.; Yao, X. How does the implementation of the Policy of Electricity Substitution influence green economic growth in China? Energy Policy 2019, 131, 251–261. [Google Scholar] [CrossRef]
- CEC. Electricity Industry Statistics Compilation 2020; China Electricity Council: Beijng, China, 2021. (In Chinese) [Google Scholar]
- Fan, J.L.; Hu, J.W.; Zhang, X. Impacts of climate change on electricity demand in China: An empirical estimation based on panel data. Energy 2019, 170, 880–888. [Google Scholar] [CrossRef]
- Wang, C.; Lin, L.; Olsson, G.; Liu, Y.; Xu, M. The scope and understanding of the water–electricity nexus. Resour. Conserv. Recycl. 2019, 150, 104453. [Google Scholar] [CrossRef]
- Sharifzadeh, M.; Hien, R.K.T.; Shah, N. China’s roadmap to low-carbon electricity and water: Disentangling greenhouse gas (GHG) emissions from electricity-water nexus via renewable wind and solar power generation, and carbon capture and storage. Appl. Energy 2019, 235, 31–42. [Google Scholar] [CrossRef]
- Tang, B.; Li, R.; Yu, B.; An, R.; Wei, Y.-M. How to peak carbon emissions in China’s power sector: A regional perspective. Energy Policy 2018, 120, 365–381. [Google Scholar] [CrossRef]
- Zhao, Y.; Cao, Y.; Shi, X.; Wang, S.; Yang, H.; Shi, L.; Li, H.; Zhang, J. Critical transmission paths and nodes of carbon emissions in electricity supply chain. Sci. Total Environ. 2021, 755, 142530. [Google Scholar] [CrossRef]
- Chen, L.; Wemhoff, A.P. Predicting embodied carbon emissions from purchased electricity for United States counties. Appl. Energy 2021, 292, 116898. [Google Scholar] [CrossRef]
- Wei, Z.X.; He, Y.Y.; Liu, G.Q.; Zhou, P. Spatial network analysis of carbon emissions from the electricity sector in China. J. Clean. Prod. 2020, 262, 121193. [Google Scholar]
- Cai, W.; Song, X.; Zhang, P.; Xin, Z.; Zhou, Y.; Wang, Y.; Wei, W. Carbon emissions and driving forces of an island economy: A case study of Chongming Island, China. J. Clean. Prod. 2020, 254, 120028. [Google Scholar] [CrossRef]
- Wang, F.; Shackman, J.; Liu, X. Carbon emission flow in the power industry and provincial CO2 emissions: Evidence from cross-provincial secondary energy trading in China. J. Clean. Prod. 2017, 159, 397–409. [Google Scholar] [CrossRef]
- Li, Y.; Lukszo, Z.; Weijnen, M. The impact of inter-regional transmission grid expansion on China’s power sector decarbonization. Appl. Energy 2016, 183, 853–873. [Google Scholar] [CrossRef]
- Ji, B.N.; Zhang, Y.G. Few-shot relation extraction model based on attention mechanism induction network. J. Jilin Univ. Sci. Ed. 2023, 61, 845–852. [Google Scholar]
- Han, K.X.; Yuan, S.F. Short text semantic similarity measurement algorithm based on hybrid machine learning model. J. Jilin Univ. Sci. Ed. 2023, 61, 909–914. [Google Scholar]
- Jin, Y.; Behrens, P.; Tukker, A.; Scherer, L. The energy-water nexus of China’s interprovincial and seasonal electric power transmission. Appl. Energy 2021, 286, 116493. [Google Scholar] [CrossRef]
- Zhang, C.; He, G.; Zhang, Q.; Liang, S.; Zipper, S.C.; Guo, R.; Zhao, X.; Zhong, L.J.; Wang, J. The evolution of virtual water flows in China’s electricity transmission network and its driving forces. J. Clean. Prod. 2020, 242, 118336. [Google Scholar] [CrossRef]
- Liu, L.; Yin, Z.; Wang, P.; Gan, Y.; Liao, X. Water-carbon trade-off for inter-provincial electricity transmissions in China. J. Environ. Manag. 2020, 268, 110719. [Google Scholar] [CrossRef]
- Zhang, C.; He, G.; Johnston, J.; Zhong, L. Long-term transition of China’s power sector under carbon neutrality target and water withdrawal constraint. J. Clean. Prod. 2021, 329, 129765. [Google Scholar] [CrossRef]
- Zhang, C.; Zhong, L.; Wang, J. Decoupling between water use and thermoelectric power generation growth in China. Nat. Energy 2018, 3, 792–799. [Google Scholar] [CrossRef]
- Zhang, C.; Zhong, L.; Liang, S.; Sanders, K.T.; Wang, J.; Xu, M. Virtual scarce water embodied in inter-provincial electricity transmission in China. Appl. Energy 2017, 187, 438–448. [Google Scholar] [CrossRef]
- Tang, B.; Wu, Y.; Yu, B.; Li, R.; Wang, X. Co-current analysis among electricity-water-carbon for the power sector in China. Sci. Total Environ. 2020, 745, 141005. [Google Scholar] [CrossRef]
- Tang, B.J.; Li, R.; Yu, B.; Wei, Y.M. Spatial and temporal uncertainty in the technological pathway towards a low-carbon power industry: A case study of China. J. Clean. Prod. 2019, 230, 720–733. [Google Scholar] [CrossRef]
- Li, Y.F.; Li, Y.P.; Huang, G.H.; Zheng, R.B. Inter-provincial electricity trading and its effects on carbon emissions from the power industry. Energies 2022, 15, 3601. [Google Scholar] [CrossRef]
- Guo, Z.; Ma, L.; Liu, P.; Jones, I.; Li, Z. A long-term multi-region load-dispatch model based on grid structures for the optimal planning of China’s power sector. Comput. Chem. Eng. 2017, 102, 52–63. [Google Scholar] [CrossRef]
- Guo, Z.; Cheng, R.; Xu, Z.; Liu, P.; Wang, Z.; Li, Z.; Jones, I.; Sun, Y. A multi-region load dispatch model for the long-term optimum planning of China’s electricity sector. Appl. Energy 2017, 185 Pt 1, 556–572. [Google Scholar] [CrossRef]
- Ye, M.; Cai, W.; Wang, C. A Multi-Period Multi-Region Optimization Model of China’s Power Sector Considering Synergetic CO2 and Air Pollutants Control. Procedia Environ. Sci. 2013, 18, 397–403. [Google Scholar] [CrossRef]
- Chen, W.; Li, H.; Wu, Z. Western China energy development and west to east energy transfer: Application of the Western China Sustainable Energy Development Model. Energy Policy 2010, 38, 7106–7120. [Google Scholar] [CrossRef]
- Zhu, F.; Zheng, Y.; Guo, X.; Wang, S. Environmental impacts and benefits of regional power grid interconnections for China. Energy Policy 2005, 33, 1797–1805. [Google Scholar] [CrossRef]
- Streets, D.G. Environmental benefits of electricity grid interconnections in Northeast Asia. Energy 2003, 28, 789–807. [Google Scholar] [CrossRef]
- Parikh, J.; Chattopadhyay, D. A multi-area linear programming approach for analysis of economic operation of the Indian power system. IEEE Trans. Power Syst. 1996, 11, 52–58. [Google Scholar] [CrossRef]
- Rogers, J.S.; Rowse, J.G. Canadian interregional electricity trade: Analysing the gains from system integration during 1990–2020. Energy Econ. 1989, 11, 105–118. [Google Scholar] [CrossRef]
- Nan, J.; Feng, J.; Deng, X.; Guan, L.; Sun, K.; Zhou, H. A two-stage robust generation expansion planning framework for regional integrated energy systems with carbon growth constraints. Front. Energy Res. 2023, 11, 1106628. [Google Scholar] [CrossRef]
- Huan, J.; Ding, Q.; Yu, T.; Cheng, Y. Multi-stage low-carbon planning of an integrated energy system considering demand response. Front. Energy Res. 2023, 11, 1259067. [Google Scholar] [CrossRef]
- Hoster, F. Effects of a European electricity market on the German electricity industry: Results from a simulation model of the European power systems. Appl. Econ. 1999, 31, 107–122. [Google Scholar] [CrossRef]
- Chen, Q.; Kang, C.; Ming, H.; Wang, Z.; Xia, Q.; Xu, G. Assessing the low-carbon effects of inter-regional energy delivery in China’s electricity sector. Renew. Sustain. Energy Rev. 2014, 32 (Suppl. C), 671–683. [Google Scholar] [CrossRef]
- Wang, C.; Ye, M.; Cai, W.; Chen, J. The value of a clear, long-term climate policy agenda: A case study of China’s power sector using a multi-region optimization model. Appl. Energy 2014, 125, 276–288. [Google Scholar] [CrossRef]
- Cheng, R.; Xu, Z.; Liu, P.; Wang, Z.; Li, Z.; Jones, I. A multi-region optimization planning model for China’s power sector. Appl. Energy 2015, 137, 413–426. [Google Scholar] [CrossRef]
- Guo, Z.; Liu, P.; Ma, L.; Li, Z. A grid-structure based multi-region optimisation model for the development of power generation sector in China. Chem. Eng. Trans. 2015, 45, 439–444. [Google Scholar]
- Guo, Z.; Liu, P.; Ma, L.; Li, Z. Effects of Low-Carbon Technologies and End-Use Electrification on Energy-Related Greenhouse Gases Mitigation in China by 2050. Energies 2015, 8, 7161–7184. [Google Scholar] [CrossRef]
- Guo, Z.; Ma, L.; Liu, P.; Jones, I.; Li, Z. A multi-regional modelling and optimization approach to China’s power generation and transmission planning. Energy 2016, 116 Pt 2, 1348–1359. [Google Scholar] [CrossRef]
- Koeva, D.; Kutkarska, R.; Zinoviev, V. High Penetration of Renewable Energy Sources and Power Market Formation for Countries in Energy Transition: Assessment via Price Analysis and Energy Forecasting. Energies 2023, 16, 7788. [Google Scholar] [CrossRef]
- Pratama, Y.W.; Purwanto, W.W.; Tezuka, T.; McLellan, B.C.; Hartono, D.; Hidayatno, A.; Daud, Y. Multi-objective optimization of a multiregional electricity system in an archipelagic state: The role of renewable energy in energy system sustainability. Renew. Sustain. Energy Rev. 2017, 77, 423–439. [Google Scholar] [CrossRef]
- Zhang, K.; Zhang, Y.; Xi, S.; Liu, J.; Li, J.; Hou, S.; Chen, B. Multi-objective optimization of energy-water nexus from spatial resource reallocation perspective in China. Appl. Energy 2022, 314, 118919. [Google Scholar] [CrossRef]
- Rasool, M.H.; Taylan, O.; Perwez, U.; Batunlu, C. Comparative assessment of multi-objective optimization of hybrid energy storage system considering grid balancing. Renew. Energy 2023, 216, 119107. [Google Scholar] [CrossRef]
- Huang, K.; Fan, Y.R. Parameter uncertainty and sensitivity evaluation of copula-based multivariate hydroclimatic risk assessment. J. Environ. Inform. 2021, 38, 131–144. [Google Scholar] [CrossRef]
- Ma, Y.; Li, Y.P.; Huang, G.H. A bi-level chance-constrained programming method for quantifying the effectiveness of water-trading to water-food-ecology nexus in Amu Darya River basin of Central Asia. Environ. Res. 2020, 183, 109229. [Google Scholar] [CrossRef]
- Li, Z.; Li, J.J.; Shi, X.P. A two-stage multisite and multivariate weather generator. J. Environ. Inform. 2020, 35, 148–159. [Google Scholar] [CrossRef]
- Lv, J.; Li, Y.P.; Huang, G.H.; Suo, C.; Mei, H.; Li, Y. Quantifying the impact of water availability on China’s energy system under uncertainties: A perceptive of energy-water nexus. Renew. Sustain. Energy Rev. 2020, 134, 110321. [Google Scholar] [CrossRef]
- Jian, Q.; Liu, X.; Du, X.; Zhang, Y.; Wang, N.; Sun, Y. Robust Bi-Level Planning Method for Multi-Source Systems Integrated With Offshore Wind Farms Considering Prediction Errors. Front. Energy Res. 2022, 10, 884886. [Google Scholar] [CrossRef]
- Du, Y.; Xue, Y.; Lu, L.; Yu, C.; Zhang, J. A bi-level co-expansion planning of integrated electric and heating system considering demand response. Front. Energy Res. 2022, 10, 999948. [Google Scholar] [CrossRef]
- Lv, J.; Li, Y.P.; Huang, G.H.; Nie, S.; Gong, J.W.; Ma, Y.; Li, Y. Synergetic management of energy-water nexus system under uncertainty: An interval bi-level joint-probabilistic programming method. J. Clean. Prod. 2021, 292, 125942. [Google Scholar] [CrossRef]
- Gong, J.W.; Li, Y.P.; Lv, J.; Huang, G.H.; Suo, C.; Gao, P.P. Development of an integrated bi-level model for China’s multi-regional energy system planning under uncertainty. Appl. Energy 2022, 308, 118299. [Google Scholar] [CrossRef]
- Nasiri, N.; Mansour Saatloo, A.; Mirzaei, M.A.; Ravadanegh, S.N.; Zare, K.; Mohammadi-ivatloo, B.; Marzband, M. A robust bi-level optimization framework for participation of multi-energy service providers in integrated power and natural gas markets. Appl. Energy 2023, 340, 121047. [Google Scholar] [CrossRef]
- Yildirim, B.; Razmi, P.; Fathollahi, A.; Gheisarnejad, M.; Khooban, M.H. Neuromorphic deep learning frequency regulation in stand-alone microgrids. Appl. Soft Comput. 2023, 144, 110418. [Google Scholar] [CrossRef]
- Gaur, L.; Afaq, A.; Arora, G.K.; Khan, N. Artificial intelligence for carbon emissions using system of systems theory. Ecol. Inform. 2023, 76, 102165. [Google Scholar] [CrossRef]
- Fathollahi, A.; Gheisarnejad, M.; Boudjadar, J.; Homayounzadeh, M.; Khooban, M.H. Optimal Design of Wireless Charging Electric Buses-Based Machine Learning: A Case Study of Nguyen-Dupuis Network. IEEE Trans. Veh. Technol. 2023, 72, 8449–8458. [Google Scholar] [CrossRef]
- NBS. China Energy Statistical Yearbook 2006–2020; National Bureau of Statistics, People’s Republic of China, China Statistics Press: Beijing, China, 2006–2020. (In Chinese) [Google Scholar]
- CEC. Electricity Industry Statistics Compilation 2005–2019; China Electricity Council: Beijng, China, 2006–2020. (In Chinese) [Google Scholar]
- CEC. Annual Development Report of China’s Power Industry 2020; China Electricity Council: Beijng, China, 2020. (In Chinese) [Google Scholar]
- Cheng, J.; Tong, D.; Zhang, Q.; Liu, Y.; Lei, Y.; Yan, G.; Yan, L.; Yu, S.; Cui, R.Y.; Clarke, L.; et al. Pathways of China’s PM2.5 air quality 2015–2060 in the context of carbon neutrality. Natl. Sci. Rev. 2021, 8, nwab078. [Google Scholar] [CrossRef]
- Tong, D.; Cheng, J.; Liu, Y.; Yu, S.; Yan, L.; Hong, C.; Qin, Y.; Zhao, H.; Zheng, Y.; Geng, G.; et al. Dynamic projection of anthropogenic emissions in China: Methodology and 2015–2050 emission pathways under a range of socio-economic, climate policy, and pollution control scenarios. Atmos. Chem. Phys. 2020, 20, 5729–5757. [Google Scholar] [CrossRef]

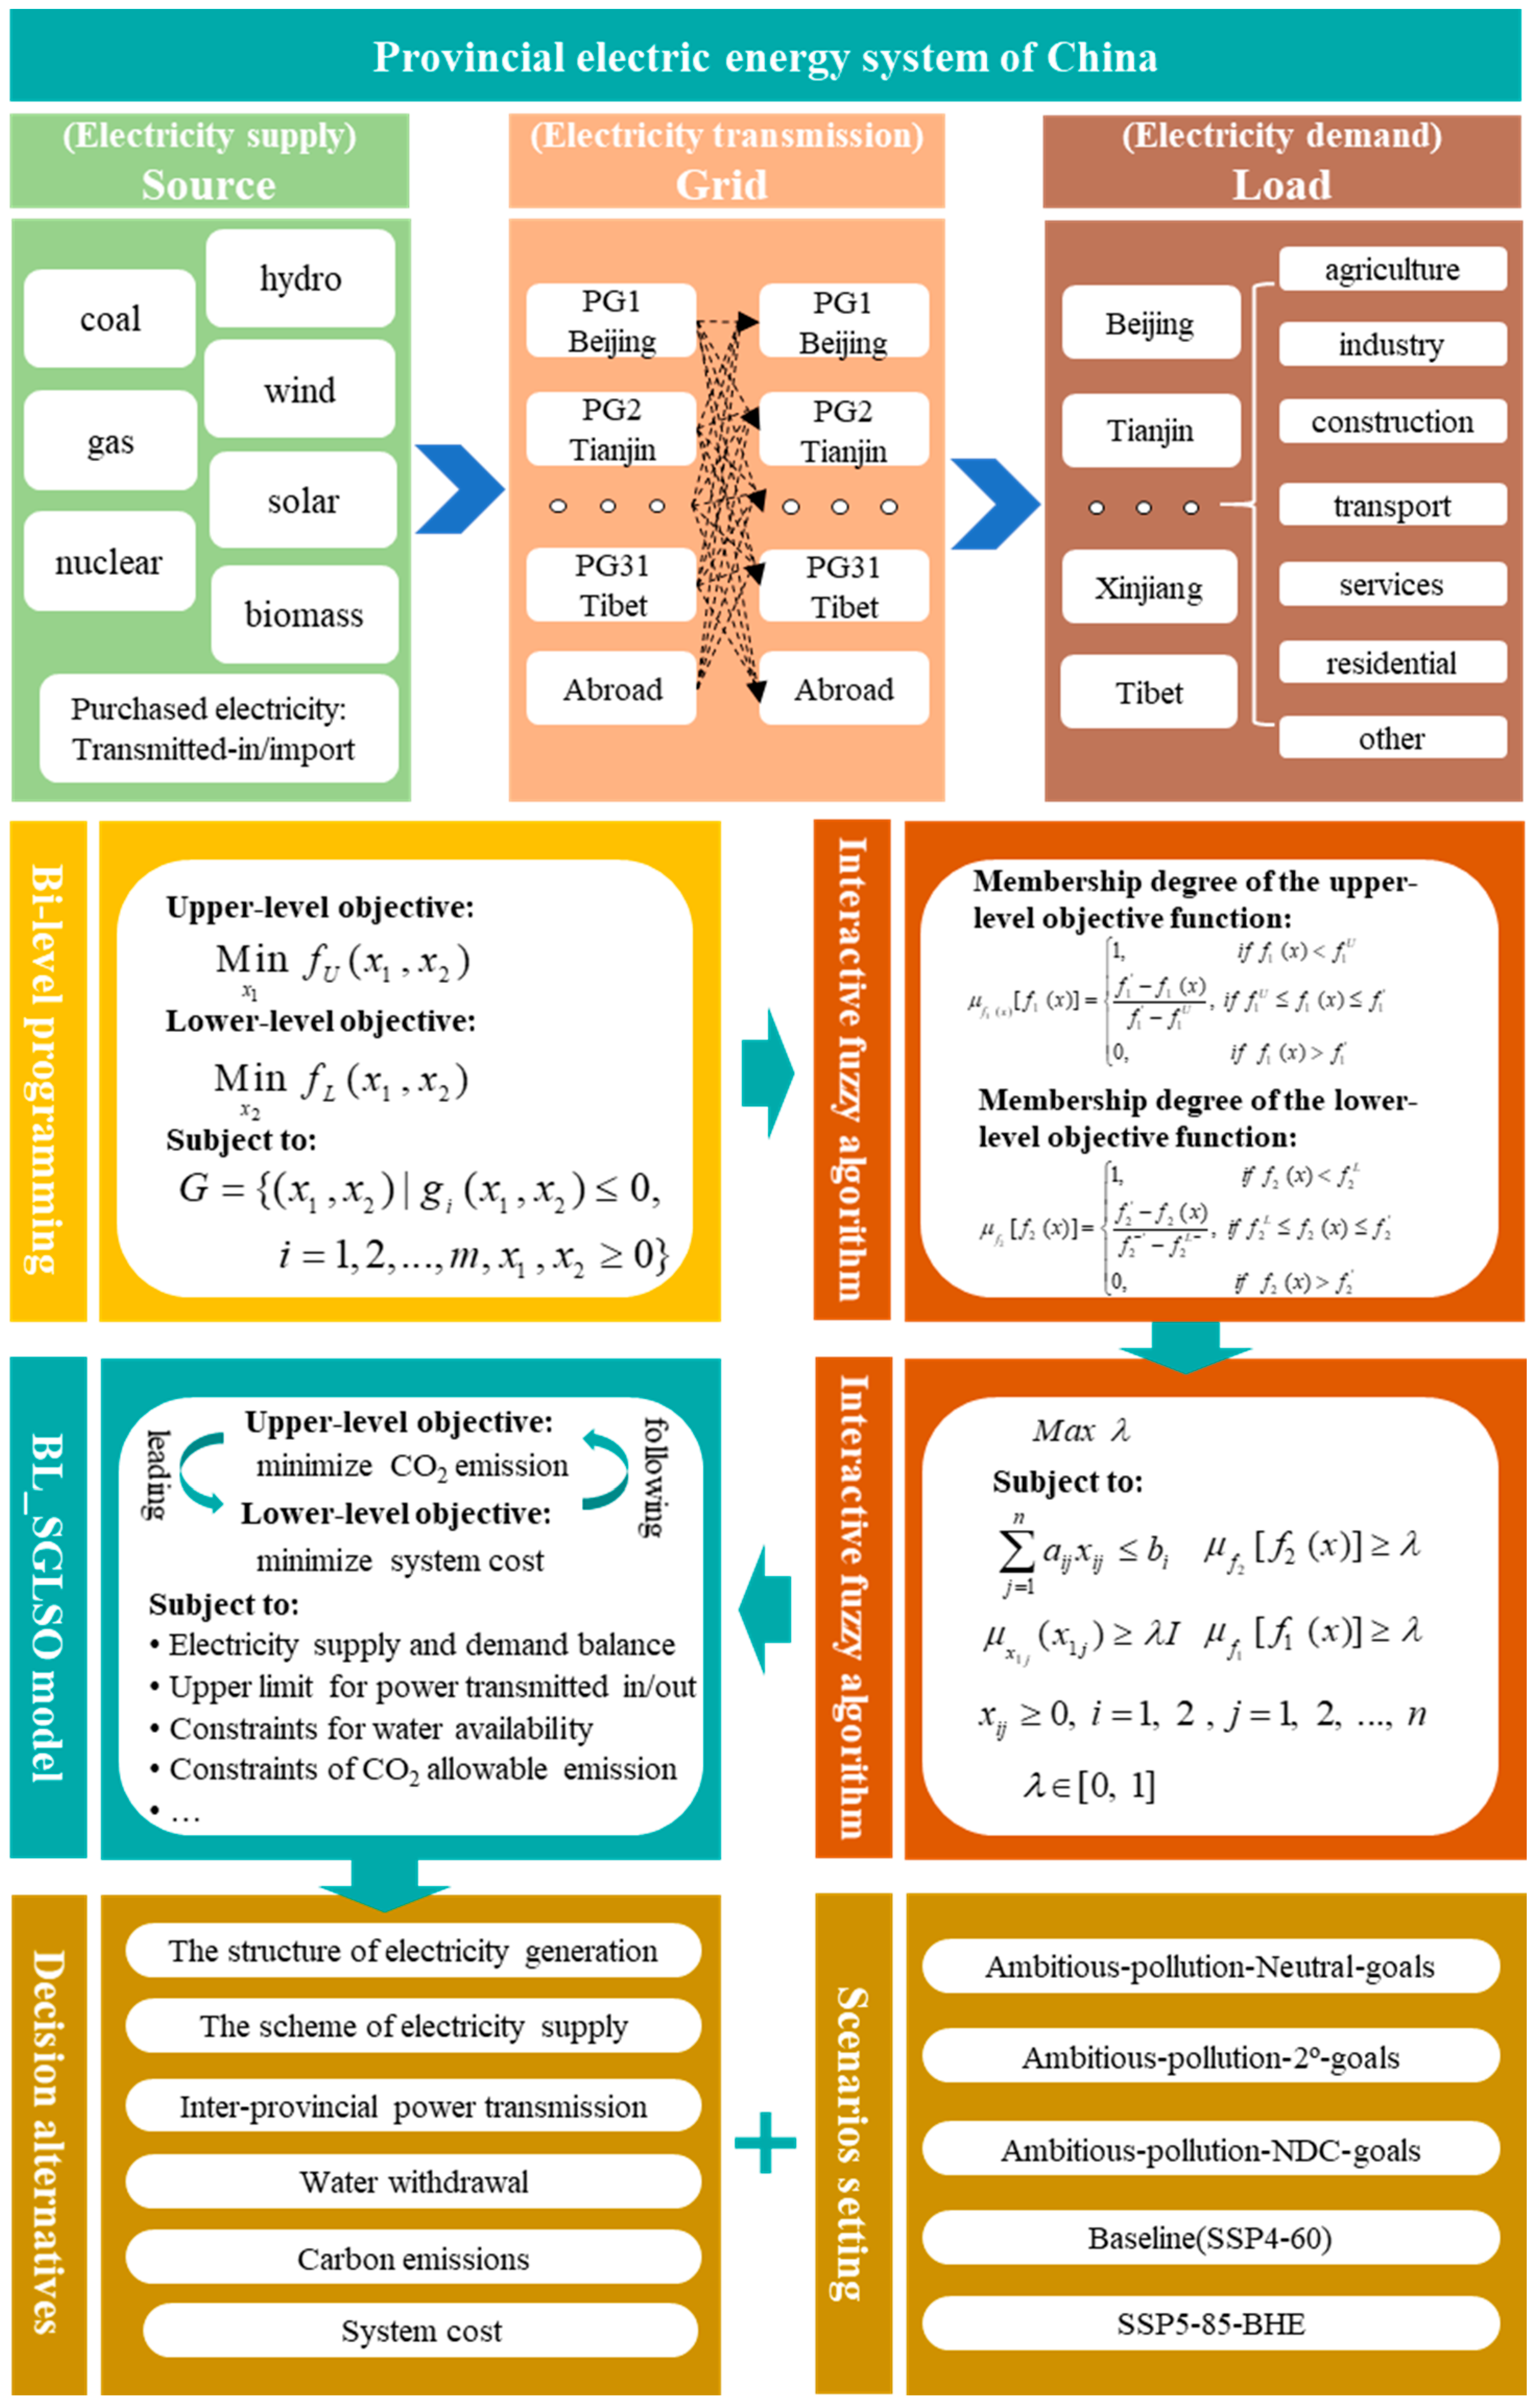

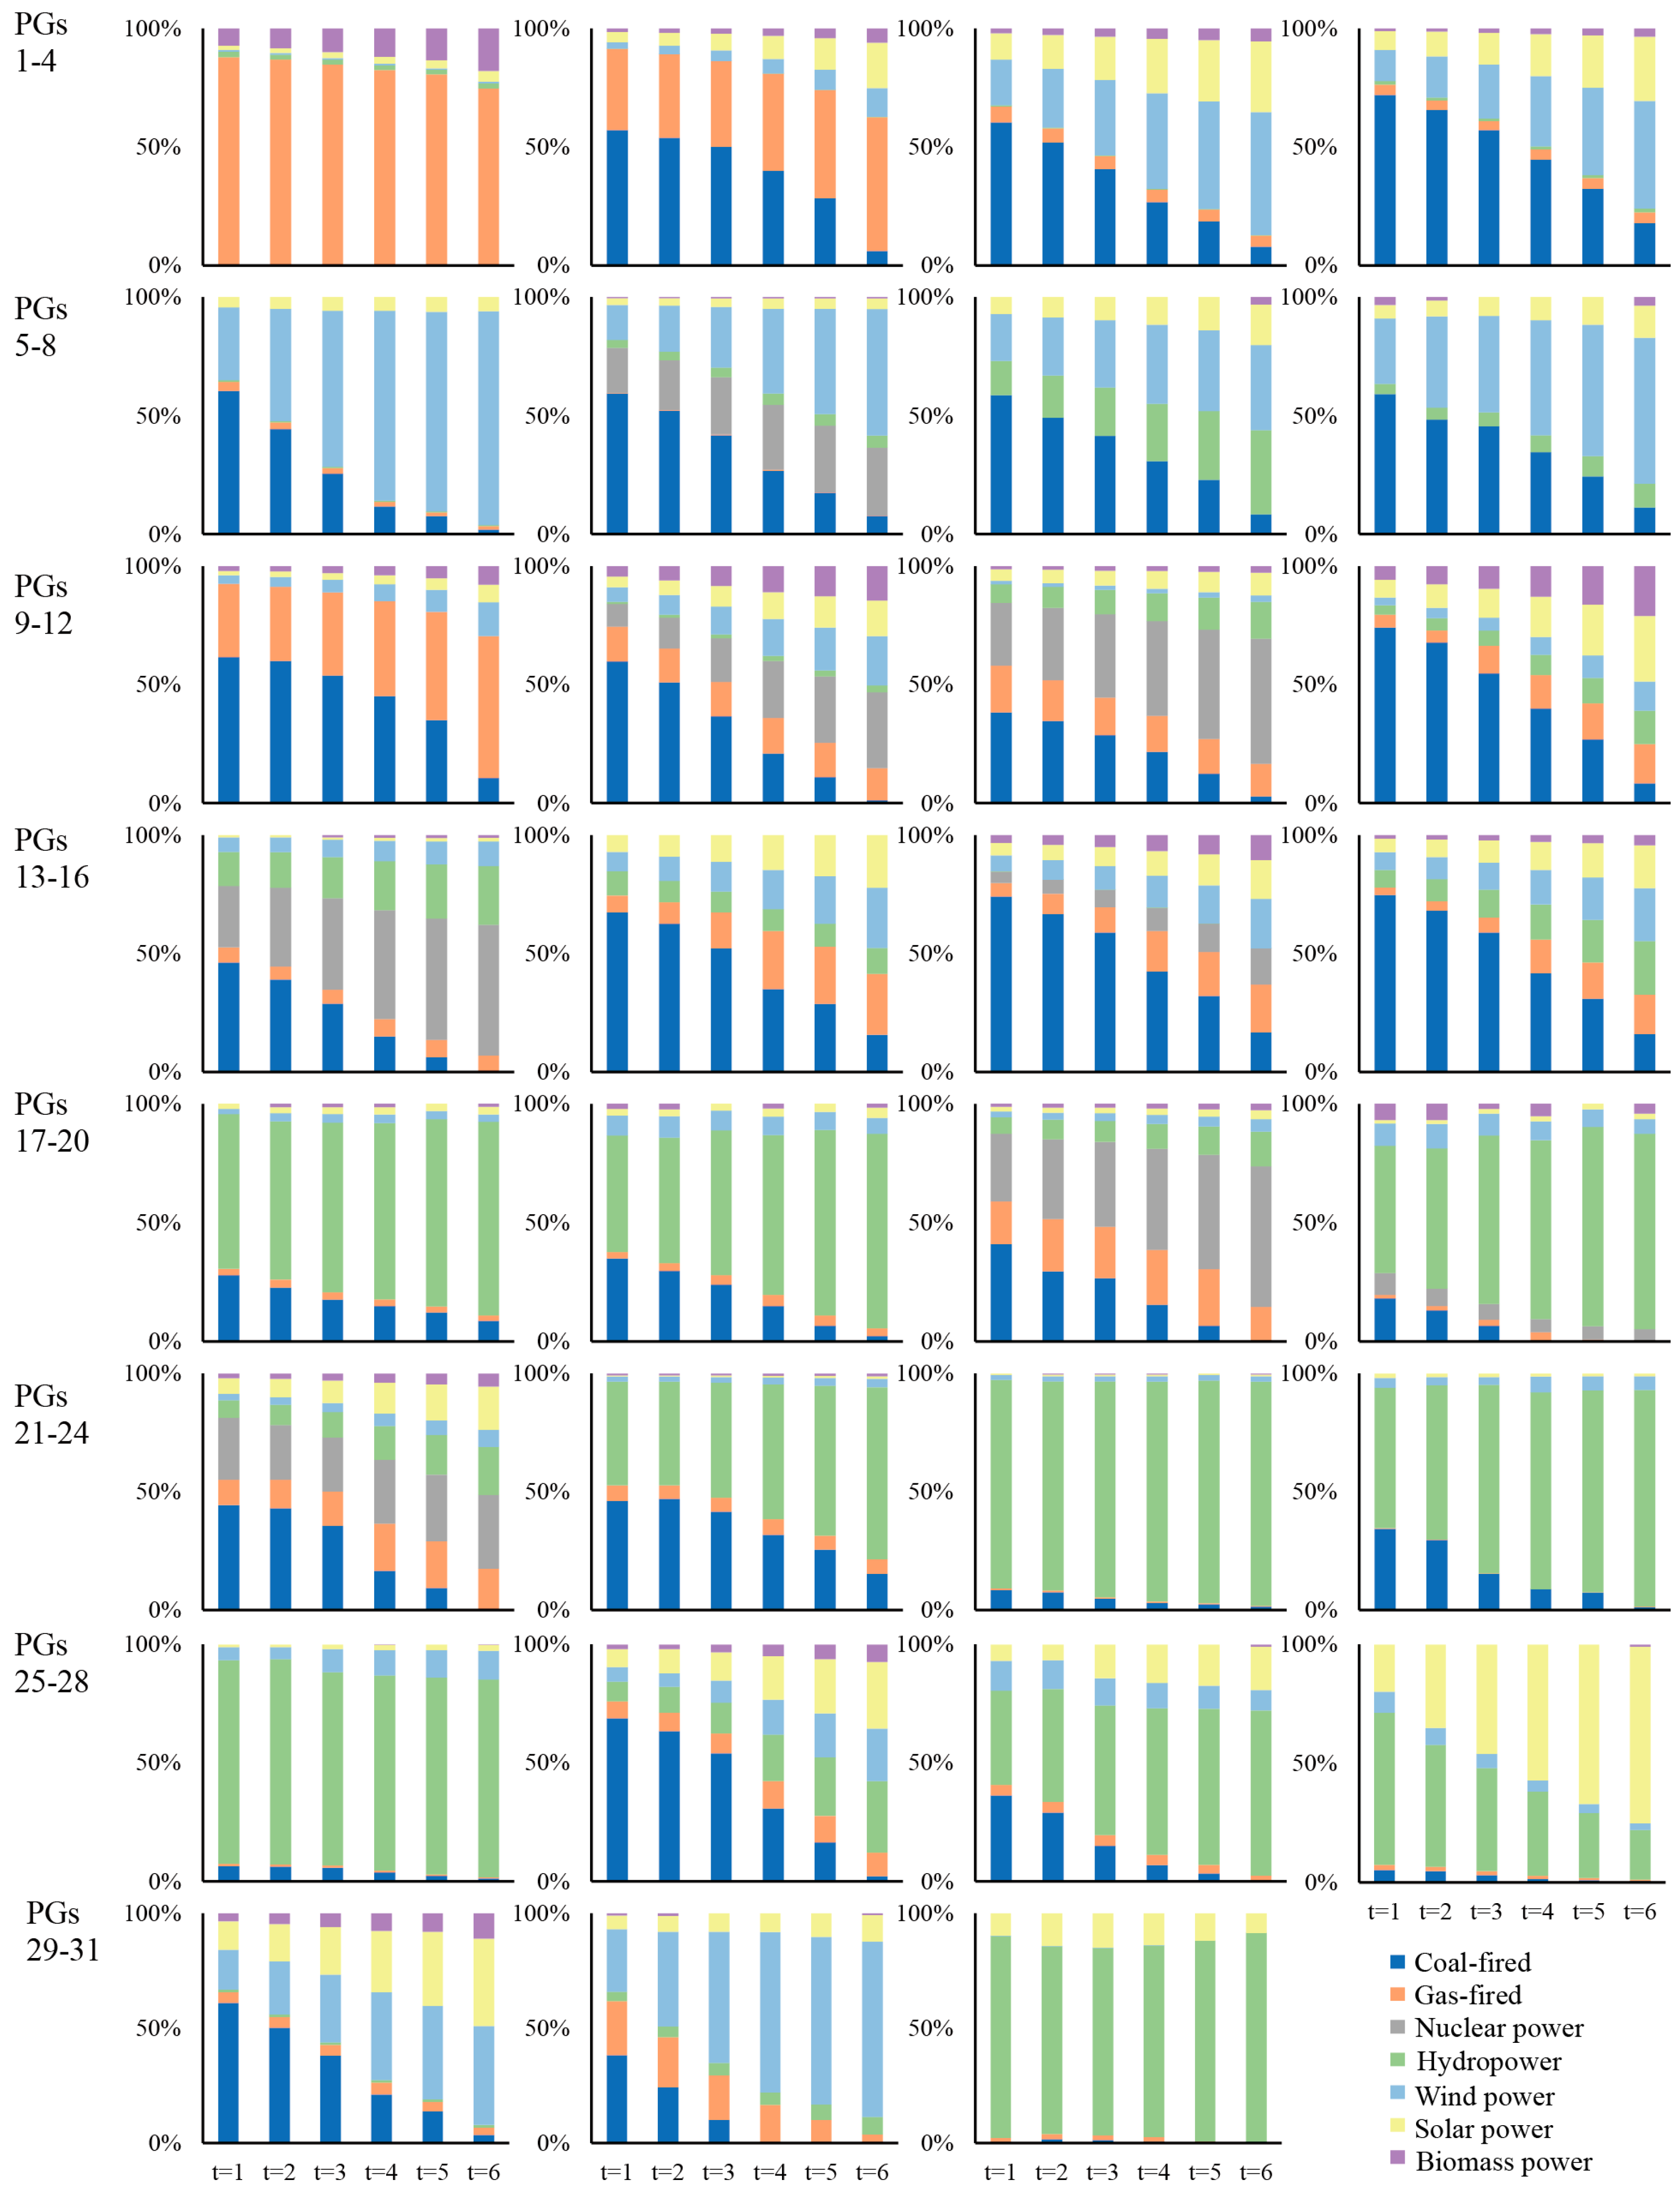
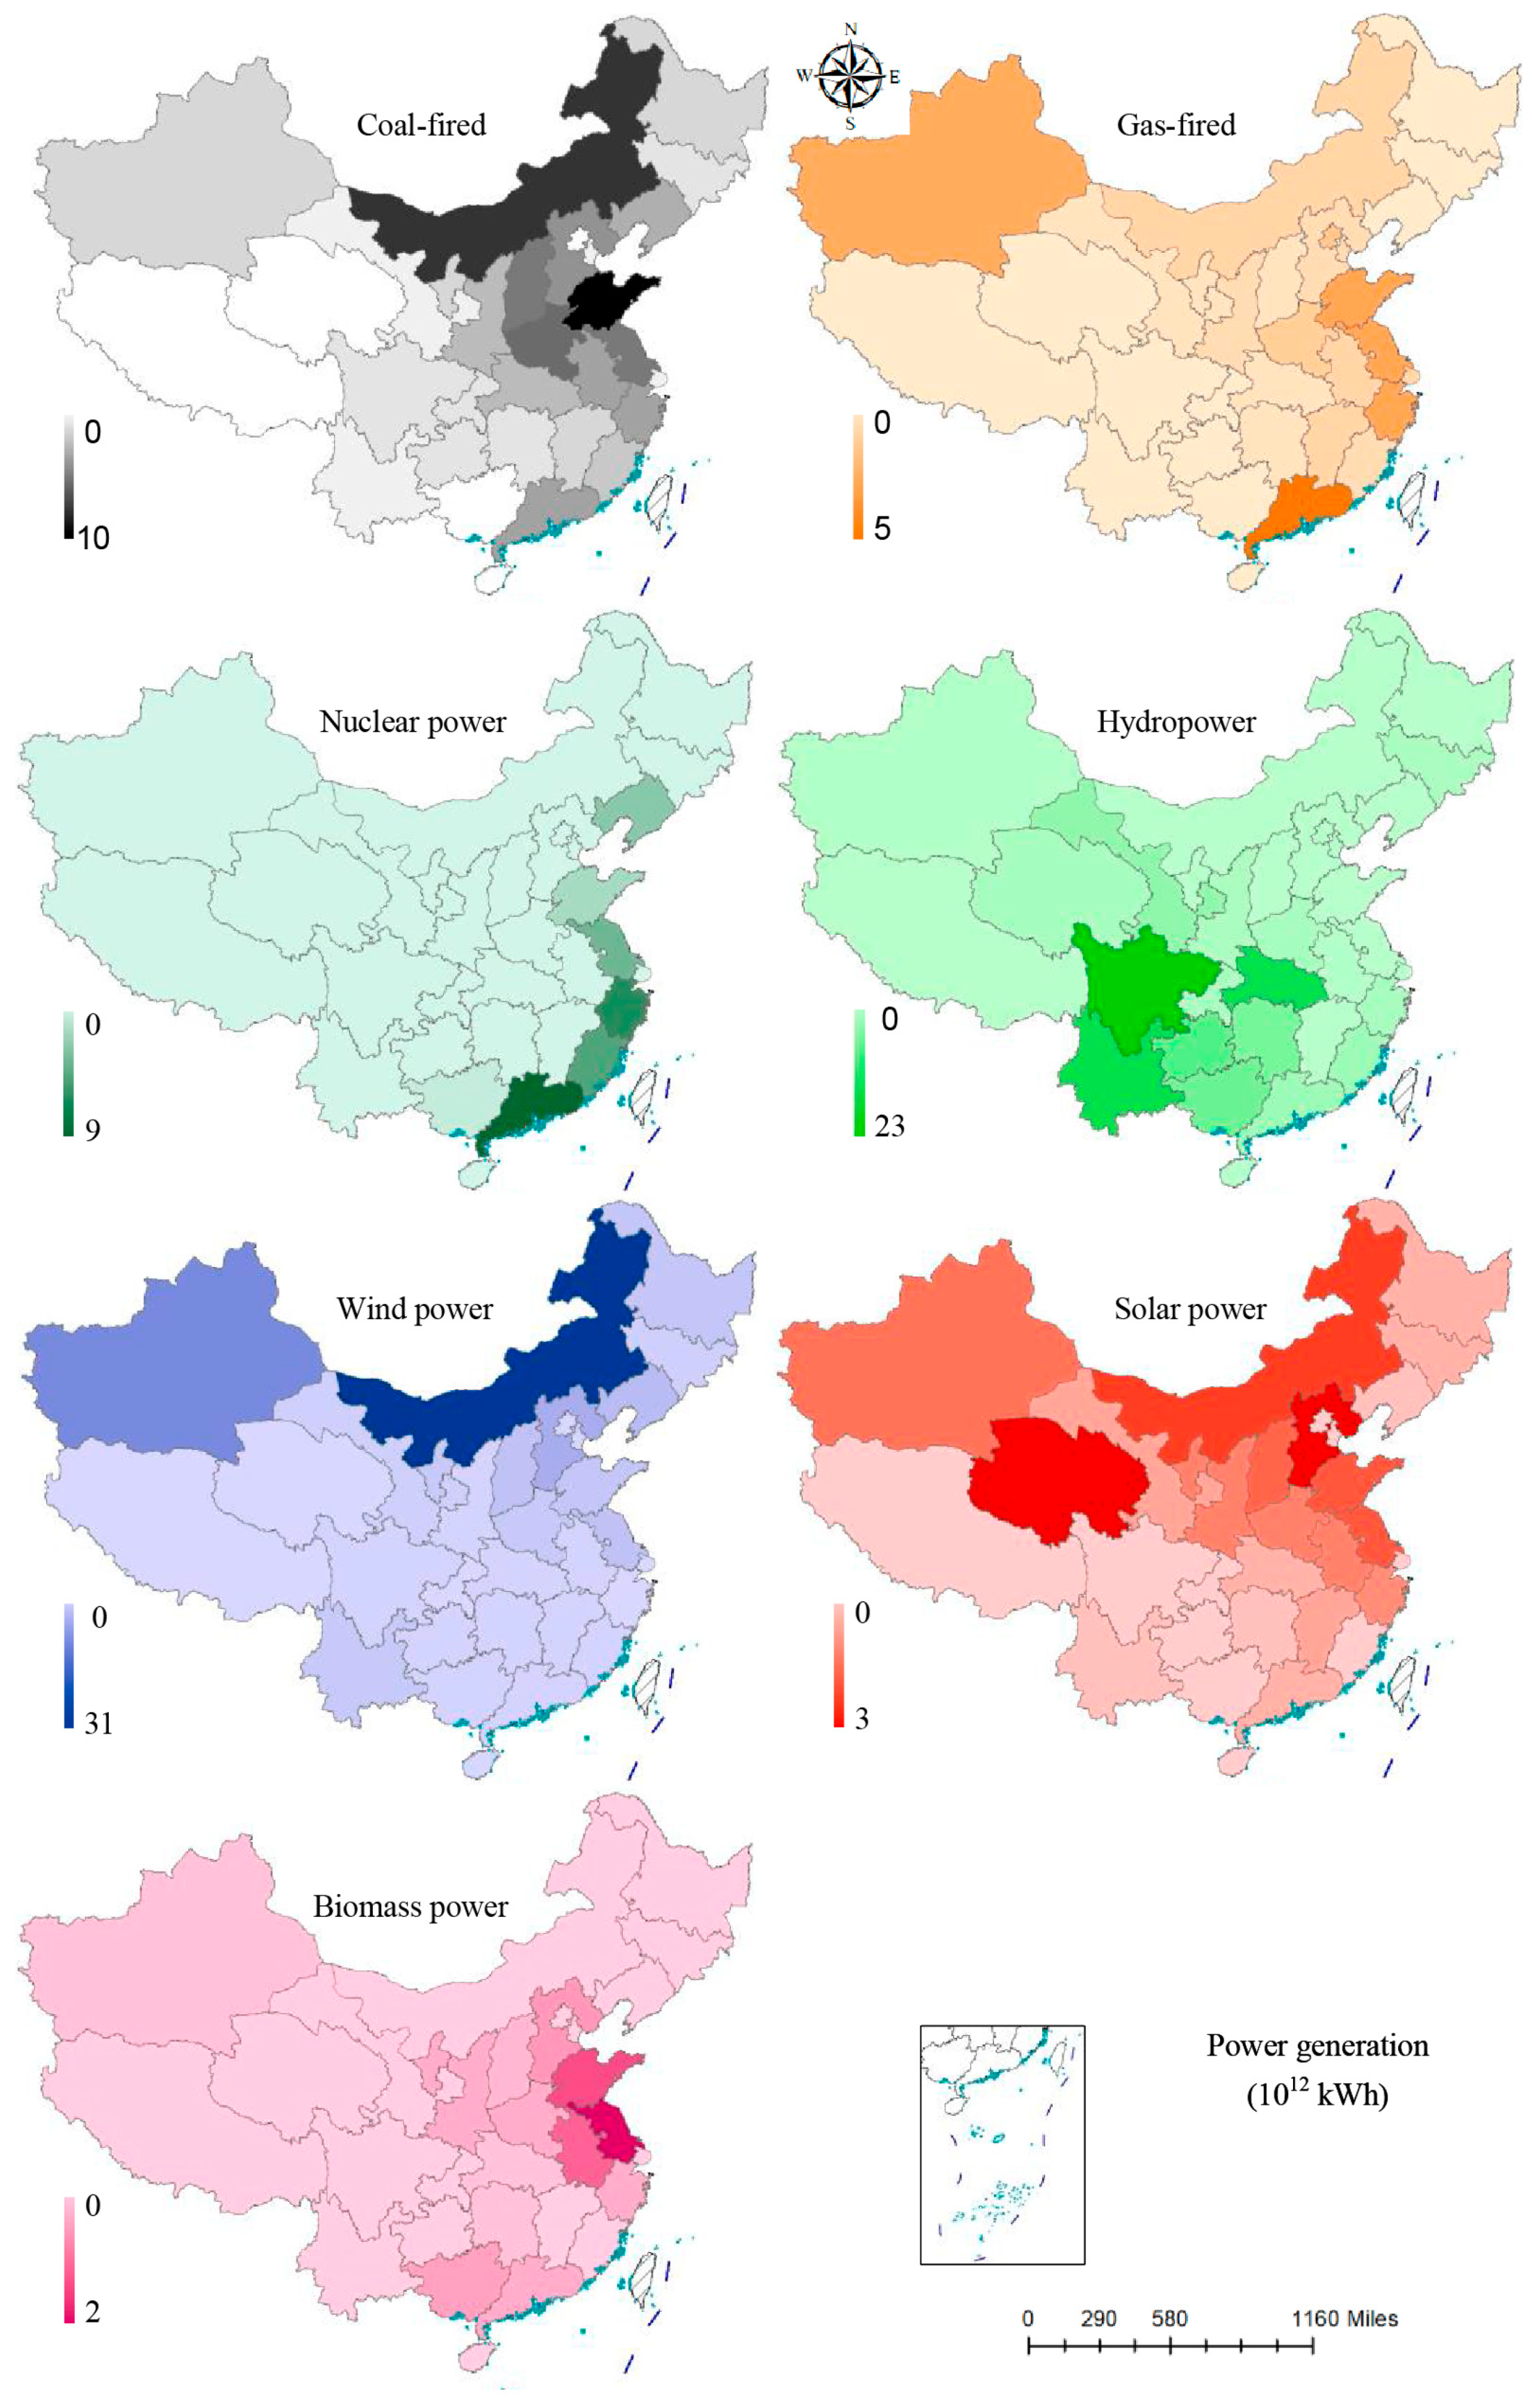
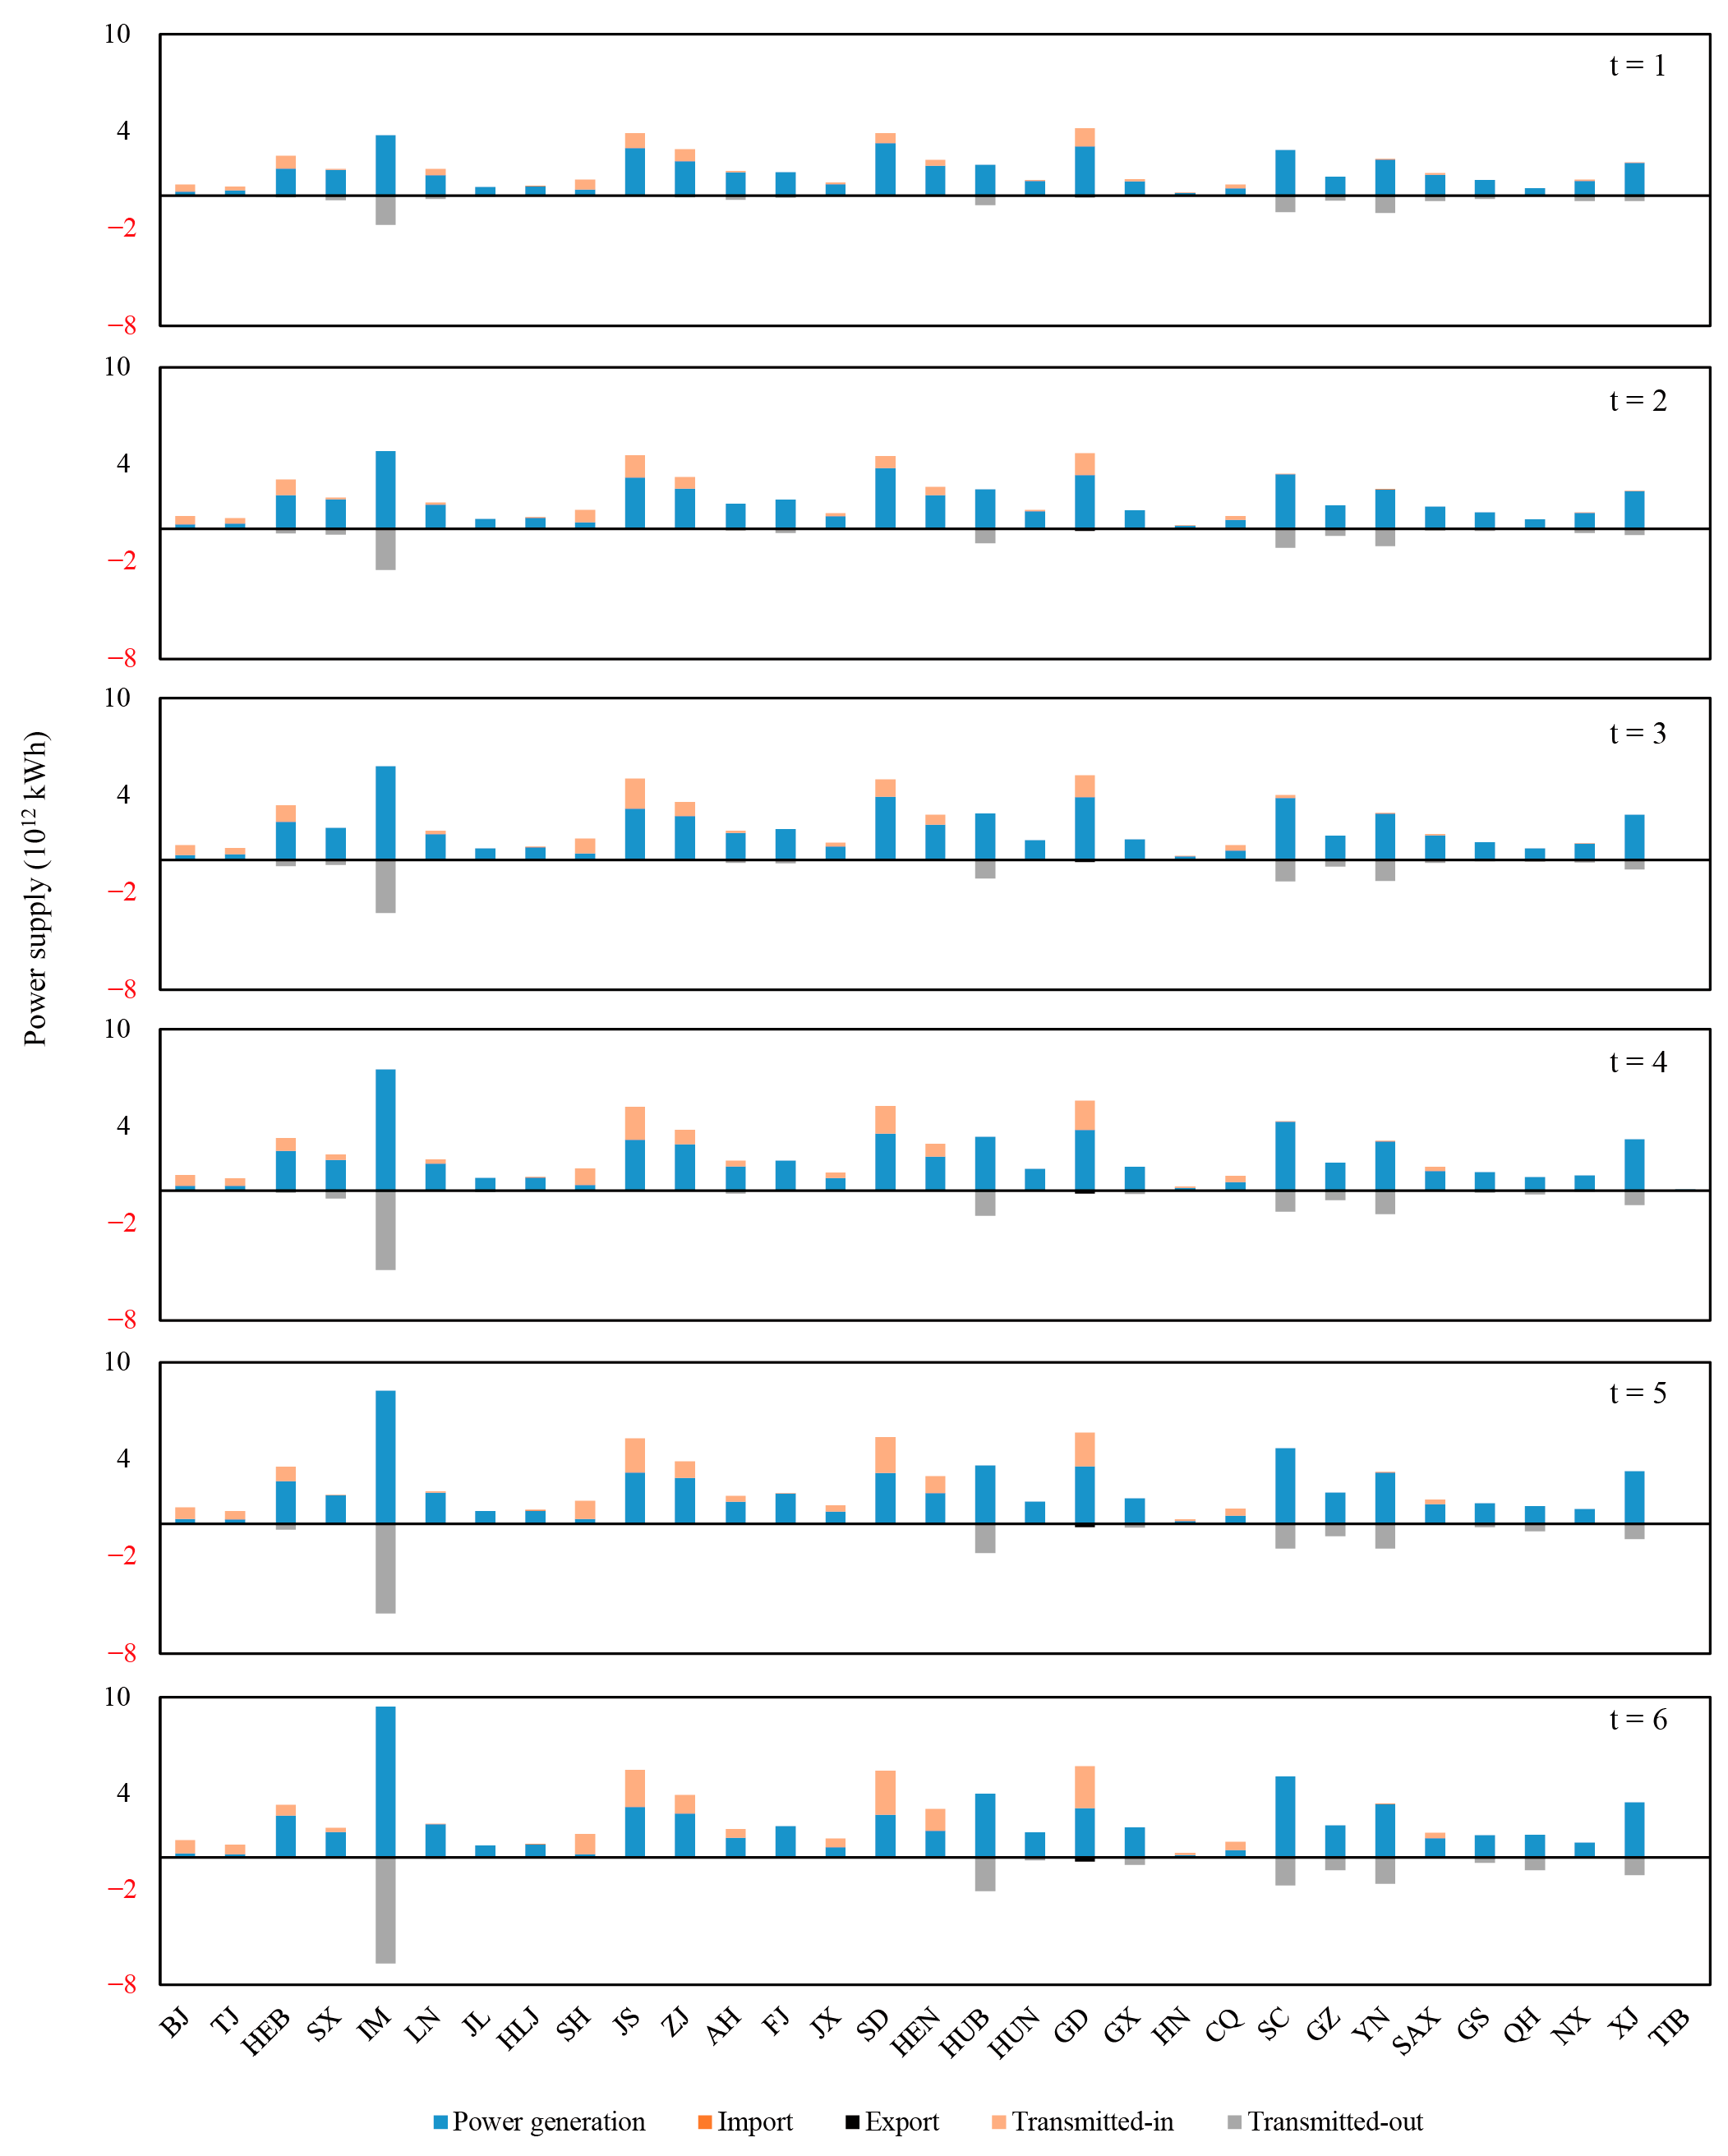
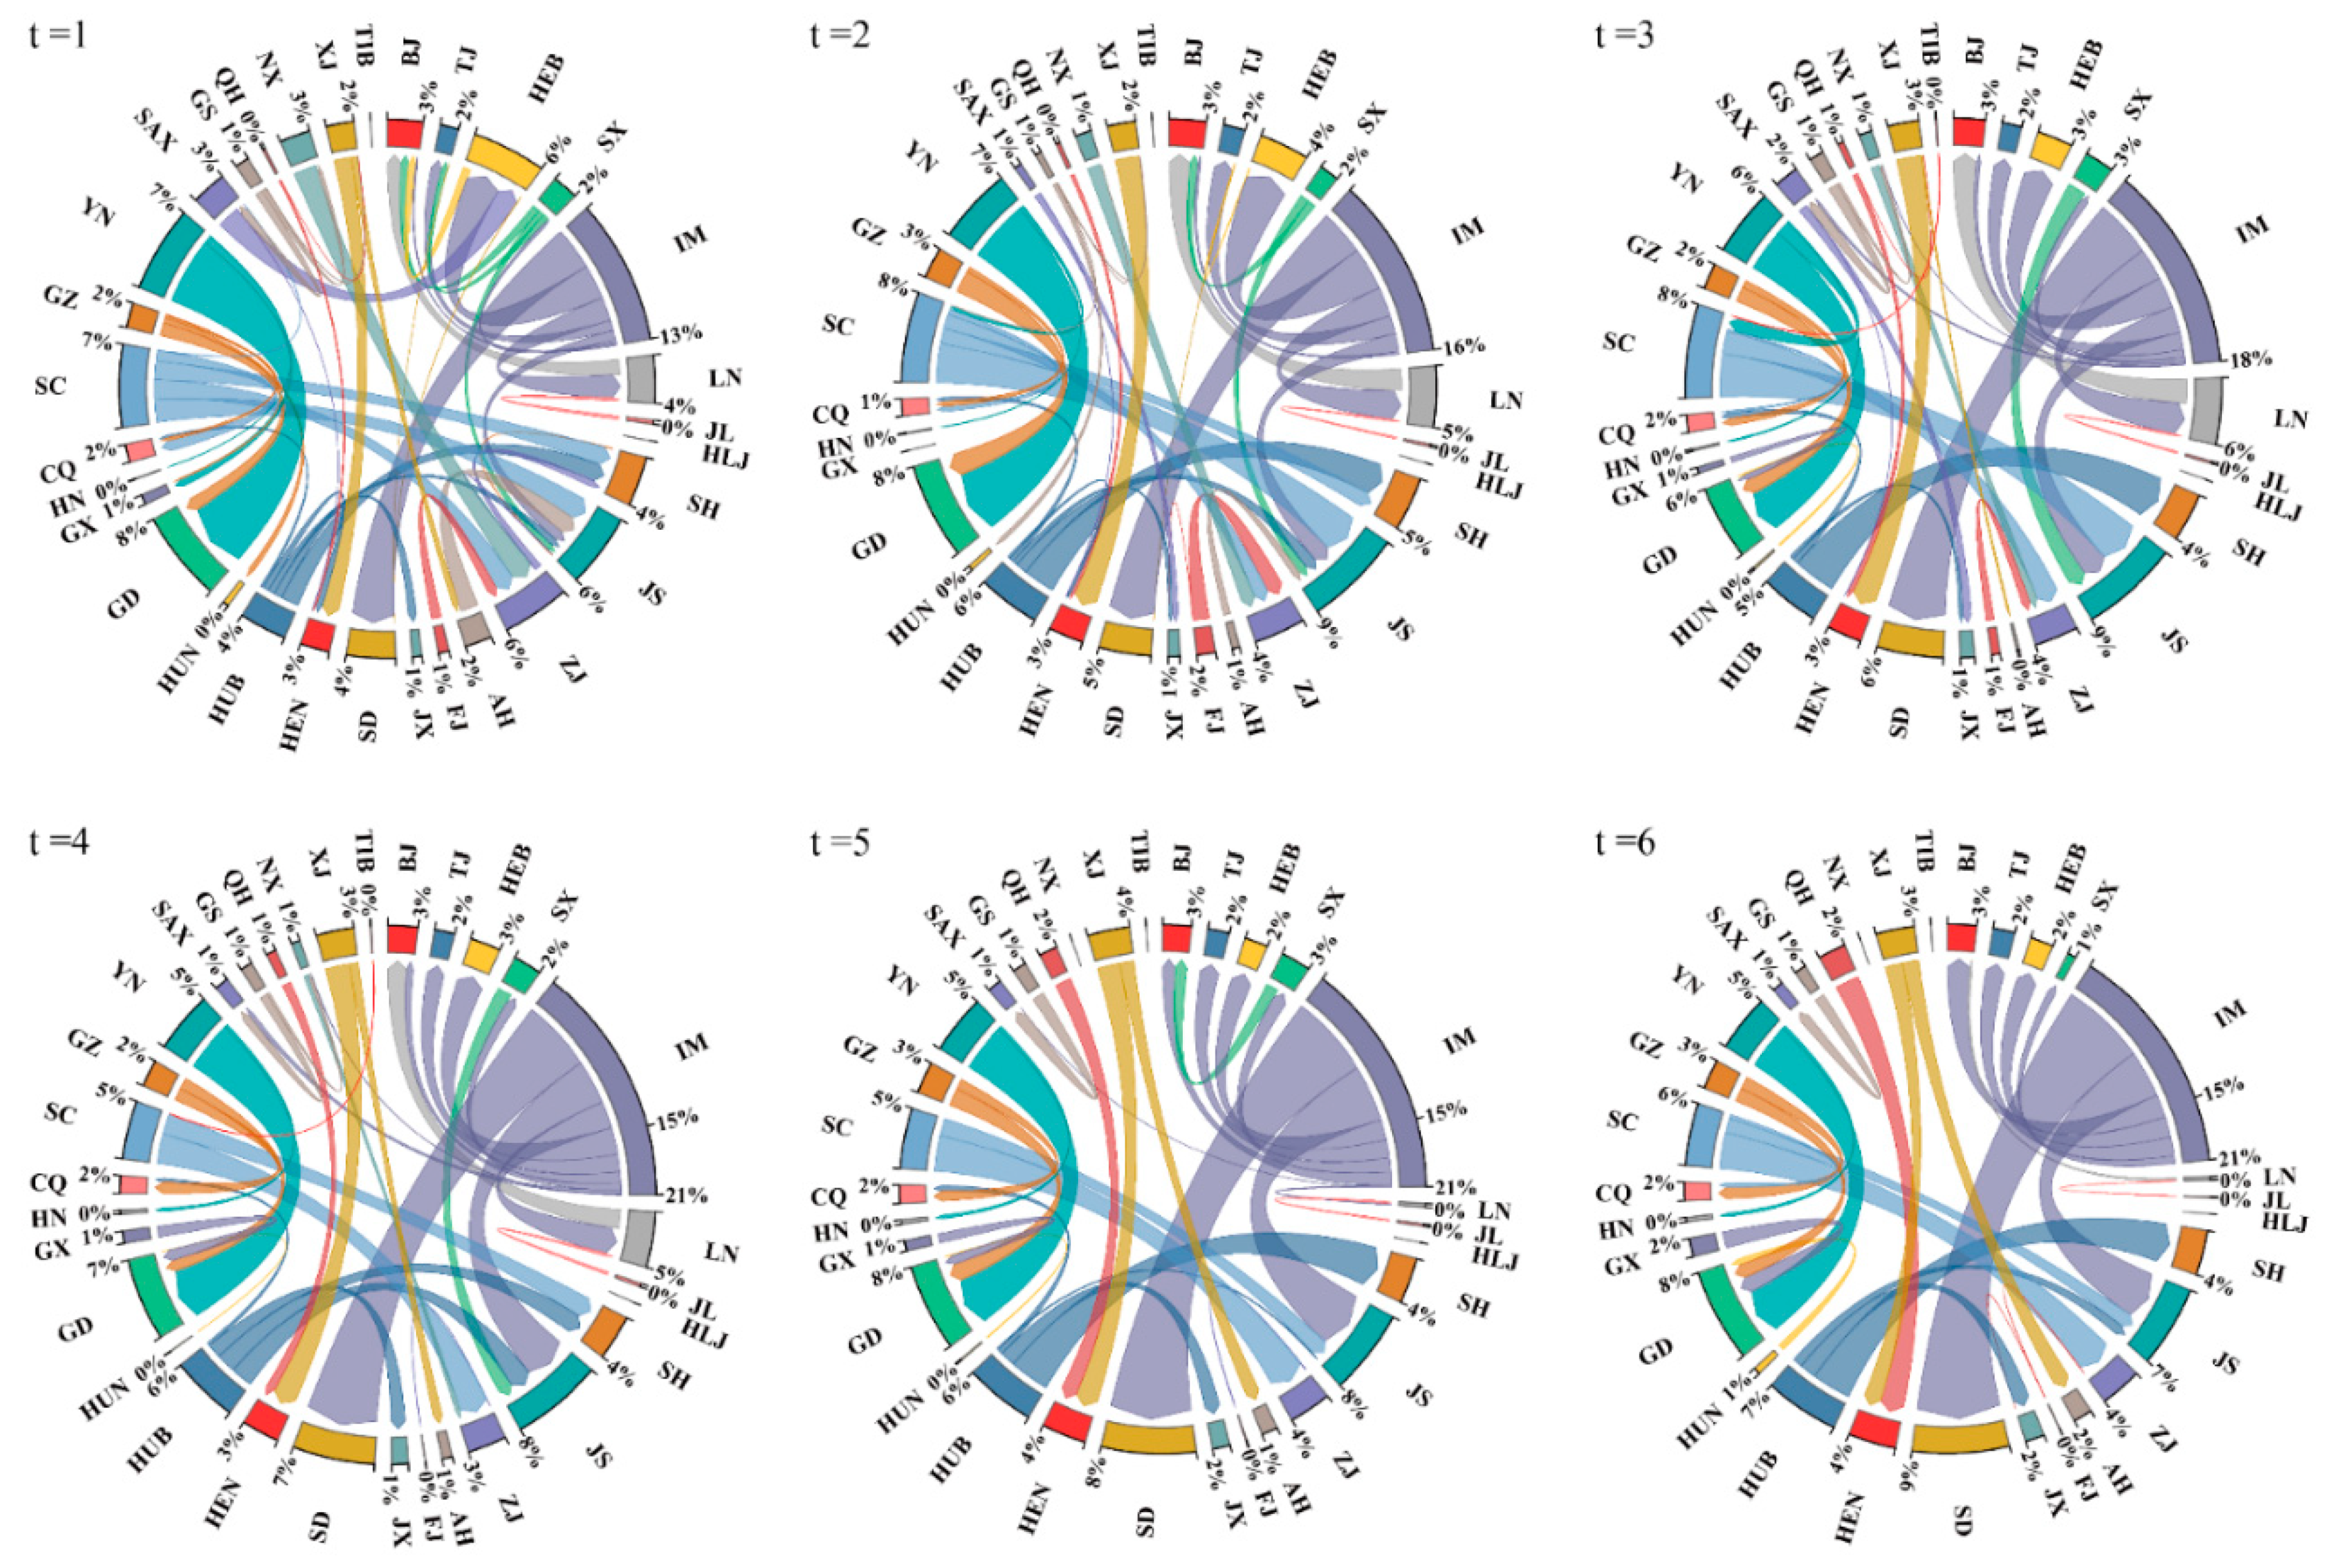


Disclaimer/Publisher’s Note: The statements, opinions and data contained in all publications are solely those of the individual author(s) and contributor(s) and not of MDPI and/or the editor(s). MDPI and/or the editor(s) disclaim responsibility for any injury to people or property resulting from any ideas, methods, instructions or products referred to in the content. |
© 2024 by the authors. Licensee MDPI, Basel, Switzerland. This article is an open access article distributed under the terms and conditions of the Creative Commons Attribution (CC BY) license (https://creativecommons.org/licenses/by/4.0/).