Abstract
In the digital context, smart homestays have developed rapidly in the post-epidemic era and have become a new form of accommodation. Homestays are favored by many young people in China, such as those belonging to Generation Z. According to data concerning China’s national tourism and related reports, the demand for homestays has increased dramatically in recent years. Thus, we need to consider how to improve the smart homestay user experience. Based on the American Customer Satisfaction Index (ACSI) model, this study explores the factors that affect the user experience of smart homestays. An online survey of 370 respondents of Generation Z in China was conducted, followed by descriptive statistical analysis and hypothesis model validation using SPSS 26.0. The data show that among the five service variables (reservation, check-in, living, check-out, and information sharing), perceived value has a positive and positive impact on service variables in all aspects. Finally, machine learning is used for emotion text analysis, and the results show that users are biased towards smart homestays in the sentiment analysis of the comments. Although smart homestays have a certain amount of attention, there is still a lot of room for progress in technology and services. The purpose of this study is to improve and perfect the rules for making smart homestay service standards based on understanding the satisfaction of Generation Z when using smart homestays while also providing a theoretical basis and practical manuals for the industry to promote the development of the industry and improve user experience. Based on the research results of the above literature, it is imperative to carry out research on Generation Z, the main force of future consumption, especially in the field of artificial intelligence.
1. Introduction
Unlike standardized hotels or resorts, homestays typically provide customers with a quiet and private atmosphere and personalized services that are not only culturally distinctive but also warm and friendly. This unique type of accommodation has emerged in China in recent decades [1]. Today, in the context of the Fourth Industrial Revolution and with the emergence of the novel coronavirus, the service models of the world’s hotel and tourism industries have experienced great changes at an accelerating rate. Digitalization within the context of the metaverse will become the main factor involved in current and future development [2,3]. The applications of artificial intelligence in the hotel and tourism industries are also constantly increasing [3] thanks to its significant advantages in terms of reducing labor and improving work efficiency [4]. For example, various applications have begun to be used in the hotel industry, ranging from basic technologies, such as the Internet of Things (IoT), big data, cloud computing, speech recognition, and facial recognition to social media, virtual reality (VR)/augmented reality (AR), intelligent help desks, and service robots. They possess unparalleled advantages [4,5]. Smart tourism is also a hot topic in contemporary academic research [6,7]. According to Baidu’s homestay search index, in the past five years, in China, the eastern region ranks first, with development mainly concentrated in Zhejiang, Anhui, Shanghai, Jiangsu, Jiangxi, and other places, indicating the significant development of the homestay industry [8]. Meanwhile, when reviewing and analyzing data from the National Bureau of Statistics from 2022 [9], it can be concluded that the overall GDP of East China is higher than that of other regions. As can be observed from data gathered between 2020 and 2022, among the top 12 provincial-level municipalities, there are six cities located in the eastern region: Guangdong, Jiangsu, Shandong, Zhejiang, Fujian, and Shanghai [9]. Despite fluctuations, the provinces’ GDP is still in the top 10. However, there exists a significant gap in living standards between the two regions (the central and western regions of the country and the eastern region), with the average living standards in the eastern region being 1.7 times and 2.1 times higher than those in the central and western regions, respectively [10]. In this context, this study chose the eastern region as the area for sample collection as the establishment of smart homestays requires economic support and innovative ideas. This is also because the 12 eastern provinces are ahead of other regions in China.
According to data released by the National Bureau of Statistics of China, the epidemic resulted in profound impacts on the number of domestic tourists visiting China in 2022 and 2023, with 253,000 and 489,000 people, respectively [9]. Nevertheless, the occupancy rates in the accommodation industry were 49.7% and 52.4% in 2022 and 2023, respectively, with a year-on-year increase of 5.4% [11]. As a form of B&B in the accommodation industry, smart homestays are small-scale tourism accommodation products with a focus on culture and life experience [8,12]. As for the occupancy rate of this kind of homestay, it increased from 35.2% in 2022 to 55.8% in 2023, with a year-on-year increase of 58% [11]. From the perspective of leisure tourism, the demand for homestays has significantly grown in the past 2 years [13], indicating the enormous market potential of this new type of homestay. Meanwhile, in a survey of the population that chose intelligent traveling, it has been found that Generation Z [14], comprising “digital natives”, has become the main driving force in digital tourism [14,15]. A total of 38.2% of them opt for smart homestays when choosing accommodations [14]. Therefore, studying Generation Z is an indispensable part of future research on smart homestays.
Customer satisfaction is an important indicator that directly reflects the attitudes of consumers through which consumers’ subsequent and future shopping behavior can be predicted, and this is a key factor in understanding consumer behavior [16]. As a result, research on satisfaction with homestays is essential for the service industry. The dimensions of satisfaction surveys on homestay services are usually divided into cost-effectiveness, comfort, hygiene, services, facilities, and so on [17,18]. The hotel industry is a business that is based on customer experience, and customer experience covers a series of reactions during the entire journey, from arrival and check-in to departure [19]. This paper integrates the above-mentioned dimensions into the following parts: reservation, check-in, living, check-out, and information sharing. These are analyzed from three perspectives—pre-service, in-service, and post-service—in order to perform a verification analysis of user satisfaction.
Satisfaction when using intelligent homestays is an important component of improving user experience and service quality in the industry, so it is necessary to conduct research on this area of satisfaction. Unfortunately, there are few studies on customer satisfaction related to smart homestays. When we searched the keyword “homestay satisfaction” in China’s Wanfang database, there were 297 articles, whereas only 4 articles were found via a search for “smart homestay satisfaction”, with only 1 article published in each year from 2021 to 2024. This shows that previous scholars have conducted limited research on this topic. As for research on service management, researchers mostly focus on service quality, customer value, customer satisfaction, and customer loyalty related to traditional or smart hotels. Due to the significant differences between smart homestays and smart hotels, further research is needed on customer satisfaction in smart homestays, and, in the digital age, Generation Z is the leader in future smart homestay consumption and forms the main group investigated in this study.
The research objective of this study is thus to improve and perfect the rules for setting service standards for smart homestays based on understanding the satisfaction of Generation Z when using smart homestays. The purpose is to provide a theoretical basis and practical manuals for the industry, thereby promoting development and enhancing user experience. Based on the research results of the above literature, it is imperative to conduct research on Generation Z, who will be the main force of future consumption, especially in the field of artificial intelligence. In order to obtain scientific research results, our research was conducted using quantitative research methods: the structural equation model (SEM) and web crawlers were used to calculate and analyze the evaluation texts relating to smart homestays. According to the research results, the importance of perceived quality in five service dimensions (reservation, check-in, living, check-in, and information sharing) is determined. At the same time, the service satisfaction of smart homestays has certain room for improvement.
The contribution of this research is mainly divided into two aspects: First, in the theoretical aspect, customer satisfaction variables are subdivided into five independent variables of service links, from reservation to information sharing, which eventually form a closed loop. Previous studies generally focused on keywords related to the hotel industry, such as cleanliness, safety, cost-effectiveness, and other aspects, and a few of these studies systematically examined aspects based on the entire service process. The benefit of systematic research is obvious as it accurately identifies the key issues in the service, helping to promote further research in this field and bringing significant improvements. Secondly, in practice, it provides corresponding guidance for the satisfaction of the smart home lodging industry from different links so as to promote the development of the industry and improve the user experience.
The following structure of this paper is as follows: Section 2 summarizes the literature on satisfaction in smart homestays. Section 3 details the literature on research methodology, from which nine theoretical hypotheses are formulated, and Section 4 presents the data analysis process and results for the two experimental data, including reliability and validity and testing the hypotheses, experimental method and scale, and scientific discussion. Section 5 is the conclusion, which summarizes the findings of this thesis based on the experimental results. Section 6 presents the limitations of the study and future research directions.
2. Related Work
In The Road to the Future, 1995, Bill Gates first proposed application scenarios for home linkage. The book introduces the use of chips to connect the electronic devices of a house to a main server. The house can estimate a person’s needs and can also control lighting and background music. Smart homestays are “Intelligent + B&B”, and in this context, “smart devices” refer to devices that have computing and communication capabilities in a home environment [5]; the term “shared houses” is used to refer to houses shared via platforms such as Airbnb, HomeStay, and HomeExchange [20]. This type of homestay represents a new way of life and in terms of “knowing intelligence, knowing life”, creates intelligent homestays [21] equipped with smoke sensors, switch panels, smart gateways, electric curtains, and smart cameras inside [22]. Homestay users are able to control various devices, such as lights, electric curtains, and air conditioning, by using smart wall panels, mobile apps, and even their voice. The concept of “Smart + B&B” is a new type of service design that involves user experience, aiming to create a better experience for users that considers their emotions and psychology [23].
The academic community does not have a clear definition of smart homestays, and satisfaction research on homestays generally involves three aspects: check-in, living, and check-out [24]. In comparison, intelligent components are present in today’s homestays, but there is little relevant literature or information pertaining to research on smart homestays. In terms of the customer service of smart hotels, studies on reservation, check-in, living, and check-out have been conducted [25]. Information sharing can reflect the service quality of homestays or hotels and provide a reference for those who will be staying in homestays [26]. With the close integration and combination of reservation and information sharing, customer satisfaction can be promoted or reduced [26]. This paper draws on the four parts of smart hotels and adds information sharing to form variables of customer satisfaction, making the entire process complete and closed. In addition, this study is different from the previous studies in terms of research object (Generation Z), research content (Smart Homestays), and research method (combining SEM based on the ACS model and text analysis). In previous studies, most of them were hotels or homestays, and there are few related studies on smart homestays. For comparison, this paper makes a detailed summary of previous studies (Table 1).

Table 1.
Previous accommodation satisfaction studies.
This study focuses on the current factors affecting the satisfaction of smart homestays in eastern China and produces research results with scientific validity using two quantitative research methods (SEM based on the ACSI model and network text analysis), as well as analyses. It serves as a theoretical support for future service standards in the smart homestays industry and expands the research dimensions (from Reservation, Check-in, Living, and Check-out to Information Sharing, forming a closed loop of service).
Based on this, this study conducts research on data and merchants from the top five tourism applications in China, including Ctrip, Meituan, Tongcheng, Feizhu, and Qunar [33]. The summary is as follows:
By taking the 32 surveyed smart homestays located in the eastern region of China (Beijing, Tianjin, Hebei, Shanghai, Jiangsu, Zhejiang, Fujian, Shandong, Guangdong, and Hainan) as examples, we detail the following:
- Reservation:
Reservations can be carried out through online apps, and smart homestays can be booked according to the personal preferences of the user through a smart app.
- 2.
- Check-in:
With self-service check-in machines, electronic identity authentication is carried out through facial recognition. Before entering, the landlord or butler assists with this service.
- 3.
- Living:
In order to control indoor environments to varying degrees, intelligent hardware is used, which also provides the following services:
- (a)
- Automatically control room scenes with an automatic adaptation function to provide guests with a comfortable living environment.
- (b)
- All indoor equipment can be controlled through switches or voice commands, making it convenient and fast.
- 4.
- Check-out:
Customers can quickly check out through online platforms, and merchants can refund their deposit after inspection.
- 5.
- Information sharing:
The main sharing platforms rely on social media such as WeChat and booking platforms.
For smart homestays, the basic definition used in this paper involves a homestay that uses intelligent technology throughout the five stages of the entire process so as to enhance the user experience. For example, in the booking stage, there is a quick, user-friendly option; the check-in and check-out processes require fewer service programs, with higher service quality through intelligent technology; the residential stage provides humanized scenarios and meets users’ needs through the use of intelligent hardware; and throughout the information-sharing process, an electronic platform is provided for users to freely communicate with others.
3. Methodology
This chapter mainly introduces the use of the ACSI model to explore the factors affecting customer satisfaction with smart homing, which includes variables such as perceived quality, perceived value, customer expectation, customer loyalty, and customer complaint. The study hypothesized that these factors significantly affected customer satisfaction. In addition, this study uses web crawler text analysis to collect and analyze online reviews of smart homestay customers in eastern China, aiming to capture real customer experience in five service stages: booking, check-in, residence, check-out, and information sharing. The overall goal is to enhance understanding of the dynamics of customer satisfaction in the smart accommodation industry.
3.1. Methods and Research Hypotheses
The ACSI model, currently the most widely used customer satisfaction theory model in China, was created by Fornell and Eugene based on the Swedish SCSB model [34]. It can comprehensively evaluate customer satisfaction, including six structural variables: one target variable (customer satisfaction), three causal variables (perceived quality, perceived value, and customer expectations), and two outcome variables (customer complaint and customer loyalty). The advantage of this model is that the comparison of customer satisfaction with products or services is not limited to the same company, which means that aspects of different companies can also be compared [34]. Research has shown that the ACSI model is widely used in the hotel and accommodation industry [35,36,37].
The basic ACSI model is constructed as a causal relationship (“causal model”), with potential factor indices of satisfaction driving factors (customer expectations, perceived quality, and perceived value) on the left, customer satisfaction (ACSI) in the middle, and the consequences of satisfaction on the right (customer complaints and customer loyalty, including customer retention and price tolerance) (shown in Figure 1) [38]. The actual examination of causal analysis assumes multiple time periods [33,34].
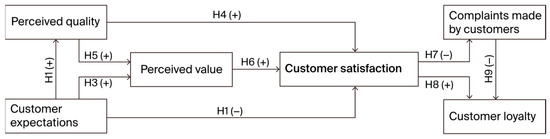
Figure 1.
Hypothetical ACSI model. The + sign is considered to be a positive influence relationship between the two variables; The − sign is regarded as a negative relationship between the two variables.
Based on the ACSI model, there are three prerequisites for overall satisfaction: perceived quality (PQ), customer expectations (CE), and perceived value (PV). There exist two consequences to customer satisfaction (SAT), namely customer complaints (CCs) and customer loyalty (CL) [37]. In other words, in this project, the focus is on the factors that influence satisfaction with the five parts of the process involved in smart homestay services: reservation, check-in, living, check-out, and sharing information.
Customer expectations represent measurement standards of customers’ expectations in terms of service quality [39]. Expectations not only represent previous purchasing experiences, including non-experiential information, such as advertising and word-of-mouth, but also stand for a customer’s prediction of the capability of homestays to provide quality service in the future [37,40]. At the same time, expectations serve as a mirror of the quality of the current product, providing customers with real information about the product. In this sense, expectations are largely reasonable and reflect customers’ ability to judge and predict service quality and value based on actual consumption situations [41]. Customer expectations and perceived value are also positively correlated. In the newly emerged products and markets, especially in the hotel industry, customer expectations come from the promotion of manufacturers. If customers hold high expectations due to excessive promotion while the actual quality is not as satisfactory as expected, the perceived value of customers decreases, consequently lowering the sense of satisfaction [35]. The positive correlation between perceived value during the service process and customer satisfaction is often documented in the literature [42]. Therefore, the following assumptions are proposed:
H1.
Customer expectations of smart homestays have a negative impact on customer satisfaction.
H2.
Customer expectations of smart homestays have a positive impact on perceived quality.
H3.
Customer expectations of smart homestays have a positive impact on perceived value.
Perceived quality is a measurement standard of a customer’s evaluation of service quality based on their actual experience. Quality is measured by customization (the degree to which a product or service meets a customer’s individualized needs) and reliability (the severity or frequency of problems occurring in products or services) [40]. The primary determinant of customer satisfaction is service quality. The better the service quality is, the higher the satisfaction level [43,44]. Perceived quality is also predicted to have a positive and direct impact on perceived value [45]. Customer satisfaction is positively related to the perceived quality and perceived value of customers to services and products [35,37]. Therefore, the following assumptions are proposed:
H4.
Perceived quality has a positive impact on customer satisfaction in smart homestays.
H5.
Perceived quality has a positive impact on perceived value.
The perceived value is the measurement standard of quality related to the price paid. Although price (value for money) is essential for a customer’s first purchase, it has a relatively small impact on satisfaction with repeat purchases. With the improvement in perceived quality and perceived value, customer satisfaction will also increase [37].
H6.
Perceived value has a positive impact on customer satisfaction in smart homestays.
Customer satisfaction is calculated based on the weighted average of three survey questions, which measure different aspects of satisfaction related to products or services [46]. Customer satisfaction is positively correlated with customer loyalty and negatively correlated with customer complaints. When customer satisfaction is relatively low, complaints often arise, which manifest in two forms: formal complaints from customers to the company or the informal dissemination of dissatisfaction among family and friends, resulting in a series of negative consequences to the reputation of the product [35].
H7.
Customer satisfaction with smart homestays has a negative impact on customer complaints.
H8.
Customer satisfaction with smart homestays has a positive impact on customer loyalty.
Customer complaints are measured by the percentage of respondents who have directly complained about products or services to the company within a specified time span. The handling of customer complaints by enterprises can affect customer loyalty, but there is no necessary positive or negative correlation between customer complaints and customer loyalty. Therefore, many studies consider corporate reputation as a research object, seeing it as the effect variable of customer satisfaction [35].
Customer loyalty is a combination of the expected likelihood that customers will repurchase from the same company again in the future and the likelihood of purchasing the products or services of the company at different prices (price tolerance) [38].
H9.
Customer complaints have a negative impact on customer loyalty.
This study focuses on customer satisfaction based on this research model and the relationship between variables [11,12].
3.2. Research Hypothesis Model
Based on the above contents, a research hypothesis model is proposed, as shown in Figure 1.
The hypothetical model of this study includes perceived quality, perceived value, customer expectations, customer satisfaction, customer complaints, and customer loyalty. Among them, customer satisfaction is subdivided into five dimensions: reservation (SAT-R), check-in (SAT-CI), living (SAT-L), check-out (SAT-CO), and information sharing (SAT-IS). The definitions of each variable are shown in Table 2.
Table 2.
Variable definition.
3.3. Web Crawler Text Analysis
The internet provides a diversified large-scale database with versatile functions and high efficiency. It also features strong, structured characteristics [51]. Text analysis is a research method that describes explicit content in an objective and quantitative way, helping researchers obtain the complete and real psychological perceptions of customers in a relatively short period of time [52]. Customers’ online reviews of the hotel industry can effectively reflect their comprehensive and authentic experiences and attitudes. In this sense, effective online reviews influence potential customers’ willingness to book hotels [52]. The text analysis method can be used to analyze and explore comment texts in an objective, systematic, and quantitative way; meanwhile, comparative research examines the essence of things by exploring the distinctions between different matters [52]. While studying customer satisfaction for smart homestays in the eastern part of China, this study conducted data calculation and analysis based on the complete five stages of the intelligent systems used in smart hotels. The data came from online evaluations and comments posted by consumers to 32 smart homestays in the eastern part of China, and they were extracted from various online platforms in China, including Ctrip, Meituan, Qunar.com, Feizhu, and Tongcheng, which are among the top five tourism applications in China in 2023. The following are the analysis results.
4. Experimental Evaluation
The experiment explored factors influencing customer satisfaction in smart homestays using structural equation modeling to analyze relationships among perceived quality, perceived value, customer expectations, customer complaints, customer satisfaction, and customer loyalty. It emphasized the importance of perceived value and customer expectations in enhancing satisfaction. The second phase involved analyzing customer reviews to evaluate smart homestays in eastern China, focusing on smart services through data crawling, word frequency analysis, sentiment analysis, and topic analysis, aiming to identify areas for service improvement based on user feedback.
The purpose of the experiment was to investigate the factors affecting customer satisfaction in smart homestays, particularly focusing on perceived quality, perceived value, and customer expectations. It aimed to utilize both structural equation modeling and text analysis of customer reviews to provide insights into user experiences and identify areas for enhancing service quality and overall satisfaction. The second phase supplemented the initial findings with a text analysis of customer reviews, focusing on smart homestays in eastern China. This analysis involved data crawling, preprocessing, word frequency analysis, sentiment analysis, and topic analysis. The goal was to understand customer feedback on intelligent services and identify areas for improvement in service delivery, ultimately enhancing customer satisfaction based on user insights.
4.1. Methos One
4.1.1. Experimental Method and Scale
This subsection focuses on extracting 2739 comments from various online platforms and using web crawler technology to target the online evaluations of some smart lodgings in the eastern region of China. The text analysis in this stage mainly serves as a supplement to the research results of AMOS, which was based on questionnaires in the survey in the previous stage. The results were obtained from online comment analysis. Simultaneously, users’ evaluations and reviews of smart homestays regarding intelligent services in eastern China were analyzed. Technical means were used to extract feature words from customers’ reviews, and the contents of the reviews were quantitatively expressed. There were five steps involved: data crawling, data preprocessing, word frequency analysis, sentiment analysis, and topic analysis.
4.1.2. Results
Questionnaire Collection
The questionnaires in the survey used in this study focused on people who were living in the eastern part of China and had experience living in smart homestays. In order to access this group of people, “Questionnaire Star” was used to develop a pre-questionnaire so as to screen out those who had the required experience. Based on the ASCI model, the research factors in the questionnaire were established, and the following steps were involved. First, for the collected samples, there was descriptive statistical analysis, followed by a Cronbach α reliability analysis, as well as an analysis of the validity of confirmatory factors. Finally, the structural equation modeling (SEM) path coefficient analysis method was adopted to analyze the impact mechanism of the path, and the purpose of this step was to verify the model hypothesis.
There were 45 items measured by the structural equation model, among which 29 items used a Richter five-point Likert scale [53], which is internationally recognized. The respondents in the survey were asked to give their responses to each item and rate each one. The rating levels are listed as follows: “Strongly Disagree”, “Disagree”, “Average”, “Agree”, and “Strongly Agree”, corresponding to 1 to 5 points, respectively.
According to the 10 dimensions that affect satisfaction with smart homestays, including perceived quality, customer expectations, perceived value, complaints made by customers, customer loyalty, and customer satisfaction, the customer satisfaction research was conducted based on five sub-variables: reservation, check-in, living, check-out, and information sharing. The questionnaire used in this study consisted of 45 questions, which were collected through the online platform “Questionnaire Star” over a period from 30 April to 14 May 2024. A total of 370 questionnaires were collected, and 30 of them were excluded as invalid questionnaires. Therefore, a total of 340 valid questionnaires were obtained, comprising 91.9% of the total number of questionnaires. Moreover, the size of the sample met the requirements for factor analysis [53] (Table 3).
Table 3.
Questionnaire collection.
Population Distribution in the Sample
In this survey, there were 340 participants in total, and their information was collected and then analyzed. The information was divided based on the following aspects: gender, age, education level, and monthly income. In terms of gender distribution, female participants accounted for 61.2%, while male participants accounted for 38.8%; as for age profile, participants aged 30 and above took up the largest proportion, accounting for 40% of the total. In contrast, those participants aged between 25 and 29 represented 31.8%. There were also younger interviewees, who were between the ages of 20 and 24, occupying 28.2%. The age range of Generation Z is between 15 and 29 years old, and this group accounted for 60% of the surveyed population, more than half of the total population. This figure indicates that this group of people constituted the main proportion of smart homestay consumers. With regard to education level, the proportion of participants with college or undergraduate education was the highest at 80.9%. It was followed by those with master’s degrees, accounting for 17.4%. In contrast, the participants with a doctoral degree or above made up the lowest proportion, with only a figure of 0.9%. In terms of profession, full-time workers occupied the largest proportion, at 91.2%, while the proportion of freelancers was the lowest, representing just 3.2%. Concerning the monthly income of the participants, those who earned over CNY 12,001 per month accounted for 26.5%, while participants with an income of less than CNY 3000 per month took up 3.5%. The highest proportion belonged to those with an income between CNY 8001 and 12,000 per month, with a proportion of 37.4%. It can be concluded from the figures that the general population of smart homestays received a good education, and most of them had a stable financial source in full-time job positions. As is shown in Table 4, each variable basically meets the requirements of the sampling survey.
Table 4.
Sample frequency analysis results.
Smart Service Usage and Purposes of Accommodation
In terms of the frequency of using smart devices, the majority of participants (78.5%) used a smart device several times a day. As for the times of accommodation in smart homestays, those who had two–three experiences accounted for the highest proportion, 46.8%, while participants who experienced it for the first time represented 3.8%. As for the purposes of living in smart homestays, participants mainly chose this type of accommodation for tourism and vacation, which accounted for 85.3%, the leading position on the list. This was followed by people using them for business trips, 13.5%. In comparison, the lowest percentage of visitors, only 1.2%, lived in this type of homestay when visiting relatives and friends (Table 5).
Table 5.
Smart device usage.
Overall, the data collected in the survey indicate that smart homestays were particularly attractive to people who regarded tourism as their main purpose for traveling. The high percentage highlights that smart homestays are attractive to tourists who intend to seek experiences. In addition, the numbers reveal that despite the convenience and novelty of smart homestays, they have a weak correlation with non-tourism accommodation. Meanwhile, the percentage of people who chose smart homestays two–three times proves that almost half of the users were willing to choose this type of accommodation again.
Questionnaire Reliability
This study used SPSS 26.0 to test the reliability of the questionnaire. Firstly, the α coefficient was analyzed. If this value is higher than 0.8, it indicates high reliability; between 0.7 and 0.8, it indicates good reliability; between 0.6 and 0.7, it indicates acceptable reliability; and if lower than 0.6, it indicates poor reliability. According to the analysis of the above table, the Cronbach α coefficient was 0.816 for perceived quality, 0.844 for perceived value, 0.799 for customer expectation, 0.867 for customer complaints, 0.871 for customer loyalty, 0.826 for reservation satisfaction, 0.800 for check-in satisfaction, 0.829 for living satisfaction, 0.832 for check-out satisfaction, and, finally, 0.819 for information-sharing satisfaction. It can be seen that the reliability of all dimensions in the questionnaire scale is higher than 0.7, indicating that the questionnaire scale has good reliability. As a result, they can be used for research and analysis, and the results of the analysis are also reliable (Table 6).
Table 6.
Reliability and validity of the test results.
Questionnaire Validity
This study used Amos 26.0 to conduct a confirmatory factor analysis (CFA) of the questionnaire in order to test its validity. We first used SPSS 26.0 to conduct the Kaiser–Meyer–Olkin (KMO) test and Bartlett’s sphericity test. Confirmatory factor analysis was used to test the convergence validity, correlation, discriminant validity, and fitting validity of each item in the scale proposed in this paper. Confirmatory factor analysis is a research method that is used to verify whether the relationship between a certain factor and the corresponding measurement item conforms to the theoretical relationship designed by the researcher. It was used for the scale analysis of questionnaires. The standard load factor value is usually used to represent the correlation between factors and analysis items. The standard proposed by Fornell and Larcker [54] was used to evaluate the convergence effectiveness of the measurements. Their guidelines indicate that when the statistical significance level p < 0.05 is greater than 0.6, there will be a strong correlation for all standardized factor loadings of the calculated variables. This study also used the square root of extracted mean variance (AVE) to test the discriminant validity between factors.
During the initial validity analysis, the scale of perceived quality, perceived value, customer complaints, customer loyalty, reservation satisfaction, check-in satisfaction, living satisfaction, check-out satisfaction, and information-sharing satisfaction presented relatively high aggregated validity, while the scale of customer expectation showed relatively poor aggregated validity (Table 7).
Table 7.
Modeled AVE and CR indicator results.
According to the analysis, at 0.644, the standardized factor load of customer expectations was quite low in the entry “I expect smart homestays to provide personalized services, such as adjusting room settings according to my preferences”. This suggested that this entry had a moderate or even weak contribution to the customer expectation concept. When this entry was deleted, the aggregated validity of the customer expectation scale significantly improved (Table 8).
Table 8.
Factor loading coefficients.
The second calculation and analysis involved a total of 10 factors and 38 analysis items, all of which underwent confirmatory factor analysis (CFA). The corresponding AVE values of the total 10 factors were all above 0.5, and the CR values were all higher than 0.7, which means that the data analysis in this study has good convergent validity (Table 9).
Table 9.
Model AVE and CR index results.
Finally, SPSS software was used to analyze the data collected in the 340 questionnaires. The Bartlett sphericity test (p = 0.000 < 0.05) and Kaiser–Meyer–Olkin (KMO) measurements (p = 0.982 > 0.6) showed that the sample size was sufficient. If this value is higher than 0.8, it indicates that it is very suitable to extract information from the research data (indirectly reflecting very good validity); if this value is between 0.7 and 0.8, it indicates that it is quite suitable to extract information from the research data (indirectly indicating fairly good validity); if this value is between 0.6 and 0.7, it indicates that it is suitable to extract information from the research data (indirectly reflecting qualified validity); however, if this value is lower than 0.6, it indicates that it is not suitable to extract information from the research data (indirectly indicating moderate validity) [26,55,56]. It can be seen that all the values met the minimum acceptable score. For the correlation between variables, factor analysis is considered effective and appropriate.
According to the analysis of Table 9, the KMO values of the perceived quality, perceived value, customer expectations, customer complaints, customer loyalty, reservation satisfaction, living satisfaction, check-out satisfaction, and information-sharing satisfaction scales are all above 0.7. This indicates that the scale has good validity. The KMO value of the occupancy satisfaction scale is 0.696, which is close to 0.7 and greater than 0.6. Therefore, the validity of the scale is also qualified, meeting the research requirements (Table 10).
Table 10.
KMO and Bartlett sphericity tests.
Subsequently, Amos 26.0 was used for factor analysis, which was divided into three aspects: structural validity, cluster validity, and discriminant validity. The structural validity of customer satisfaction in smart homestays is presented in Table 10. As shown in the table, χ2/df, IFI, CFI, TLI, NNFI, RMSEA, and RMR all meet the research requirements. This suggests that the model has a high degree of fit. The aggregated validity of customer satisfaction for smart homestays is shown in Table 11. The factor loadings of each latent variable of PQ, PV, CE, CC, CL, SAT-R, SAT-CI, SAT-L, SAT-CO, and SAT-IS corresponding to each subject are all >0.5. The overall reliability (CR) > 0.8 proves that the convergent validity is relatively ideal (Table 11).
Table 11.
Overall fit coefficients.
Descriptive Statistics
From descriptive and statistical analyses of the research indicators, the following can be concluded:
Perceived quality: The sample size was 340, with an average of 4.063 and a standard deviation of 0.613. This suggests that customers generally had a high evaluation of perceived quality, but there were certain differences, and the standard deviation shows the degree of dispersion of the ratings. Perceived value: There were 340 samples, with an average value of 3.902 and a standard deviation of 0.697. The average perceived value was slightly lower than the average perceived quality, revealing that customers believed that the value that smart homestays provide was slightly lower compared to their, and the degree of dispersion in ratings was relatively high. Customer expectation: The sample size was 340, and the average value was 4.051, with a standard deviation of 0.572. The average customer expectations were relatively high, but their distribution was quite concentrated. Customer complaint: There were 340 samples, with an average value of 2.401 and a standard deviation of 0.828. The average value of customer complaints was low, which indicated that customers generally complained less, but the differences in complaints were significant. Customer loyalty: The sample size was 340, the average value was 3.808, and the standard deviation was 0.691. The average value of customer loyalty illustrates that customers had a high level of loyalty to the hotel, but there was also a certain degree of dispersion. Reservation satisfaction: There were 340 samples, with an average value of 3.950 and a standard deviation of 0.678. Customers had a high level of satisfaction with the booking process, but there were also differences in the distribution of ratings. Check-in satisfaction: The sample size was 340, and the average value was 3.885, with a standard deviation of 0.694. The satisfaction with the check-in experience was comparable to the satisfaction with the reservation, but the degree of dispersion of ratings was quite high. Living satisfaction: There were 340 samples, with an average value of 3.857 and a standard deviation of 0.722. The average value of living satisfaction was faintly lower than that of check-in satisfaction, and the dispersion of ratings was relatively high. Check-out satisfaction: The sample size was 340, and the average value was 3.899, with a standard deviation of 0.699. Check-out satisfaction was comparable to check-in and living satisfaction, with a similar degree of dispersion in ratings. Information-sharing satisfaction: There were 340 samples; the average value was 3.665, and the standard deviation was 0.756. Among all the indicators, the average information-sharing satisfaction was the lowest, indicating that customers were not very satisfied with the hotel’s information-sharing services, and the degree of dispersion in the ratings was relatively large (Table 12).
Table 12.
Factor loading coefficients and Cronbach’s α value.
Based on the above analysis of the descriptive statistics of smart homestays, customers generally had high satisfaction across various aspects, with an average score of 3.8 for perceived quality, value, expectations, loyalty, and satisfaction (reservation, check-in, living, and check-out). However, there are significant distinctions in customer experience, especially in perceived value, complaint, and information-sharing satisfaction, with an average score of 3.665, which is the lowest. It also indicates a high standard deviation. This shows that, although most customers were satisfied, there were significant differences in personal experience, especially in perceived value, customer complaints, and information sharing.
Verify Model Assumptions
This study used Amos 26.0 to test the path hypothesis in the research model. The relationship between the dependent variable and the independent variable was also tested through the use of structural equation modeling (Table 13). Based on the processing results of the structural equations, the hypotheses of this study were tested. The following are the conclusions to the data and results of the corresponding hypothesis regarding the five sub-variables of customer satisfaction (Table 14).
Table 13.
Descriptive statistical analysis of research indicators.
Table 14.
Hypothesis of satisfaction of smart homestays in eastern China.
The following results are the analysis results and specific application based on the assumed model in Figure 1 combined with five variables of the service (Reservation, Check-in, Living, Check-out, and Information Sharing).
Satisfaction with Reservations in Smart Homestays
Perceived quality has a significant positive impact on perceived value, but its influence on reservation satisfaction is not apparent; meanwhile, reservation satisfaction is positively impacted by perceived value. It also can be found that customer expectations have a positive impact on perceived quality and perceived value, which also have an obvious positive effect on reservation satisfaction. However, customer complaints negatively impact customer loyalty, and reservation satisfaction has a negative impact on customer complaints and a strong positive impact on customer loyalty. These findings reveal how the various elements of customer experience in smart homestays interact with each other and affect customer satisfaction and loyalty (Figure 2).
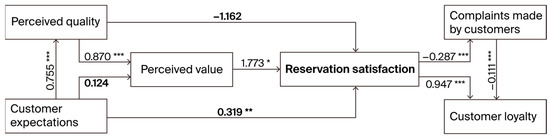
Figure 2.
The model of customer satisfaction of reservation for smart homestays. The * is the degree of significance, *: p ≤ 0.05; **: p ≤ 0.01; ***: p ≤ 0.001. The bold part of the font is the main research content.
Satisfaction with Check-In in Smart Homestays
According to the analysis, perceived quality and perceived value have a significant impact on occupancy satisfaction, with perceived quality having a negative direct impact on occupancy satisfaction and perceived value having a positive direct impact. It is also interesting to note that customer expectations have a certain impact on both perceived quality and perceived value, but their influence on occupancy satisfaction is not significant. Customer complaints are negatively correlated with customer loyalty, while occupancy satisfaction has a strong positive impact on customer loyalty. In addition, there is a negative correlation between occupancy satisfaction and customer complaints, which means that the higher the satisfaction is, the fewer customer complaints there will be. Therefore, improving perceived value and managing customer expectations is beneficial to improving check-in satisfaction, which thereby enhances customer loyalty and reduces customer complaints (Figure 3).
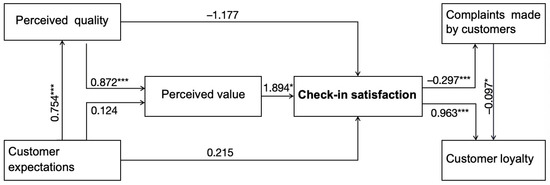
Figure 3.
The model of customer satisfaction of check-in for smart homestays. The * is the degree of significance, *: p ≤ 0.05; ***: p ≤ 0.001.
Living Satisfaction in Smart Homestays
The research model of living satisfaction reveals the mutual influence between various factors. Perceived quality and perceived value have a significant impact on residential satisfaction. Specifically, perceived quality has a strong positive influence on perceived value, but its effect on residential satisfaction is not obvious. Perceived value poses direct positive effects on living satisfaction; customer expectations can enhance the effect on both perceived quality and perceived value, but their contribution to residential satisfaction is relatively limited. Interestingly, customer complaints are negatively correlated with customer loyalty, while living satisfaction exerts positive effects on customer loyalty, which displays that high satisfaction can effectively avoid customer complaints and increase customer loyalty (Figure 4).
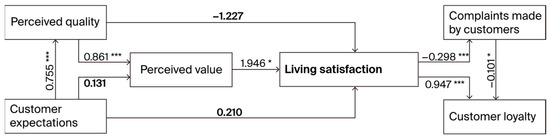
Figure 4.
The model of customer satisfaction of living for smart homestays. The * is the degree of significance, *: p ≤ 0.05; ***: p ≤ 0.001.
Check-Out Satisfaction in Smart Homestays
Perceived quality has a significant positive impact on perceived value, but its impact on check-out satisfaction is not remarkable. Additionally, perceived value has a significant positive impact on check-out satisfaction. Moreover, customer expectations help to improve perceived quality and perceived value, but their influence on check-out satisfaction is not apparent. It can be figured out that customer complaints are negatively correlated with customer loyalty, but check-out satisfaction shows a significant positive impact on both customer complaints and customer loyalty. Thus, check-out satisfaction is a key factor that can affect customer loyalty (Figure 5).
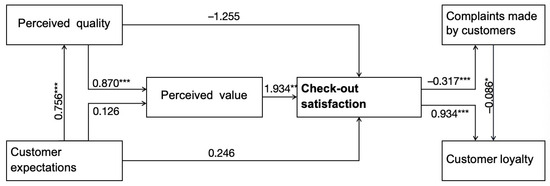
Figure 5.
The model of customer satisfaction of check-out for smart homestays. The * is the degree of significance, *: p ≤ 0.05; **: p ≤ 0.01; ***: p ≤ 0.001.
Information-Sharing Satisfaction in Smart Homestays
After studying the relationship between information-sharing satisfaction and relevant factors, it can be concluded that perceived quality and perceived value have a significant impact on information-sharing satisfaction. Precisely, perceived quality has a positive impact on perceived value, but it has a negative impact on information-sharing satisfaction. In contrast, perceived value positively affects information-sharing satisfaction. Meanwhile, customer expectations have a positive influence on perceived quality and perceived value, but their influence on information-sharing satisfaction is not apparent. Customer complaints are negatively correlated with customer loyalty, and information-sharing satisfaction positively affects customer loyalty and negatively affects customer complaints. These findings show the importance of improving information-sharing satisfaction in enhancing customer loyalty and reducing complaints (Figure 6).
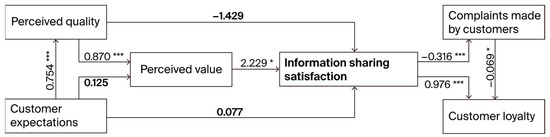
Figure 6.
The model of customer satisfaction of information sharing for smart homestays. The * is the degree of significance, *: p ≤ 0.05; ***: p ≤ 0.001.
This study was based on the ACSI and confirmed the hypotheses H5, H6, H7, H8, and H9 in the model. This means that our research on smart homestays emphasizes the complex interactions between various factors that affect customer satisfaction at different stages in the complete customer experience. Perceived quality continuously improves perceived value, but it does not always directly affect satisfaction. On the contrary, the influence of perceived value on satisfaction is more significant. It can be seen that customer expectations are conducive to enhancing perceived quality and perceived value, which, to varying degrees, affect satisfaction. Moreover, customer complaints have a negative impact on loyalty, while satisfaction at each stage (reservation, check-in, living, check-out, and information sharing) can positively impact consumer loyalty and meanwhile reduce complaints. These findings highlight the significance of perceived value and customer expectations in enhancing the overall satisfaction and loyalty of consumers, thereby reducing complaints at various stages in their smart homestay experience.
4.2. Method Two
4.2.1. Experimental Method and Scale
The description is as follows: this subsection focuses on extracting 2739 comments from various online platforms and using web crawler technology to target the online evaluations of some smart lodgings in the eastern region of China. The text analysis in this stage mainly serves as a supplement to the research results of AMOS, which was based on questionnaires in the survey in the previous stage. The results were obtained from online comment analysis. Simultaneously, users’ evaluations and reviews of smart homestays regarding intelligent services in eastern China were analyzed. Technical means were used to extract feature words from customers’ reviews, and the contents of the reviews were quantitatively expressed. There were five steps involved: data crawling, data preprocessing, word frequency analysis, sentiment analysis, and topic analysis.
4.2.2. Result
Sample Selection
The samples in this section were all selected from customer reviews of hotels located in the eastern region of China, with a total of 32 smart homestays involved. They were chosen with strict criteria according to the five stages of accommodation: reservation, check-in, living, check-out, and information sharing. In each stage, intelligent service was provided, and the performance was measured. The deadline for the selection of sample data was 10 May 2024. Finally, a total of 2739 comments were captured using the web crawler.
Word Frequency Analysis
Word frequency analysis reveals a series of high-frequency words that occupy a significant proportion of the evaluations of users. The word “room” ranked first in the list, with a frequency of 1444 appearances, which highlighted the attention that customers paid to the environment of the accommodation. Following closely behind was the word “clean”, which was mentioned 1083 times. The figure reflected users’ emphasis on hygiene standards. Customers also paid close attention to the quality of service, and the term “service” appeared 778 times, which indicated the importance of service in user satisfaction. Following these, the words “smart”, “intelligent”, “smart homestay”, and “fully intelligent” occurred with frequencies of 357, 55, 46, and 40 times, respectively.
Other high-frequency words such as “hotel”, “hygiene”, “environment”, “homestay”, “special”, “enthusiasm”, “facilities”, “intelligence”, “recommendation”, “next time”, and “check-in” all had a frequency of over 300 times. From these figures, the users’ focuses were outlined according to their evaluations. The frequent appearance of these words not only revealed the expectations of users for the experience of smart accommodation, but also reflected the aspects that service providers should make efforts to improve user satisfaction.
In contrast, there were some low-frequency words such as “toilet”, “silver beach”, “sound insulation”, “quiet”, “design”, “yard”, “shop”, “photography”, “air conditioning”, “surroundings”, “provision”, “sea view room”, “projection”, “curtains”, “strategy”, “little sister”, “upgrade”, “entrance”, “beach”, “thoughtful”, “processing”, “sunset”, “landlord”, “attraction”, “one-time”, “attitude”, “minute”, “next to”, “restaurant”, and “sea”. Although they did not appear frequently, they are of significance to researchers in terms of understanding the specific details of customers’ attitudes. They are also valuable for analyzing and evaluating specific users (Figure 7).
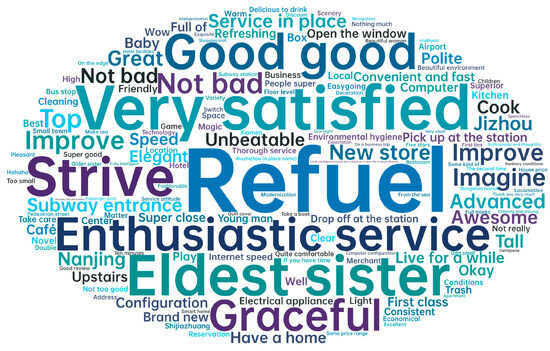
Figure 7.
Smart homestays word cloud map in eastern China (word frequency).
There are two word cloud maps. First, we selected the top 150 words according to word frequency and made word cloud maps in English (Figure 7). Secondly, the word cloud map is made according to the TF-IDF index (Figure 8). The two results show that although the word cloud map based on word frequency has a certain frequency of “smart home”, “intelligent”, and “voice assistant”, according to the index of TF-IDF, the importance of these words or keywords are insufficient.
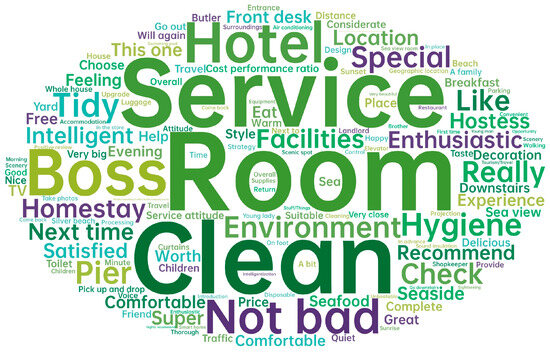
Figure 8.
Smart homestays word cloud map in eastern China (TF-IDF).
Sentiment Analysis
The ROST CM6 system was used in this study to process the collected data, and the results can be divided into three groups according to customers’ attitudes, which are positive, neutral, and negative. According to the analysis results, negative vocabulary accounted for 0.1%, generally negative vocabulary accounted for 22.8%, neutral vocabulary accounted for 19.9%, generally positive vocabulary accounted for 55.8%, and positive vocabulary accounted for 1.4%. The analysis results showed that the overall emotional tendency was positive. Among the 100 words that were listed, most of them showed a positive direction in customers’ emotional scores and emotional direction. These words included but were not limited to “intelligence”, “service”, “good”, “hotel”, “hygiene”, “environment”, “homestay”, “enthusiasm”, “facilities”, “intelligence”, “recommendation”, “next time”, “stay”, “comfortable”, “satisfied”, “tidy”, “experience”, “landlady”, “dock”, “comfortable”, “like”, “this house”, “seaside”, “decoration”, “super”, “seafood”, “cost-effectiveness”, “complete”, “sea view”, “considerate”, “breakfast”, “worth it”, “transfer”, “delicious”, “choice”, “one family”, “free”, “children”, “distance”, “style”, “suitable”, “transportation”, “ “price”, “housekeeper”, “warm”, “travel”, “help”, “overall”, “friend”, “silver beach”, “quiet”, “design”, “courtyard”, “shop”, “photography”, “surrounding”, “offering”, “projection”, “strategy”, “upgrade”, “beach”, “thoughtful”, “sunset”, “attraction”, “disposable”, “attitude”, “restaurant”, “ocean”, etc. These vocabularies covered multiple aspects of the accommodation experience, such as hygiene, service, environment, facilities, location, price, and so on, displaying positive feedback from users on these aspects.
However, there were also a few words that displayed a negative emotional direction, such as “room”, “boss”, “real”, “location”, “front desk”, “toilet”, “sound insulation”, “luggage”, “air conditioning”, “downstairs”, “travel”, “accommodation”, “eating”, “going out”, “toilet”, “landlord”, “minute”, and “next to”. These words reflected users’ negative attitudes or dissatisfaction in related aspects.
Overall, although there were some negative evaluations, positive evaluations took up a dominant share in the evaluations of customers, which indicated that the emotional tendency of users was generally positive. In other words, a large proportion of users held positive attitudes towards their experience, and they posted positive evaluations of their smart homestay period (Table 15).
Table 15.
Proportion of emotional words in smart homestays in eastern China.
Theme Analysis
This study mainly examined the section related to intelligent services. Therefore, the comments selected generally focused on the reviews of customers of the intelligent facilities in their accommodation experience, such as the intelligent control systems, automated services, online booking, payment systems, etc., in their stay. At the same time, the service experience included front desk service, room service, repair response speed, employee professionalism, friendliness, etc. The application of intelligent technology and high-quality service are important factors in improving customer experience. Through LDA theme analysis, homestay managers are able to understand the issues that customers are most concerned about and thus improve services and facilities in a targeted manner to enhance customer satisfaction. For instance, if comments on the theme of “Intelligent Service Experience” complain about the complexity of intelligent device operation, managers ought to consider simplifying the operation process or providing more detailed guidance to improve their service. For another example, suppose the comments on the theme of “vacation experience” reflected that customers were in need of surrounding activities; homestay managers could consider collaborating with local tourism agencies to provide more diverse activity options (Table 16).
Table 16.
Part of text for smart homestays in smart service experience—LDA thematic analysis.
4.3. Scientific Discussion
Currently, the development of smart homestays is still in its initial stage in China, while the growth of smart hotels is accelerating, entering a high-speed development stage and far exceeding the development speed of smart homestays. Taking Alibaba’s intelligent unmanned hotel as an example, although there are mixed attitudes towards it, its emergence is an inevitable process in the era of intelligence. This paper intends to provide a thorough examination of the ways that intelligent services improve the satisfaction of smart homestays across three stages: before check-in, during the stay, and after check-out. The analysis is based on the research results of this paper, combined with the current situation of smart hotels in the accommodation industry.
Firstly, before check-in, which includes sections of reservation and check-in, the results presented in the paper indicated that customer expectations and perceived value had a direct positive impact on customer satisfaction during the booking process of the smart homestay. It was also confirmed by the consumption habits of Generation Z, who are concerned about the relationship between the overall quality of intelligent services and the price paid. Although there is not much literature on smart homestays, there are some records on smart hotels. For example, Alibaba’s “Fei Zhu Bu Ke” unmanned hotel has its own Fly Zoo app that is used to introduce the basic information of the hotel on its homepage and its simple design allows users to quickly obtain necessary information. Users are able to select their preferred rooms on the reservation interface and view the layout and equipment of hotel rooms in 360 degrees, enabled using panoramic technology. It is also possible for them to access the quick parking service interface and add a license plate to directly enter the exclusive parking lot provided by the hotel, which effectively solves problems related to parking [57,58]. Although there exist fundamental differences between homestays and hotels, smart devices and online services can indeed help improve customer expectations and perceived value before check-in, thereby increasing customer satisfaction with reservations.
Concerning check-in, the results show that perceived value was the only important factor that directly affected customer satisfaction. The check-in process involves a series of steps, including identity authentication, obtaining the gatekeeper key or room card, interpretation of check-in instructions and guidelines, and introduction of the surroundings. All of these are essential aspects that have noticeable effects on the satisfaction of customers. In previous studies, the differences between homestays and hotels have been mentioned. Especially for Generation Z, homestays provide a way for them to socialize and entertain, which makes this type of accommodation more leisurely [59]. Some smart hotels, such as Alibaba’s “Fly Zoo” unmanned hotel, are equipped entirely without personnel during the whole process, and robots are involved in guiding users and recognizing their faces before their stay. In this sense, is the automation of some parts of smart homestays, such as identity authentication and access control, suitable? Can robots provide a humanized introduction to the check-in process and surrounding environment in order to allow customers to have a better understanding of the local culture? Unfortunately, this has not yet been achieved. Communication and the emotional connection between local people and robots may progress rapidly in the future and bring equally effective services to people in the future.
Secondly, in terms of living satisfaction after check-in, according to the research results, perceived value was also the only factor that directly affected living satisfaction. In other words, there was a significant connection between the price that customers paid for smart homestays and the intelligent services they could enjoy. With regard to the living part in smart homestays, smart assistants or smart voice can help users control the smart devices inside the house to achieve their ideal living state with a satisfying living environment. Compared with hotels, homestays place more emphasis on the family atmosphere and local cultural expression during the stay [59]. Smart devices provide convenience to help customers simplify the process of hardware usage. Their use can be justified by the example of Alibaba’s “Fly Zoo” smart hotel, where robots and voice assistants are used to assist and complete a series of activities from check-in to dining [58]. The use of smart homestay devices can be illustrated as a reference, but further research and exploration are needed if there is an intention to create a sense of family atmosphere and help visitors thoroughly understand the local culture. In a nutshell, “living” is an important part that affects customer satisfaction, and the overall feeling of this part among customers directly affects perceived value.
Finally, after check-in, the following behavior can be divided into check-out and information sharing, and these two parts are similar between smart homestays and smart hotels. However, currently, smart hotels are more convenient, such as the “Fly Zoo” smart hotel, which only requires users to check out on the app with any electronic device. Due to the unique features of smart homestays, such as the large number of visitors in groups traveling with the purpose of leisure and entertainment, emphasis on aspects relating to humanistic care need to be emphasized. During the check-out phase, businesses are expected to invest more to provide quality services to customers, and how to make customers check out quickly with a sense of satisfaction and happiness is an issue that they need to consider. This is also an important component of the information-sharing section. Generation Z is enthusiastic about sharing, especially during travel time [60]. In this sense, in this digital age, information sharing is one of the important channels for customers to be aware of businesses, and certainly, it is also an important channel for companies to promote their products and services.
In short, although the development of smart homestays is far behind that of smart hotels, it has promising development prospects in the foreseeable future to be looked forward to. Compared to smart hotels, smart homestays can better reflect the culture of a destination and provide customers with a relaxing environment both physically and mentally, which is in accordance with the mainstream traveling trends in Generation Z [60]. Improving the perceived value of smart homestay customers is of vital importance and understanding the needs of Generation Z prior to this is an essential step when intending to identify their pain points. Undoubtedly, in this process, the five main steps, namely reservation, check-in, living, check-out, and information sharing, can form a closed loop for more comprehensive analysis and examination to be prepared to find solutions to problems.
5. Conclusions
A questionnaire survey was used in this study to collect information from a population who had experience living in smart homestays in the eastern region of China. Strict tests were conducted to examine the reliability and validity of the questionnaire. Moreover, structural equation modeling was used to test research hypotheses and obtain the corresponding research results. During data analysis, the American Customer Satisfaction Index (ACSI) was used to explore the five stages of smart homestays, which were making a reservation, checking in, living, checking out, and sharing information. They were measured in terms of perceived quality, perceived value, customer expectations, customer satisfaction, customer complaints, and customer loyalty scores. In the analysis, the proportion of the Generation Z population exceeded 60% of the total customers.
This study found that across the five stages of living in a smart homestay, perceived quality had no significant impact on customer satisfaction. In other words, perceived quality did not directly affect user satisfaction. Meanwhile, customer expectations did not have a significant impact on perceived value in these five stages. In the reservation section, customer expectations had a significant impact on customer satisfaction, but in the other four stages, there was no significant impact on customer satisfaction. In short, in the future service satisfaction evaluation system in the intelligent homestay industry, perceived value does not directly affect user satisfaction; however, on the other hand, it could act on customer satisfaction as a moderating variable. For instance, it could influence the degree of customer satisfaction through perceived value. In comparison, customer expectations directly affected customer satisfaction in the booking process, but they did not directly affect customer satisfaction in the other four stages. Perceived value had a direct impact on customer satisfaction across the five stages. It is recommended that this be taken into consideration when formulating service standards for smart homestays. Perceived value not only played a moderating role in perceived quality and customer satisfaction but also affected customer satisfaction separately.
According to research on the five stages of smart accommodation—making a reservation, checking in, living, checking out, and sharing information—it was found that customer satisfaction determined customer loyalty and the level of complaint. The higher customer satisfaction was, the fewer customer complaints there were, with higher customer loyalty. Similarly, when there were more customer complaints, there was less customer loyalty. Therefore, customer satisfaction played a crucial role throughout the entire process. For the Generation Z group, in particular, the results indicate that it is of great importance to pay attention to customers’ perceptions of value and quality.
Subsequently, in order to further understand the real feelings of users of smart homestays towards smart services, this study explored evaluations and reviews of 32 smart homestays in eastern China that were posted on major tourism websites. The research results showed that although intelligent services were included in smart homestays and users tended to accept intelligent services to a certain degree, in an entire text analysis, intelligent services were found to take up a relatively low proportion, which showed that intelligent services are not yet mature enough. In the Theme Analysis Section, the results clearly indicate that the processes of intelligent services are relatively complex, and intelligent services might encounter failures. Thus, when necessary, services provided by human workers are still needed.
6. Limitations and Future Directions
Due to restrictions in terms of research time and conditions, there are still some limitations. Firstly, the research sample was limited. There is a large population in the eastern region of China, yet the research results came from a sample size of 370 people; therefore, they failed to reflect the attitude of the entire Generation Z population towards satisfaction with the smart homestay industry in the region. Secondly, during the research process, due to the limited number of smart homestays and the limited number of people who have lived in smart homestays now, it failed to tap into more information about the user experience. Finally, regarding the online text analysis, the information was fragmented, and only the basic outline of smart homestay perception was known through the research results, which could not reveal the complex relationship between smart homestays (smart services) and customer perception in a more in-depth way. It is suggested that future studies should be based on theories combined with on-site observations and interviews with hotel managers, employees, and customers.
Generation Z became the main consumer force in China in the 21st century, and according to tourism consumption reports in 2022 and 2023 [15,57], smart homestays have become the priority when choosing their accommodations. Advancements in intelligent technology will accelerate the development of smart homestays. As a result, there should be further research on smart homestays targeting this population in the future.
Author Contributions
Conceptualization, X.W., J.X. and Y.P.; methodology, X.W. and J.X.; software, X.W. and J.X.; validation, X.W.; formal analysis, J.X.; investigation, X.W.; resources, X.W.; data curation, J.X.; writing—original draft preparation, X.W.; visualization, J.X.; supervision, Y.P. All authors have read and agreed to the published version of the manuscript.
Funding
This research received no external funding.
Institutional Review Board Statement
All subjects gave their informed consent for inclusion before they participated in the study. Ethics approval is not required for this type of study. The study was conducted following the local legislation: https://www.law.go.kr/LSW//lsLinkCommonInfo.do?lspttninfSeq=75929&chrClsCd=010202 (accessed on 29 June 2024).
Informed Consent Statement
Informed consent was obtained from all subjects involved in the study.
Data Availability Statement
All data generated or analyzed during this study are included in this article. The raw data are available from the corresponding author upon reasonable request.
Acknowledgments
All authors would like to thank those who supported us in this work. We thank the reviewers for their comments and efforts to help improve the paper.
Conflicts of Interest
The authors declare no conflict of interest.
References
- Feng, Y.; Chen, X.; Lai, I. The effect of visitor experience quality on perceived value and satisfaction of B&B accommodation in Southwest China. Hotel. Tour. Insights 2020, 4, 121–135. [Google Scholar]
- Gursoy, D.; Malodia, S.; Dhir, A. Virtual worlds in the hospitality and tourism industry: An overview of current trends and future research directions. J. Hosp. Mark. Manag. 2022, 31, 527–534. [Google Scholar] [CrossRef]
- Li, M.; Yin, D.; Qiu, H.; Bai, B. A Systematic Review of AI Technology-Based Service Encounters: Implications for Hospitality and Tourism Operations. Int. J. Hosp. Manag. 2021, 95, 102930. [Google Scholar] [CrossRef]
- Ruiz-Alba, J.L.; Martín-Peña, M.-L. Guest Editorial. J. Bus. Ind. Mark. 2020, 35, 385–389. [Google Scholar] [CrossRef]
- Cheong, F.; Huang, Q.; Ye, H.; Law, R. Application and Consequences of Service Robots in Tourism and Hospitality Scenarios: A Systematic Literature Review. J. Qual. Assur. Hosp. Tour. 2023, 62, 1–23. [Google Scholar] [CrossRef]
- Liu, J.; Hall, C.M.; Zhu, C.; Ding BCheng, V. Redefining the concept of smart tourism in the tourism and hospitality industry. Anatolia 2023, 35, 566–578. [Google Scholar] [CrossRef]
- Xie, X.; Lei, W. Research on the picture and mode of high-quality development of Chinese-style digital cultural tourism industry in the era of ‘Intelligence+’. J. Soochow Univ. (Soc. Sci. Ed.) 2023, 44, 171–179. [Google Scholar] [CrossRef]
- Ye, S.; Xiao, H.; Zhou, L. Small lodging business growth in rural areas: Implications for guest experience and financial performance. Int. J. Hotel. Manag. 2019, 76, 29–38. [Google Scholar]
- National Bureau of Statistics (NBS). China. Available online: https://data.stats.gov.cn/easyquery.htm?cn=E0103 (accessed on 23 April 2024).
- Chen, M.G.; Zang, S. Comparison of Living Standards of Chinese Regional Residents-Based on Global Nighttime Lighting Data. Econ. Theory Econ. Manag. 2021, 41, 48–67. [Google Scholar] [CrossRef]
- TravelSmart: China Lodging Industry-2023 Annual Data Report. Available online: https://www.sgpjbg.com/baogao/150590.html (accessed on 25 April 2024).
- Wu, D.; Feng, X.; Ma, R.; Wu, Y.; Hao, C. Detecting the Evolution and Causes of Competitive Patterns in the B&B and Hotel Industry in Metropolitan Areas—The Case of Shanghai. Hum. Geogr. 2022, 37, 158–166. [Google Scholar] [CrossRef]
- Tik Yin Hotel Homestay Special Report 2023. Available online: https://www.djyanbao.com/report/detail?id=3592128&from=preview&aiStatus=0 (accessed on 30 April 2024).
- Wang, B. How the New Consumer Culture Affects Generation Z: Mechanisms, Risks and Responses. China Youth Stud. 2023, 3, 14–21. [Google Scholar] [CrossRef]
- 2023 China Travel Consumption Trend Insight White Paper. Available online: https://www.xdyanbao.com/doc/13u8w17g0x?bd_vid=10093554209434624449 (accessed on 5 May 2024).
- Bowen, J.T.; Che, S.L. The relationship between customer loyalty and customer satisfaction. Int. J. Contemp. Hosp. Manag. 2001, 13, 213–217. [Google Scholar] [CrossRef]
- Huang, J.; Shan, W. Research on service quality improvement of B&B in Hangzhou West Lake scenic area based on tourists’ satisfaction. Value Eng. 2019, 38, 61–64. [Google Scholar]
- Dai, Q.; Dai, Y.; Chen, Z.; Yao, L.; Wei, L.; Xu, W. Research on perceived value, satisfaction and loyalty of B&B tourists. Geogr. Geogr. Inf. Sci. 2023, 39, 138–144. [Google Scholar] [CrossRef]
- Jenny, K.J.; Han, H. The hotel of the future: Exploring the attributes of smart hotels using a hybrid approach. J. Travel Tour. Mark. 2020, 37, 804–822. [Google Scholar]
- Mare, S.; Roesner, F.; Kohno, T. Smart devices in Airbnb: Considering privacy and security for guests and hosts. Proc. Priv. Enhancing Technol. 2020, 2020, 436–458. [Google Scholar] [CrossRef]
- Lin, K. Research on the Application of Intelligent Home in B&B Design; Guangxi Normal University: Guilin, China, 2020. [Google Scholar]
- Liu, Y. Smart Building based on Smart City: Perfect integration of technology and architecture. Decor. World 2018, 1–79. (In Chinese) [Google Scholar] [CrossRef]
- Donald, A.N. Design Psychology. In Emotional Design; CITIC Press: Beijing, China, 2012. [Google Scholar]
- Huang, H.; Bing, Z. A study on Multi-dimensional Differentiation of tourist perception and local identity in the microspace of homestay Culture: A case study of Shanghai. Geogr. Res. 2021, 40, 2066–2085. [Google Scholar] [CrossRef]
- Jiang, H. Hotel Operation Management; Huazhong University of Science and Technology Press Co., Ltd.: Beijing, China, 2020; ISBN 9787568066990. [Google Scholar]
- Wamg, J.; Ma, Y.; Shen, Z.; Lin, Y. Reflections on spatial distribution characteristics and spatial layout optimisation of lodging in Xiamen. Planner 2019, 35, 71–76. [Google Scholar] [CrossRef]
- Wu, W.; Guo, B.; Yang, H.; Sun, H. The impact of review text on hotel satisfaction: An approach based on sentiment analysis. Data Anal. Knowl. Discov. 2017, 1, 62–71. [Google Scholar]
- Zhou, X.; Su, X. Customer satisfaction Model construction and empirical research of economy hotel. Jiangsu Bus. Theory 2009, 5, 31–33. [Google Scholar]
- Li, J. Research on the Influencing Factors of Customer Satisfaction of B&B Based on ACSI. Ph.D. Thesis, Tianjin University, Tianjin, China, 2020. [Google Scholar]
- Li, W.L.; Guo, X.; Yin, Z.H. Research on service quality of smart hotels based on Web Text analysis—A case study of F Hotel in Hangzhou, Zhejiang Province. Trade Fair Econ. 2024, 5, 121–124. [Google Scholar] [CrossRef]
- Bai, S. Research on HX Homestay Hotel Precision Marketing Strategy under the Digital Background. Ph.D. Thesis, The Ministry of Commerce International Trade and Economic Cooperation Research Institute, Beijing, China, 2024. [Google Scholar] [CrossRef]
- Zhang, Y.Q. Research on the Impact of Perceived Attributes of Hotel Service Robots on Customer Satisfaction Based on Text Mining. Ph.D. Thesis, Zhejiang Normal University, Jinhua, China, 2023. [Google Scholar] [CrossRef]
- Source Top Ten Brands. Available online: https://www.cnpp.cn/china/list_6461.html (accessed on 25 May 2024).
- Angelova, B.; Zekiri, J. Measuring Customer Satisfaction with Service Quality Using American Customer Satisfaction Model (ACSI Model). Int. J. Acad. Res. Bus. Soc. Sci. 2011, 1, 232–258. [Google Scholar] [CrossRef]
- Shen, H. On the testing model of customers’ satisfaction in budget-type hotels based on the framework of ACSI. Tour. Trib. 2011, 26, 58–62. [Google Scholar] [CrossRef]
- Fan, W.; Chen, X.; Peng, J.; He, Y. Research on customer satisfaction evaluation index system of economic hotels. Mod. Bus. 2018, 98–99. [Google Scholar] [CrossRef]
- Kim, S.H.; Cha, J.; Singh, A.J.; Knutson, B. A longitudinal investigation to test the validity of the American customer satisfaction model in the U.S. hotel industry. Int. J. Hosp. Manag. 2013, 35, 193–202, ISSN 0278-4319. [Google Scholar] [CrossRef]
- Anderson, E.W.; Fornell, C. The foundations of the US customer satisfaction index. Total Qual. Manag. 2000, 11, 869–882. [Google Scholar] [CrossRef]
- Morgeson, F.V., III; Hult, G.T.M.; Sharma, U.; Fornell, C. The American Customer Satisfaction Index (ACSI): A sample dataset and description. Data Brief 2023, 48, 109123. [Google Scholar] [CrossRef]
- Deng, W.J.; Yeh, M.L.; Sung, M.L. A customer satisfaction index model for international tourist hotels: Integrating consumption emotions into the American Customer Satisfaction Index. Int. J. Hosp. Manag. 2013, 35, 133–140. [Google Scholar] [CrossRef]
- Jiang, H.; Huang, J. Research on Influencing Factors of Customer Satisfaction in Private Cinema Based on ACSI Model. Jiangsu Bus.J. 2022, 15, 7–11. [Google Scholar] [CrossRef]
- McDougall, G.; Levesque, T. Service and SAT: Putting Perceived Value into the Equation. J. Serv. Mark. 1987, 14, 392–410. [Google Scholar] [CrossRef]
- Xie, X.; Li, Y.; Wang, R.; Gou, Z. Park Recreation Intention and Satisfaction of Blue-Collar Workers Based on the ACSI Model: A Case Study of Anning Industrial Park in Yunnan. Land 2023, 12, 798. [Google Scholar] [CrossRef]
- Li, T.; Wang, S. How to Improve the Public Trust of the Intelligent Aging Community: An Empirical Study Based on the ACSI Model. Int. J. Environ. Res. Public Health 2021, 18, 1971. [Google Scholar] [CrossRef]
- Hult GT, M.; Morgeson, F.V.; Morgan, N.A.; Mithas, S.; Fornell, C. Do managers know what their customers think and why? J. Acad. Mark. Sci. 2017, 45, 37–54. [Google Scholar] [CrossRef]
- Fornell, C.; Johnson, M.D.; Anderson, E.W.; Cha, J.; Bryant, B.E. The American customer satisfaction index: Nature, purpose, and findings. J. Mark. 1996, 60, 7–18. [Google Scholar] [CrossRef]
- Oliver, R.L. Cognitive Models of Antecedents and Consequences of Satisfaction Decisions. J. Mark. Res. 1980, 17, 460–469. [Google Scholar] [CrossRef]
- Johnson, M.D.; Gustafsson, A.; Andressen, T.W.; Lervik, L.; Cha, J. The Evolution and Future of the National SAT Index Model. J. Econ. Psychol. 2001, 22, 217–245. [Google Scholar] [CrossRef]
- Bemile, R.; Achampong, A.; Danquah, E. Online hotel reservation system. Int. J. Innov. Sci. Eng. Technol. 2014, 1, 583–588. [Google Scholar]
- Fu, R. Countermeasures of Hotel room Service in the era of Artificial Intelligence: A case study of Shangri-La Hotel in Suzhou. Contemp. Tour. 2020, 12, 55–56. (In Chinese) [Google Scholar] [CrossRef]
- Sun, C.; Zhu, R.; Li, X. Research on web crawler KMR based on Python language. Comput. Simul. 2023, 40, 504–507. (In Chinese) [Google Scholar] [CrossRef]
- Lv, X.; Yao, Y.; Liu, X. Based on text analysis of robot hotel user preferences and perception research. China Bus. Theory 2023, 5, 135–137. [Google Scholar] [CrossRef]
- Guo, Q.K.; Zhou, J. Validity of different IRT models in Likert scale analyses. Psychol. Inq. 2004, 24, 67–70. [Google Scholar] [CrossRef]
- Ab Hamid, M.R.; Sami, W.; Sidek, M.H.M. Discriminant validity assessment: Using the Fornell & Larcker criterion versus the HTMT criterion. J. Phys. Conf. Ser. 2017, 890, 012163. [Google Scholar]
- Morgan, G.A.; Leech, N.L.; Gloeckner, G.W.; Barrett, K.C. SPSS Introductory Statistics: Use and Interpretation; Psychology Press: Beijing, China, 2009; p. 9787121089947. [Google Scholar]
- Hinton, P.R.; McMurray, I.; Brownlow, C. SPSS in Detail; Routledge: London, UK, 2014. [Google Scholar]
- 2022z Generation Online Travel Consumption Report. Available online: https://www.sgpjbg.com/info/33398.html (accessed on 30 May 2024).
- Zhao, J. User Experience Design in smart Hotels: A case study of Fei Zhubuke. Design 2019, 33, 63–65. (In Chinese) [Google Scholar] [CrossRef]
- Peng, L. Comparative study on service quality factor attributes of hotels and homestays. Jiangsu Bus. Theory 2024, 5, 16–20. (In Chinese) [Google Scholar] [CrossRef]
- 2023 Generation Z Online Travel Insights Report. Available online: https://www.fxbaogao.com (accessed on 5 June 2024).
Disclaimer/Publisher’s Note: The statements, opinions and data contained in all publications are solely those of the individual author(s) and contributor(s) and not of MDPI and/or the editor(s). MDPI and/or the editor(s) disclaim responsibility for any injury to people or property resulting from any ideas, methods, instructions or products referred to in the content. |
© 2024 by the authors. Licensee MDPI, Basel, Switzerland. This article is an open access article distributed under the terms and conditions of the Creative Commons Attribution (CC BY) license (https://creativecommons.org/licenses/by/4.0/).