Abstract
A micro-expression (ME), as a spontaneous facial expression, usually occurs instantaneously and is difficult to disguise after an emotion-evoking event. Numerous convolutional neural network (CNN)-based models have been widely explored to recognize MEs for their strong local feature representation ability on images. However, the main drawback of the current methods is their inability to fully extracting holistic contextual information from ME images. To achieve efficient ME learning representation from diverse perspectives, this paper uses Transformer variants as the main backbone and the dual-branch architecture as the main framework to extract meaningful multi-modal contextual features for ME recognition (MER). The first branch leverages an optical flow operator to facilitate the motion information extraction between ME sequences, and the corresponding optical flow maps are fed into the Swin Transformer to acquire motion–spatial representation. The second branch directly sends the apex frame in one ME clip to Mobile ViT (Vision Transformer), which can capture the local–global features of MEs. More importantly, to achieve the optimal feature stream fusion, a CAB (cross attention block) is designed to interact the feature extracted by each branch for adaptive learning fusion. The extensive experimental comparisons on three publicly available ME benchmarks show that the proposed method outperforms the existing MER methods and achieves an accuracy of 81.6% on the combined database.
1. Introduction
Micro-expression (ME) refers to spontaneous and subtle changes in the facial muscles that cannot be restrained by the brain in a short time when humans are in high-risk situations. In this sense, ME analysis can accurately reflect human emotion fluctuations and has broad application prospects in national security, police interrogation, clinical diagnosis, depression analysis, and business negotiation with high requirements for emotional realism [1]. Unlike macro-expressions [2], which involve salient muscles in individual faces with a duration of 1/2 to 4 s, MEs are made up of a limited number of subtle muscle movements that last only 1/25 to 1/5 s [3]. Thus, to the best of our knowledge, the automatic analysis of MEs still faces critical obstacles due to its low intensity, short duration, and lack of significant variance between different categories.
Early researchers designed manual features to represent the useful information in facial images and further adopted the usual machine learning algorithms to identify MEs. These studies empirically designed several manual descriptors, such as Local Binary Pattern from Three Orthogonal Planes (LBP-TOP) [4], Histogram of Image Gradient Orientation (HIGO) [5], and Histograms of Oriented Optical Flow (HOOF) [6] and their variants, that can effectively capture representative information on the edges, textures, and facial movements to distinguish MEs. Particularly, the optical flow operator stands out among the traditional manual techniques for its powerful ability to infer the relative motions between various frames. The studies in [7,8] applied optical flow to ME recognition, and the relative motion information between frames offers a potent aid for efficient ME classification. Many convolutional neural network (CNN) variants, including VGG [9], AlexNet [10], GoogleNet [11], and ResNet [12], have evolved with the development of intelligent technologies such as machine learning, artificial intelligence, and powerful hardware design (GPU). Recently, Gan et al. [13] fused optical flow and a triple-stream CNN model (LAENET) for ME recognition. These CNN models have made a great advancement in ME recognition (MER). However, because CNN mechanisms filter images layer by layer using weight-sharing convolutional kernels, they tend to focus on the local information and neglect contextual connectivity, ignoring the effects of the global information.
Initially proposed in the field of natural language processing, Transformer [14], as a specific neural network structure, is mainly based on the self-attention mechanism, which aims to compensate for the global dependence shortcomings of CNN. Inspired by the strong representation capability of Transformer, some researchers have extended it to computer vision tasks. The application of Transformer to image processing, Vison Transformer (ViT), was first introduced in [15], and its excellent experimental performance opened a promising alteration for vision tasks. In contrast to CNN, ViT can model global features by using the entire image as input to better achieve the contextual relation in images. However, the strong performance of ViT will require excessive time and computer complexity to maintain it. To tackle this problem, Liu et al. presented the updated version of Swin Transformer [16], which significantly degrades the computational burden without losing the useful information via computing self-attention inside the local window. In addition, Mobile ViT [17] treats Transformer as a convolution operator to process the input images, combining the advantages of CNN and Transformer to reduce the parameters of the model and the computation complexity.
In this study, considering the outstanding performance of Swin Transformer and Mobile ViT, we construct and optimize a Transformer-based scheme with the dual-stream cross mechanism for the MER task from multiple representation learning perspectives. Specifically, our main contributions are as follows:
- The spatial–temporal information of MEs is extracted with a cascade of optical flow and Swin Transformer. From the temporal viewpoint and spatial viewpoint, Swin Transformer is applied to capture the diverse detail features in the optical map.
- Integrating CNN with Transformer, MobileViT is implemented to aggregate representative features in the ME apex frame, which can concentrate on both the subtle local information and the regional correlation (global) for informative ME representation.
- We construct a dual-branch Transformer framework and introduce the CAB (cross attention block) module to adaptively integrate temporal–spatial information with local–global information, which significantly boosts the recognition performance from diverse feature perspectives.
In summary, the core novelty is exploring the optimal combination of Transformer variants suitable for multimodal MER. More importantly, the learnable CAB is designed to adaptively fuse and enrich the feature representation of MEs in two aspects: temporal–spatial and local–global perspectives. The source codes for our MER model are available at https://github.com/chou-er/Dual-branch-Cross-Attention-Network-for-MER.git (accessed on 1 September 2023).
2. Related Works
Due to the practical value of ME recognition in daily life, researchers have made numerous explorations of efficient ME feature extraction in the past decades. Generally, research on micro-expressions is mainly divided into two categories: (1) the traditional handcrafted feature extraction methods and (2) the deep learning-based feature extraction approaches.
Traditionally, handcrafted features are developed to describe different facial expressions. Local binary pattern (LBP) triple orthogonal plane (LBP-TOP) [4] was introduced to extract textures of face images with high-dimensional LBP feature vectors. The optical flow operator can obtain motion features by describing the direction and speed of pixels in an image. Hong T et al. [1] formed a new method with three channels, namely, a horizontal optical flow sequence, a vertical optical flow sequence, and a grayscale image sequence to represent micro-expression image sequences and achieved good results in MER. Duque et al. [18] proposed an intrinsic two-dimensional local structure, decomposing micro-expression video frames with a Riesz pyramid and designing phase descriptors in the transform domain for micro-expression classification. The main idea of the optical flow operator is to capture the changes in the micro-expression sequence within the optical flow field to present its motion characteristics. Liu et al. [19] proposed the Main Direction Mean Optical flow (MDMO) feature and used classical graph regularized sparse coding for micro-expression recognition. With regards to MER, traditional manual feature extraction has made great progress, but its feature representation is scene-constrained and lacks concern for ME nuances.
With the extraordinary advancements of deep learning disciplines, convolutional neural networks (CNN) play an important role in the MER scheme by training multi-layer convolutional and pooling layers to extract key features of MEs, which leads to better accuracy of MER. Numerous deep learning models, including AlexNet [10], Google Net [11], ResNet [12], and so on, have shown promising performance in MER [20]. With the continuous optimization and architecture iteration of deep learning modesl, Transformer, with a stronger generalization performance, has emerged. Due to its powerful performance in natural language processing, many researchers have made significant progress in applying it to the computer vision field. Dosovitskiy et al. transform two-dimensional images into one-dimensional sequences and exploit a multi-head self-attentive mechanism to encode the input sequences and obtain the correlation between the sequences [15]. Compared with CNN, Transformer is concentrated on the global information in one image. For example, in [21], Zhang et al. use the Transformer network to learn the long-term and short-term relationships between space and time in video sequences, which shows a good generalization ability and high robustness. The excellent performance of Transformer, however, is hampered by several issues, including high computational complexity and a limited performance on large-scale image sets. To address these problems, ref. [16] proposed Swin Transformer, which first calculates the self-attention within a window and then designs sliding windows to interact the information between different windows, which makes the computational complexity of the network significantly reduced and has better performance. In addition, the proposed MobileViT combines the advantages of CNN and ViT by treating Transformer as convolution to process local and global information and retain important spatial information. MobileViT reduces the computational cost by using a local attention mechanism while achieving high accuracy with the reduction in parameters. As ME recognition belongs to computer vison fields, it is certain and reasonable to explore the good characteristics of Transformer variants in computer vision for efficient ME representation. Zhu et al. fuse CNN with Transformer, adopting a sparse self-attention mechanism to extract a sparse representation of feature maps [22], which can reduce the network complexity and improve the recognition performance. The model in [23] integrates inception-CBAM with a Vision Transformer for micro-expression recognition. A recent study uses a combination of CNN and Transformer to fuse local and global facial information in facial MEs [24]. However, MER based on Transformer is a straightforward integration of a single Transformer network, so it is worthwhile to explore the optimal fusion of Transformer variants for robust MER.
To the best of our knowledge, different basic frameworks emphasize specific facial features. In [25], two Transformer network frameworks are designed to extract facial information and motion information of face images and the features obtained from both are combined for classification. The study in [26] uses multiple Swin Transformers in parallel to obtain different weights by modifying the hyper parameters to capture different facial information for better discrimination of facial expression. In [27], the same image is divided into two patches with different sizes, each of which is fed into a separate Transformer network to extract features, and the information at different scales is fused using cross-attention to achieve a competitive result. Inspired by these multiple structure schemes, this study is based on the research hypothesis that a better ME recognition performance will be obtained by leveraging diverse frameworks and integrating them in an appropriate way.
3. The Proposed Method
3.1. Network Architecture
In this study, the characteristics of ME and the limitations of existing recognition methods are fully explored to boost the performance of MER. Following this motivation, we propose a MER model based on Transformer variations. The framework of the proposed MER model is illustrated in Figure 1. Specifically, this scheme adopts a dual-branch framework [28], where one branch sends the face image to a Swin Transformer after optical flow processing to extract the temporal–spatial information of ME, and the other branch sends the apex frame image to MobileViT to acquire the local–global information. More importantly, the multiple-mode features from the two branches interact through the CAB module for adaptive learning fusion. Each component is described in detail in the following section.
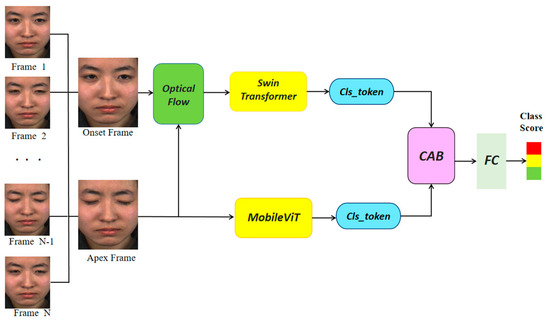
Figure 1.
The network architecture based on Transformer variations.
3.2. Branch 1—Temporal–Spatial Information Extraction
In this subsection, we will introduce the components in Branch 1 and its basic principles. Specifically, Branch 1 consists of an optical flow block and a Swin Transformer in series, which take the onset frame and apex frame of the ME sequence as input and compute the motion information of pixels between these two frames using the optical flow operator. The obtained optical flow map is fed into the Swin Transformer to extract the global information of images [29].
3.2.1. Temporal Information Extraction Using Optical Flow
An ME sequence generally contains an onset frame, apex frame, and offset frame, among which the apex frame is the most obvious frame about ME facial muscle movements. In an ME video, the segment from the onset frame to the apex frame can reflect the movement process of facial muscles, which is an important reference value for MER [30]. Aiming to reduce the computation burden and classify the ME more efficiently and quickly, this work selects the onset frame and the apex frame in the ME sequence to calculate the optical flow map, which can capture the movement information of MEs.
Optical flow is a widely used technique in computer vision that calculates the speed and direction of pixel motion by comparing the change in pixel intensity between adjacent frames. Therefore, it can infer the motion trajectory of the object at the corresponding position in the image. The incorporation of optical flow in MER has many advantages. On one hand, optical flow analysis can capture the subtle dynamic changes in MEs by providing high-resolution information. On the other hand, the optical flow information provides continuity information between frames, effectively maintaining the consistency of ME sequences and reducing noise and incoherence. Theoretically, the optical flow operator is based on the principle of constant luminance to calculate the motion characteristics between two frames. Suppose the pixel intensity at of the starting frame is , and after time , the pixel intensity moves a distance of and changes to:
According to the brightness constancy principle, we can obtain:
After the Taylor series expansion and the basic operation of mathematics, we can finally obtain the formula:
where denote the partial derivatives of the pixel intensity at in each direction, respectively and can be derived from the image data. is the requested ME optical flow estimation vector, which represents the size and direction of each pixel motion in the image [3].
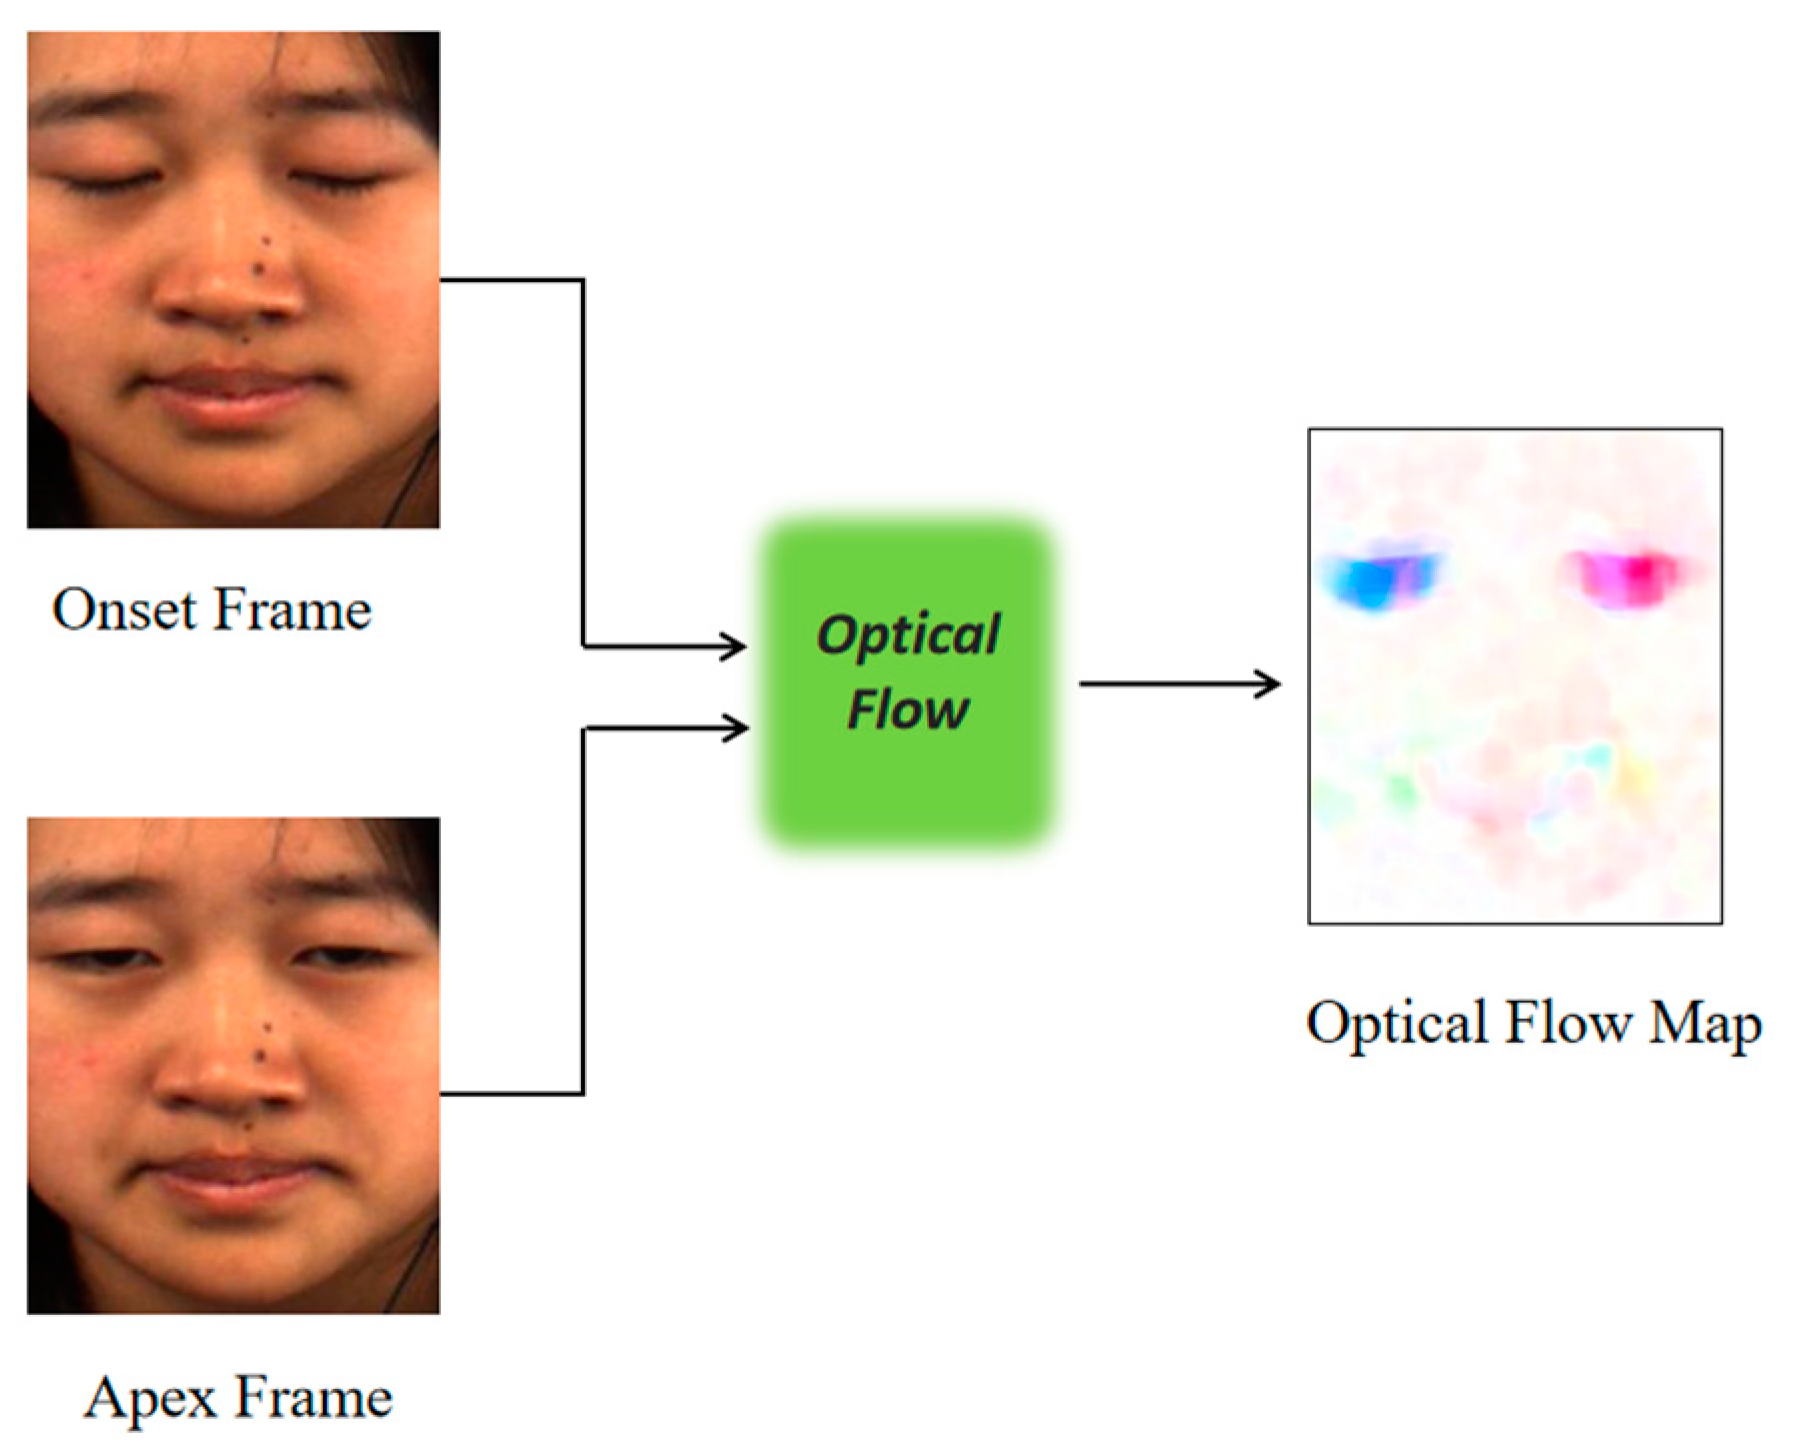
To describe the role of optical flow intuitively, this paper selects a sample with an obvious difference between two frames in the dataset as a demonstration. From Figure 2, it can be observed that it has two salient changes in the face during the change from the onset frame to the apex frame: ① the eyes change from tightly closed to open; ② the corners of the mouth have a slight upward movement. In the optical flow map on the right, the changes captured by the machine are reflected by the shades of color. Therefore, it is obvious that the optical flow effectively captures the changes in the eyes and corners of the mouth.

Figure 2.
Optical flow map.
3.2.2. Spatial Information Extraction Using Swin Transformer
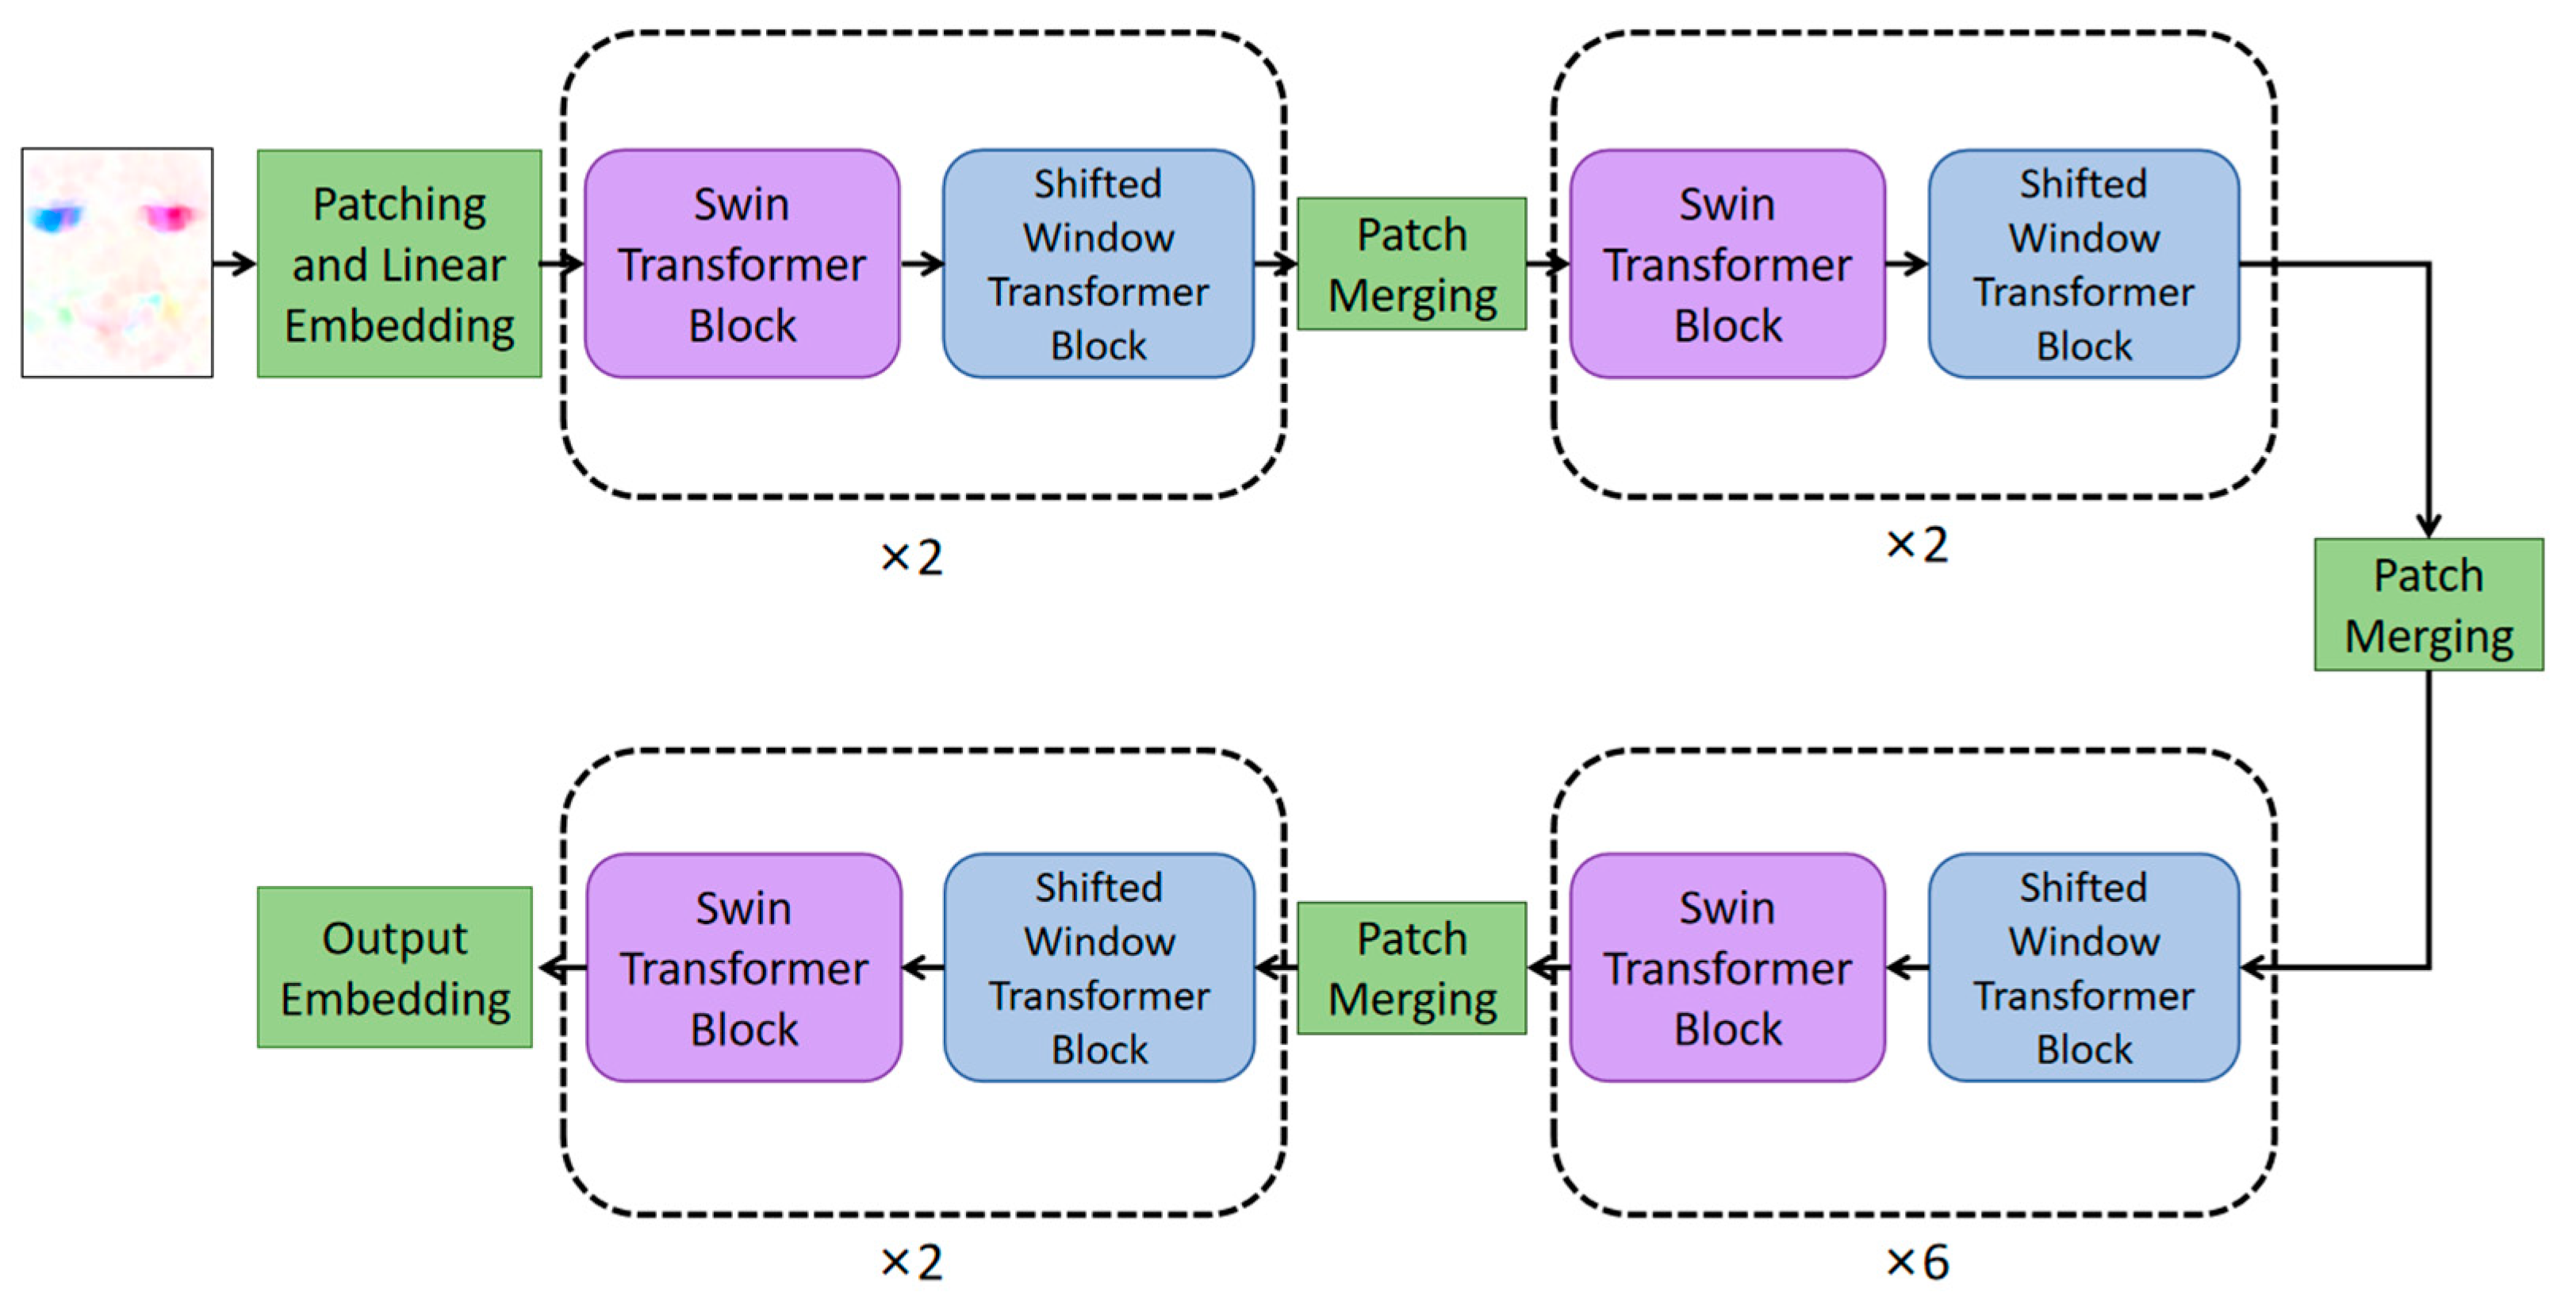
When Transformer processes an image, it divides the image into a number of small image patches of equal size and turns these small image patches into a one-dimensional sequence to be input into the Transformer encoder for processing [15]. Since the self-attention in Transformer is globally based, each patch in the sequence is computed once with the other patches, which causes a large computational overhead. To solve this problem, Swin Transformer introduces the improvement measures of W-MSA and SW-MSA, as shown in Figure 3.
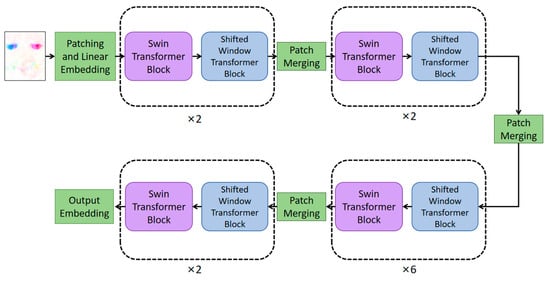
Figure 3.
The framework of Swin Transformer.
Figure 3 mainly consists of patch merging, a Swin Transformer block, and a shifted window Transformer block connected alternately. The input image is divided into windows with various scales in patch merging, self-attention is computed inside the window to obtain the local features of the image in the Swin Transformer block, and the sliding window strategy is used in the shifted window Transformer block to connect windows to windows. Swin Transformer divides the windows to compute self-attention without losing position information, which greatly improves the computational efficiency and model accuracy.
Following the above-mentioned principles, Swin Transformer is a powerful variant of the Transformer architecture that can be suitable for ME representation tasks. It captures the dynamic features and temporal dependencies in ME sequences by employing techniques such as patch-based processing, self-attention mechanism, multi-scale hierarchical modeling, and positional encoding, providing strong modeling capabilities for ME analysis. Firstly, Swin Transformer divides the ME sequence into non-overlapping blocks, where each block corresponds to a frame or a small group of consecutive frames. This block-based strategy allows the model to concentrate its attention on local temporal windows, better capturing the short-term temporal dependencies of MEs. Secondly, Swin Transformer utilizes a self-attention mechanism to model the relationships between different blocks in the ME sequence. The self-attention mechanism enables the model to dynamically allocate attention weights based on the contextual information in the sequence. By attending to other blocks related to the current block, Swin Transformer captures the temporal dynamics and dependencies in the ME sequence. Furthermore, Swin Transformer adopts a multi-scale hierarchical modeling strategy. It consists of multiple layers, each with different attention heads and perception window sizes. This hierarchical structure enables the model to simultaneously capture local and global temporal dependencies in the ME sequence. Lower layers can capture short-term temporal dependencies within each block, while higher layers can capture long-term dependencies across blocks. Finally, Swin Transformer introduces positional encoding to provide information about the order and relative positions of the blocks in the ME sequence. Positional encoding helps the model differentiate between different frames or frame groups and establish temporal connections. This allows Swin Transformer to fully leverage the temporal context within the ME sequence and extract the temporal information of MEs.
3.3. Branch 2—Local–Global Information Extraction Using Mobile ViT
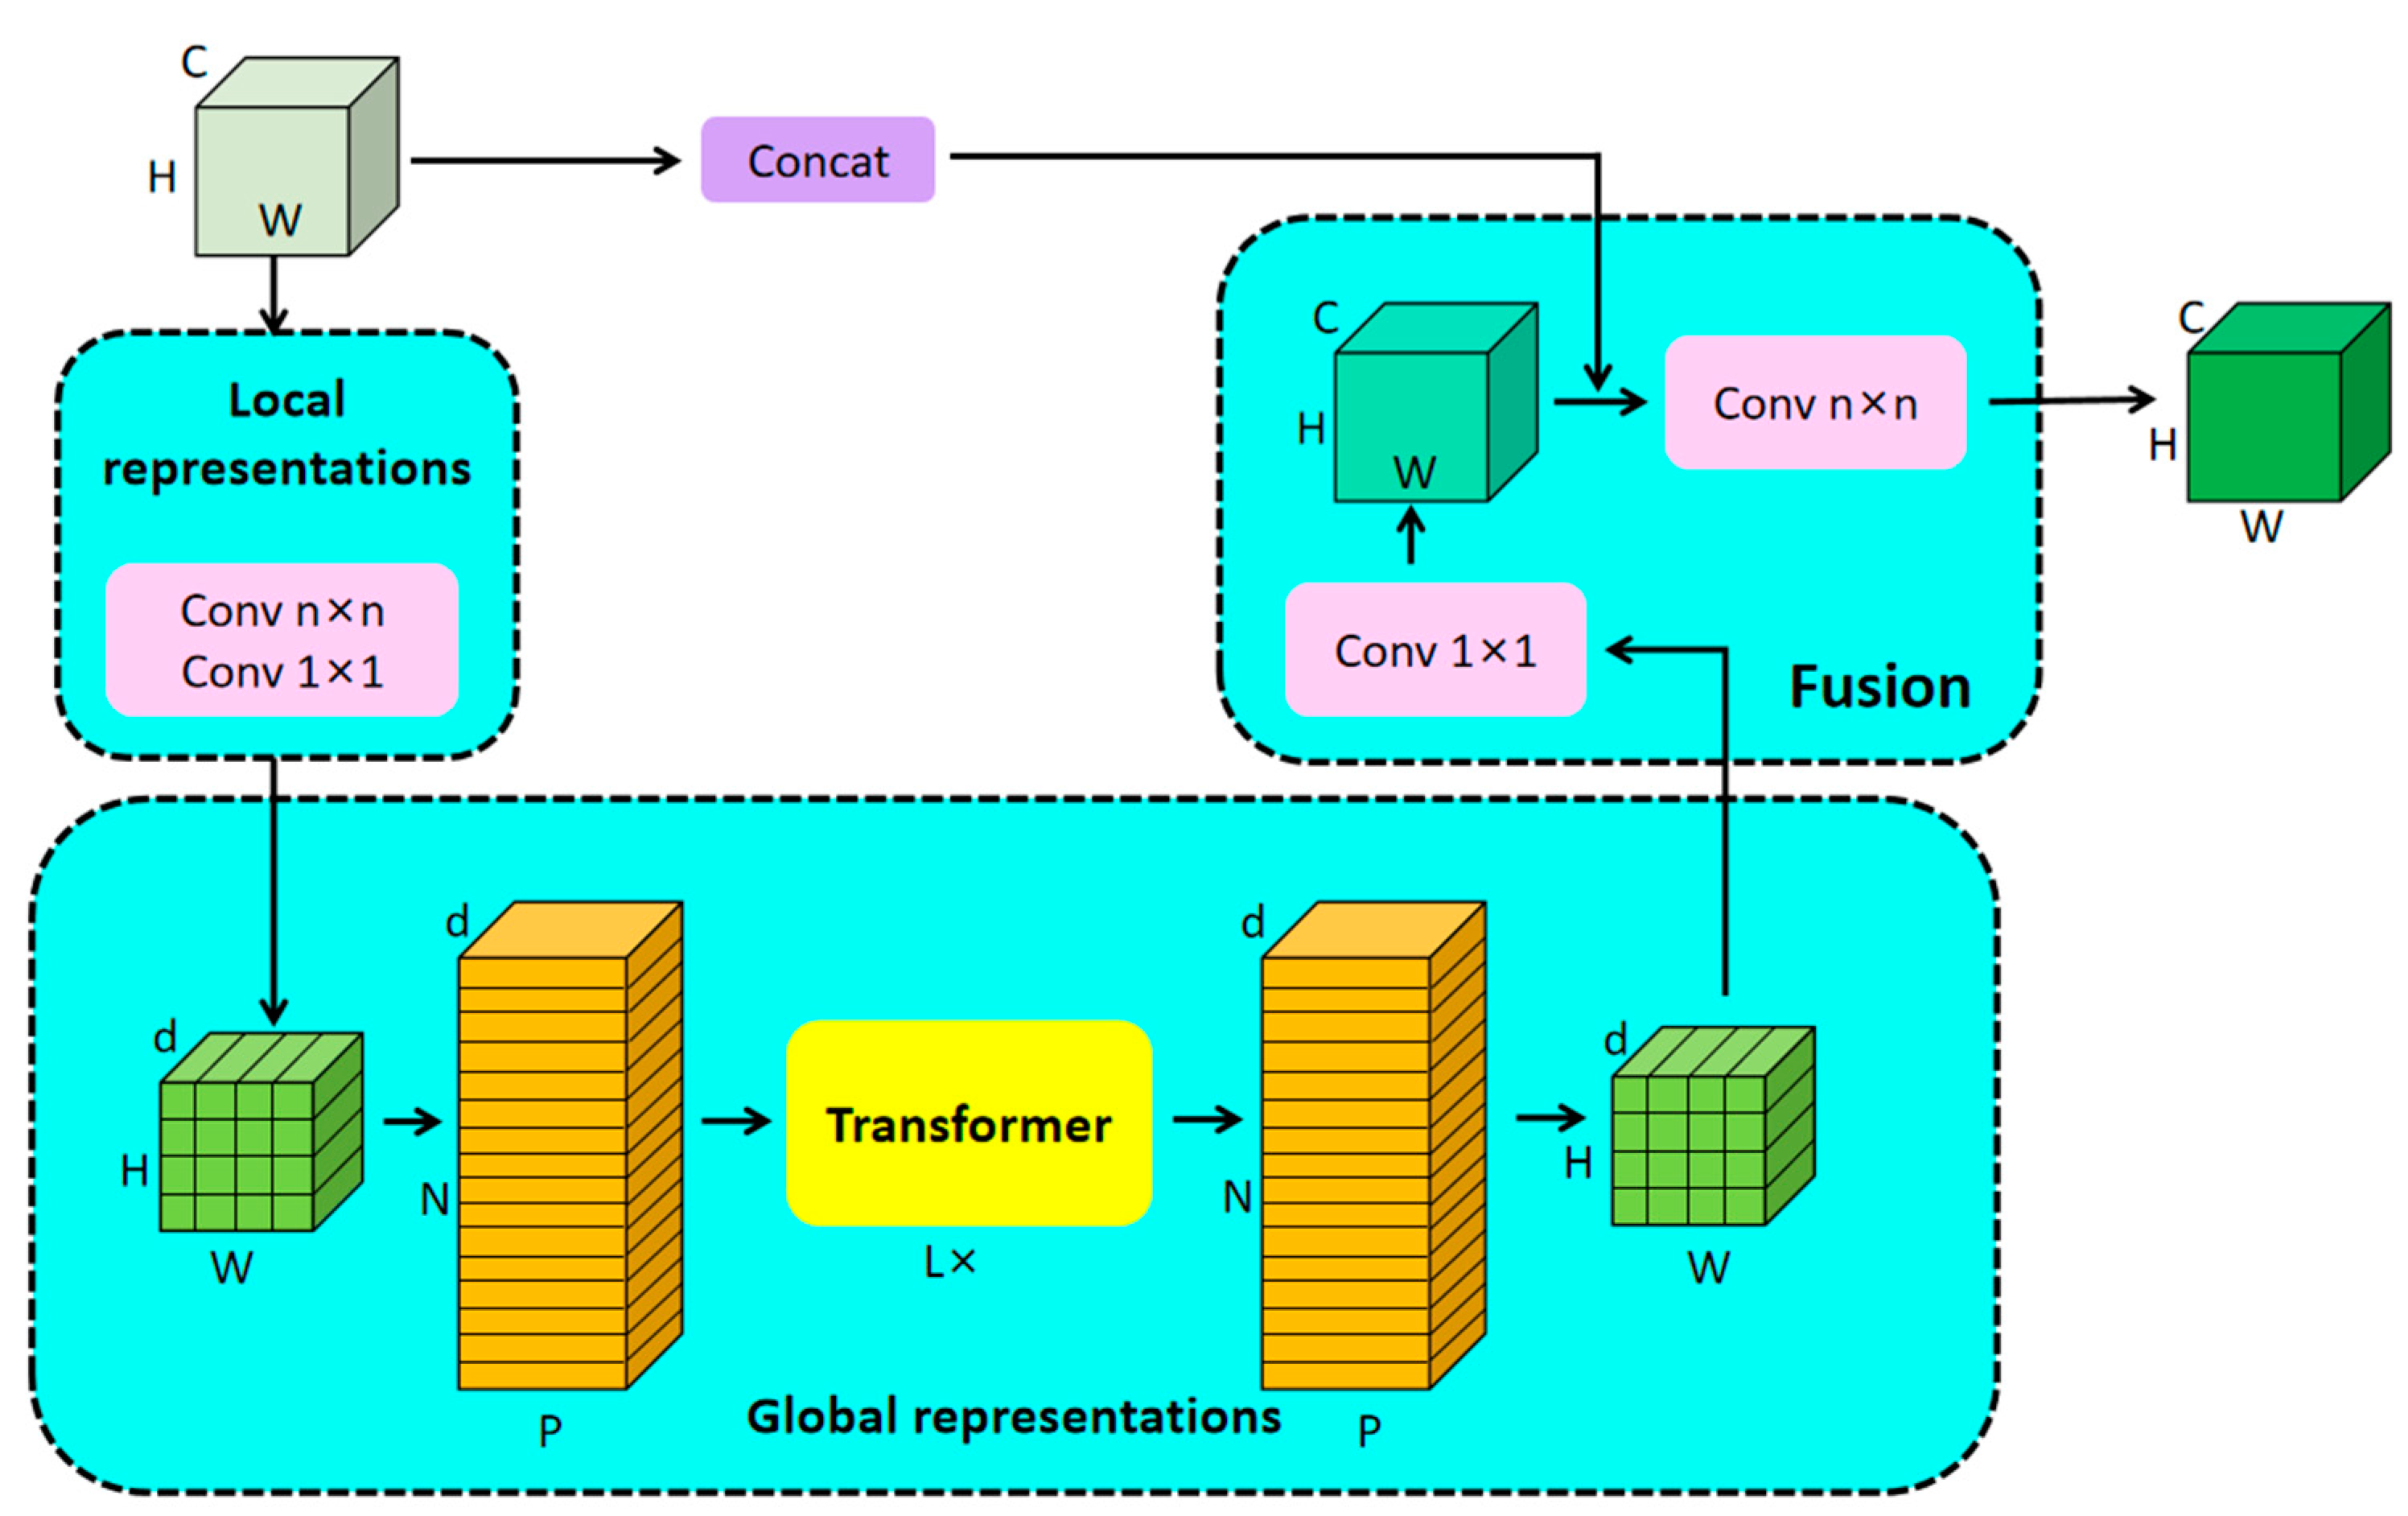
In this section, MobileViT, which implements global–local information extraction, is introduced in detail. In the development of deep learning, CNNs excel at extracting local features from images, while Transformer is good at extracting global features [31]. MobileViT combines both, treating Transformer as a convolution to process local and global information to map local features to the global context. The MobileViT block (Figure 4) is the core component of the MobileViT model, including the local representation, the global presentation, and the fusion module. In local representations, the local features of the image are first extracted using deep separable convolution, and the processed image is sent to the global representation module to be divided into a series of equal-sized patches, each of which is embedded into a d-dimensional vector space to form a sequence, which is subsequently sent to the Transformer. MobileViT combines the local feature extraction capability of CNN with the global feature extraction capability of Transformer, which enables the model to have a more comprehensive feature representation while maintaining high accuracy.
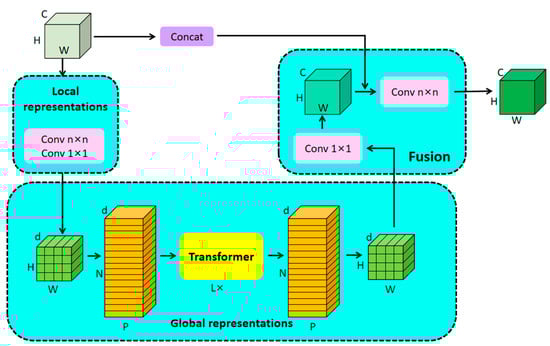
Figure 4.
The MobileViT block.
3.4. Cross-Attention Block (CAB)
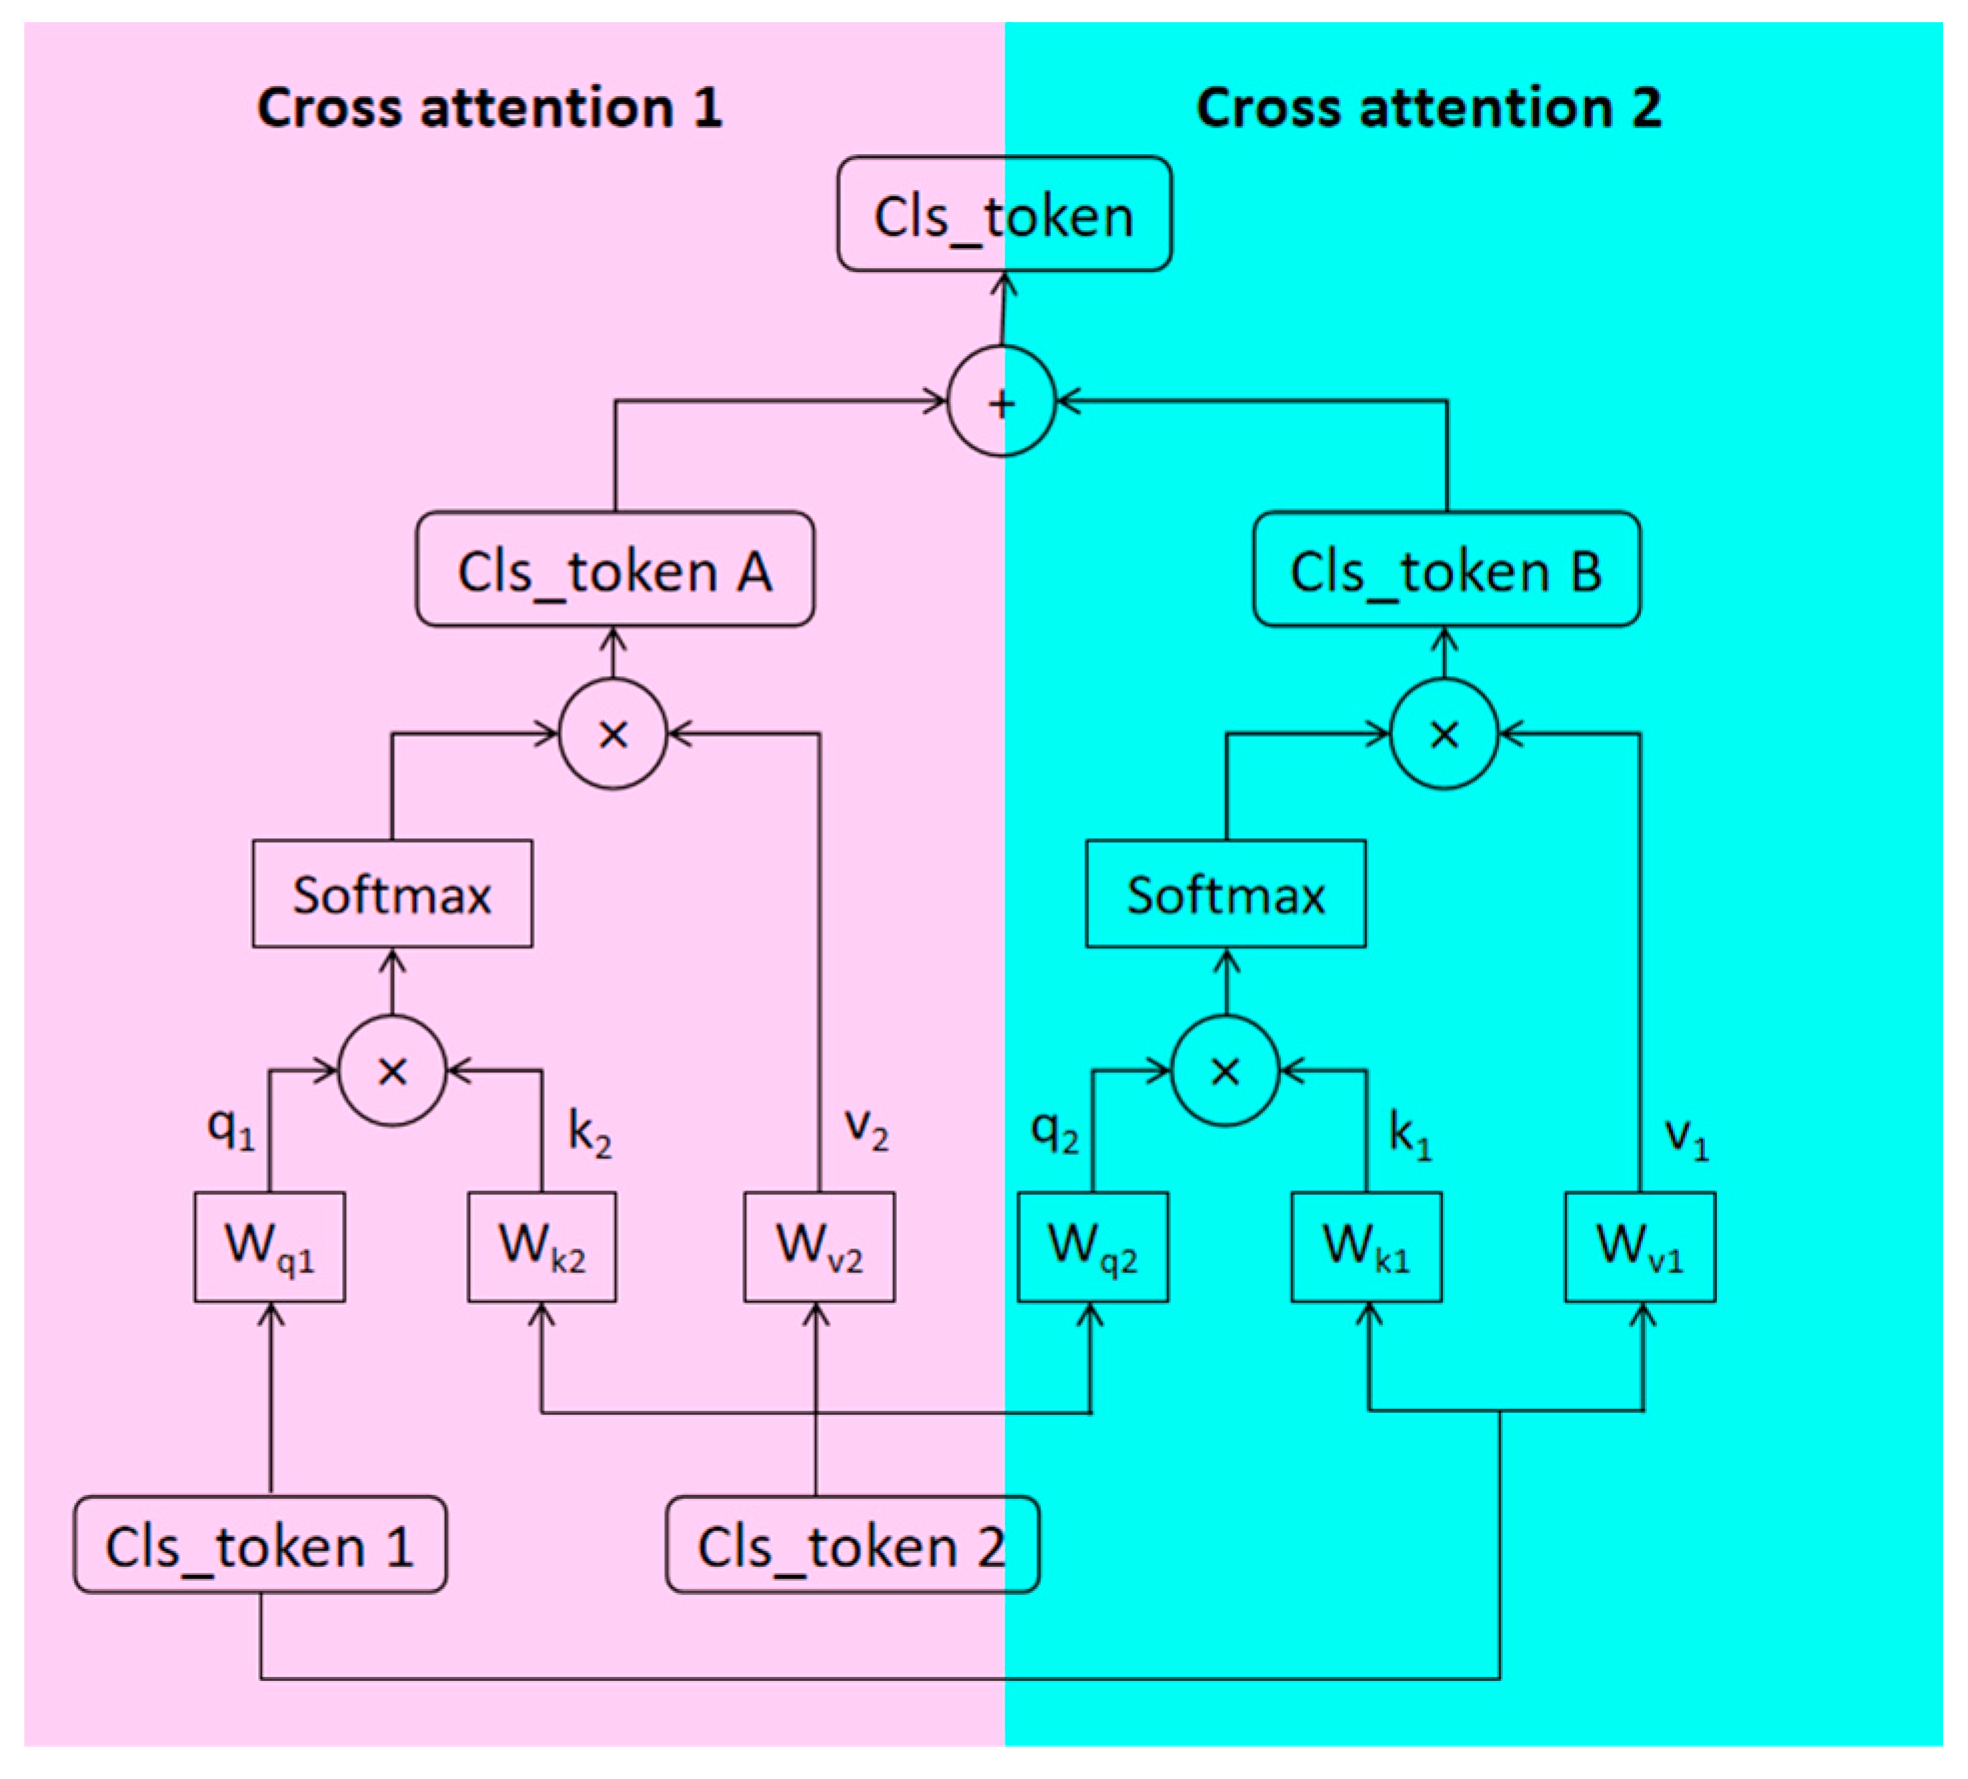
The above double streams in Section 3.2 and Section 3.3 extract the fine feature of micro-expressions from two aspects, namely, temporal–spatial and local–global, respectively. Therefore, it is essential to make diverse information interact effectively for better multi-mode fusion [32]. In traditional attention mechanisms, the focus is primarily on feature interaction within the same modality. To facilitate effective interaction between different information types, we design the cross attention block (CAB), which is an attention mechanism used for interaction and information propagation between different feature representations. Intuitively, CAB introduces interaction between different modalities, allowing for information propagation and fusion. The main framework of CAB is shown in Figure 5.
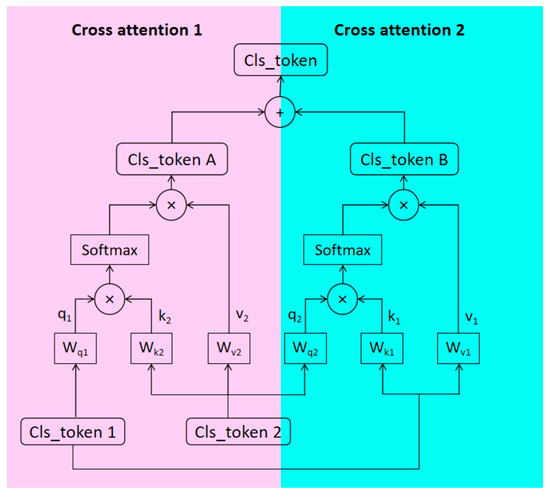
Figure 5.
Cross attention block (CAB).
In Figure 5, we name the output sequence of Branch 1 Cls_ token 1; the output sequence of Branch 2 is Cls_ token 2. Then, the Q vector of Branch 1 and the K and V vector of Branch 2 are used to calculate the first cross-attention. With a similar method, the Q vector of Branch 2 and the K and V vectors of Branch 1 are responsible for the second cross-attention calculation [33]. In the end, the model integrates the contribution of the two attention calculations to leverage the multimode fusion efficacy. The specific formulas are shown in Equations (4) to (8):
where denotes the number of sequences of branches, denotes the output of each branch, and , , denote the weights of , , vectors, respectively. denotes the formula of the attention mechanism, and denotes the sum of the results of two cross attention methods.
In our dual-stream framework, Branch 1 effectively extracts temporal information and spatial relationships in the ME sequence, while Branch 2 extracts local–global features of MEs using Mobile ViT. Through CAB, these two branches can interact and exchange their feature representations, providing a more comprehensive and rich representation of MEs. In CAB, there are typically two inputs: query (Q) vectors and key–value (K-V) pair vectors. The Q vectors are used to specify the target of attention, while the K-V pair vectors contain the content to be attended to. By computing the attention weights between the Q vectors and the K-V pair vectors, the K-V pair features can be weighted and fused, enabling interaction between different branches.
4. Experiments and Evaluations
In this section, we first introduce the datasets and evaluation metrics used in this study. Subsequently, the implementation details are described about our model. Moreover, a series of ablation experiments are conducted to illustrate the rationality and feasibility of the proposed MER framework. Finally, a comparison of the dual-stream scheme with related methods is made to verify the effectiveness of the proposed MER model.
4.1. Datasets and Evaluation Criterion
In the early 2000s, with technological advancements, some researchers started to collect and annotate micro-expression videos systematically, thereby creating the first batches of micro-expression databases. Table 1 summarizes the available public databases, which include the CASME II [34], SAMM [35], and SMIC [36] databases. A detailed introduction to the three databases is listed in Table 1.

Table 1.
Introduction of datasets.
In these publicly available databases, there is an inconsistency in categories across different datasets, and some categories have a small number of samples. To address this issue, the 2019 Facial Micro-Expressions Grand Challenge (MEGC) [37] proposed the reclassification and integration of micro-expression database samples according to the emotional categories they represent. This led to the creation of a new comprehensive micro-expression database, termed the 3DB-combined database (3DB), which mainly consists of a combination of the CASME II and SAMM databases, as well as SMIC-HS. Details can be found in Table 2.
Table 2.
Introduction of three-category datasets.
Concretely, the 3DB contains 145 samples from the CASME II database, 133 samples from the SAMM database, and 164 samples from the SMIC-HS database, totaling 442 data samples. All samples are divided into three categories: positive, negative, and surprise, with 109 samples, 250 samples, and 83 samples, respectively. The specific classification rules are as follows: In the CASME II database, the labels for disgust and repression are combined into the negative category, the label for happiness is designated as the positive category, and the label for surprise remains unchanged. In the SAMM database, the labels for contempt, fear, sadness, disgust, and anger are combined into the negative category, the label for happiness is designated as the positive category, and the label for surprise remains unchanged. The three-category labels remain unchanged in the SMIC-HS. As shown in Table 2, the distribution of ME samples in the 3DB dataset is diverse and more consistent with the real scenario. In this sense, the 3DB dataset is more representative for performance evaluation of MER.
To precisely evaluate the MER performance, we use the accuracy rate, the number of correctly classified samples as a percentage of the total number of samples, as the evaluation index of the experiment. The formula is expressed in Equation (9):
where N denotes the total number of samples, denotes the true category label of the sample, denotes the predicted category label of the sample, denotes the indicator function, and the value of the indicator function is 1 if the condition in parentheses holds and 0 otherwise. The accuracy rate is determined by first determining whether the true category labels and predicted category labels of each sample are consistent, then computing the equal number, adding the equal number, and finally dividing it by the total number of samples.
In addition, since the dataset of ME is unbalanced in terms of sentiment categories, we employed the F1 score evaluation metric to mitigate potential class bias. The initial precision and recall are calculated based on true positives (TP), false negatives (FN), and false positives (FP), as shown in Equations (10) and (11), respectively.
The value of F1 is calculated based on precision and recall, as shown in Equation (12).
The calculation formula of the F1 score is:
4.2. Implementation Details
The testing environment for experiments is Windows 10 (a 64-bit operating system), AMD Ryzen 7-5800H 3060 @ 1.90 GHz CPU, and NVIDIA GeForce RTX 3060 GPU. Pytorch is utilized to construct the model in this study, with the programming language being Python 3.6. The initial learning rate is set to 0.00001, the training epoch is set to 30 with a batch size of 8, and the optimizer is Adam. The computational time of the model is recorded as the average time taken per iteration [38]. The average duration per iteration of this whole model is 2.12 s. In contrast, the average time per iteration of the model without the CAB module is 2.00 s. Therefore, it can be inferred that the computation time is mainly taken on the feature extraction stage from Transformer variants. The influence of the CAB module on the time complexity is limited.
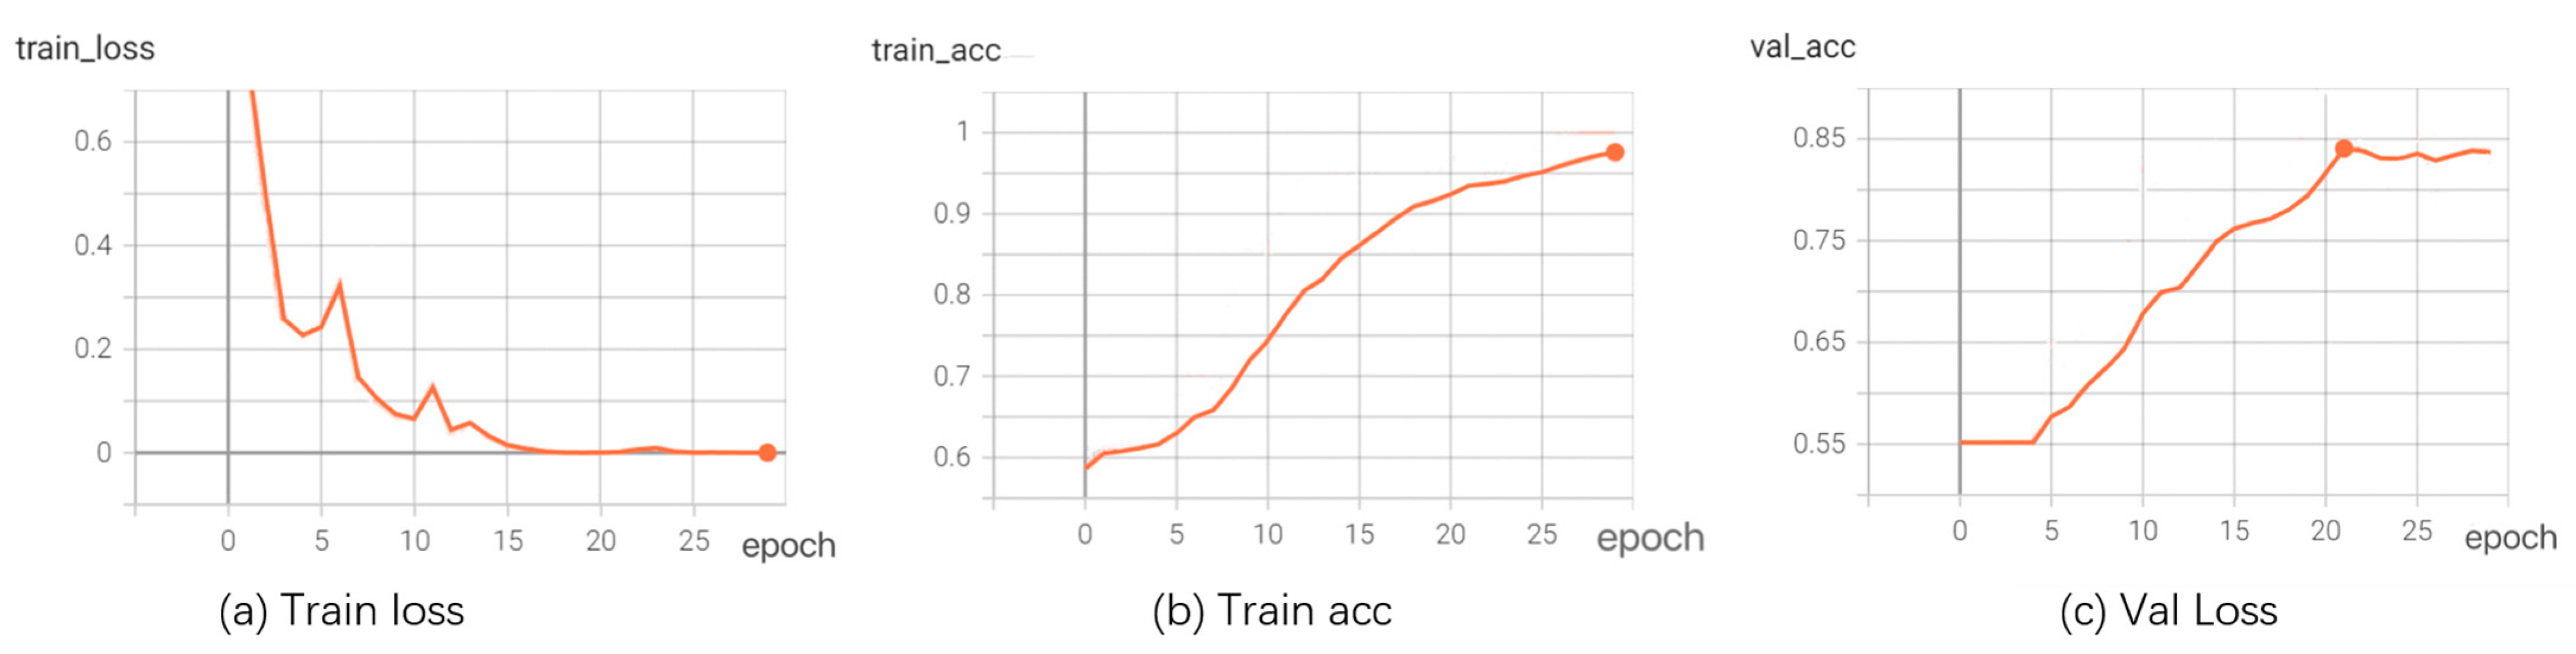
Considering the experimental setup, we divided each dataset into 80% for training and 20% for validation. The loss and accuracy curves of our model are shown in Figure 6. The experimental results on the training set, as shown in Figure 6, indicate that our accuracy was determined by calculating the proportion of correctly predicted samples by the model on the training and validation sets out of the total number of samples. Throughout the training process, the value of the loss function steadily decreased, and the model’s accuracy gradually increased. Meanwhile, the accuracy on the test set shows that our model achieved a high level of accuracy, demonstrating the reasonability and effectiveness of the proposed model.
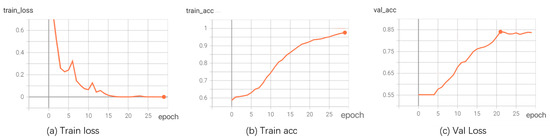
Figure 6.
Loss and accuracy curves.
4.3. Ablation Experiments
To verify the effectiveness of the proposed MER scheme, this section sets up ablation experiments for the three main modules (Swin Transformer, MobileViT, and CAB) in turn. The ablation results are listed in Table 2. In our experimental setup, we denote the branch in the network where the optical flow map is sent to Swin Transformer for processing as Branch 1, the branch where the apex frame image is sent to MobileViT for processing as Branch 2, and CAB represents the cross-attention block introduced in Section 3.4. The ME recognition experiments are implemented on three publicly available datasets, and the corresponding recognition results are reported in Table 3. Based on these results, we will carry out the ablation study following two folds.
Table 3.
The ablation results for the main modules. √ means ‘with’ and × means ‘without’. Bold fonts indicate the best results.
4.3.1. Ablation Experiments on Branches
In this section, we demonstrate the effectiveness of the dual branch network architecture by analyzing the experiments of Setting 1–3. Setting 1 indicates that only Branch 1 is involved in the recognition and classification of MEs; that is, the optical flow map is sent to Swin Transformer to directly obtain the classification results. Setting 2 indicates that only Branch 2 participated in experiments, which directly fed the apex frame into MobileViT to obtain classification results. In the Setting 3 experiment, the information obtained from Branch 1 and Branch 2 was concatenated in the channel dimension, and the integrated information was used to classify MEs.
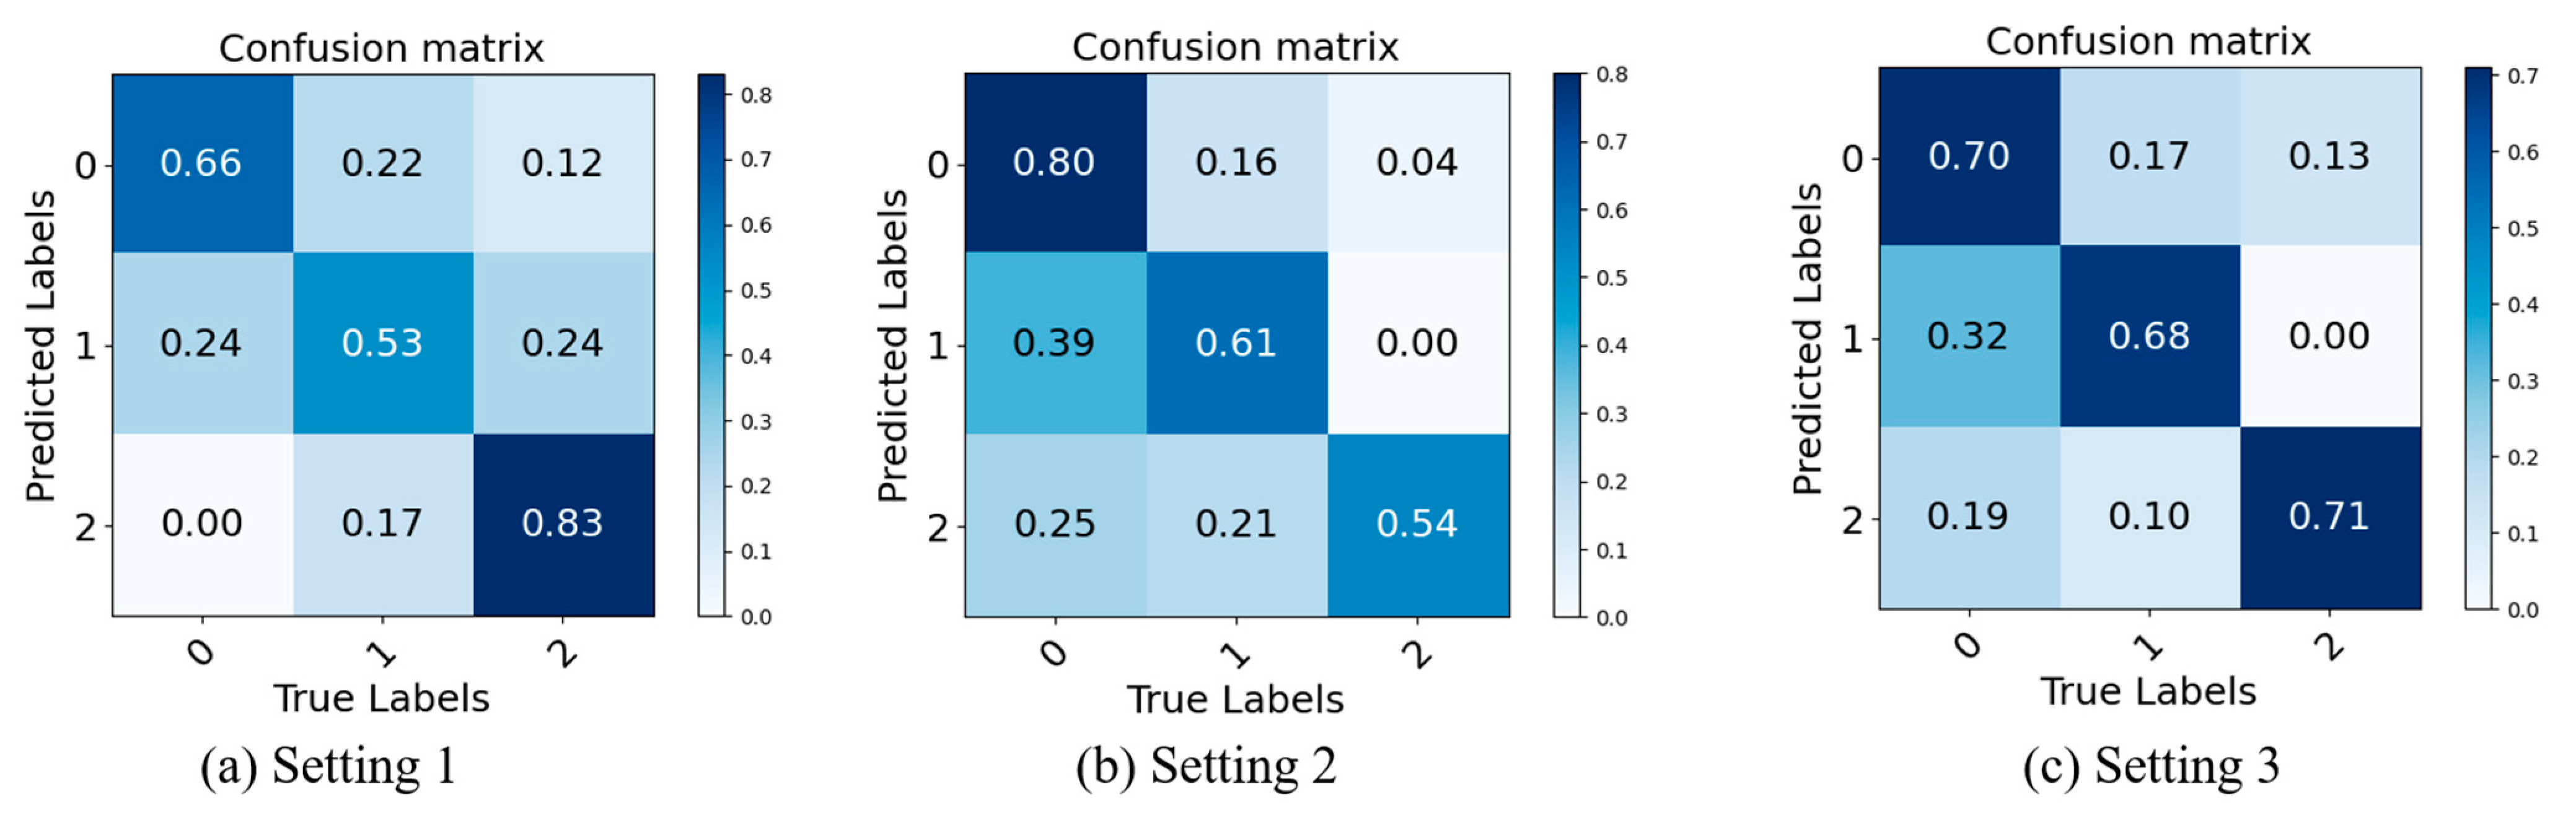
As can be observed from Table 3, the recognition rates of Setting 3 on the three publicly available datasets have a significant improvement over the experimental results of Setting 1 and Setting 2 in the range of 1.7% to 20.7%. The results obtained by fusing the two branches on the channels are better than those obtained by processing the two branches separately, which proves that the time–space features extracted by Branch 1 and the local–global feature information extracted by Branch 2 can extract the features of MEs from different perspectives and complement each other. Thus, it is not difficult to conclude that the lack of either branch will affect the MER and decrease the accuracy. To present the experimental results more intuitively, we have constructed confusion matrices, which are typically used to describe the performance of classification models on a dataset with known true values. The confusion matrix can be further normalized so that the sum of values in each row equals 1, allowing for a more intuitive display of the percentage of classification performance per category. Higher values indicate that the model has a higher classification accuracy for that category, while lower values indicate a poorer performance in that category. As shown in Figure 7, 0, 1, and 2 represent negative, positive, and surprise emotions, respectively. Figure 7a–c represent the confusion matrices for Settings 1, 2, and 3, respectively. It can be observed that although Settings 1 and 2 perform well in certain categories (with Setting 1 achieving an 83% recognition rate for surprise and Setting 2 achieving an 80% recognition rate for negative), they perform poorly in others. In contrast, Setting 3 shows consistently good recognition rates across all categories, thereby demonstrating that the adopted dual-branch approach can effectively fuse the features extracted by each branch, reducing class imbalance.
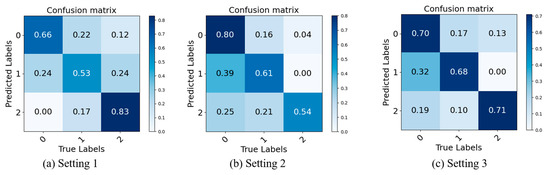
Figure 7.
Confusion matrices of Setting 1, Setting 2, and Setting 3.
4.3.2. Ablation Experiments on CAB
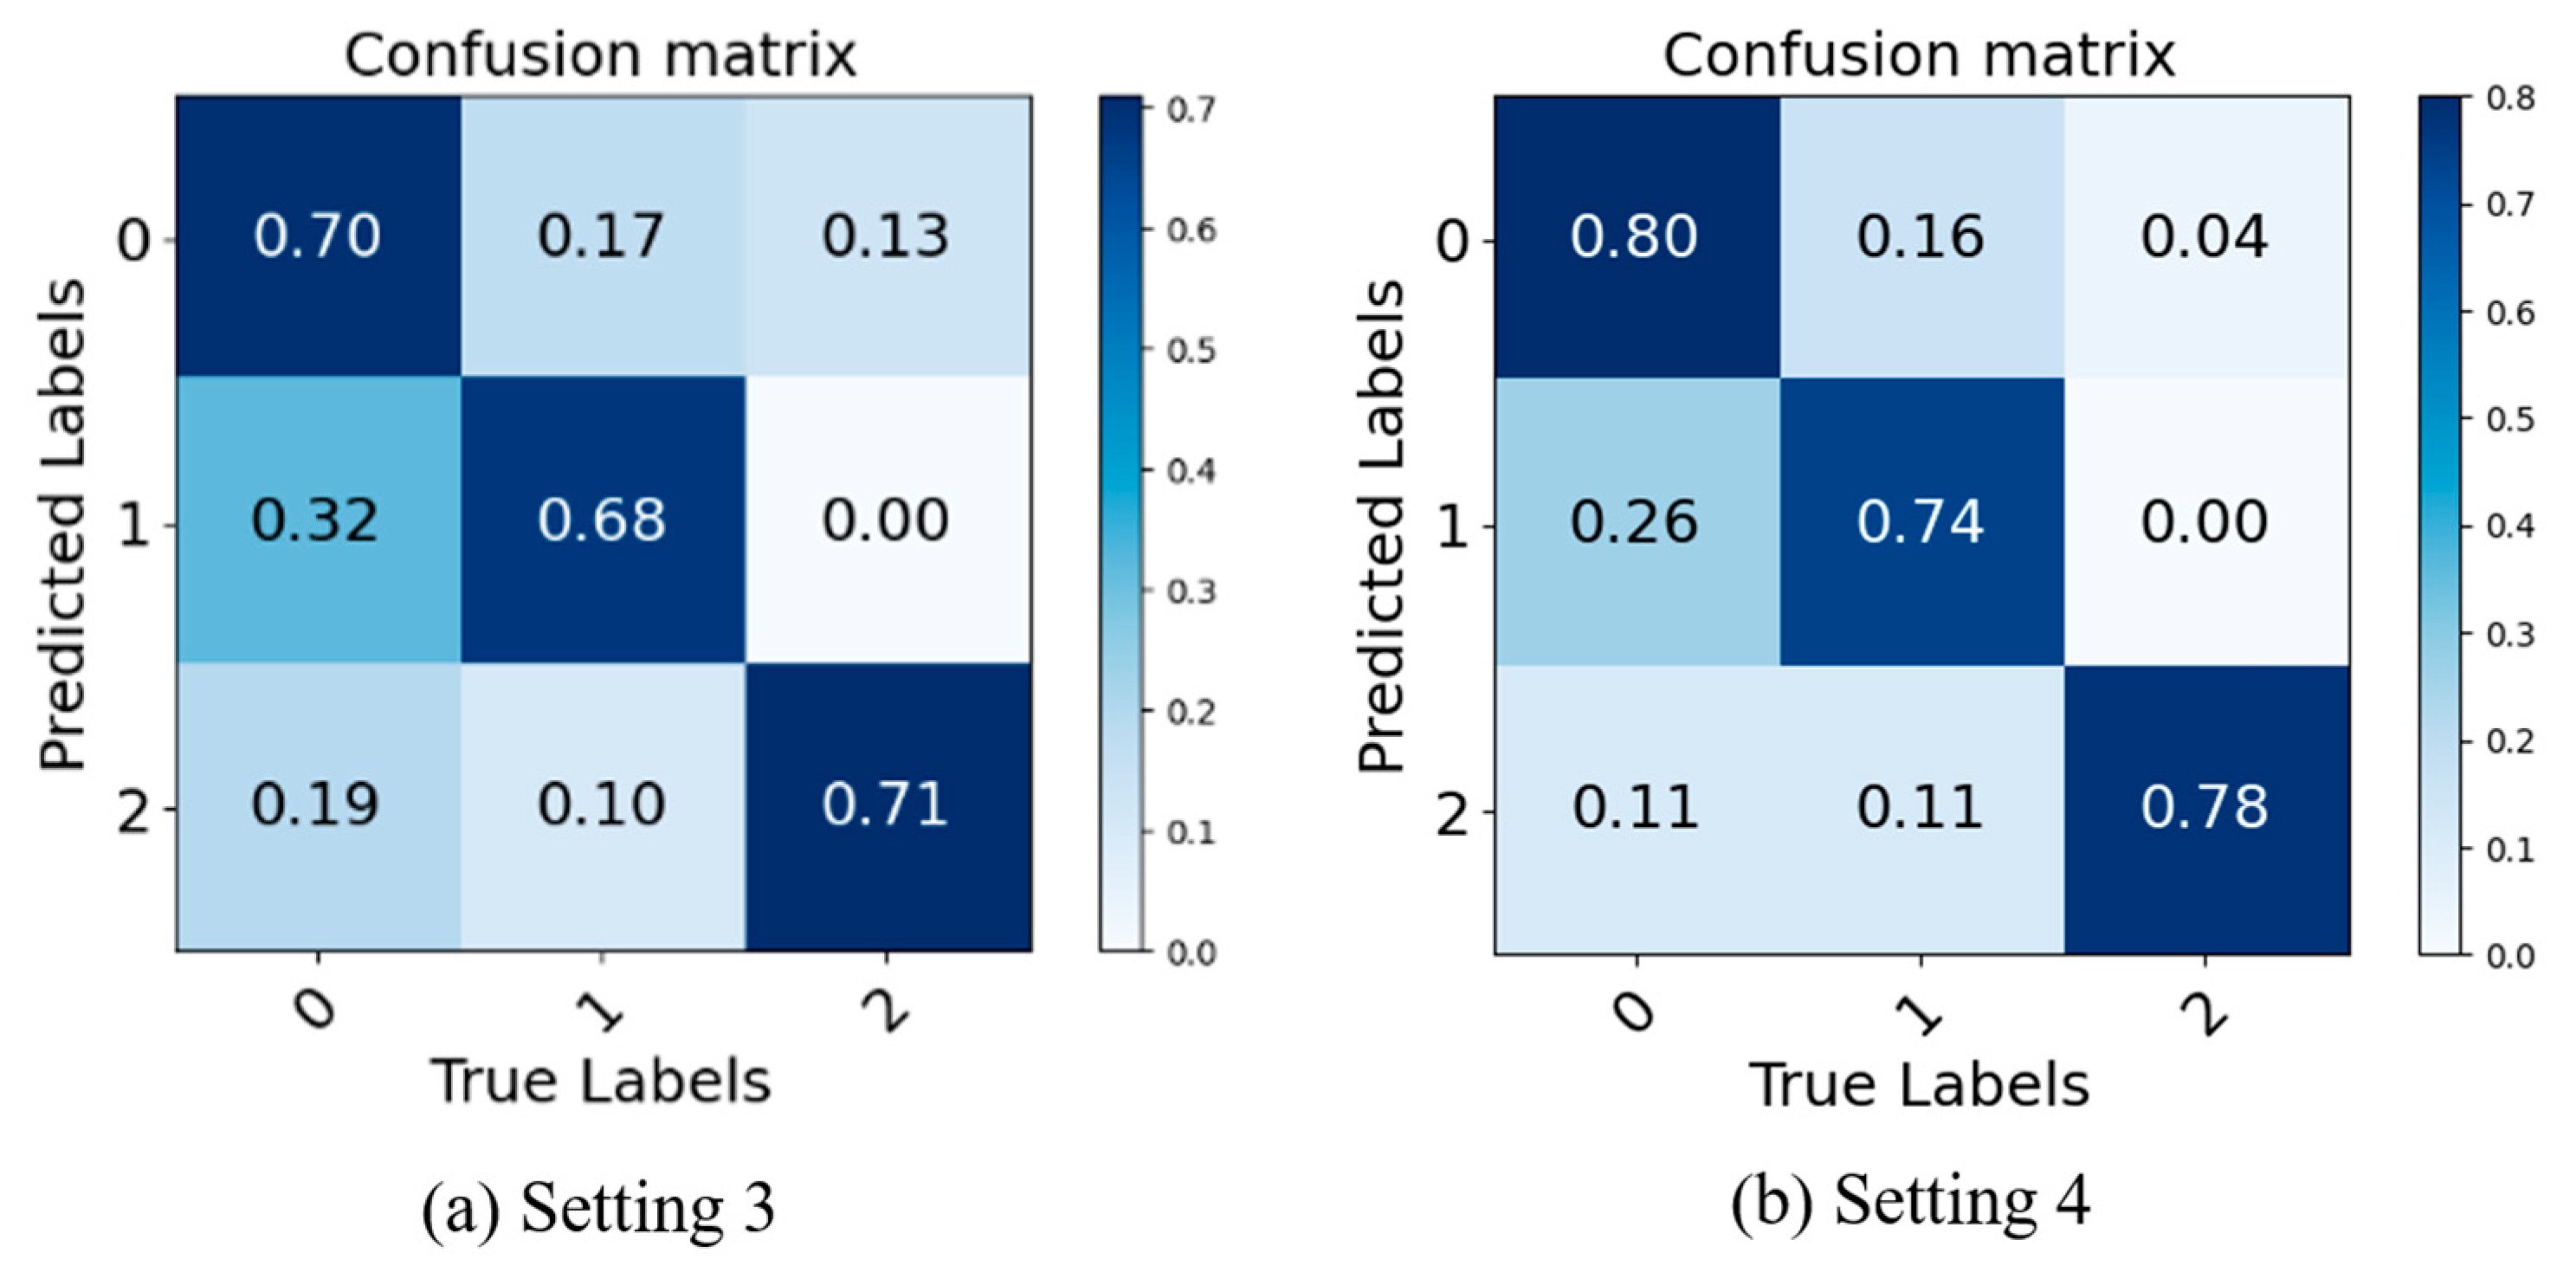
In this part, we focus on Setting 3 versus Setting 4, where Setting 3 is a simple splicing of the two branches on the channel, while Setting 4 is a fusion of the two using CAB. As can be seen from Table 3, the accuracy of Setting 4 is 5.7%, 0.0%, 0.4%, and 12.3% higher than that of Setting 3 on the 3DB and three public datasets, respectively. It can be inferred that CAB effectively fuses the feature information extracted from the two branches and enables the network to emphasize the information that is not observed in both branches, thus improving the recognition performance of the MER model [39]. The main reason is that each token covers all the feature information of this branch, and interactions between the two entail interactions of the temporal–spatial and local–global feature information, which provides richer salient information for classification.
To provide a more intuitive representation of the contribution of CAB, we plotted the confusion matrices for Setting 3 and Setting 4. The results are shown in Figure 8.
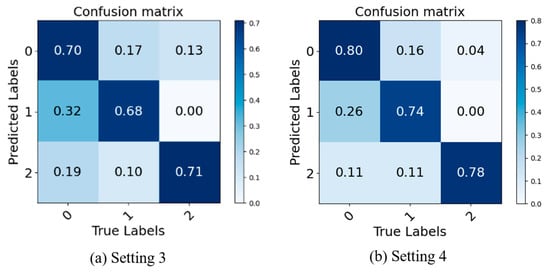
Figure 8.
Confusion matrices of Setting 3 and Setting 4.
In Figure 8, 0, 1, and 2 represent negative, positive, and surprise MEs, respectively. Concretely, the rows and columns of the confusion matrices represent the actual and predicted categories of MEs, respectively. The normalized confusion matrices visually demonstrate the classification performance of the models across different categories. Higher values indicate a higher accuracy in classifying the corresponding category, while lower values indicate a poorer performance. As shown in Figure 8, it can be observed that the accurate recalls for Setting 4 are consistently higher than those for Setting 3. This finding indicates that CAB enables the model to adapt to MER tasks with different modality distributions, thereby improving the model’s generalization ability. As explained in Section 3.4, CAB can adaptively learn the correlations between diverse features, facilitating effective interaction and integration of information from both branches, thus enhancing the overall feature representation capability of the model.
Moreover, based on the cross-attention mechanism, the number of heads in the multi-head mechanism will affect its performance. To further evaluate the effectiveness of cross-attention, we investigate the effect of different numbers of heads in two cross-attentions on the performance. The number of num_heads in cross-attention 1 and cross-attention 2 are assumed to be N1 and N2, respectively, and the values of num_heads are in the range {4, 8, 16}. The results with different multi-head configurations are listed in Table 4. As Table 4 indicates, this paper systematically adjusted the number of heads, training models with four, eight, and sixteen heads, and evaluated them on the 3DB dataset. When the number of heads increased from four to eight, there was a significant improvement in model performance with both N1 and N2 set to eight, resulting in an accuracy of 81.6% and an F1 score of 92.2%, which is a 20.7% increase in accuracy and a 25.5% increase in F1 score compared to when both were set to four. However, it is not the case that more heads contribute to a better performance. When the number of heads increased from eight to sixteen, there was a decrease in the experimental results to variable degrees. With both N1 and N2 set to sixteen, the accuracy and F1 score decreased by 10.3% and 19.8%, respectively, compared to when set to eight, indicating that more heads do not always result in better outcomes. Through these ablation experiments, it was determined that setting the number of heads for both cross-attention mechanisms set to eight is the optimal choice. In other words, the strategy of (8, 8) employed in the paper can aggregate the optimal information of MEs without the overfitting problem.
Table 4.
The results with varying num_heads on the 3DB datasets. Bold fonts indicate the best results.
4.4. The Validity Analysis on Feature Extraction
The crucial idea of this study is to extract the expressive feature of MEs using Transformer variants to achieve better classification. The Swin Transformer and MobileViT selected in our framework are well-known network frameworks that can improve Transformer performance. We will conduct the following comparison experiments to explain and analyze the rationality and effectiveness of their layout in the network framework.
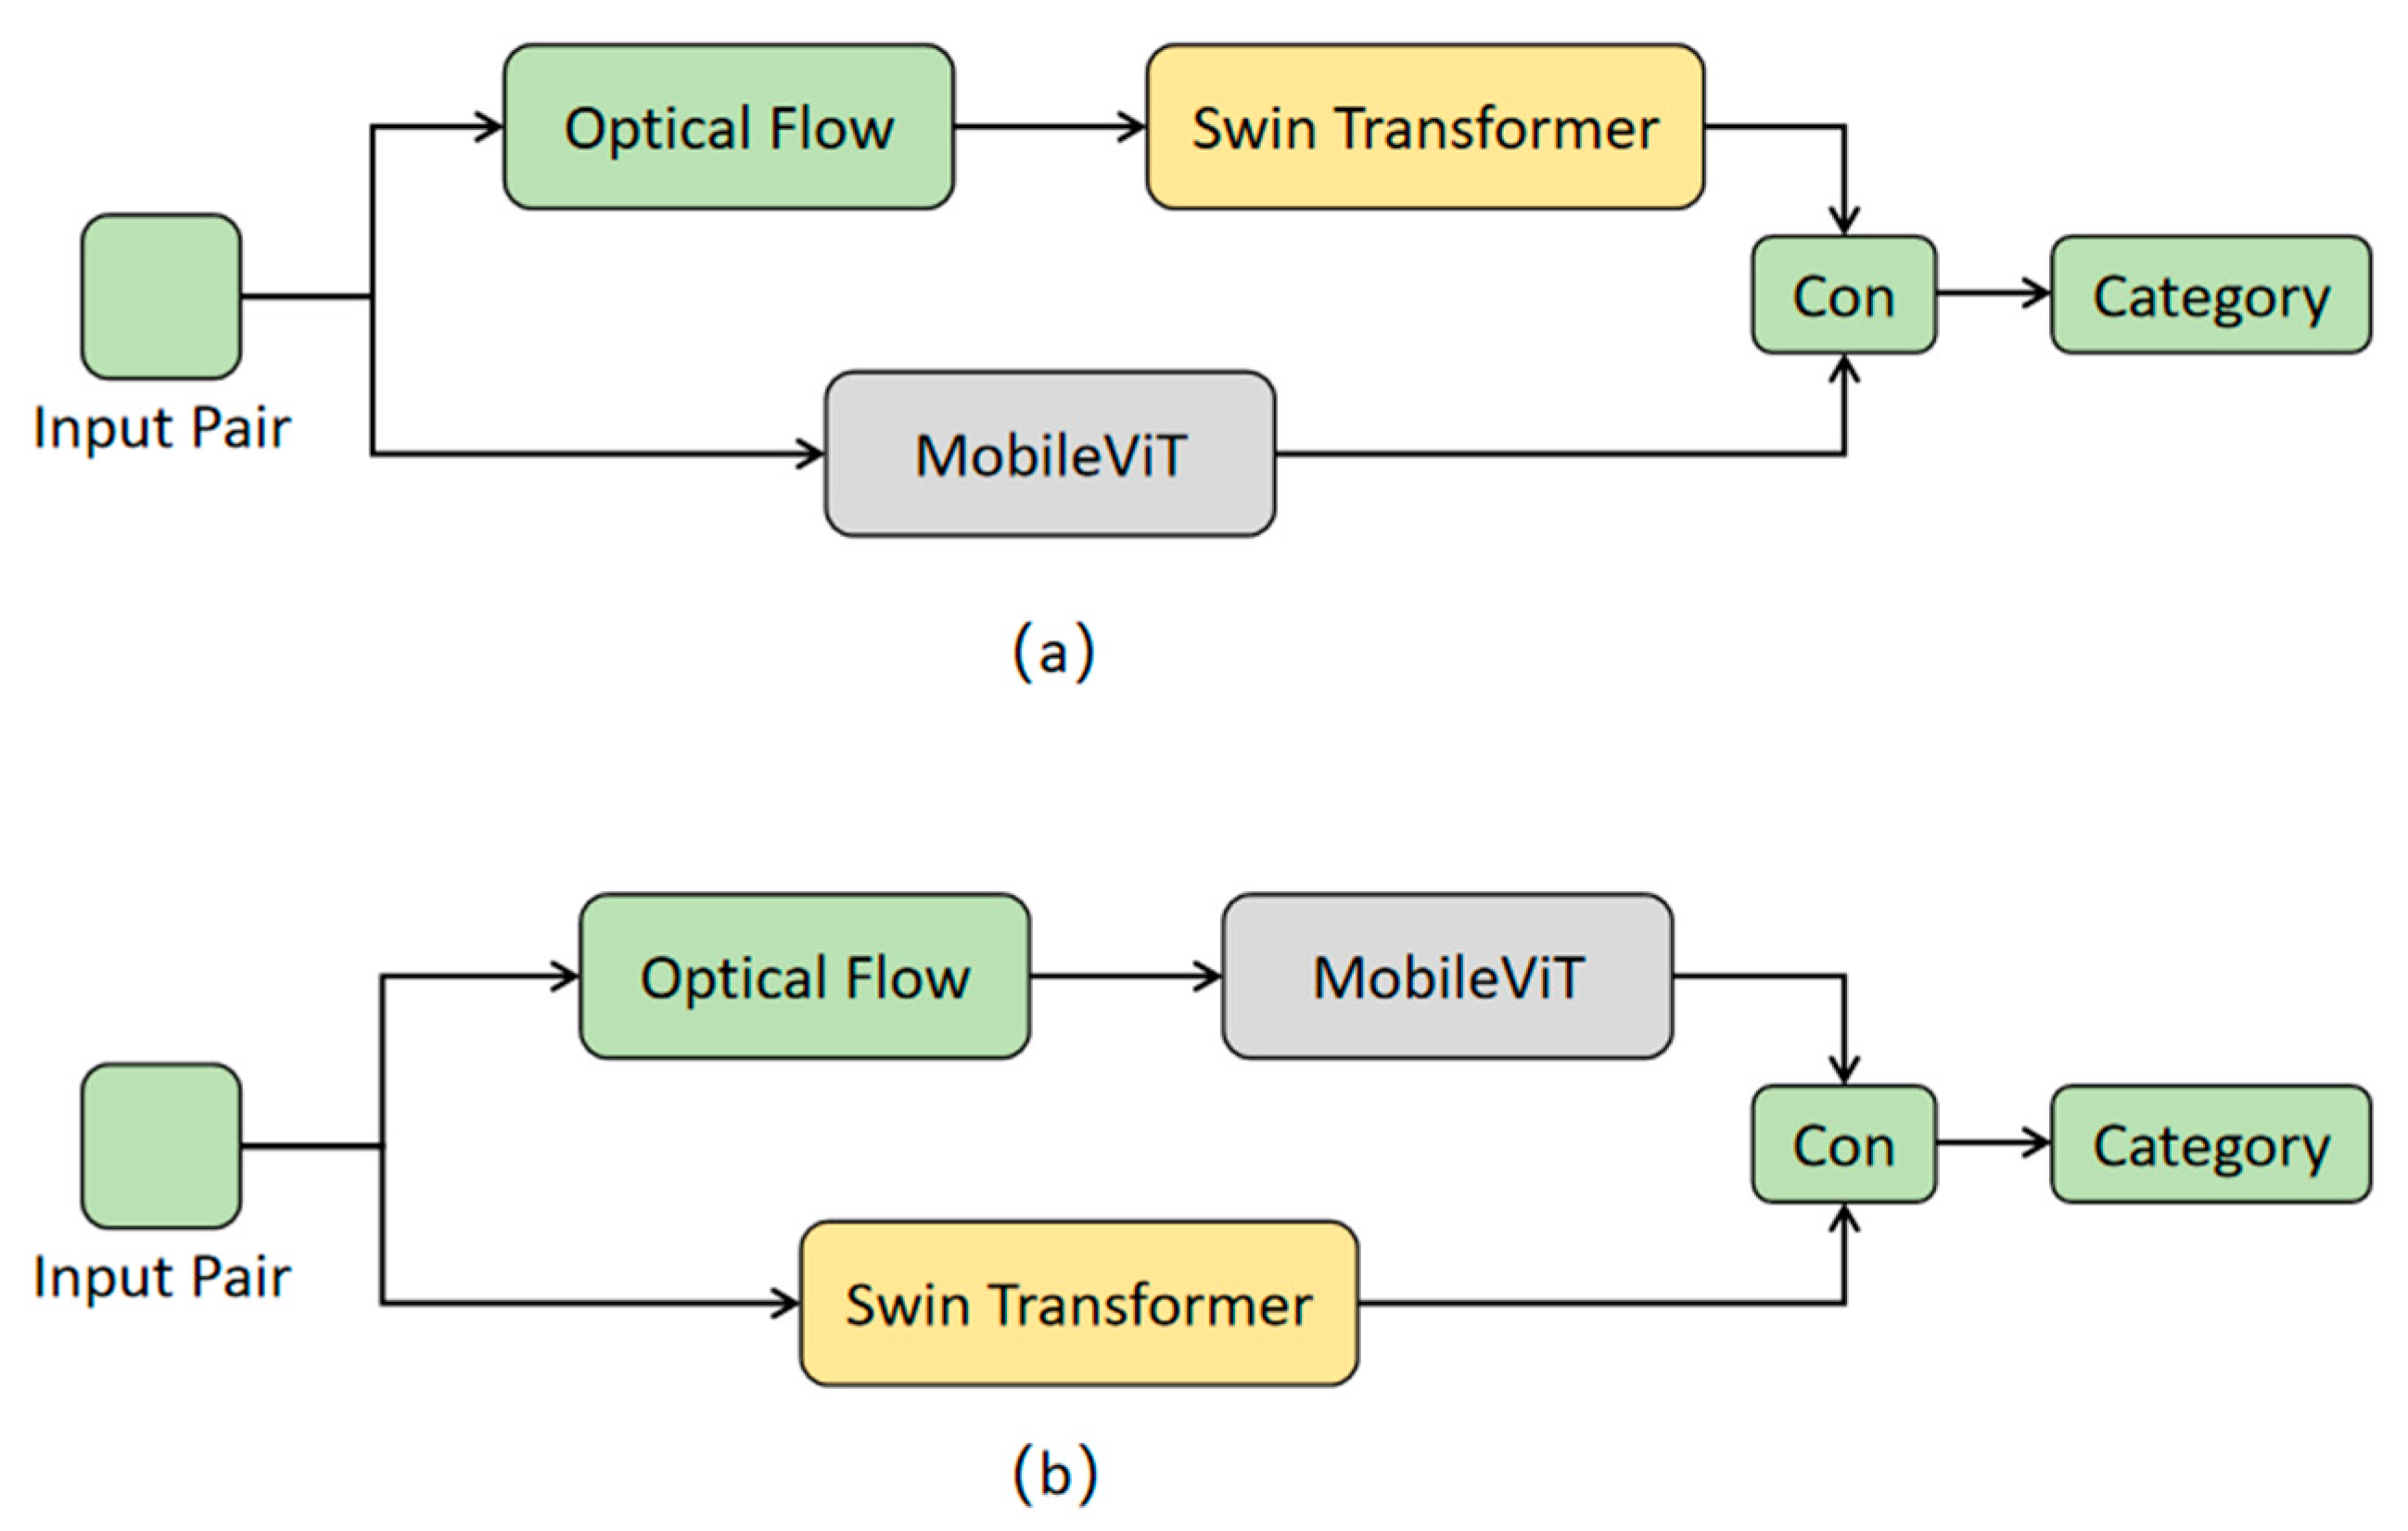
Figure 9 illustrates two sets of experiments: experiment (a) and experiment (b). In the dual-stream framework of experiment (a), the first stream feeds micro-expression optical flow images into the Swin Transformer to extract spatio-temporal features, while the second stream inputs red–green–blue (RGB) images into MobileViT to extract local–global features. After feature fusion, the classification will be performed. In experiment (b), which also adopts a dual-stream framework, the difference lies in the first stream, where RGB images are put into the Swin Transformer for feature extraction, and in the second stream, optical flow images are sent into MobileViT for feature extraction. The features from both streams are then merged for classification. The Swin Transformer is a model based on the Transformer architecture, which excels at processing sequential data and capturing long-range dependencies. Optical flow images represent motion information and imply a temporal sequence relationship. In this sense, the processing of optical flow images with the Swin Transformer can naturally capture the dynamic changes between micro-expression frames. On the contrary, MobileViT combines the local perceptual abilities of convolutional networks with the global perceptual capabilities of Transformers, making it more suitable for representing RGB images and capturing static local and global features.
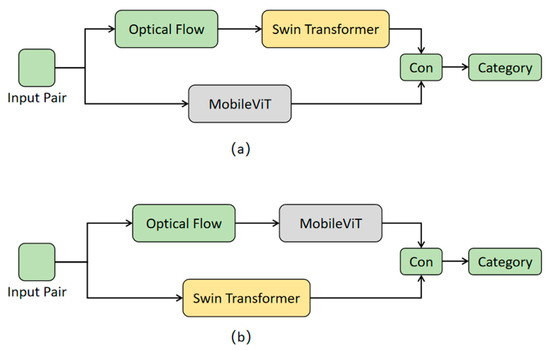
Figure 9.
Experimental setup for validity analysis of feature extraction. (a) is the structure of experiment (a) and (b) is the structure of the experiment (b).
In experiment (a), the Swin Transformer and MobileViT process different data individually, extracting the corresponding features. The Swin Transformer focuses on dynamic spatial–temporal features, while MobileViT focuses on static local–global features. This combination contributes to more complementary information in the learned features, thereby leading to a more comprehensive fusion for classification. In contrast, in experiment (b), the two models might produce similar features in some aspects, which will result in a feature representation after fusion that does not significantly strengthen the classification capability. The comparison results of different feature extraction experiments are presented in Table 5.
Table 5.
The Acc and F1 for validity analysis of feature extraction. Bold fonts indicate the best results.
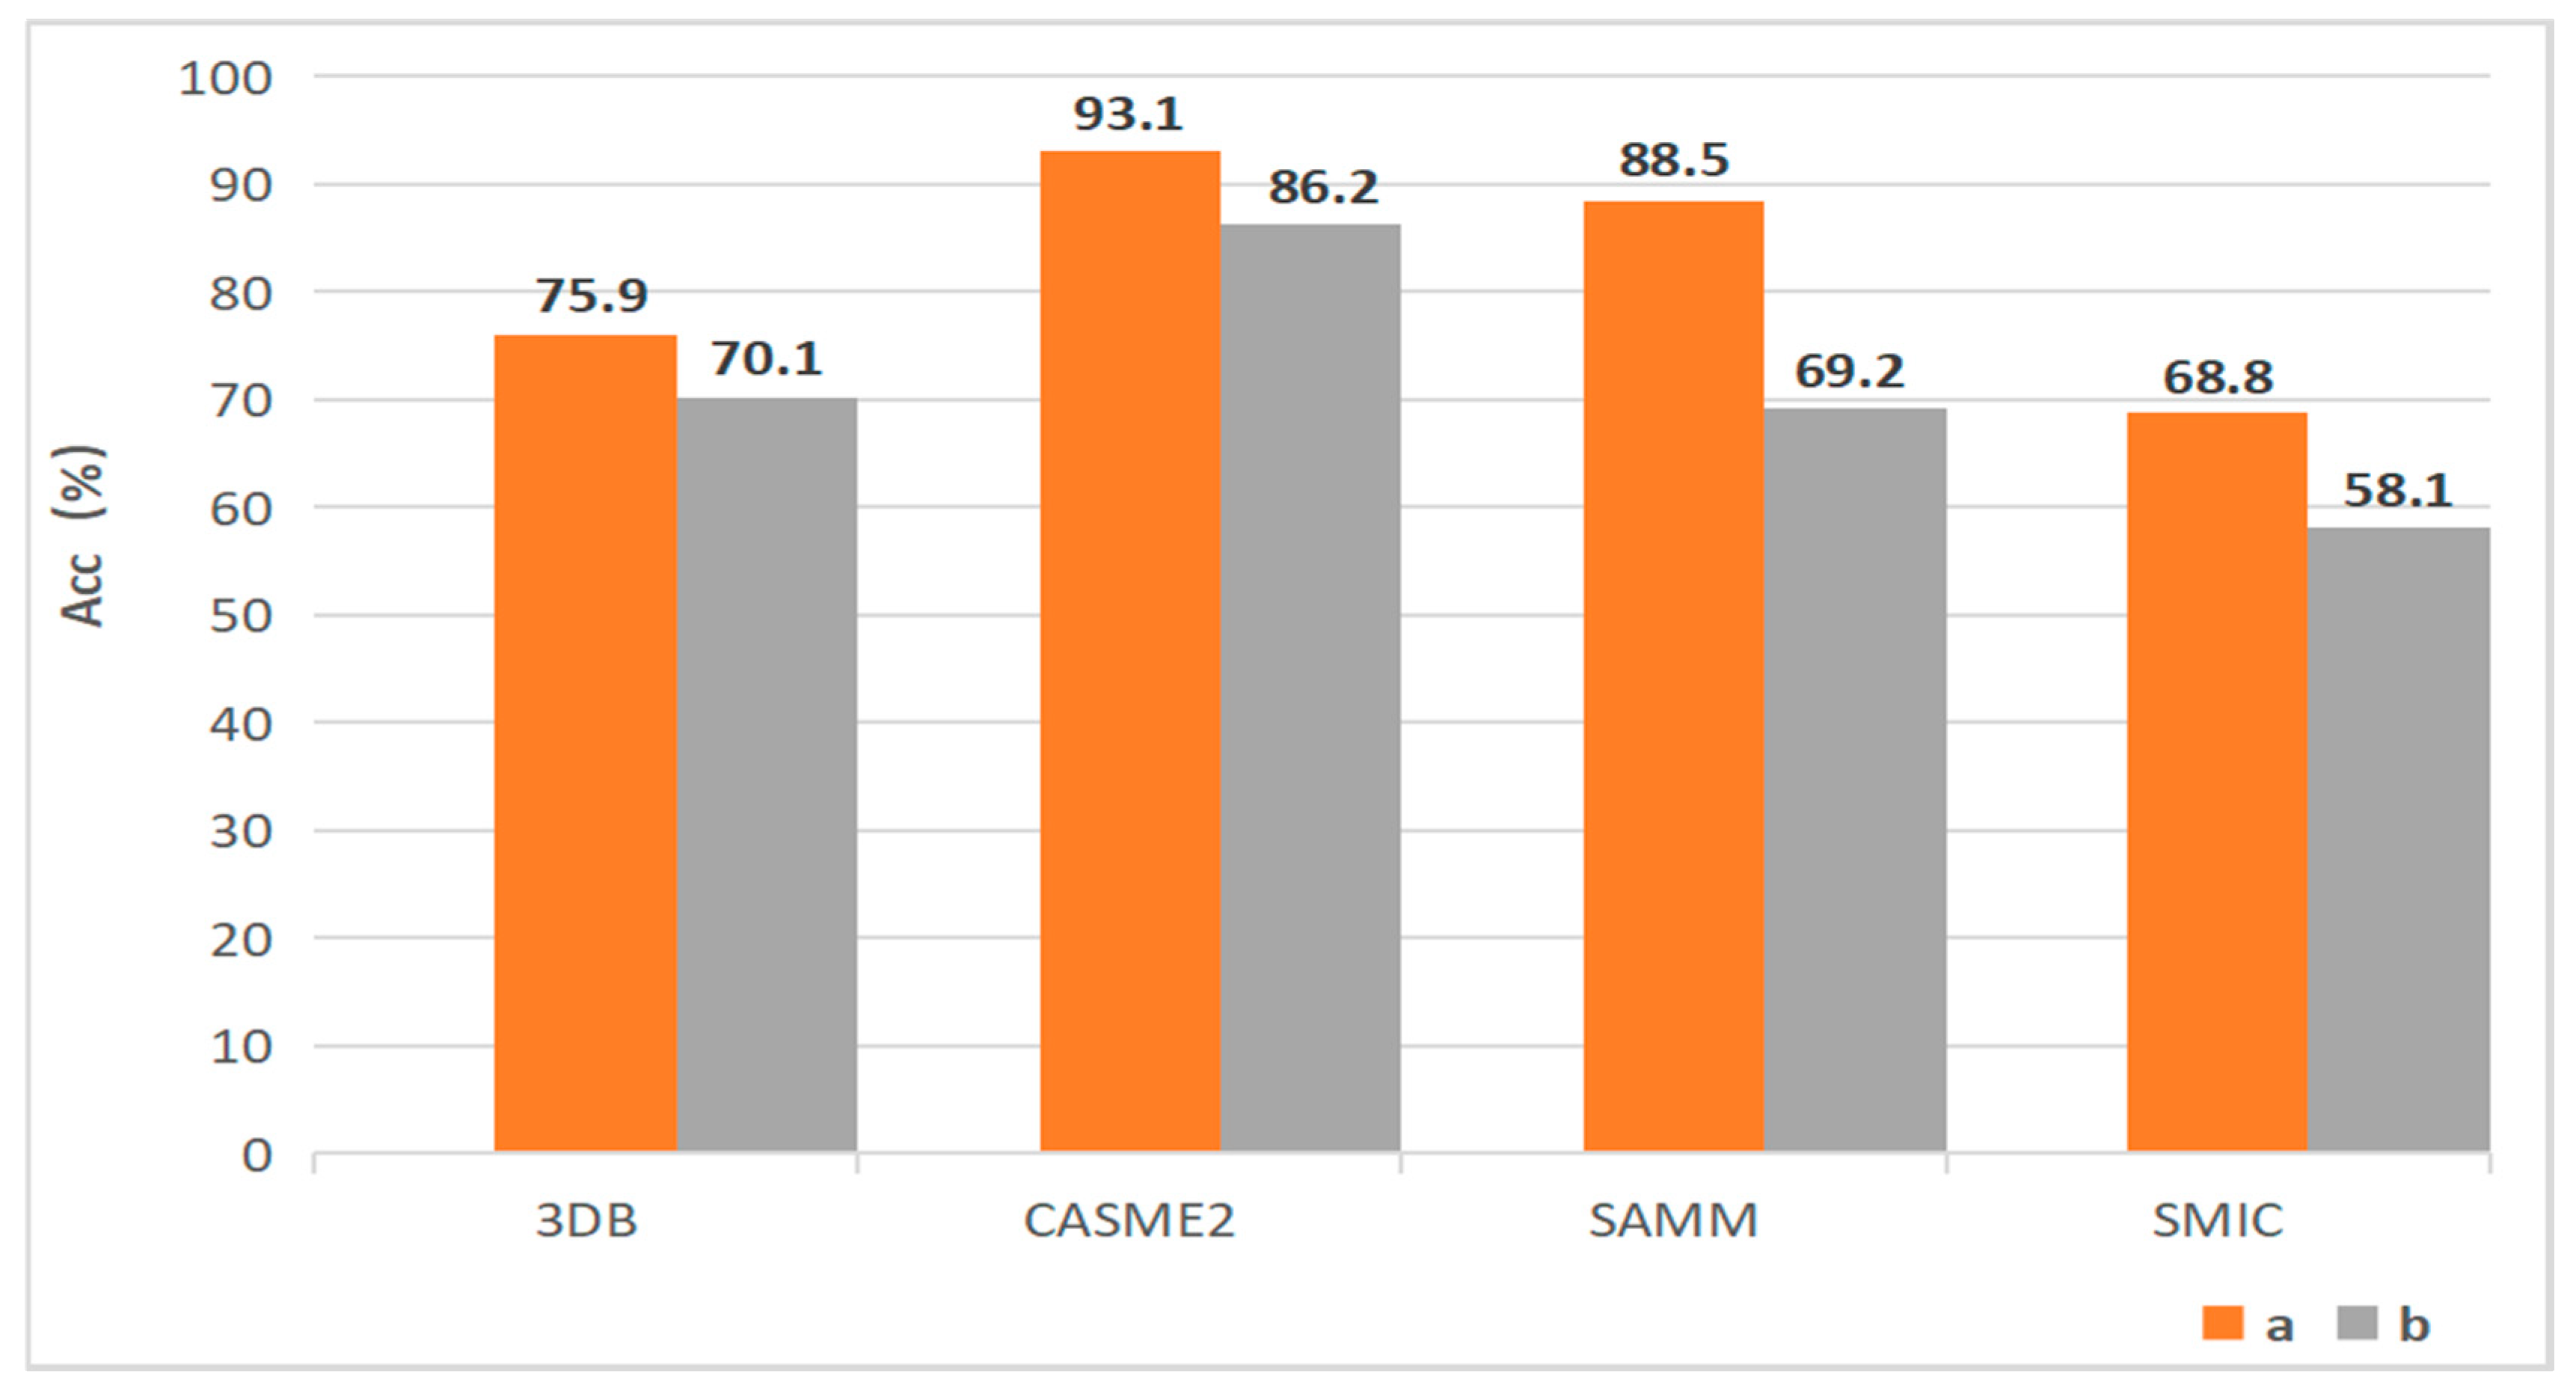
As can be seen from Table 5, the F1 score of experiment (a) is 4.9%, 5.4%, 13.3%, and 0.8% higher than that of experiment (b) on the fused datasets as well as on the three open datasets, respectively. Therefore, it can be confirmed that Swin Transformer is more suitable for optical flow mapping than Mobile ViT. To better prove the superiority of our structure, we plot the accuracy rates of different experiments in Figure 10. It is clear the accuracy rates of experiment (a) outperform those of experiment (b) on three single datasets as well as the fused dataset. In other words, the network layout proposed in this paper has a stronger extraction capability for MER.
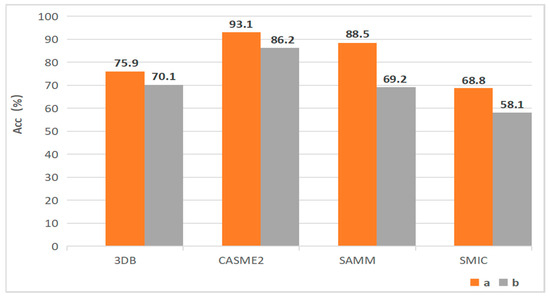
Figure 10.
The experimental results for validity analysis of feature extraction.
To better explain this finding, we utilized the Grad-CAM tool [40] to visualize the extraction of ME features with optical flow, Swin Transformer, and MobileViT. The visualization results are shown in Figure 11.
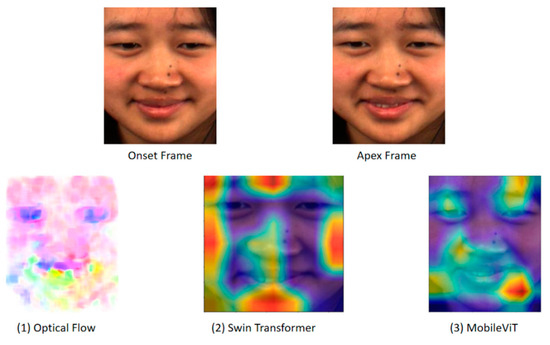
Figure 11.
Visualization maps of the different approaches. Colors from blue to red represent the increased attention on certain facial regions.
From the visualization results in Figure 11, both optical flow and MobileViT focus more on the regions around the eyes and the corners of the mouth, while Swin Transformer focuses on the spatial information between the eyebrows, the cheeks, and the chin areas. If the optical flow map is fed into MobileViT (experiment (b)), the optical flow method and MobileViT focus on similar regions, which will cause the network to duplicate the extraction and generate unnecessary redundant information [41]. In contrast, in experiment (a), the optical flow map is sent to Swin Transformer, enabling this branch to focus on complementary ME regions and extract detailed features more comprehensively. This branch is then combined with the local–global information extracted by MobileViT, which enriches the expressive information from different aspects and improves the discriminative ability in ME learning representation.
4.5. The Comparison Experiments with Other Approaches
In this section, the effectiveness of the proposed method is confirmed by comparing it with other advanced MER methods: Bi-WOOF [8], DSSN [42], Micro-attention [38], Dynamic [43], GEME [44], LFM [45], Sparse Trans [22], LFV, Trans [25], MFS Trans [46], KTGSL [47], AMAN [48], MSMMT [49], and FDCN [50]. The comparison results are depicted in Table 6. From Table 6, it is evident that compared to the handcrafted feature method Bi-WOOF [8], our method achieves an accuracy improvement of 34.2%, 29.1%, and 21.8% on the three datasets, respectively. More importantly, our proposed method outperforms other deep learning methods in terms of the accuracy and F1 score, as indicated in bold in Table 6. Considering the approaches based on CNN, like DSSN [42], Micro-attention [38], and Dynamic [43], our model has a big improvement in MER performance, which verifies the effectiveness of Transformer features for MEs. Particularly, compared with other dual-branch networks such as Sparse Trans [22], LFV Trans [25], MSMMT [49], and FDCN [50] based on a single Transformer, our model also achieves a salient improvement in recognition performance. The main reason is that the proposed model captures multiple-dimensional features and makes an efficient fusion of Transformer variants, which significantly leverages the extraction of informative features from the double modalities, thereby boosting the accuracy of MER.
Table 6.
Comparison results with other approaches. Bold fonts indicate the best results.
In addition, we also compare the computation time of the proposed model with some Transformer-based MER methods, in terms of the average duration per iteration. The average duration per iteration of our model is 2.12 s. Correspondingly, the average durations per iteration of Sparse Trans [22], LFV Trans [25], and MFS Trans [46] are 1.96 s, 2.07 s, and 2.54 s, respectively. Therefore, our model achieves a competitive performance in computation complexity.
5. Conclusions
In this paper, we implement two variants of Transformer (Swin Transformer and MobileViT) for a diverse ME feature representation scheme. The scheme constructs a dual-branch Transformer model to make them parallel for multimode feature extraction. Moreover, the CAB is designed to fully fuse and enrich the feature information of MEs in two aspects: temporal–spatial and local–global perspectives. This work validates the hypothesis that integration of diverse Transformer variants in an appropriate manner presents a promising potential capability to boost the MER performance. The accuracy of our model can reach 81.6% on the 3DB database. The extensive experimental results show that the proposed method can achieve a better accuracy of MER than state-of-the-art methods. In this study, we only use the RGB and optical flow to analyze the MEs. Efficient multimodality fusion with depth information in ME is a promising direction for future research.
Author Contributions
Conceptualization and methodology, Z.X.; software, C.Z.; validation, Z.X.; formal analysis, C.Z.; investigation and resources, Z.X.; data curation, C.Z.; writing—original draft preparation, Z.X. and C.Z.; writing—review and editing, Z.X.; visualization, C.Z.; supervision, Z.X.; project administration, Z.X. and C.Z.; funding acquisition, Z.X. All authors have read and agreed to the published version of the manuscript.
Funding
This work was funded by the National Nature Science Foundation of China (No. 62362037, No. 12264018), the Natural Science Foundation of Jiangxi Province of China (No. 20224ACB202011), and the Jiangxi Province Graduate Innovation Special Fund Project (No. YC2022-s790).
Institutional Review Board Statement
Our studies were conducted under IRB of Jiangxi Science and Technology Normal University approval, and the following is the information. Approval Code: IRB-JXSTNU-2023007, Approval Date: 2 April 2023.
Informed Consent Statement
Informed consent was obtained from all subjects involved in the study.
Data Availability Statement
The datasets generated and/or analyzed during the current study are available from the corresponding author on reasonable request. All other public datasets used are available and cited in the references.
Acknowledgments
We would like to thank the editor and the reviewers for their valuable comments.
Conflicts of Interest
The authors declare no conflict of interest.
References
- Yu, W.W.; Jiang, J.; Yang, K.F.; Yan, H.-M.; Li, Y.J. LGSNet: A Two-Stream Network for Micro-and Macro-Expression Spotting with Background Modeling. IEEE Trans. Affect. Comput. 2023, 1–18. [Google Scholar] [CrossRef]
- Nguyen, X.B.; Duong, C.N.; Li, X.; Gauch, S.; Seo, H.-S.; Luu, K. Micron-BERT: BERT-based Facial Micro-Expression Recognition. In Proceedings of the IEEE/CVF Conference on Computer Vision and Pattern Recognition, Vancouver, BC, Canada, 17–24 June 2023; pp. 1482–1492. [Google Scholar]
- Tang, H.; Zhu, L.; Fan, S.; Liu, H. Micro-expression recognition based on optical flow method and pseudo-3D residual network. J. Signal Process. 2022, 38, 1075–1087. [Google Scholar]
- Zhao, G.; Pietikainen, M. Dynamic Texture Recognition Using Local Binary Patterns with an Application to Facial Expressions. IEEE Trans. Pattern Anal. Mach. Intell. 2007, 29, 915–928. [Google Scholar] [CrossRef] [PubMed]
- Li, X.; Hong, X.; Moilanen, A.; Huang, X.; Pfister, T.; Zhao, G.; Pietikainen, M. Towards Reading Hidden Emotions: A Comparative Study of Spontaneous Micro-Expression Spotting and Recognition Methods. IEEE Trans. Affect. Comput. 2018, 9, 563–577. [Google Scholar] [CrossRef]
- Polikovaky, S.; Kameda, Y.; Ohta, Y. Facial micro-expressions recognition using high speed camera and 3D-gradient descriptor. In Proceedings of the International Conference on Imaging for Crime Detection and Prevention, London, UK, 3 December 2009; pp. 1–6. [Google Scholar]
- Liu, Y.-J.; Zhang, J.-K.; Yan, W.-J.; Wang, S.-J.; Zhao, G.; Fu, X. A main directional mean optical flow feature for spontaneous micro-expression recognition. IEEE Trans. Affect. Comput. 2016, 7, 299–310. [Google Scholar] [CrossRef]
- Liong, S.; Wong, K.; See, J.; Phan, R.C.W. Less is more: Micro-expression recognition from video using apex frame. Signal Process. Image Commun. 2018, 62, 82–92. [Google Scholar]
- Simonyan, K.; Zisserman, A. Very deep convolutional networks for large-scale image recognition. arXiv 2014, arXiv:1409.1556. [Google Scholar]
- Krizhevsky, A.; Sutskever, I.; Hinton, G. Imagenet classification with deep convolutional neural networks. Commun. ACM 2017, 60, 84–90. [Google Scholar] [CrossRef]
- Szegedy, C.; Liu, W.; Jia, Y. Going deeper with convolutions. In Proceedings of the IEEE Conference on Computer Vision and Pattern Recognition, Boston, MA, USA, 7–12 June 2015; pp. 1–9. [Google Scholar]
- He, K.; Zhang, X.; Ren, S.; Sun, J. Deep residual learning for image recognition. In Proceedings of the IEEE Conference on Computer Vision and Pattern Recognition, Las Vegas, NV, USA, 27–30 June 2016; pp. 770–778. [Google Scholar]
- Gan, Y.; Lien, S.; Chiang, Y.; Liong, S.-T. LAENet for micro-expression recognition. Vis. Comput. 2023, 1–15. [Google Scholar] [CrossRef]
- Vaswani, A.; Shazeer, N.; Parmar, N.; Uszkoreit, J.; Jones, L.; Gomez, A.N.; Kaiser, L.; Polosukhin, I. Attention is all you need. Adv. Neural Inf. Process. Syst. 2017, 30, 6000–6010. [Google Scholar]
- Dosovitskiy, A.; Beyer, L.; Kolesnikov, A.; Weissenborn, D.; Zhai, X.; Unterthiner, T.; Dehghani, M.; Minderer, M.; Heigold, G.; Gelly, S.; et al. An image is worth 16x16 words: Transformers for image recognition at scale. arXiv 2020, arXiv:2010.11929. [Google Scholar]
- Liu, Z.; Lin, Y.; Cao, Y.; Hu, H.; Wei, Y.; Zhang, Z.; Lin, S.; Guo, B. Swin transformer: Hierarchical vision transformer using shifted windows. IEEE/CVF international conference on computer vision. Online 2021, 1, 9992–10002. [Google Scholar]
- Mehta, S.; Rastegari, M. MobileViT: Light-weight, General-purpose, and Mobile-friendly Vision Transformer. arXiv 2021, arXiv:2110.02178. [Google Scholar]
- Duque, C.; Alata, O.; Emonet, R.; Konik, H.; Legrand, A.-C. Mean Oriented Riesz Features for Micro Expression Classification. Pattern Recognit. Lett. 2020, 135, 382–389. [Google Scholar] [CrossRef]
- Liu, Y.; Li, B.; Lai, Y. Sparse MDMO: Learning a Discriminative Feature for Micro-Expression Recognition. IEEE Trans. Affect. Comput. 2021, 12, 254–261. [Google Scholar] [CrossRef]
- Fan, X.; Chen, X.; Jiang, M.; Shahid, A.R.; Yan, H. SelfME: Self-Supervised Motion Learning for Micro-Expression Recognition. In Proceedings of the IEEE/CVF Conference on Computer Vision and Pattern Recognition, Vancouver, BC, Canada, 17–24 June 2023; pp. 13834–13843. [Google Scholar]
- Zhang, L.; Hong, X.; Arandjelović, O.; Zhao, G. Short and long range relation based spatio-temporal transformer for micro-expression recognition. IEEE Trans. Affect. Comput. 2022, 13, 1973–1985. [Google Scholar] [CrossRef]
- Zhu, J.; Zong, Y.; Chang, H.; Xiao, Y.; Zhao, L. A Sparse-Based Transformer Network With Associated Spatiotemporal Feature for Micro-Expression Recognition. IEEE Signal Process. Lett. 2022, 29, 2073–2077. [Google Scholar] [CrossRef]
- Zhou, H.; Huang, S.; Xu, Y. Inceptr: Micro-expression recognition integrating inception-CBAM and vision transformer. Multimed. Syst. 2023, 29, 3863–3876. [Google Scholar] [CrossRef]
- Li, Y.; Wang, M.; Gong, M.; Lu, Y.; Liu, L. FER-former: Multi-modal Transformer for Facial Expression Recognition. arXiv 2023, arXiv:2303.12997. [Google Scholar]
- Hong, J.; Lee, C.; Jung, H. Late fusion-based video transformer for facial micro-expression recognition. Appl. Sci. 2022, 12, 1169. [Google Scholar] [CrossRef]
- Feng, H.; Huang, W.; Zhang, D.; Zhang, B. Fine-tuning Swin Transformer and Multiple Weights Optimality-seeking for Facial Expression Recognition. IEEE Access 2023, 11, 9995–10003. [Google Scholar] [CrossRef]
- Fan, Q.; Panda, R. Crossvit: Cross-attention multi-scale vision transformer for image classification. In Proceedings of the IEEE/CVF International Conference on Computer Vision, Montreal, BC, Canada, 11–17 October 2021; pp. 357–366. [Google Scholar]
- Zhou, H.; Huang, S.; Li, J.; Wang, S.-J. Dual-ATME: Dual-Branch Attention Network for Micro-Expression Recognition. Entropy 2023, 25, 460. [Google Scholar] [CrossRef] [PubMed]
- Zhai, Z.; Zhao, J.; Long, C.; Xu, W.; He, S.; Zhao, H. Feature Representation Learning with Adaptive Displacement Generation and Transformer Fusion for Micro-Expression Recognition. In Proceedings of the IEEE/CVF Conference on Computer Vision and Pattern Recognition, Vancouver, BC, Canada, 17–24 June 2023; pp. 22086–22095. [Google Scholar]
- Ran, R.; Shi, K.; Jiang, X.; Wang, N. Micro-expression recognition method based on dual attention CrossViT. J. Nanjing Univ. Inf. Sci. Technol. Nat. Sci. Ed. 2023, 15, 541–542. [Google Scholar]
- Cao, K.; Tao, H.; Wang, Z.; Jin, X. MSM-ViT: A multi-scale MobileViT for pulmonary nodule classification using CT images. J. X-ray Sci. Technol. 2023, 31, 731–744. [Google Scholar] [CrossRef] [PubMed]
- Jha, A.; Bose, S.; Banerjee, B. GAF-Net: Improving the Performance of Remote Sensing Image Fusion Using Novel Global Self and Cross Attention Learning. In Proceedings of the IEEE/CVF Winter Conference on Applications of Computer Vision, Vancouver, BC, Canada, 3–7 January 2023; pp. 6354–6363. [Google Scholar]
- Chen, X.; Kang, B.; Wang, D.; Li, D.; Lu, H. Efficient visual tracking via hierarchical cross-attention transformer. In Proceedings of the European Conference on Computer Vision, Tel Aviv, Israel, 23–27 October 2022; pp. 461–477. [Google Scholar]
- Yan, W.J.; Li, X.; Wang, S.J.; Zhao, G.; Liu, Y.J.; Chen, Y.H.; Fu, X. CASME II: An improved spontaneous micro-expression database and the baseline evaluation. PLoS ONE 2014, 9, e86041. [Google Scholar] [CrossRef] [PubMed]
- Davison Adrian, K.; Lansley, C.; Costen, N.; Tan, K. SAMM: A Spontaneous Micro-Facial Movement Dataset. IEEE Trans. Affect. Comput. 2018, 9, 116–129. [Google Scholar] [CrossRef]
- Li, X.; Pfister, T.; Huang, X.; Zhao, G.; Pietikäinen, M. A spontaneous micro-expression database: Inducement, collection and baseline. In Proceedings of the 2013 10th IEEE International Conference and Workshops on Automatic face and Gesture Recognition (FG), Shanghai, China, 22–26 April 2013; pp. 1–6. [Google Scholar]
- See, J.; Yap, M.H.; Li, J.; Hong, X.; Wang, S.-J. MEGC 2019—The Second Facial Micro-Expressions Grand Challenge. In Proceedings of the 2019 International Conference on Automatic Face & Gesture Recognition, Lanzhou, China, 14–18 May 2019; pp. 1–5. [Google Scholar]
- Wang, C.; Peng, M.; Bi, T.; Chen, T. Micro-attention for micro-expression recognition. Neurocomputing 2020, 410, 354–362. [Google Scholar] [CrossRef]
- Ngo, K.A.; Shim, K.; Shim, B. Spatial Cross-Attention for Transformer-Based Image Captioning. In Proceedings of the 2023 IEEE International Conference on Acoustics, Speech, and Signal Processing (ICASSP), Rhodes Island, Greece, 4–10 June 2023; pp. 1–5. [Google Scholar]
- Selvaraju, R.R.; Cogswell, M.; Das, A.; Vedantam, R.; Parikh, D.; Batra, D. Grad-cam: Visual explanations from deep networks via gradient-based localization. In Proceedings of the IEEE International Conference on Computer Vision, Venice, Italy, 22–29 October 2017; pp. 618–626. [Google Scholar]
- Wen, Z.; Lin, W.; Wang, T.; Xu, G. Distract your attention: Multi-head cross attention network for facial expression recognition. Biomimetics 2023, 8, 199. [Google Scholar] [CrossRef]
- Khor, H.Q.; See, J.; Liong, S.T.; Phan, R.C.W.; Lin, W. Dual-stream shallow networks for facial micro-expression recognition. In Proceedings of the 2019 IEEE International Conference on Image Processing (ICIP), Taiwan, China, 22–25 September 2019; pp. 36–40. [Google Scholar]
- Bo, S.; Siming, C.; Dongliang, L.; Jun, H.; Lejun, Y. Dynamic Micro-Expression Recognition Using Knowledge Distillation. IEEE Trans. Affect. Comput. 2020, 99, 1037–1043. [Google Scholar]
- Nie, X.; Takalkar, M.A.; Duan, M.; Zhang, H.; Xu, M. GEME: Dual-stream multi-task GEnder-based micro-expression recognition. Neurocomputing 2021, 427, 13–28. [Google Scholar] [CrossRef]
- Choi, D.Y.; Song, B.C. Facial micro-expression recognition using two-dimensional landmark feature maps. IEEE Access 2020, 8, 121549–121563. [Google Scholar] [CrossRef]
- Zhao, X.; Lv, Y.; Huang, Z. Multimodal Fusion-based Swin Transformer for Facial Recognition Micro-Expression Recognition. In Proceedings of the 2022 IEEE International Conference on Mechatronics and Automation (ICMA), Ningbo, China, 7–9 August 2022; pp. 780–785. [Google Scholar]
- Wei, J.; Lu, G.; Yan, J.; Zong, Y. Learning two groups of discriminative features for micro-expression recognition. Neurocomputing 2022, 479, 22–36. [Google Scholar] [CrossRef]
- Wei, M.; Zheng, W.; Zong, Y.; Jiang, X.; Lu, C.; Liu, J. A novel micro-expression recognition approach using attention-based magnification-adaptive networks. In Proceedings of the 2022 IEEE International Conference on Acoustics, Speech and Signal Processing (ICASSP), Singapore, 7–13 May 2022; pp. 2420–2424. [Google Scholar]
- Wang, F.; Li, J.; Qi, C.; Wang, L.; Wang, P. Multi-scale multi-modal micro-expression recognition algorithm based on transformer. arXiv 2023, arXiv:2301.02969. [Google Scholar]
- Tang, J.; Li, L.; Tang, M.; Xie, J. A novel micro-expression recognition algorithm using dual-stream combining optical flow and dynamic image convolutional neural networks. Signal Image Video Process. 2023, 17, 769–776. [Google Scholar] [CrossRef]


Disclaimer/Publisher’s Note: The statements, opinions and data contained in all publications are solely those of the individual author(s) and contributor(s) and not of MDPI and/or the editor(s). MDPI and/or the editor(s) disclaim responsibility for any injury to people or property resulting from any ideas, methods, instructions or products referred to in the content. |
© 2024 by the authors. Licensee MDPI, Basel, Switzerland. This article is an open access article distributed under the terms and conditions of the Creative Commons Attribution (CC BY) license (https://creativecommons.org/licenses/by/4.0/).