Abstract
With the support of deep neural networks, the existing image manipulation detection (IMD) methods can detect manipulated regions within a suspicious image effectively. In general, manipulation operations (e.g., splicing, copy-move, and removal) tend to leave manipulation artifacts in the high-frequency domain of the image, which provides rich clues for locating manipulated regions. Inspired by this phenomenon, in this paper, we propose a High-Frequency Component Enhancement Network, short for HFCE-Net, for image manipulation detection, which aims to fully explore the manipulation artifacts left in the high-frequency domain to improve the localization performance in IMD tasks. Specifically, the HFCE-Net consists of two parallel branches, i.e., the main stream and high-frequency auxiliary branch (HFAB). The HFAB is introduced to fully explore high-frequency artifacts within manipulated images. To achieve this goal, the input image of the HFAB is filtered out of the low-frequency component by the Sobel filter. Furthermore, the HFEB is supervised with the edge information of the manipulated regions. The main stream branch takes the RGB image as input, and aggregates the features learned from the HFAB by the proposed multi-layer fusion (MLF) in a hierarchical manner. We conduct extensive experiments on widely used benchmarks, and the results demonstrate that our HFCE-Net exhibits a strong ability to capture high-frequency information within the manipulated image. Moreover, the proposed HFCE-Net achieves comparable performance (57.3%, 90.9%, and 73.8% F1 on CASIA, NIST, and Coverage datasets) and achieves 1.9%, 9.0%, and 1.5% improvement over the existing method.
1. Introduction
With the continuous development of image modification software, people can easily use this software to modify the content of the image to achieve different purposes. This software can produce very realistic images in a simple and efficient manner and play an important role in the field of design, games, and other fields. Compared to the original image, some manipulated images can even be considered as beautiful works of art. However, malicious users can also use this software to maliciously manipulate image content. Some manipulated images are so deceptive that people cannot easily distinguish the authenticity of images, which makes it challenging to detect manipulated regions. Therefore, it is critical to design an effective IMD method to protect the credibility of images.
As one of the most promising approaches to the detection of manipulated regions, deep learning-based IMD methods have been actively studied [1,2,3,4,5,6,7,8,9]. These methods typically use deep networks to map manipulated images into the embedding space in order to detect manipulated features through different network structures. Different from early handcraft-based methods [10,11,12], deep learning-based methods have achieved remarkable performance and generalization for IMD tasks with different specialized architectures. Among these methods, RGB-N [1] and SPAN [7] propose to employ the SRM filter to provide additional cues for the IMD task. PSCCNet [13] leverages features at different scales to learn powerful representations. However, RGB-N and SPAN only consider single scale features. PSCCNet ignores high-frequency information, which leads to unsatisfactory results.
In this work, we aim to alleviate the above limitation by exploring the high-frequency and utilizing the different scale features effectively. As shown in Figure 1, the high-frequency information is highlighted by filtering out the low-frequency component of the image by the Sobel filter. Inspired by this observation, in this paper, we propose a novel network, called the High-Frequency Component Enhancement network (HFCE-Net), which consists of two parallel branches, i.e., main stream and high-frequency auxiliary branch (HFAB). Specifically, to fully explore the high-frequency component information of the manipulated image, we first transform the image into the high-frequency domain by filtering the low-frequency component through the Sobel filter, then the image in the high-frequency domain is sent to the HFAB branch and supervised by the edge information of the manipulated regions. To this end, the HFAB is able to learn rich high-frequency information. Moreover, to effectively aggregate the high-frequency information into the main stream branches, the Multi-Layer Fusion (MLF) module is proposed to fuse the features learned from the HFAB and the main stream branch in a hierarchical manner, aiming to aggregate information from different scales to obtain power features. With experiments on CASIA, NIST, and Coverage datasets, each of our HFCE-Net achieves comparable performance to existing methods. The contributions of this work can be outlined as follows:
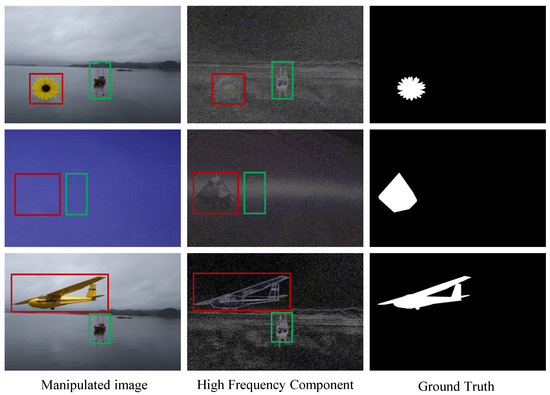
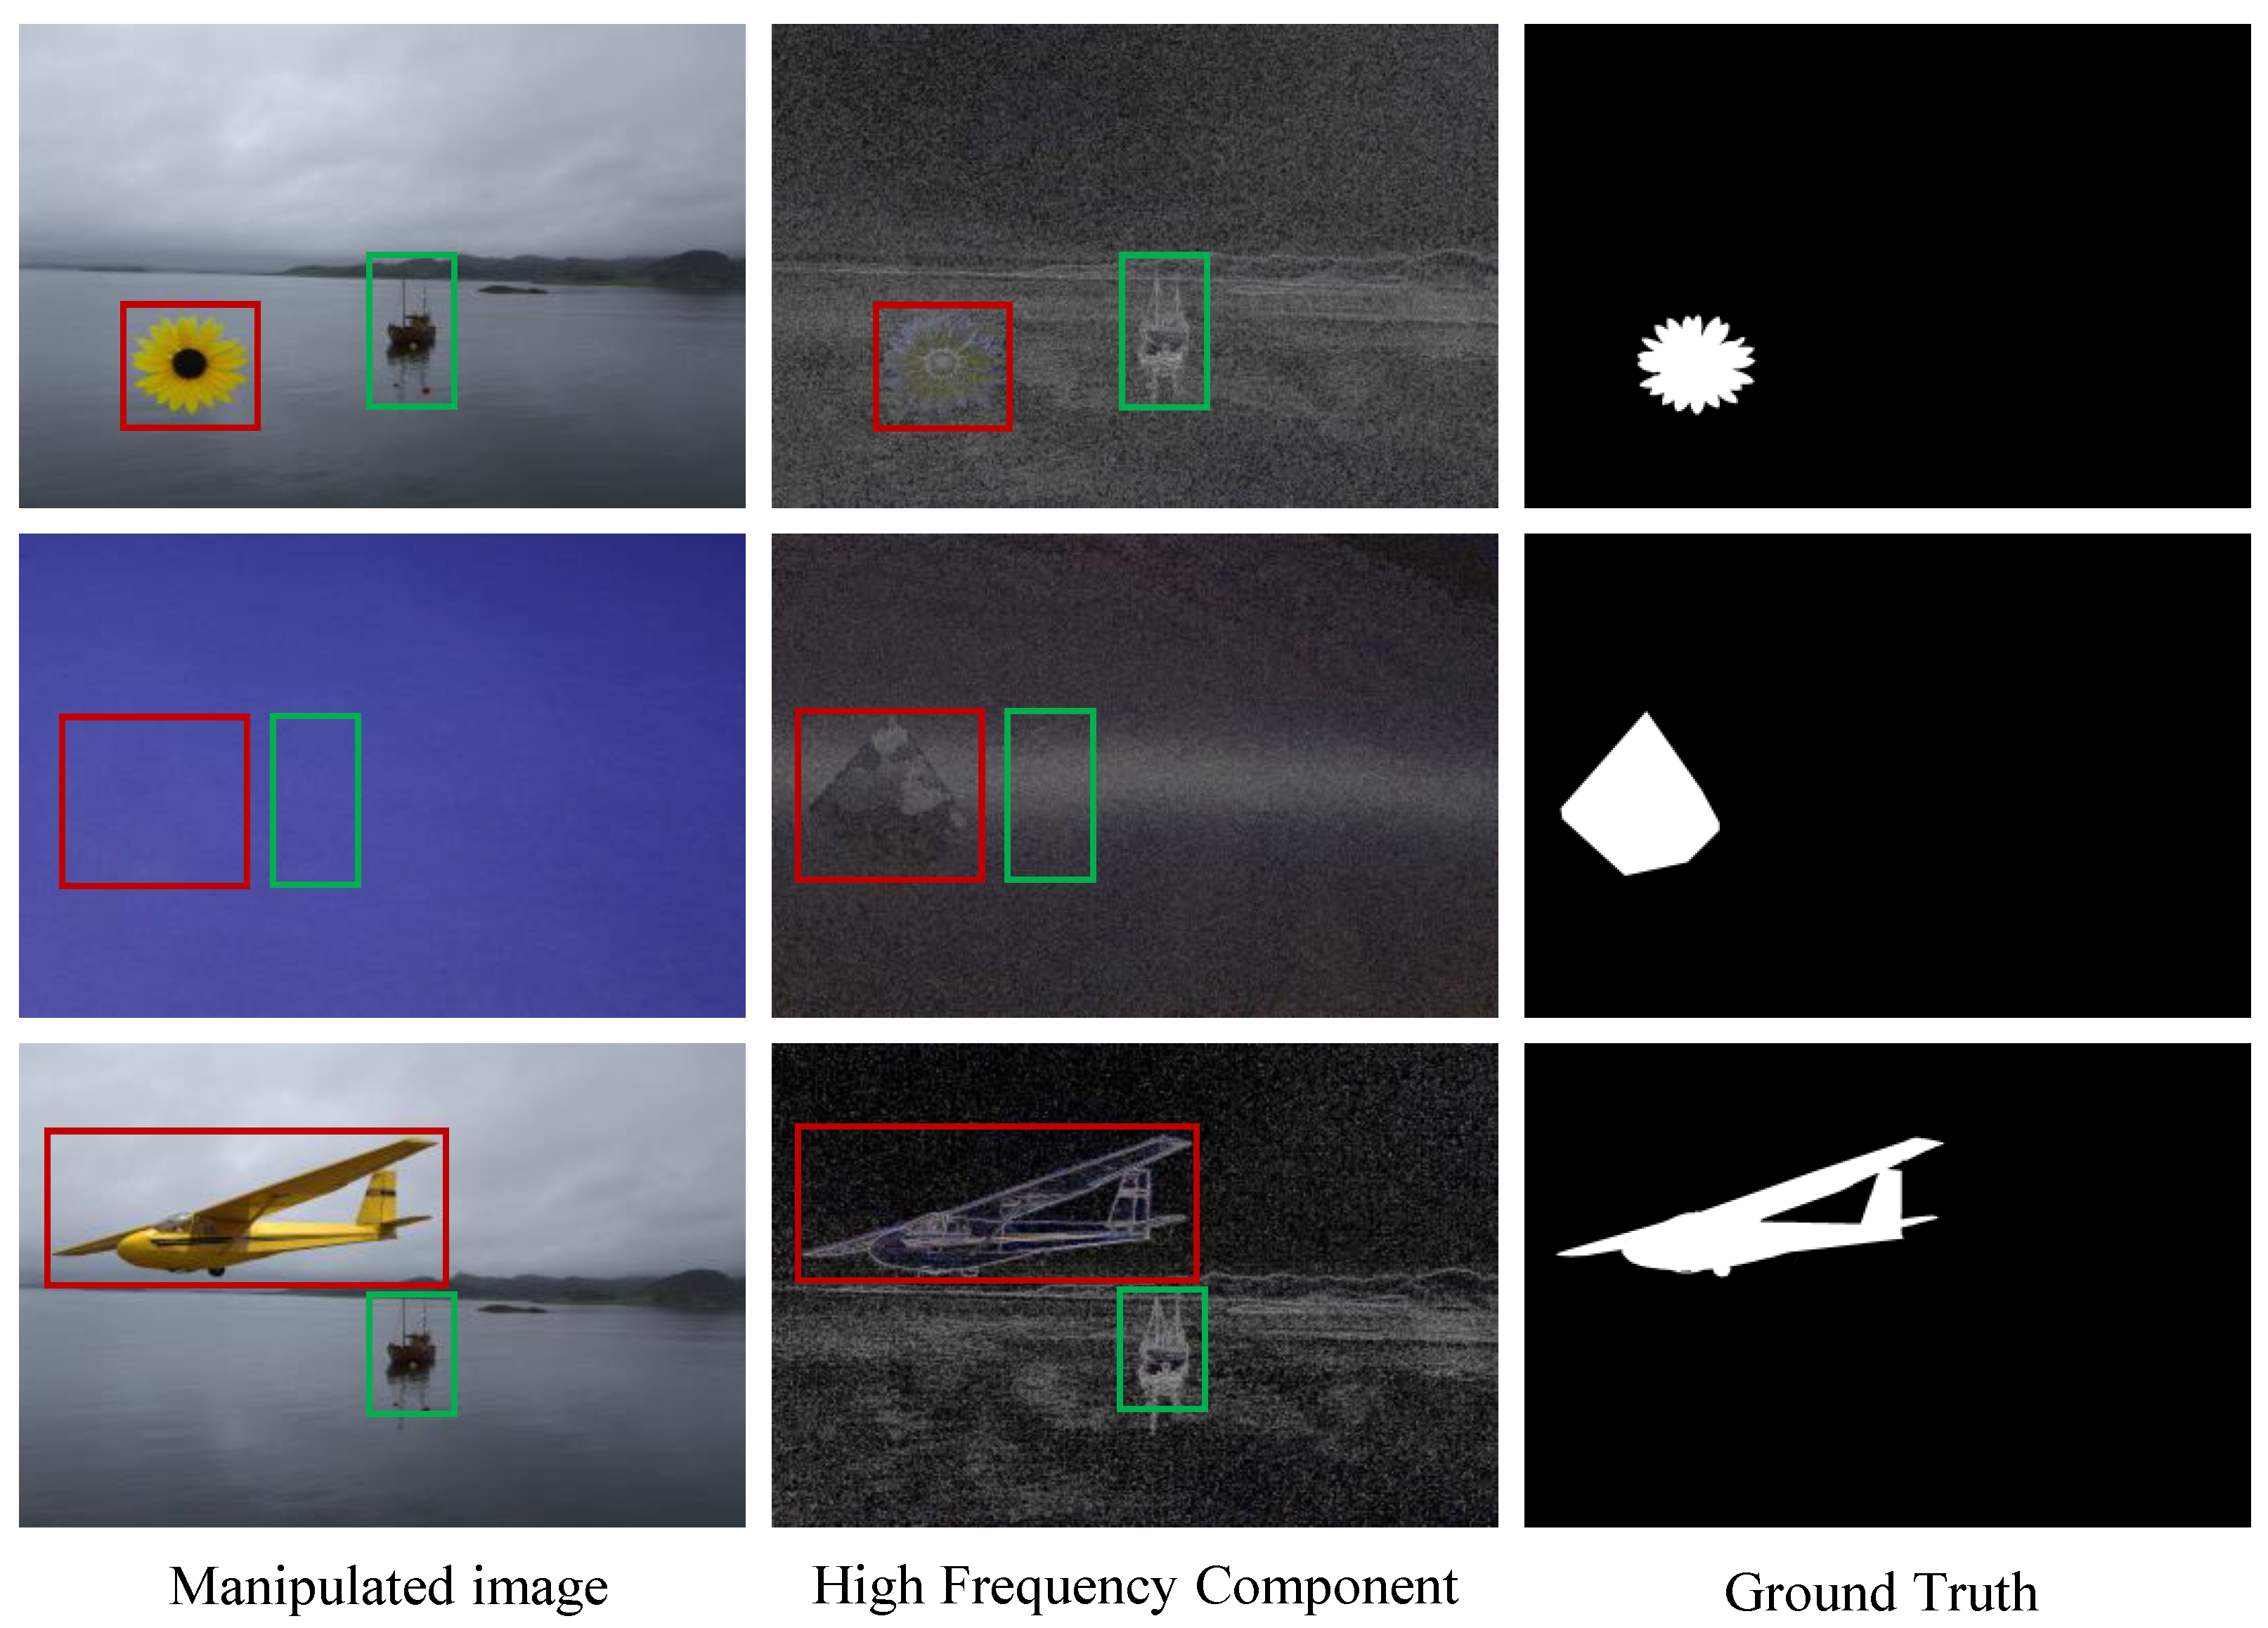
Figure 1.
The main idea. From left to right, we show the manipulated image, the high-frequency component of the image, and the ground truth mask. The high-frequency component is generated by filtering out the low-frequency component by the Sobel filter. The red box indicates the manipulated region, while the green box represents the authentic region. We can observe that the edge of the manipulated region contains richer information than the edge of the authentic region. Utilizing these traces can effectively improve the detection performance of the network.
- The novel HFCE-Net is proposed for image manipulation detection, which fully explores the high-frequency component by adopting the Sobel filter to filter out the low-frequency component and uses the edge information of manipulated regions as the supervision of the HFAB branch.
- The Multi-Layer Fusion (MLF) module is introduced to effectively aggregate the high-frequency information from the HFAB branch and the main stream branch in a hierarchical manner.
- The HFCE-Net outperforms previous methods on various CASIA, NIST, and Coverage datasets. The experiments also show that our method achieves better robustness to various attacks than other methods.
2. Related Work
Image Manipulation Detection. Image manipulation detection (IMD) aims to simultaneously detect and localize manipulated regions in a suspect image, which requires obtaining manipulation artifact information from different images. As shown in Figure 2, common image manipulation operations include splicing, copy-paste, and removal. Image splicing aims to generate a manipulated image by copying one or more regions from one image to another. Copy-move refers to creating a manipulated image by copying one or more regions from one image to the same image. Removal refers to deleting a region in an image and replacing the deleted region with a related algorithm. These manipulated images are so visually realistic that they can often be passed off as the real thing.
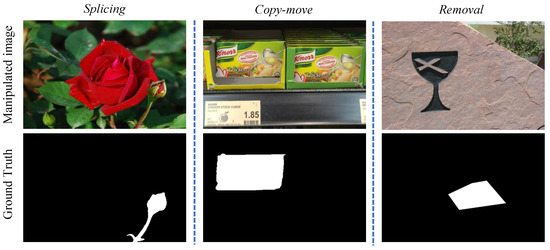
Figure 2.
Some examples of manipulated images. From left to right, we show three common manipulation operations (i.e., splicing, copy-move, and removal) with the corresponding ground truth mask.
Most of the early IMD methods are based on handcraft features like Discrete Cosine Transform (DCT)/Discrete Wavelet Transform (DWT) [10,11], as well as Camera Filter Array (CFA) patterns [12]. Most of these methods are based on a specific feature of the manipulated image and extract low-level features of the image, resulting in suboptimal detection performance. At the same time, most of these methods only solve a specific manipulation operation, which severely limits the generalizability of the methods.
Deep neural networks have proven successful in many computer vision tasks [14,15,16,17,18,19]. Therefore, recent IMD methods focus on designing different deep neural networks to map the manipulated image into high-embedding space in order to learn powerful features. RGB-N [1] employs a two-branch network, in which one branch adopts the SRM filter [20] to highlight manipulation features. Inspired by the RGB-N, BayarConv [2] is introduced to suppress the image content through the elaborate convolutional layer. The following efforts Mantra-Net [3] and SPAN [7] explored both SRM and BayarConv to learn more powerful features. Other subsequent works GSR-Net [4] and MVSS-Net [5] take advantage of boundary information to help the network locate manipulated regions. Another method PSCC-Net [13] explores and fuses different scale features to learn a powerful feature. However, these methods do not fully consider the high-frequency information left in the manipulated image, resulting in sub-optimal detection performance.
Edge Detection. The main idea of edge detection is that by designing an edge detector, it is possible to predict the edge maps. Previously proposed edge detection algorithms such as Sobel operator [21] and Canny [22] are also widely used nowadays. Recently, with the development of deep learning (DL), researchers have proposed edge detection algorithms based on deep learning continuously. Some well-known methods, such as DeepEdge [23], BDCN [24], RCF [25], are based on deep learning networks to automatically predict the edge maps by supervising the edge information. Similar to edge detection, manipulated images contain a lot of useful information in the edge region of the manipulated region. Using the above idea, it is possible to effectively learn useful features from the manipulated image to help the network accurately locate the manipulated region.
Multi-Scale/Layer Representation Learning. The features of different layers of a deep neural network usually contain different information. The features of the shallow layers of the network contain rich detail information (texture, edge information), while the higher layers of the network usually contain rich semantic information. Therefore, it is important for computer vision tasks to learn and fuse different scale/layer features. Some innovative segmentation networks, such as PSPNet [26] and Deeplab [27], improve segmentation performance using multi-scale feature fusion. After that, some other works [28] fully explore the multi-scale features through the attention mechanism. AugFPN [29] proposed a new feature pyramid network (FPN) [30] to further explore the multi-scale feature for objection detection. Inspired by this method, in our network, we fuse the different scale features learned from the proposed HFAB and mainstream to learn more distinctive features for image manipulation detection.
3. Proposed Method
This section introduces the proposed network architecture for IMD, called HFCE-Net, which consists of two parallel branches (main stream branch and high-frequency auxiliary branch (HFAB)) that receive as input an RGB image and the high-frequency component of the image, respectively, and then generate a prediction with the same resolution. The overall architecture of HFCE-Net is shown in Figure 3. Below we describe each branch in detail.
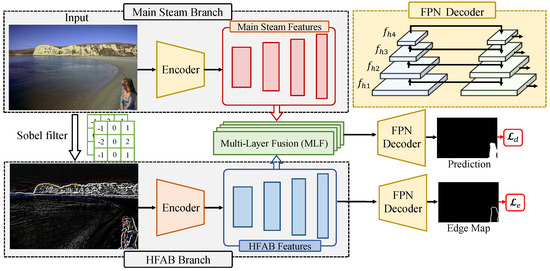
Figure 3.
The architecture of proposed HFCE-Net.
3.1. High-Frequency Auxiliary Branch
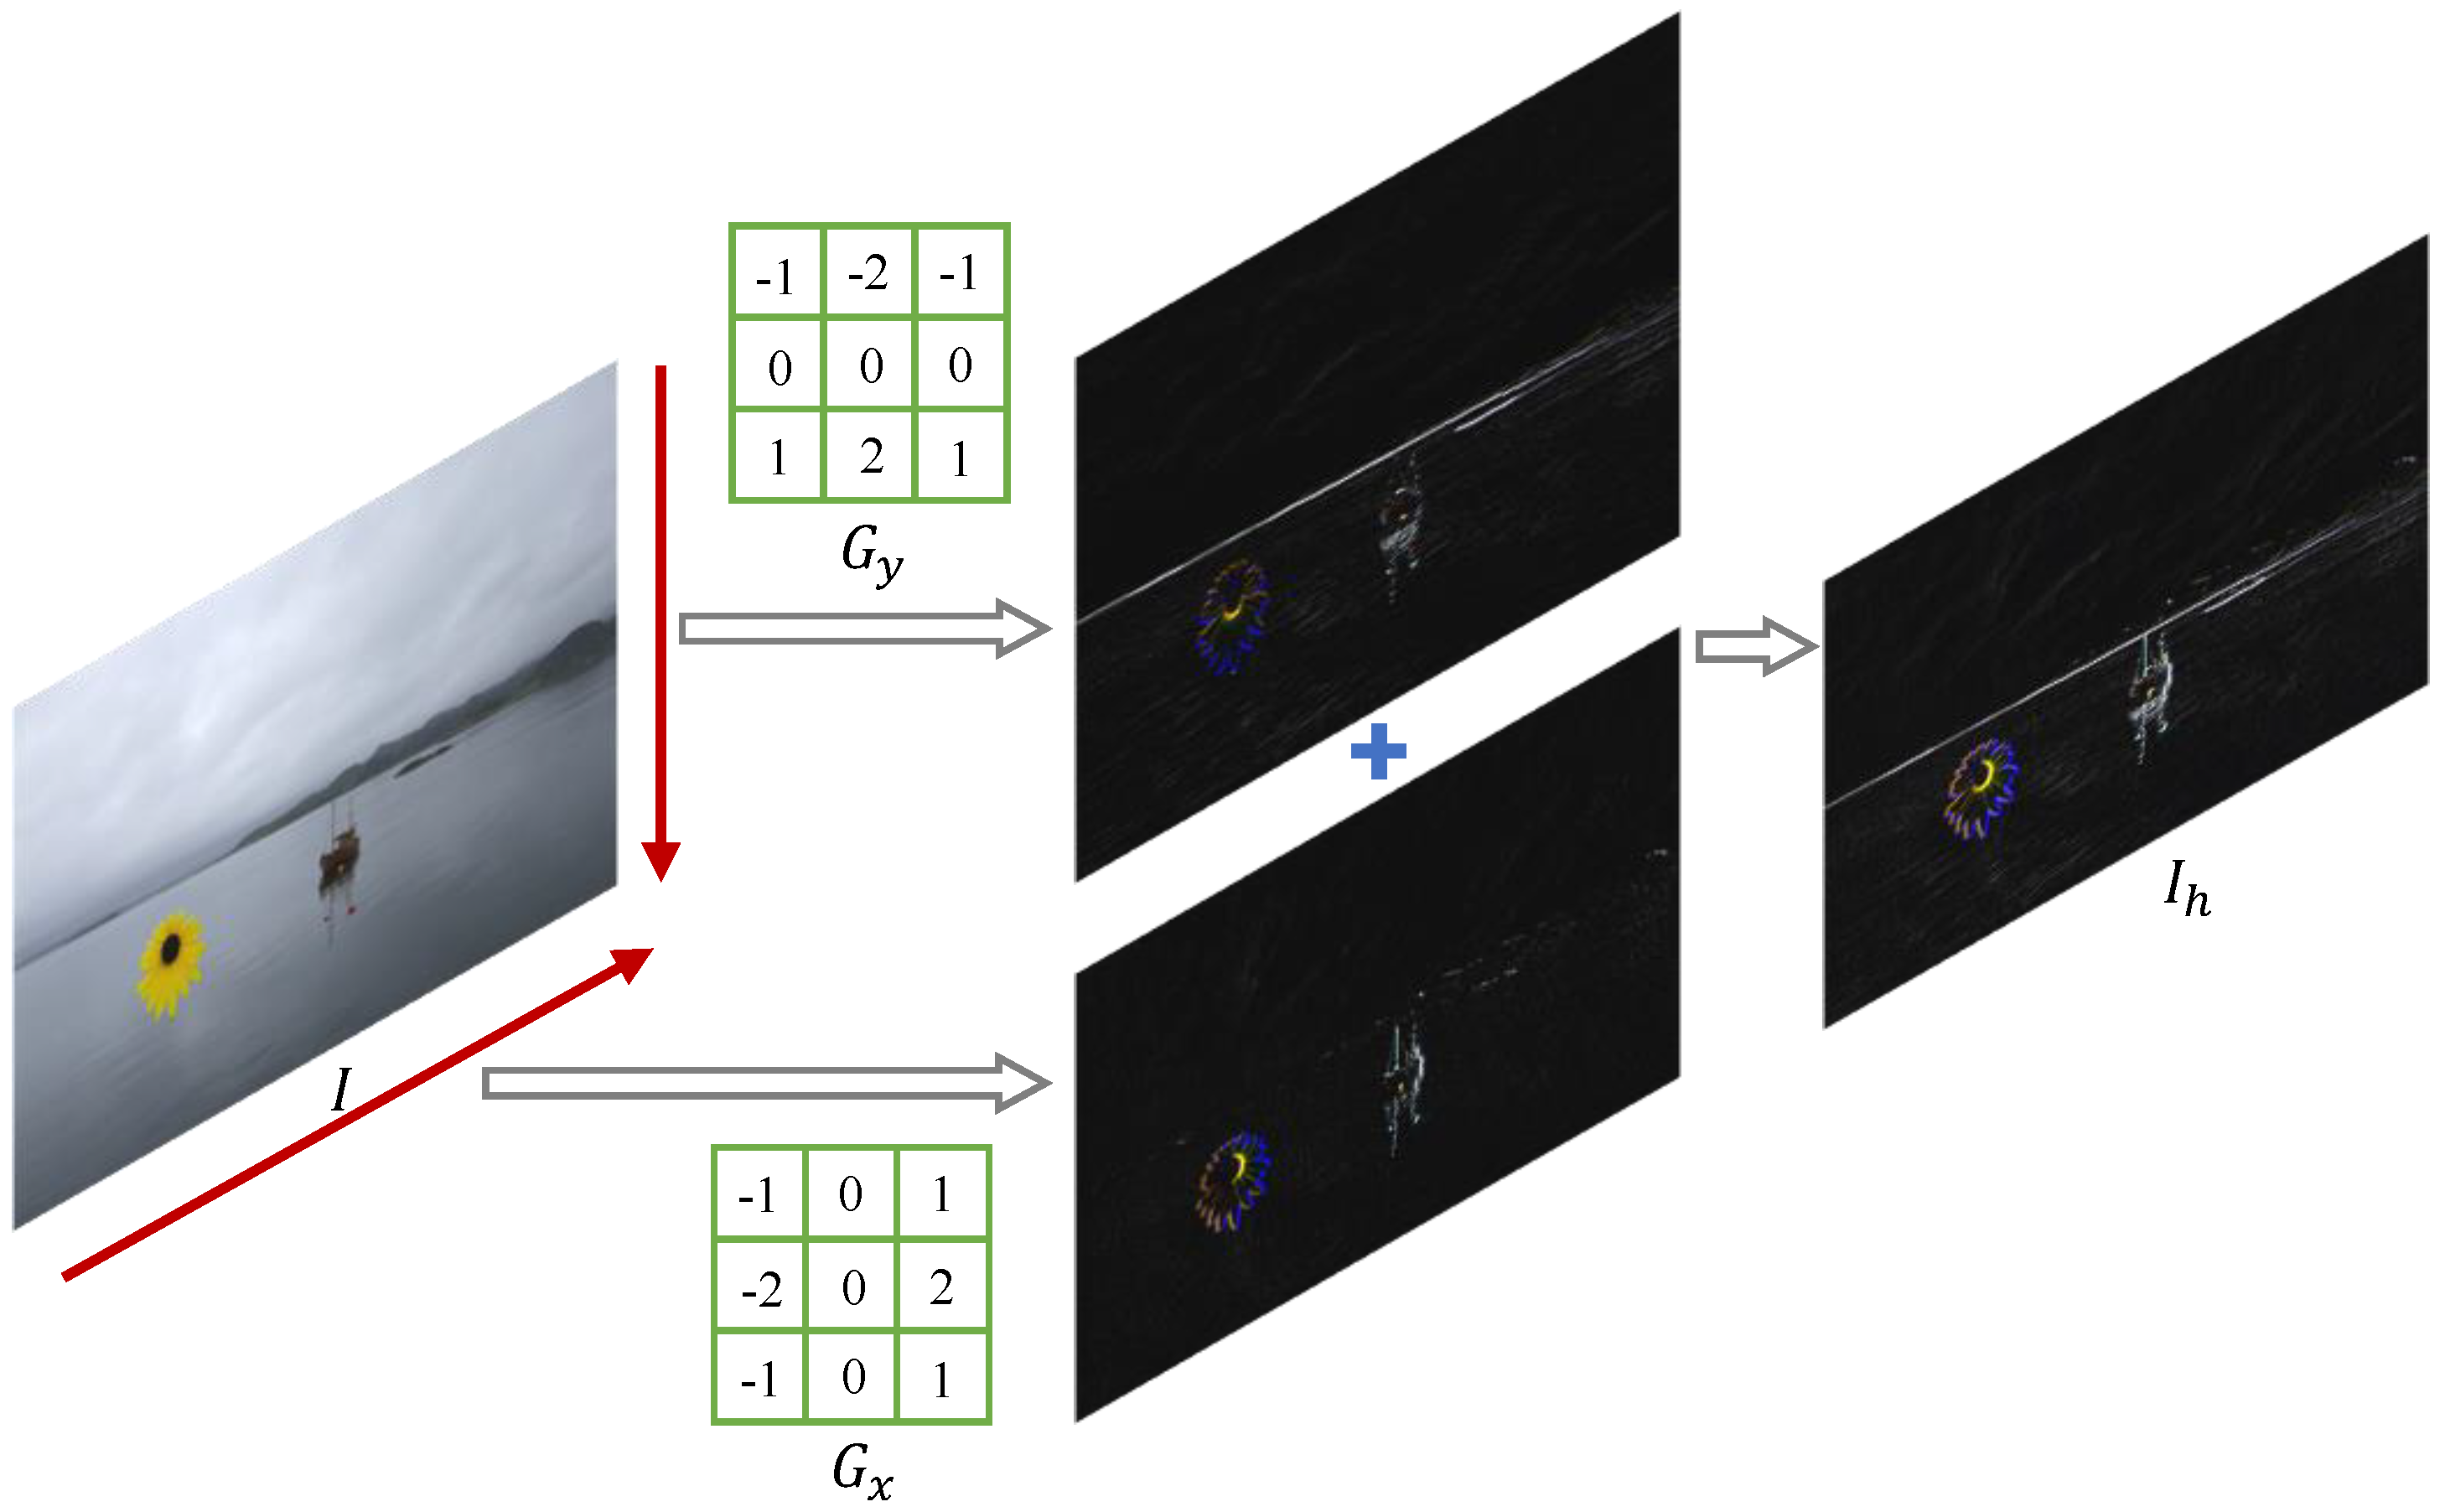
Let be the input image of the High-Frequency Auxiliary Branch (HFAB). We first apply the Sobel filter to filter out the low-frequency component of the image, which is achieved by separately detecting the horizontal and vertical boundaries along an image, as shown in Figure 4. The Sobel filter uses a pair of 3 × 3 convolution kernels in both the horizontal and vertical directions by measuring the two-dimensional spatial gradient on an image. The kernel calculates the spatial gradient in the horizontal direction while the kernel calculates the spatial gradient in the vertical direction. Finally, the information of two directions is added together to generate , which can be formulated as
where ∗ is the two-dimensional signal processing convolution operation. The Sobel filter can effectively highlight the edge information in the image, which facilitates the network to learn effective features to locate the manipulated region.
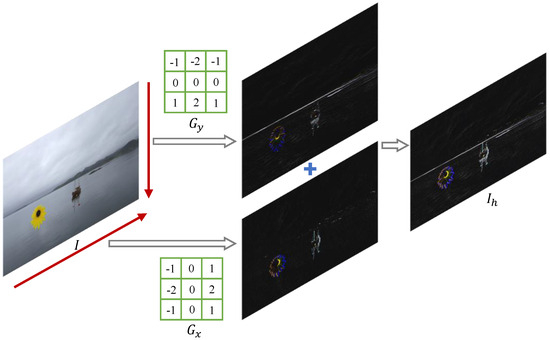
Figure 4.
The process of the Sobel filter to filter out the low-frequency component with the size of 3 × 3.
After obtaining the , the network sends the to the encoder. Here, we choose Segformer [31] as the encoder, which includes a hierarchical transformer encoder that can learn powerful multi-scale features. The encoder outputs multi-level features with a size of of the original image resolution. The is sent to the decoder to generate the prediction, the decoder is the Feature Pyramid Network, which takes the multi-scale feature as input and generates an edge map at the same scale. The goal of the HFAB is to fully exploit the high-frequency information. Therefore, the network is supervised by the generated edge information. To this end, the HFAB branch is able to learn a representation that contains rich high-frequency information to effectively localize the manipulated regions.
3.2. Multi-Layer Fusion
Since different layers of the network represent features at different scales, shallow features may be insensitive to edge information, while deeper features may lose some of the image detail information. To better utilize the multi-scale information, we design a multi-layer fusion module to aggregate the high-frequency information learned from the HFAB branch into the main stream branch to enhance the multi-scale representations learned in each layer.
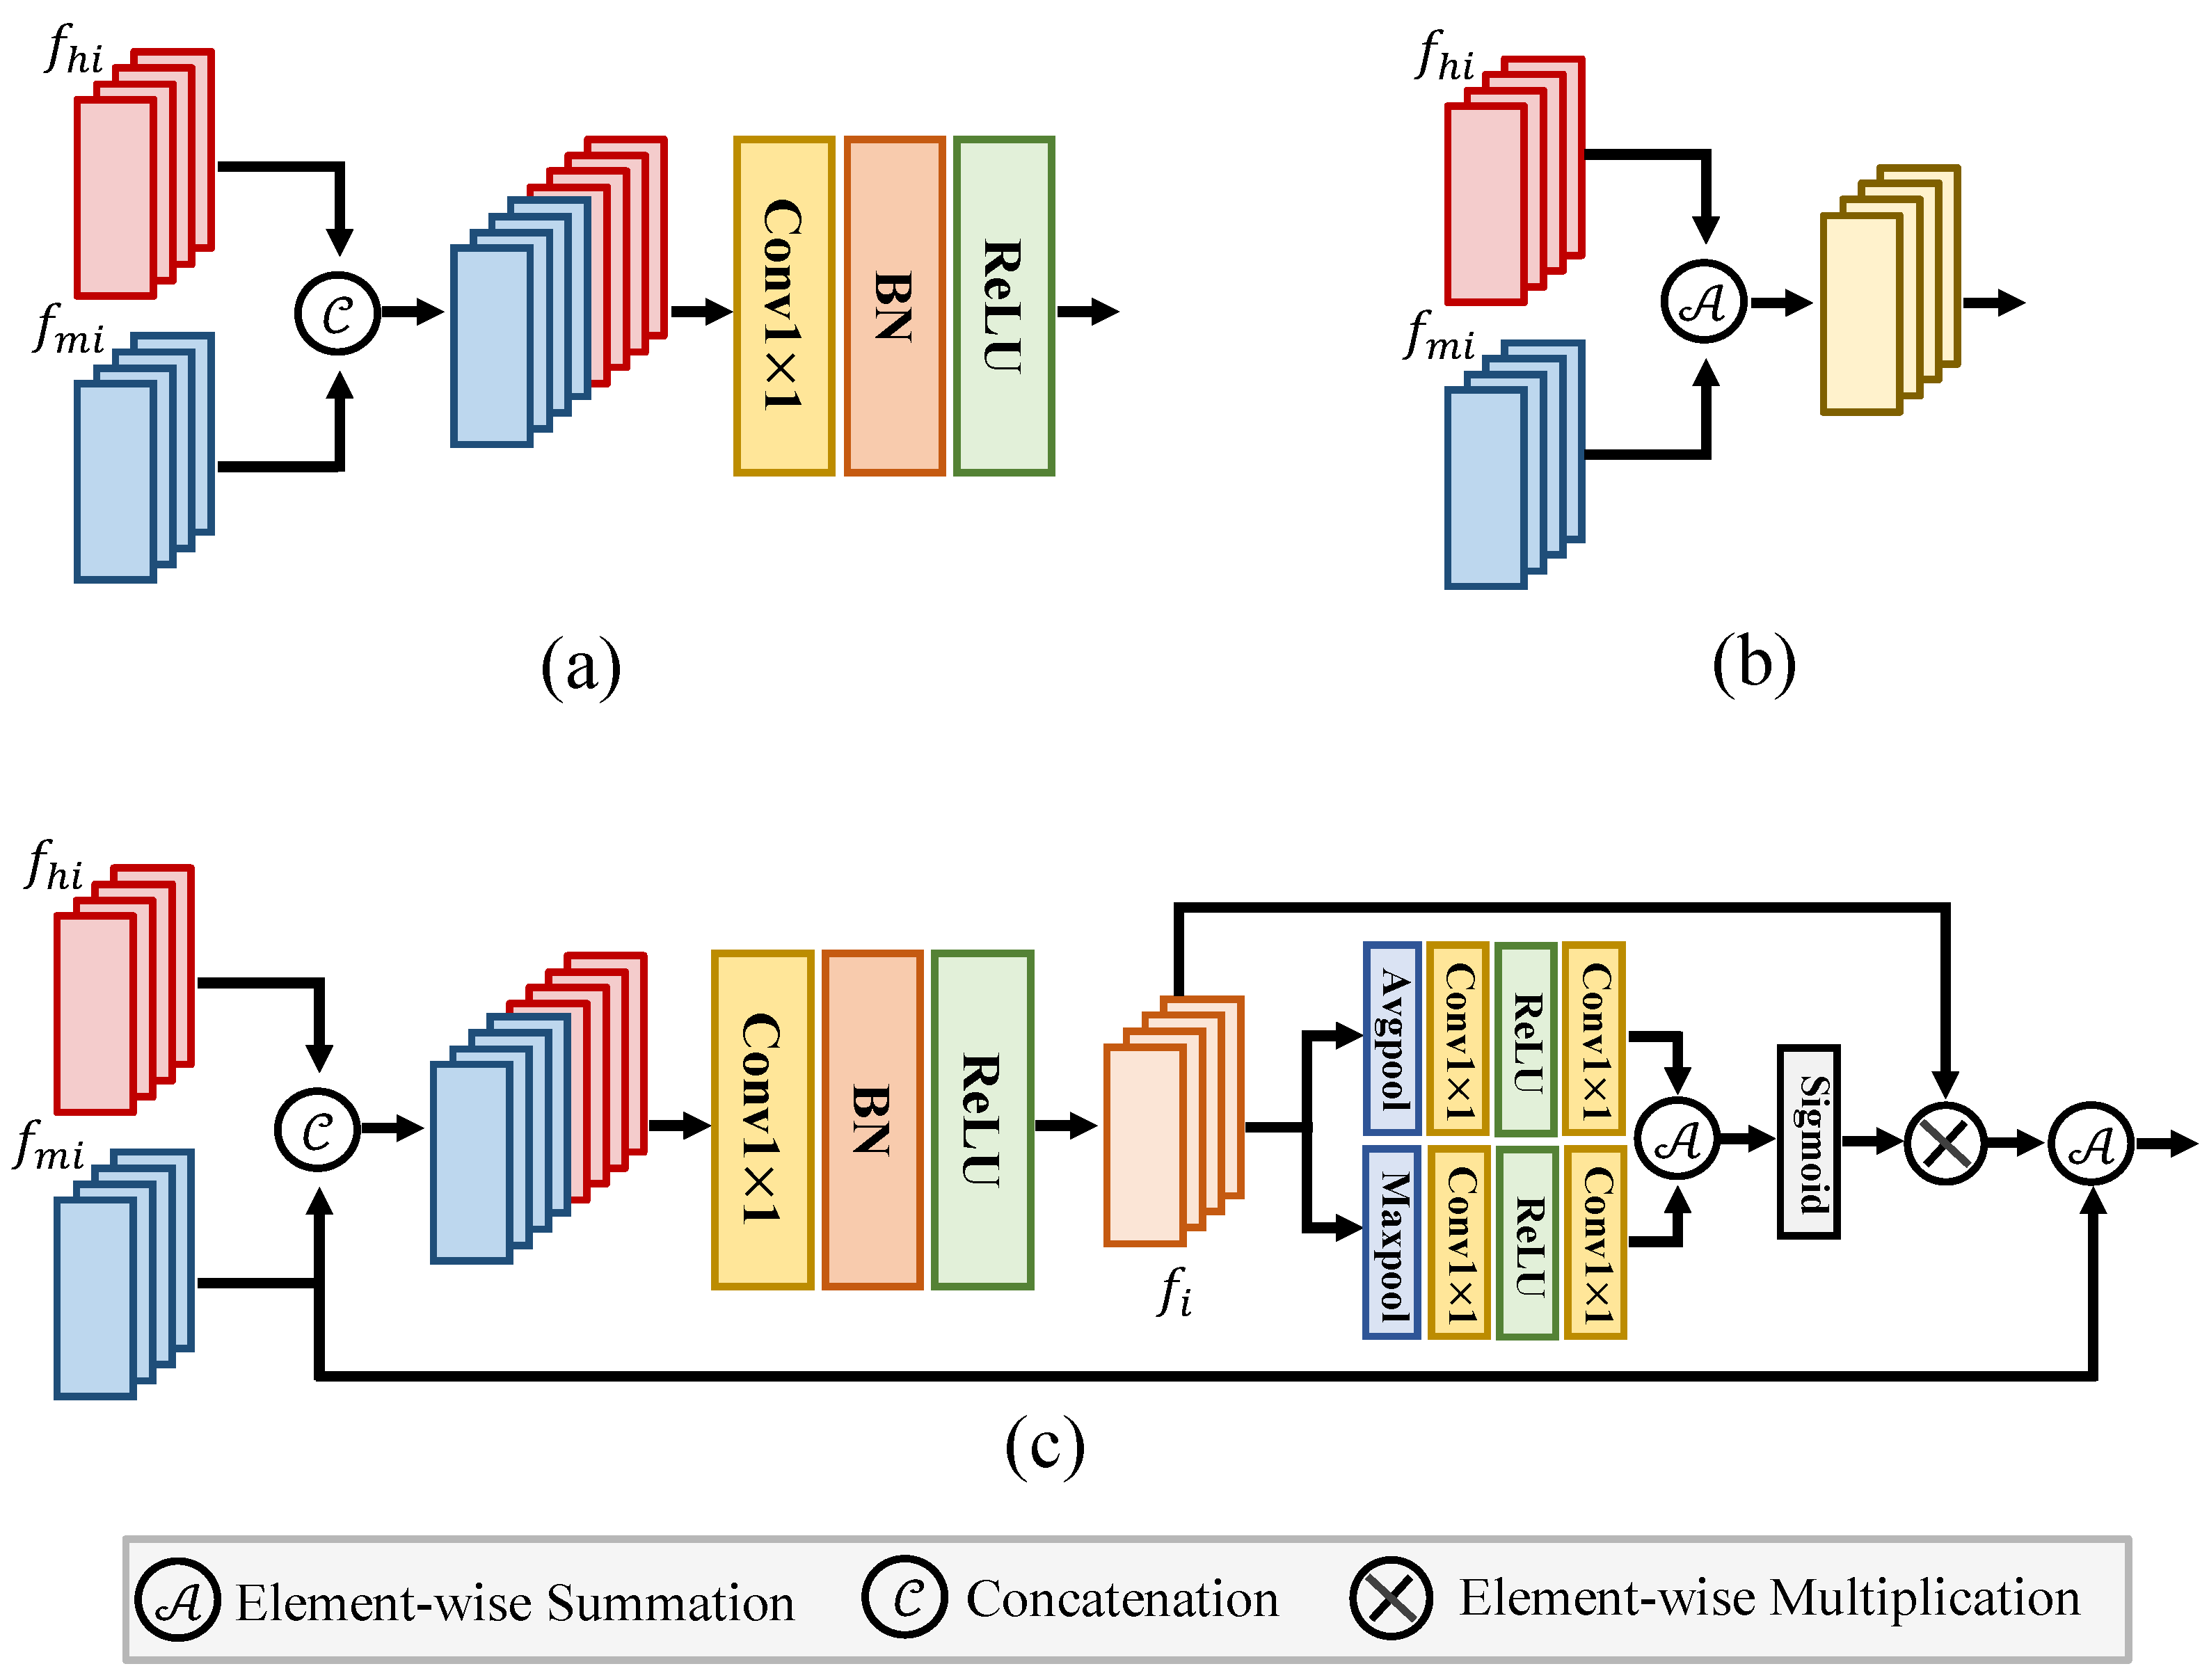
As illustrated in Figure 5c, for an input high-frequency information and the hierarchical feature are learned from the main stream branch. Given the corresponding features of the two feature sets and , , the two features are first concatenated along the channel dimension. Then, the concatenated feature is sent to a convolutional layer with kernel, a batch normalization layer, and a ReLU activation function. The above operation can be formulated as
where is a convolution with kernel. BN is the batch normalization layer. ReLU is the ReLU activation function. After that, is sent to the two sub-branches. Each sub-branch comprises average pooling, a batch normalization layer, and a ReLU activation function. Additionally, it includes max pooling layers, a batch normalization layer, and a ReLU activation function. The outputs of these two sub-branches are fused together by the element-wise summation. Then, after applying a Sigmoid activation function, we obtain a matrix to reweight the feature by element-wise multiplication. Finally, the reweighted feature is merged with the main stream feature by element-wise summation. The above operation can be written as
where is the output of the MLF. Avg and Max denote the Average pooling and Max pooling layer. The Sum denotes the element-wise summation, and Sigmoid is the Sigmoid activation function. ⊗ denotes element-wise multiplication and the ⊕ denotes element-wise summation. The learned feature is sent to the decoder to locate the manipulated regions.
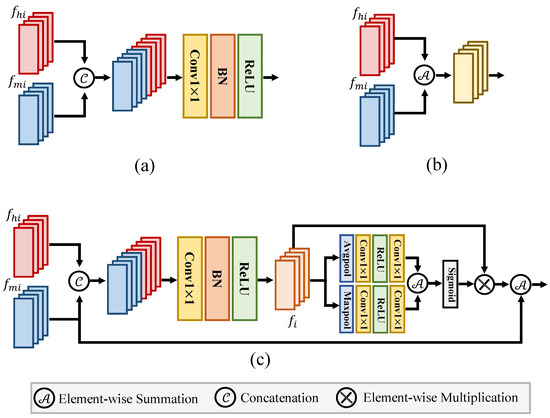
Figure 5.
Illustration of different feature fusion methods. (a,b) denote the concatenation and addition feature fusion methods. (c) denotes the proposed multi-layer fusion method.
3.3. Loss Function
The HFCE-Net can be summarized as a function , where I is the input image, GT denotes the ground-truth mask, and is the final prediction. Moreover, the HFAB branch generates the edge map to compute the loss with the edge of the ground-truth mask. Therefore, there are two different losses in our network, the edge loss and the detection loss . The edge loss is to supervise the HFAB branch learning to capture more powerful features that contain rich high-frequency information. The detection loss is to supervize the feature fusion of MLF and the network training. The and the are the hybrid loss [32], which can be defined as follows:
where , , and denote the edge of ground-truth masks, predicted probabilities of the edge map for class c and nth pixel in the batch, ground-truth masks and predicted probabilities for class c and nth pixel in the batch.
The overall loss is function is defined as follows:
4. Experimental Settings and Baselines
This section introduces the datasets used for training and evaluation of the proposed model. We also provide the introduction of the baseline methods. Detailed information on the evaluation metrics and network implementation is also provided.
4.1. Datasets
The datasets used to train and evaluate the performance of the proposed network are summarized below.
CASIA: The CASIA image manipulation detection dataset consists of two versions: CASIA 1.0 and CASIA 2.0. The dataset consists of manipulated images generated by the copy-move, and splice operations, containing 921 and 5,124 manipulated images, respectively. The resolution of CASIA 1.0 is 384 × 256, and the size of CASIA 2.0 ranges from 320 × 240 to 800 × 600. The processing, such as Blurring, is applied to the manipulated images. The manipulated regions of this dataset have been carefully selected to make the manipulated images more deceptive. Following existing works, we select CASIA 2.0 as the training set and CASIA 1.0 as the test set.
NIST: The NIST dataset is a high-resolution dataset with an average resolution of 3460 × 2616, containing 564 splicing, copy-move, and removal images. This dataset is divided into two subsets, the training set and the test set. The training set contains 404 images, while the rest are used for testing.
Coverage: Coverage is a smaller dataset containing only 100 copy-move images, with an average image resolution of 486 × 400. During the generation of the manipulated images, several transformations are applied to the manipulated region, such as scaling, rotation, and illumination with different factors. We chose 75 as the training set and 25 as the test set. It is worth noting that the training dataset is too small, resulting in poor training results. Therefore, we use the annotation of the training set to select the object and paste it into the same image to generate 142 additional images with corresponding ground truth masks.
4.2. Evaluation Metrics
Following previous works [7,13], we take the F1 score and area under the curve (AUC), which have been widely used in the IMD community, while the F1 score is a more popular metric to evaluate the performance and previous works only report F1 score. Moreover, we adopt Accuracy and Mean Intersection over Union (mIoU) as another metric. The F1 score, AUC, mIoU, and Accuracy are defined as follows:
where the TP is the number of pixels predicted as true positive, while the FP denotes the number of pixels predicted as false positive. The FN represents the number of pixels predicted as false negative.
The AUC is defined as the area under the Receiver Operating Characteristic (ROC). The ROC is obtained by the True Positive Rate (TPR) and the False Positive Rate (FPR), which are defined as follows:
where the TN represents the number of pixels predicted as true negative.
The Accuracy is defined as
The mIoU (Mean Intersection over Union) is used to calculate the intersection over the union of the ground truth labels and the predicted result set. It comprehensively considers the accuracy and positional precision of the prediction, allowing for a more comprehensive evaluation of model performance, which is formulated as follows:
where the k denotes the number of categories, GT denotes the ground-truth mask, and Pre is the final prediction.
4.3. Implementation Details
The model is implemented using Pytorch 2.0 with Python 3.8.0 in the Ubuntu 22.04. The training ended after 30K iterations in the CASIA dataset, and was solved after 8 K iterations on the NIST and Coverage dataset. The batch size is set to 16. The encoder is chosen as SegformerB0 [31] and the decoder is set to FPN. The AdamW optimizer is used in training and the initial learning rate is set to and the weight decay to following existing work [31]. The training set is processed with data augmentation by the toolbox Albumentation, including flipping, rotating, filling, cropping, and adding Gaussian noise. Each image has a probability p of applying the above augmentation. Here, we set , and the size of the input image is . Note that the Albumentation does not generate additional images for training.
4.4. Baseline
Our model is compared with various methods, including J-LSTM [33] and H-LSTM [34], RGB-N [1], SPAN [7], PSCCNet [13], which are introduced below:
The J-LSTM [33] and H-LSTM [34] both use LSTM with CNN to capture manipulation trace.
RGB-N [1] designs a two-branch network that takes the Noise image and RGB image as input.
SPAN [7] adopts attention to capture the long-range relationship of manipulated image.
PSCCNet [13] uses fusion of different scale features to learn from the CNN to locate manipulated regions.
5. Experimental Results and Analysis
This section presents evaluations conducted by the metrics presented in Section 4.2. As shown in Table 1, we compare HFCE-Net with five state-of-the-art methods on three benchmarks.

Table 1.
Performance comparison of HFCE-Net with other SoTA methods. “-” denotes that experimental results are not available. The highest score is shown in bold.
Comparison of CAISA Datasets. The detection performance for the CAISA dataset is shown in Table 1. It is clearly shown that our model achieves improvements of 1.9%/2.4% 19.1%/6.1% 16.5%/10.4% on the CASIA dataset in terms of F1 score and AUC compared to previous methods, respectively. It is worth noting that in contrast to existing work, RGB-N [1], SPAN [7], and PSCCNet [13], our work does not require the network to be pre-trained on the large dataset first and then fine-tuned on the three benchmarks. This demonstrates the efficiency of our method.
Comparison of NIST Datasets. The F1 score and AUC for the NIST dataset are shown in Table 1. As presented in Table 1, our approach yields 9.0% 19.1%/6.1% 16.5%/10.4% improvement in terms of F1 score, surpassing the previous method. For the AUC, we find that our model achieves comparable performance even without pretraining.
Comparison of Coverage Datasets. The Coverage dataset is difficult to train because the training set contains only 75 images. Therefore, we generate some images based on Coverage to expand the training set. As shown in Table 1, our method achieves 77.9%/95.8% in terms of F1 score and AUC, showing that the proposed network achieves more efficiency in detecting manipulated regions. Overall, our model achieves the best performance on all three benchmarks. This is mainly due to the powerful ability of our model to capture high-frequency information and fully explore the different scale features.
Moreover, we further use other metrics, i.e., accuracy, precision, and recall to evaluate our model, the results are reported in Table 2. The results show that our model is able to achieve satisfactory results while using other metrics.
Table 2.
The performance of our model using different metrics.
5.1. Ablation Study
To validate the impact of different components of our network, we evaluate different variants of our network on the CASIA dataset. The proposed model is based on the SegformerB0. We extend the SegformerB0 by the proposed HFAB and MLF to learn high-frequency information and utilize the different scale features. Therefore, we choose SegformerB0 as a baseline.
Ablation on High-Frequency Auxiliary Branch. In Table 3, we first validate the effectiveness of the High-Frequency Auxiliary Branch (HFAB) proposed in Section 3.1. The first row shows the detection performance of the baseline, which achieves 55.8%/48.9% in terms of F1 score and MIoU. The second and third rows denote the application of the HFAB with different fusion methods to fuse the feature from the HFAB and the feature from the main stream. Sum denotes the element-wise summation, and cat denotes the concatenation, which is introduced in Figure 5. It is clear that after applying the HFAB, the network obtains an improvement of 0.1%/- and 0.3%/0.3% in F1 score and MIoU while using different fusion methods, which shows the effectiveness of the proposed HFAB.
Table 3.
The ablation study of different variants of proposed HFCE-Net. The highest score is shown in bold.
Ablation on Multi-Layer Fusion. Furthermore, we conduct the ablation study on the multi-layer fusion (MLF) module proposed in the paper. As presented in Table 3, we compare different feature fusion methods, including element-wise summation and concatenation operation. We find that the element-wise summation and concatenation operation achieve 55.9%/48.8% and 56.1%/49.2% in F1 score and AUC, while using our MLF module achieving best performance (56.5%/49.5%) yields 0.6%/0.4% and 0.7%/0.3% improvement compared to the addition and concatenation operation. The improvements can mainly be attributed to the fact that the MLFs are effective in aggregating multi-scale features learned from HFAB, which contains rich high-frequency information, into the main stream as auxiliary information.
Ablation on Edge Supervision. In addition, we also perform the ablation study on the edge supervision proposed in Section 3.1. As shown in Table 3, we compare different variants of our network with and without the proposed edge supervision. The fifth, sixth, and seventh rows represent different variants of the proposed HFCE-Net with edge supervision (ES). The result shows that edge supervision leads to slightly better results. This is because the network with edge supervision has learned more high-frequency information around the manipulated regions.
5.2. Robustness Evaluation
In real life, images are susceptible to various attacks that can degrade the detection performance of the model. Thus, the robustness of the model is very important. In this section, we validate the model performance while the image is under different attacks, including Gaussian blurring, Gaussian noise, JPEG Compression, and Resizing. We retrain the official code of PSCCNet to obtain the results. The results are shown in Table 4.
Table 4.
Robustness comparison between the proposed HFCE-Net with PSCCNet in three datasets. The AUC is reported (in %). The highest score is shown in bold.
Gaussian Blurring. We use different Gaussian kernels . The robustness performance is presented in Table 4. It is clear that our method achieves better robustness compared to the PSCCNet in Gaussian blurring.
Gaussian Noise. We use different deviations to evaluate the robustness of our model. As shown in Table 4, the Gaussian noise attack on the image makes the model performance decrease. However, our model achieves better robustness under this attack.
JPEG Compression. We use different quality factors to attack the image. As a commonly used image attack, the robustness of our model under JPEG compression outperforms PSCCNet.
Resizing. Here, different resizing factors of 0.22, 0.5, and 0.78 are adopted to resize the image. Our method achieves comparable results under resizing attack. Overall, the proposed HFCE-Net is able to achieve strong robustness while the manipulated image is under different attacks.
5.3. Qualitative Results
In this section, we show the qualitative results of different variants of our model to demonstrate the efficacy of each component.
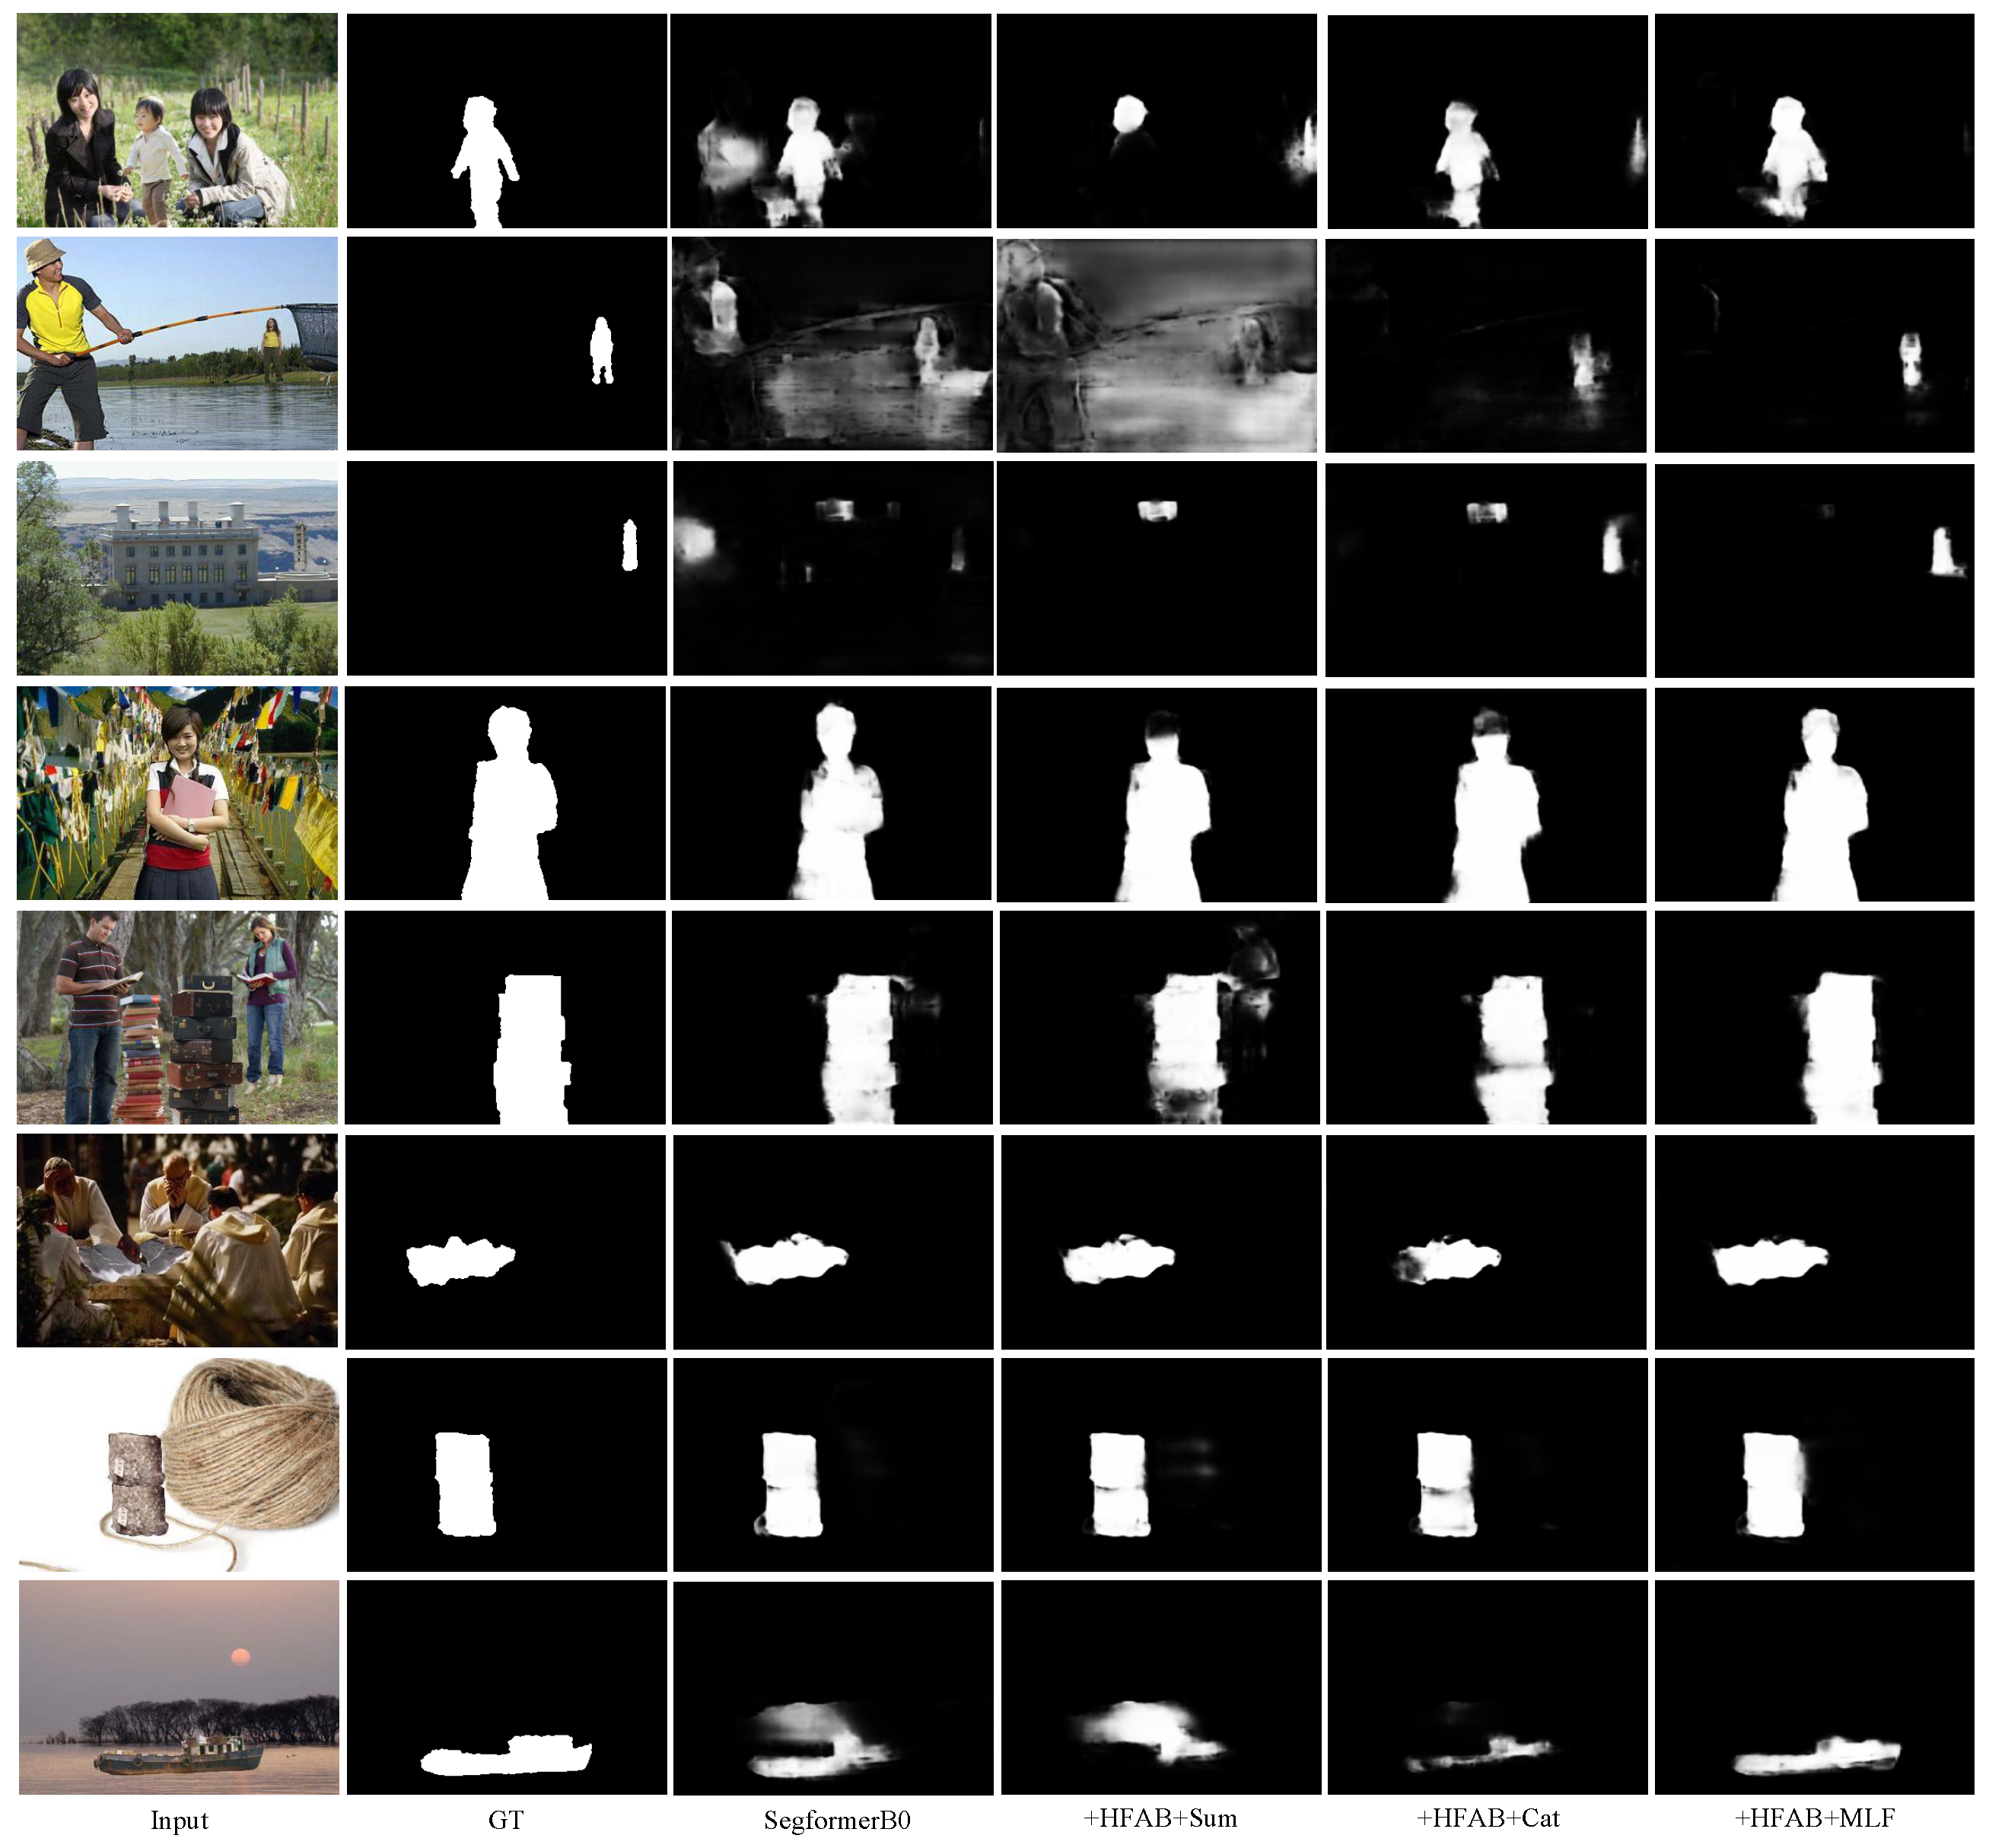
Qualitative results of the HFAB & MLF. First, we show the different variants of our network (following the setting in Table 4). As shown in Figure 6, with the help of the HFAB branch with different fusion methods, the model achieves better qualitative results than SegformerB0. Furthermore, when applying the MLF module, compared to the element-wise summation (sum) and concatenation (cat) feature fusion method, the proposed MLF generates a more accurate prediction. These results further demonstrate that the proposed method is beneficial for the model to locate the manipulated regions.

Figure 6.
Qualitative results of the High-Frequency Auxiliary Branch. From the first to the third column, the manipulated image, the ground truth mask (GT), and the prediction of SegformerB0. The fourth to sixth columns represent the prediction of different variants of our model with different settings in Table 3.
Qualitative results of the Edge supervision. Moreover, Figure 7 represents the effectiveness of the edge supervision employed in our network. It is clear to observe from the third and fourth columns that with the help of the edge supervision, the models are able to predict more accurate edges of the manipulation regions and more complete manipulation regions. Moreover, as shown in the last column in Figure 7, the edge supervision encourages the networks to focus on the edge of the manipulated regions, which provides more detailed information for locating the regions more accurately.
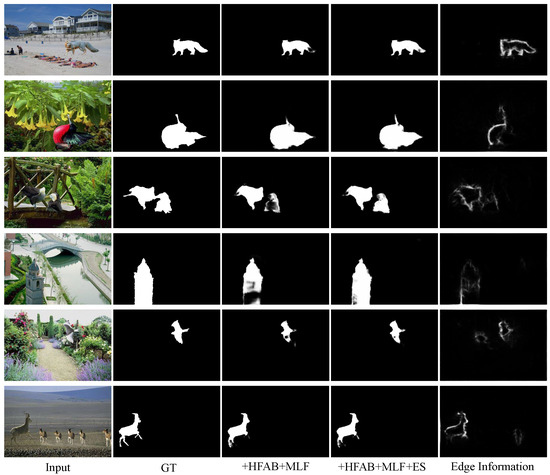
Figure 7.
Qualitative results of the edge supervision. From the first to the fifth column, the manipulated image, the ground truth mask (GT), the prediction of our model without the edge supervision (denoted as +HFAB + MLF), the prediction of our model with edge supervision (denoted as +HFAB + MLF + ES),and the output of the edge.
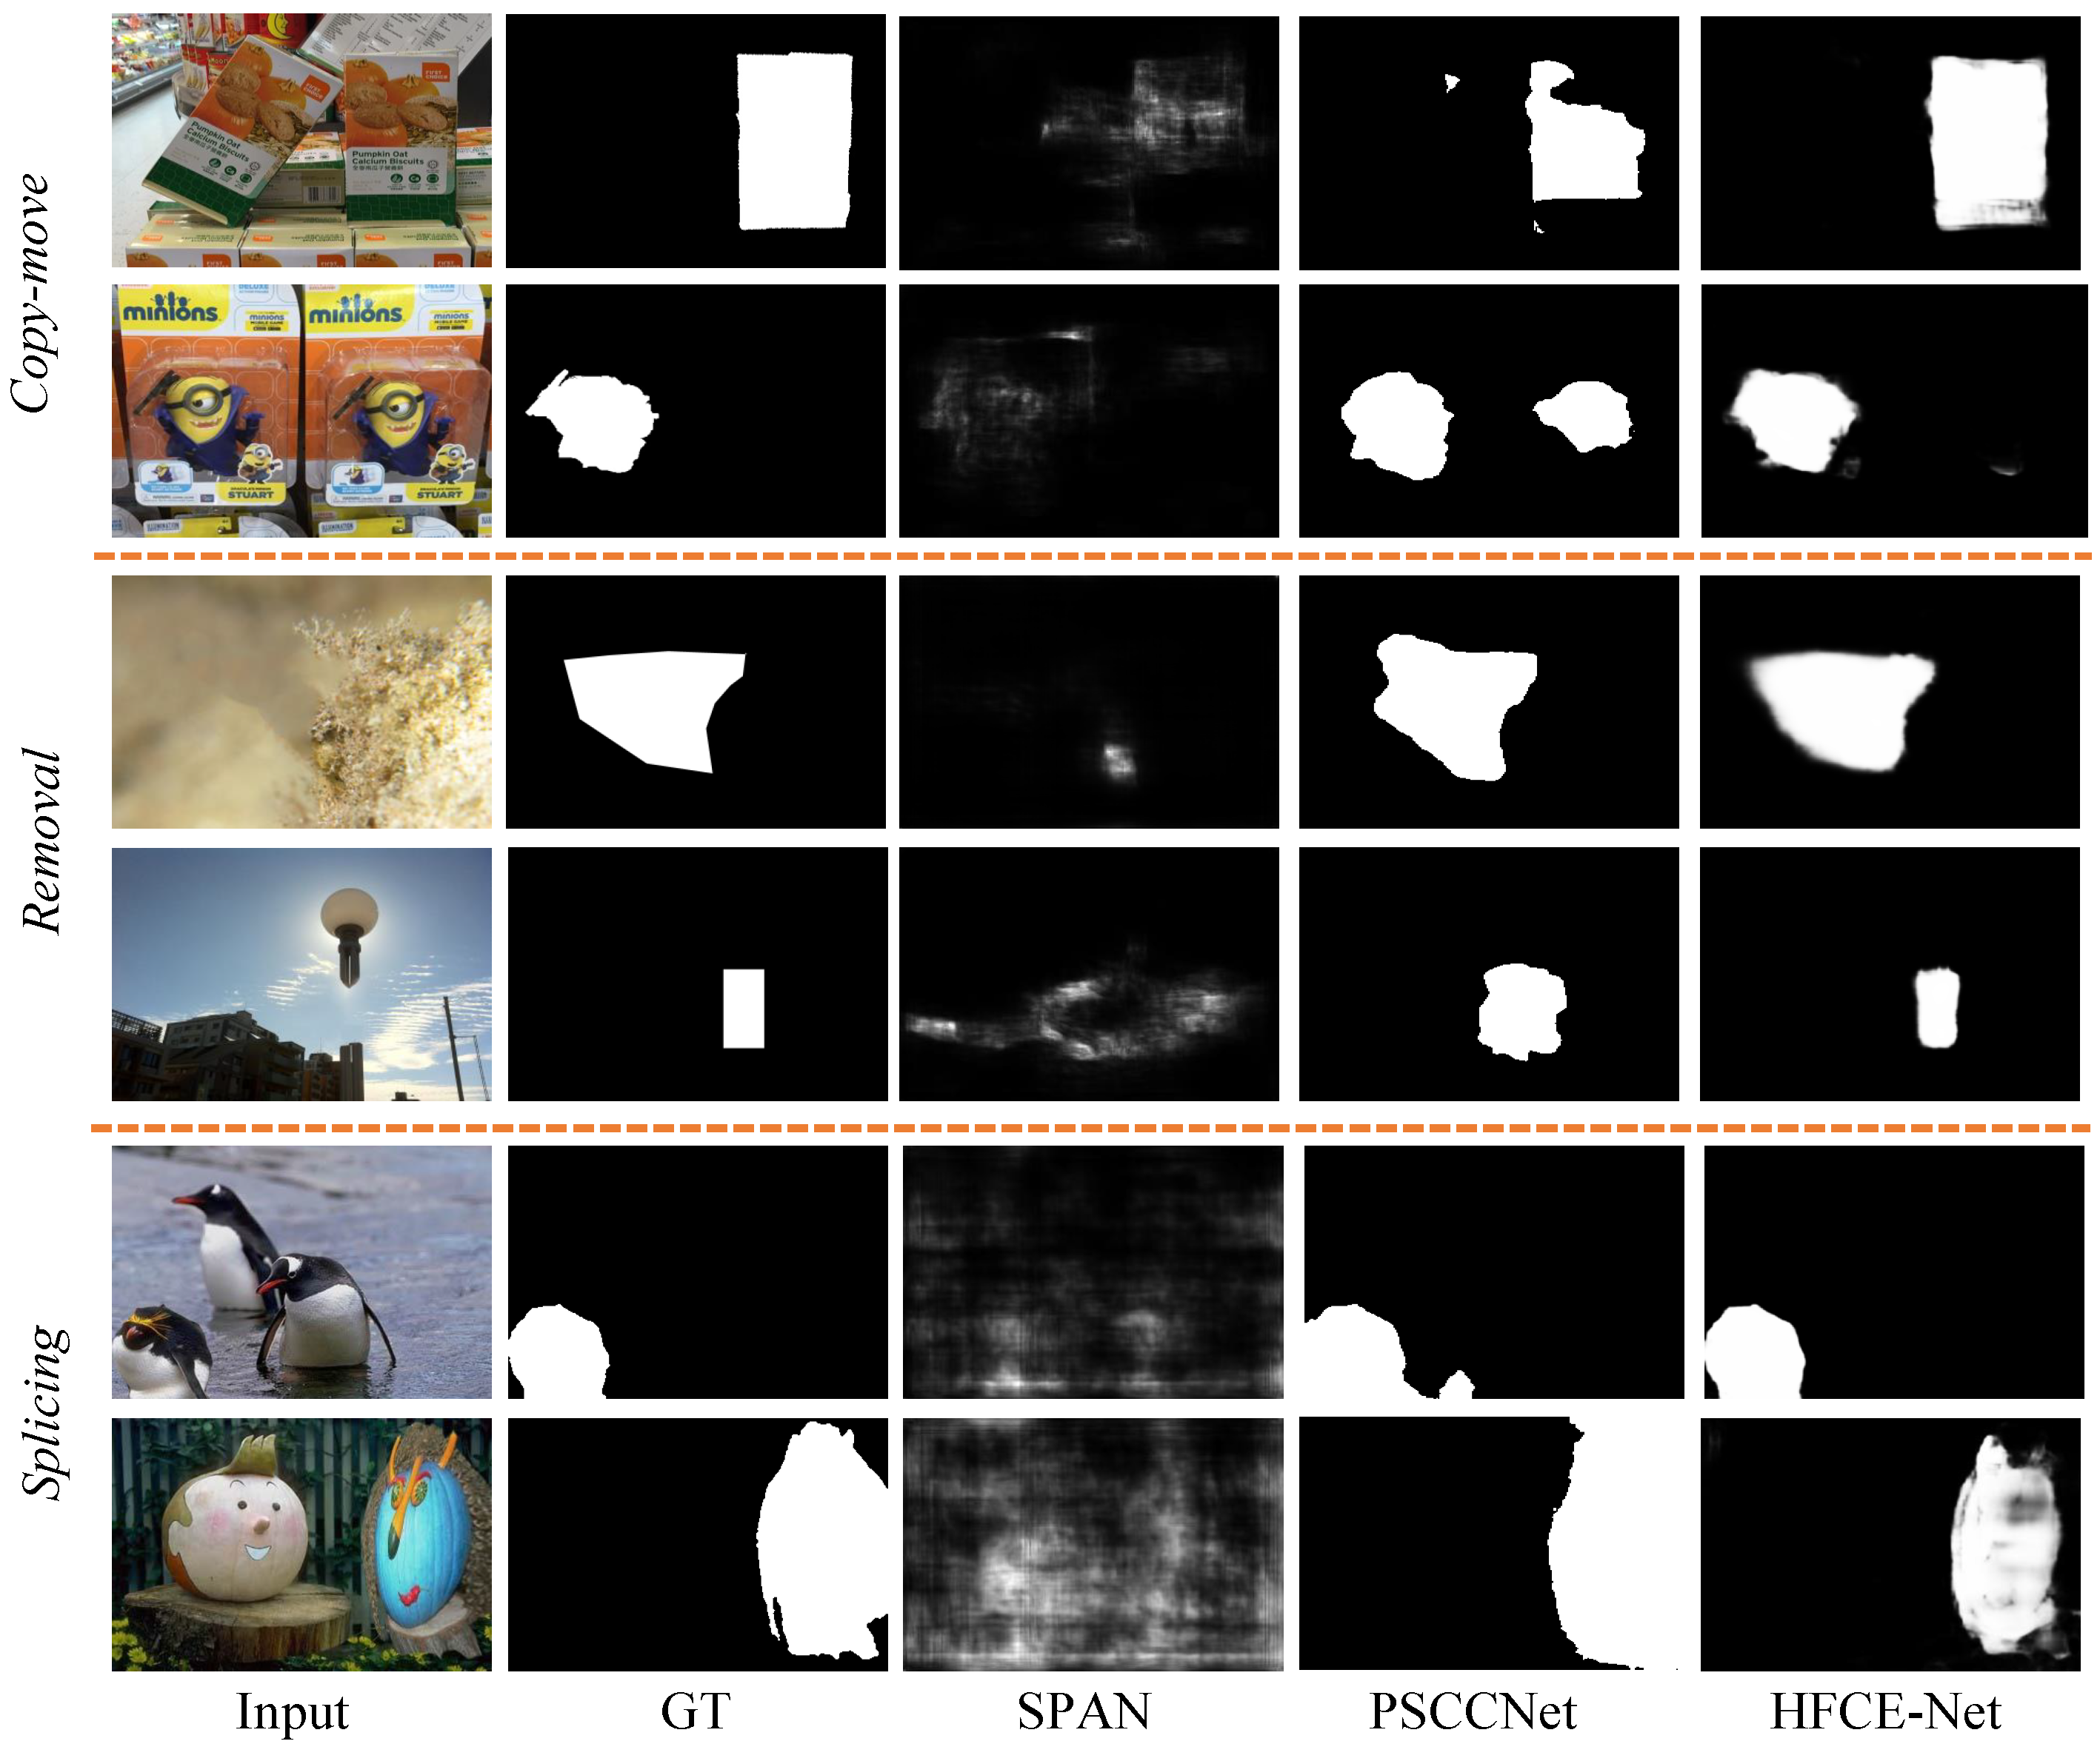
Qualitative results of compared with previous methods. In this section, we compare the qualitative results with previous IMD methods, including SPAN, and PSCCNet. The detection performance of three manipulation operations is shown in Figure 8. As shown in Figure 8, our model achieves better detection results of three manipulation operations than previous IMD methods on all three benchmarks, demonstrating the effectiveness of our method.
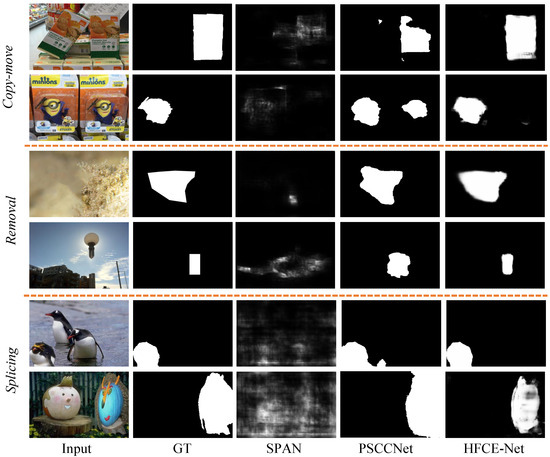
Figure 8.
Qualitative results compared with previous methods. From the first to the fifth column, we show the manipulated image, the ground truth mask (GT), the prediction of SPAN, the prediction of PSCCNet, and the prediction of our model.
Qualitative results of robustness. In this section, we show the qualitative results of the manipulated images under different attacks, including Gaussian Blurring with kernels , Gaussian Noise using different deviations , JPEG Compression with different quality factors , and the Resize image with different factors of 0.22, 0.5, and 0.78. The performance is shown in Figure 9. As shown in Figure 9, our model achieves satisfactory results while the image has been attacked.
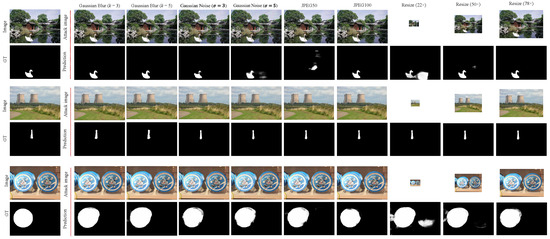
Figure 9.
Qualitative results of the robustness.
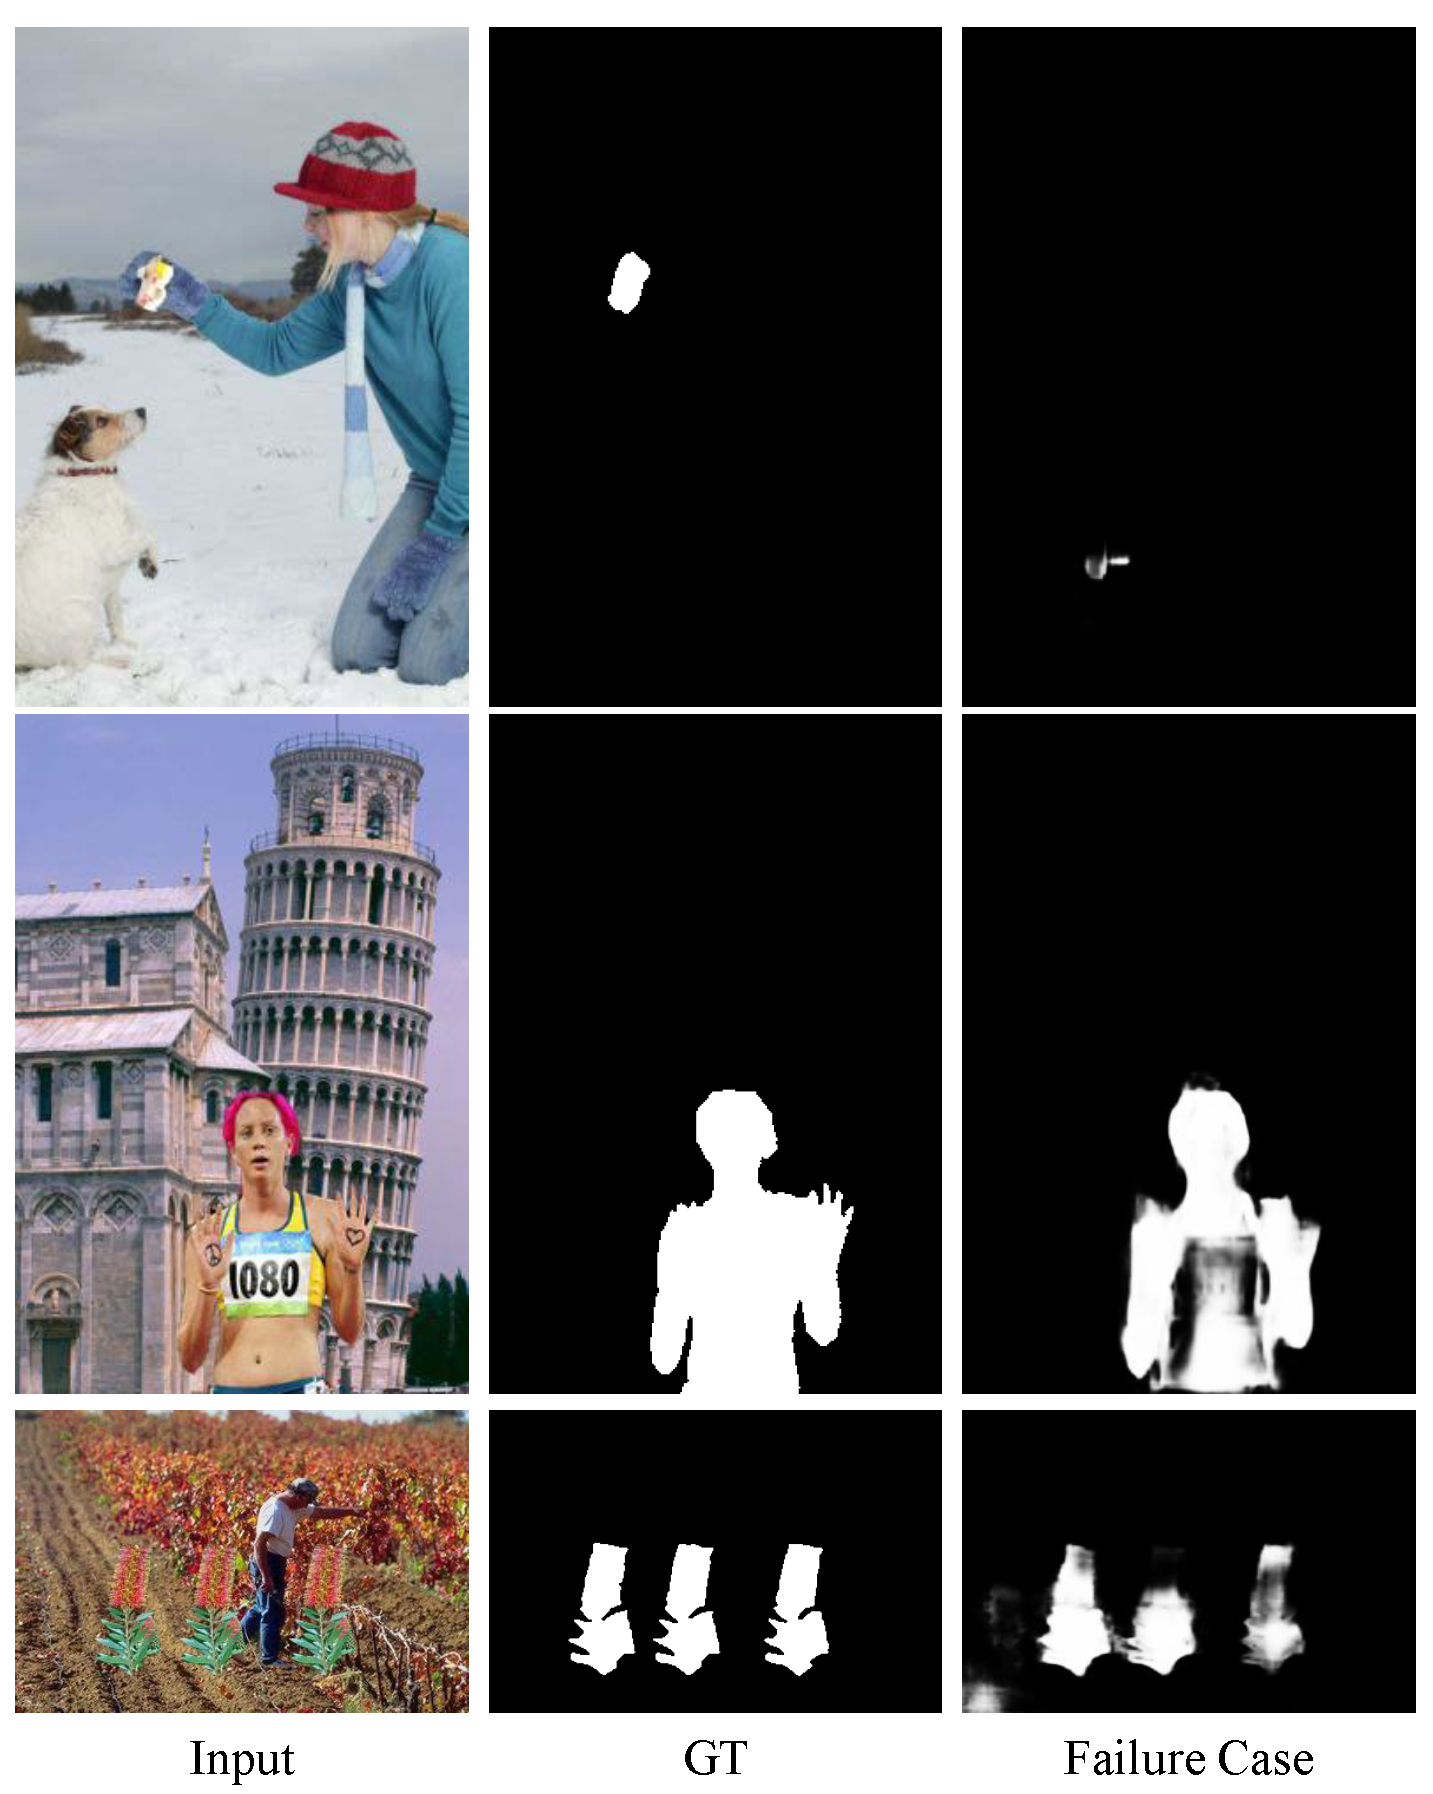
Limitation. We show some limitations of our method. As shown in Figure 10, there are some failure cases listed below: (1) It is difficult to detect the tiny area of manipulated regions, as shown in the first row of Figure 10. (2) Some detected manipulated regions are incomplete, as shown in the second row of Figure 10. (3) Suboptimal detection performance when detecting multiple manipulated regions within an image, as shown in the third row of Figure 10.

Figure 10.
Some limitations of our model. From the first to the fifth column, the manipulated image, the ground truth mask (GT), and some failure cases of our method.
In our future work, we aim to extend and apply the deep and involved networks to learn more powerful features to deal with these limitations.
6. Conclusions
In this paper, we proposed HFCE-Net, a network consisting of two branches, i.e., main stream and high-frequency auxiliary branch (HFAB), for image manipulation detection. Our key idea is to fully explore the high-frequency information within the manipulated image to locate the manipulated regions accurately. To achieve this goal, the HFAB branch of HFCE-Net adopts the Sobel filter to filter out the low-frequency information. Moreover, inspired by the previous method demonstrating that the edge of the manipulated regions contains extensive information, the HFAB is supervised with the edge information of the manipulated image. Furthermore, the HFAB feature, which contains high-frequency information, is fused with the main stream feature, which is learned from the RGB image by the d multi-layer fusion (MLF) in a hierarchical manner. The HFCE-Net, achieves 57.3%, 90.9%, and 73.8% F1 on CASIA, NIST, and Coverage datasets, respectively, which are 1.9%, 9.0%, and 1.5% better than the previous methods. The results demonstrate that our method can effectively learn powerful features to accurately locate tampered regions.
Author Contributions
Conceptualization, W.M.; Methodology, W.P.; Formal analysis, W.M. and W.L.; Investigation, X.W.; Writing—original draft, W.P.; Project administration, W.L. All authors have read and agreed to the published version of the manuscript.
Funding
This research was funded by National Natural Science Foundation of China, grant number 62202001.
Institutional Review Board Statement
Not applicable.
Informed Consent Statement
Not applicable.
Data Availability Statement
Data are contained within the article.
Conflicts of Interest
The authors declare that they have no known competing financial interests or personal relationships that could have appeared to influence the work reported in this paper.
References
- Zhou, P.; Han, X.; Morariu, V.I.; Davis, L.S. Learning rich features for image manipulation detection. In Proceedings of the IEEE Conference on Computer Vision and Pattern Recognition, Salt Lake City, UT, USA, 18–23 June 2018; pp. 1053–1061. [Google Scholar]
- Bayar, B.; Stamm, M.C. Constrained convolutional neural networks: A new approach towards general purpose image manipulation detection. IEEE Trans. Inf. Forensics Secur. 2018, 13, 2691–2706. [Google Scholar] [CrossRef]
- Wu, Y.; AbdAlmageed, W.; Natarajan, P. Mantra-net: Manipulation tracing network for detection and localization of image forgeries with anomalous features. In Proceedings of the IEEE/CVF Conference on Computer Vision and Pattern Recognition, Long Beach, CA, USA, 15–20 June 2019; pp. 9543–9552. [Google Scholar]
- Zhou, P.; Chen, B.C.; Han, X.; Najibi, M.; Shrivastava, A.; Lim, S.N.; Davis, L. Generate, segment, and refine: Towards generic manipulation segmentation. In Proceedings of the AAAI Conference on Artificial Intelligence, New York, NY, USA, 7–12 February 2020; Volume 34, pp. 13058–13065. [Google Scholar]
- Chen, X.; Dong, C.; Ji, J.; Cao, J.; Li, X. Image manipulation detection by multi-view multi-scale supervision. In Proceedings of the IEEE/CVF International Conference on Computer Vision, Montreal, BC, Canada, 11–17 October 2021; pp. 14185–14193. [Google Scholar]
- Wang, J.; Wu, Z.; Chen, J.; Han, X.; Shrivastava, A.; Lim, S.N.; Jiang, Y.G. Objectformer for image manipulation detection and localization. In Proceedings of the IEEE/CVF Conference on Computer Vision and Pattern Recognition, New Orleans, LA, USA, 18–24 June 2022; pp. 2364–2373. [Google Scholar]
- Hu, X.; Zhang, Z.; Jiang, Z.; Chaudhuri, S.; Yang, Z.; Nevatia, R. SPAN: Spatial pyramid attention network for image manipulation localization. In Proceedings of the Computer Vision–ECCV 2020: 16th European Conference, Glasgow, UK, 23–28 August 2020; Proceedings, Part XXI 16. pp. 312–328. [Google Scholar]
- Wu, H.; Zhou, J. IID-Net: Image inpainting detection network via neural architecture search and attention. IEEE Trans. Circuits Syst. Video Technol. 2021, 32, 1172–1185. [Google Scholar] [CrossRef]
- Zhang, Y.; Zhu, G.; Wang, X.; Luo, X.; Zhou, Y.; Zhang, H.; Wu, L. CNN-Transformer Based Generative Adversarial Network for Copy-Move Source/Target Distinguishment. IEEE Trans. Circuits Syst. Video Technol. 2022, 33, 2019–2032. [Google Scholar] [CrossRef]
- Li, C.; Ma, Q.; Xiao, L.; Li, M.; Zhang, A. Image splicing detection based on Markov features in QDCT domain. Neurocomputing 2017, 228, 29–36. [Google Scholar] [CrossRef]
- Jaiprakash, S.P.; Desai, M.B.; Prakash, C.S.; Mistry, V.H.; Radadiya, K.L. Low dimensional DCT and DWT feature based model for detection of image splicing and copy-move forgery. Multimed. Tools Appl. 2020, 79, 29977–30005. [Google Scholar] [CrossRef]
- Popescu, A.C.; Farid, H. Exposing digital forgeries in color filter array interpolated images. IEEE Trans. Signal Process. 2005, 53, 3948–3959. [Google Scholar] [CrossRef]
- Liu, X.; Liu, Y.; Chen, J.; Liu, X. PSCC-Net: Progressive spatio-channel correlation network for image manipulation detection and localization. IEEE Trans. Circuits Syst. Video Technol. 2022, 32, 7505–7517. [Google Scholar] [CrossRef]
- Li, F.; Wu, Y.; Bai, H.; Lin, W.; Cong, R.; Zhao, Y. Learning Detail-Structure Alternative Optimization for Blind Super-Resolution. IEEE Trans. Multimed. 2023, 25, 2825–2838. [Google Scholar] [CrossRef]
- Zhao, S.; Hu, M.; Cai, Z.; Liu, F. Dynamic Modeling Cross-Modal Interactions in Two-Phase Prediction for Entity-Relation Extraction. IEEE Trans. Neural Netw. Learn. Syst. 2023, 34, 1122–1131. [Google Scholar] [CrossRef] [PubMed]
- Zhao, S.; Wang, C.; Hu, M.; Yan, T.; Wang, M. MCL: Multi-granularity contrastive learning framework for Chinese NER. In Proceedings of the AAAI Conference on Artificial Intelligence, Washington, DC, USA, 7–14 February 2023; Volume 37, pp. 14011–14019. [Google Scholar]
- Ma, W.; Wu, X.; Zhao, S.; Zhou, T.; Guo, D.; Gu, L.; Cai, Z.; Wang, M. FedSH: Towards Privacy-preserving Text-based Person Re-Identification. IEEE Trans. Multimed. 2023. [Google Scholar] [CrossRef]
- Ma, W.; Chen, Q.; Zhou, T.; Zhao, S.; Cai, Z. Using Multimodal Contrastive Knowledge Distillation for Video-Text Retrieval. IEEE Trans. Circuits Syst. Video Technol. 2023, 33, 5486–5497. [Google Scholar] [CrossRef]
- Ma, W.; Chen, Q.; Liu, F.; Zhou, T.; Cai, Z. Query-adaptive late fusion for hierarchical fine-grained video-text retrieval. IEEE Trans. Neural Netw. Learn. Syst. 2022. [Google Scholar] [CrossRef] [PubMed]
- Fridrich, J.; Kodovsky, J. Rich models for steganalysis of digital images. IEEE Trans. Inf. Forensics Secur. 2012, 7, 868–882. [Google Scholar] [CrossRef]
- Sobel, I.E. Camera Models and Machine Perception. Ph.D. Thesis, Stanford University, Stanford, CA, USA, 1970. [Google Scholar]
- Canny, J. A computational approach to edge detection. IEEE Trans. Pattern Anal. Mach. Intell. 1986, 6, 679–698. [Google Scholar] [CrossRef]
- Bertasius, G.; Shi, J.; Torresani, L. Deepedge: A multi-scale bifurcated deep network for top-down contour detection. In Proceedings of the IEEE Conference on Computer Vision and Pattern Recognition, Boston, MA, USA, 7–12 June 2015; pp. 4380–4389. [Google Scholar]
- He, J.; Zhang, S.; Yang, M.; Shan, Y.; Huang, T. Bi-directional cascade network for perceptual edge detection. In Proceedings of the IEEE/CVF Conference on Computer Vision and Pattern Recognition, Long Beach, CA, USA, 15–20 June 2019; pp. 3828–3837. [Google Scholar]
- Liu, Y.; Cheng, M.M.; Hu, X.; Wang, K.; Bai, X. Richer convolutional features for edge detection. In Proceedings of the IEEE Conference on Computer Vision and Pattern Recognition, Honolulu, HI, USA, 21–26 July 2017; pp. 3000–3009. [Google Scholar]
- Zhao, H.; Shi, J.; Qi, X.; Wang, X.; Jia, J. Pyramid scene parsing network. In Proceedings of the IEEE Conference on Computer Vision and Pattern Recognition, Honolulu, HI, USA, 21–26 July 2017; pp. 2881–2890. [Google Scholar]
- Chen, L.C.; Papandreou, G.; Kokkinos, I.; Murphy, K.; Yuille, A.L. Deeplab: Semantic image segmentation with deep convolutional nets, atrous convolution, and fully connected crfs. IEEE Trans. Pattern Anal. Mach. Intell. 2017, 40, 834–848. [Google Scholar] [CrossRef]
- Chen, L.C.; Yang, Y.; Wang, J.; Xu, W.; Yuille, A.L. Attention to scale: Scale-aware semantic image segmentation. In Proceedings of the IEEE Conference on Computer Vision and Pattern Recognition, Las Vegas, NV, USA, 27–30 June 2016; pp. 3640–3649. [Google Scholar]
- Guo, C.; Fan, B.; Zhang, Q.; Xiang, S.; Pan, C. Augfpn: Improving multi-scale feature learning for object detection. In Proceedings of the IEEE/CVF Conference on Computer Vision and Pattern Recognition, Seattle, WA, USA, 13–19 June 2020; pp. 12595–12604. [Google Scholar]
- Lin, T.Y.; Dollár, P.; Girshick, R.; He, K.; Hariharan, B.; Belongie, S. Feature pyramid networks for object detection. In Proceedings of the IEEE Conference on Computer Vision and Pattern Recognition, Honolulu, HI, USA, 21–27 July 2017; pp. 2117–2125. [Google Scholar]
- Xie, E.; Wang, W.; Yu, Z.; Anandkumar, A.; Alvarez, J.M.; Luo, P. SegFormer: Simple and efficient design for semantic segmentation with transformers. Adv. Neural Inf. Process. Syst. 2021, 34, 12077–12090. [Google Scholar]
- Zhou, Z.; Siddiquee, M.M.R.; Tajbakhsh, N.; Liang, J. Unet++: Redesigning skip connections to exploit multiscale features in image segmentation. IEEE Trans. Med Imaging 2019, 39, 1856–1867. [Google Scholar] [CrossRef] [PubMed]
- Bappy, J.H.; Roy-Chowdhury, A.K.; Bunk, J.; Nataraj, L.; Manjunath, B. Exploiting spatial structure for localizing manipulated image regions. In Proceedings of the IEEE International Conference on Computer Vision, Venice, Italy, 22–29 October 2017; pp. 4970–4979. [Google Scholar]
- Bappy, J.H.; Simons, C.; Nataraj, L.; Manjunath, B.; Roy-Chowdhury, A.K. Hybrid lstm and encoder–decoder architecture for detection of image forgeries. IEEE Trans. Image Process. 2019, 28, 3286–3300. [Google Scholar] [CrossRef] [PubMed]


Disclaimer/Publisher’s Note: The statements, opinions and data contained in all publications are solely those of the individual author(s) and contributor(s) and not of MDPI and/or the editor(s). MDPI and/or the editor(s) disclaim responsibility for any injury to people or property resulting from any ideas, methods, instructions or products referred to in the content. |
© 2024 by the authors. Licensee MDPI, Basel, Switzerland. This article is an open access article distributed under the terms and conditions of the Creative Commons Attribution (CC BY) license (https://creativecommons.org/licenses/by/4.0/).