Abstract
The trade, control, and management of transactive energy have gained significant relevance and are receiving a lot of interest from academia and industry. New strategies for their progress and implementation are emerging. The prosumer concept involves the integration of household loads with solar PV and battery storage systems. It is suggested as a practical technique to include renewable energy sources and reduce strain on the distribution grid. This study indicates establishing a home-smart community connected to a power grid, explicitly emphasizing prosumers. The district employs cooperative game theory to enable the sharing, controlling, and coordinating of excess energy generated by distributed energy resources (DERs) with neighboring prosumers experiencing energy shortages. The energy community examined in this study comprises six identical prosumers, encompassing residential energy use, solar photovoltaic (PV) installations, and battery storage systems. Furthermore, the community consists of an energy community manager and an energy retailer, both tied to a distribution system. The intended market model assesses the economic advantages of incorporating renewable sources into a centralized transactive energy trading system This approach reduces transaction costs and power expenditures, offering cost savings to producers and consumers. The results show that the suggested intelligent method has successfully decreased consumer electricity costs in various circumstances. Indeed, the proposed approach seeks to oversee the exchange, organization, and control of the community’s household electricity consumption effectively. Furthermore, its objective is to diminish energy usage, enhance system effectiveness, and minimize operational strain and carbon emissions.
1. Introduction
1.1. Motivation and Background
The Smart Grid 2.0 (SG 2.0) is being considered for research by industry and academics. SG 2.0 utilizes advanced sensors, communications, and control technologies to optimize power production, delivery, and usage [1]. SG 2.0 enhances dependability and minimizes operational disruptions for businesses and households by autonomously detecting and resolving problems. Implementing waste reduction strategies and maximizing renewable energy sources can significantly improve energy efficiency in intelligent networks [2]. Implementing cutting-edge grid technology is crucial for enhancing the efficiency and effectiveness of power generation, distribution, and utilization [3]. The advancement grants authority to stakeholders and clients yet introduces fresh obstacles for energy system administration, specifically in the distribution of energy networks. Multiple specialized periodicals monitor intelligent grid technology and infrastructure [4]. The smart grid’s intelligence and connectivity enable automatic energy transfers, facilitating the coordination of distributed judgments through transactional energy. Based on [5], multiple research projects have incorporated local market transactions and reactive energy enhancements into establishing local energy markets using SG 2.0 infrastructure.
Decentralized energy sources and local grids have the potential to decrease energy consumption in SG 2.0. SG 2.0 technologies prioritize utilizing decentralized energy sources and local grids to minimize energy consumption. The growing electricity demand is what drives infrastructure operators. Incorporating energy conversion and emerging technologies enhances the autonomy and efficiency of smart grids. The prompt and effective evaluation of energy, resource administration, distribution, and interchange has resulted in many inventive products. The phrase “energy prosumer” denotes generating energy [6]. Hence, the network and load requirements must be highly responsive [7]. Renewable energy sources and demand response (DR) are primarily utilized in microgrids and individual residences. Solar panels and storage devices serve as alternative power sources and fulfill the energy requirements of the local community. The storage system controls the output of the PV grid to decrease peak demand and enhance grid efficiency [8]. Several organizations employ advertising strategies emphasizing reduced energy expenses and providing monetary incentives to entice new customers. Electricity retailers have multiple installation choices at their disposal to fulfill client requirements. The deregulation of the retail energy sector has fostered competition, resulting in the emergence of numerous new companies. Mass-market enterprises can effectively recruit and retain clients by implementing competitive strategies [9].
Experts agree that the electrical system has a finite capacity to accommodate intermittent renewable energy sources using Smart System 2.0. This contemporary system digitalizes power grids, enabling communication between electricity providers and consumers. A practical and enduring energy plan depends on incorporating various methods, as is widely recognized. Customers and their families should be encouraged to adopt intelligent energy systems [10]. The primary objective of policy drafting is to empower consumers to authorize new policies and public spending [11]. The “Clean Energy Package for All Europeans” provides a concise overview of the existing legislation governing the restructuring of the electrical sector in Europe. According to the European Commission [12], the proposed bill seeks to promote the involvement of energy users in the energy transition by ensuring that everyone has access to decentralized, digital, and sustainable energy systems.
1.2. Related Works and Contributions
Peer-to-peer (P2P) markets have garnered attention from businesses and academic institutions, making them an exciting subject for scholarly investigation. Academic research has primarily examined distributed, decentralized, and centralized market structures to understand peer-to-peer marketplaces. These concepts include community, collective, and hybrid peer-to-peer marketplaces.
In [13,14], the authors indicate that P2P networks lack hierarchy and centralization. All statements are objective and unbiased. Additionally, all nodes have the same operating system because each node functions as a client and a server, unlike in a client–server design. In [15,16], the authors indicate that the behavior observed in P2P networks results from one node’s ability to make requests and receive responses from another node. P2P networks create a virtual overlay on top of the physical network. User engagement is crucial for decentralized P2P networks. The authors recommend implementing a logical overlay communication system for peers.
Distribution, information, and communication technologies (ICT) have modified the structure and operation of community microgrids [17]. Users of community microgrids act as prosumers, engaging in the production, consumption, and storage of energy. Peer-to-peer energy exchange can benefit market resource allocation, microgrid power balancing, utility transmission demand, and communication line extension. In [18], the authors mentioned that energy storage system dispatchers may charge less than customers due to economies of scale. Energy-centric utility services can help customers reduce energy storage and distribution costs. Microgrids, which operate on a consumer–prosumer paradigm, have the potential to improve energy balance and increase the use of renewable energy for self-consumption. Service providers can shift high levels of demand to times when demand is lower, which helps to stabilize the system [19]. A peer-to-peer energy-balancing service provider can enhance the distribution of energy resources. Private firms equipped with energy storage or high-capacity generators can provide emergency electricity. In [20], the authors examine successful legal business strategies for the energy system and market pursued by P2P. The researchers analyzed P2P energy market pricing, and the writers stated that P2P will actively seek economically viable energy solutions and employ legitimate commercial strategies in the market. A technique has been created for managing energy resources that focus on prosumers and optimizes itself. In their analysis in [21], the authors examine the marginal cost of selling energy and the marginal profit of purchasing power.
Maximizing a business plan’s price acceptance index can enhance energy trading’s revenue. In [22], the authors present a detailed analysis of the distributed double gradient algorithm used for peer-to-peer energy trading. This algorithm aims to reach a point where resources are evenly distributed quickly. It plans to use a multiple-commodity flow approach and a two-step (sub)gradient procedure to help consumers worldwide.
Technical terms are defined when first used, and the language is clear, objective, and free from subjective judgment. The text follows a conventional structure and uses a formal register, employing consistent technical terminology and precise vocabulary. In [23], the authors introduce a multi-objective approach to energy resource planning and pricing, which ensures that energy trading reduces energy costs and minimizes transmission losses within microgrids for all consumers. The authors employ a pricing model with three tiers for intermittent generation and price volatility [24]. Time-series forecasting algorithms are used to establish energy-balancing market prices. Energy supply and demand, trade preferences, and energy production and consumption all play a role in determining the predicted price for each historical scenario. Through aggregation, the mean cost of each design is determined [25].
The data indicates the existence of two primary schools of thought. Community microgrids are incompatible with game-theoretic microgrids due to the requirement for extensive consumer knowledge. This is because autonomous prosumers may be unwilling to share their personal information. Participants in peer-to-peer energy markets voluntarily engage in a highly competitive market and accept the pricing it establishes. The distribution and transportation of energy supplies are crucial, particularly given the expected market prices. Market power can affect the equilibrium of the peer-to-peer (P2P) market.
To optimize P2P equilibria and business strategies, the concept incorporates an enhanced confidence region methodology and algorithm. The case study shows that the proposed approach can potentially increase profits for prosumers and customers, reduce prosumer energy dispatch costs, and facilitate the use of renewable energy during off-peak hours to shift peak loads to microgrids. This article explores the potential of real-time pricing (RTP), consumer demand, and the portability of distributed generators (DGs) and storage devices to address issues related to scheduling thermal and electric appliances. The statement suggests that implementing an intelligent supply strategy in peer-to-peer trading can reduce grid usage and electricity costs without compromising comfort. The use of deep learning can benefit both consumers and prosumers. The study is divided into two phases.
During the initial stage, consumers and prosumers coordinate the timing of appliance operations by utilizing demand response (DR). In the second stage, a peer-to-peer (P2P) trading platform is constructed to exchange excess electricity with nearby individuals. The inquiry analyzed batteries, electric vehicles (EVs), distributed generation (DG), and appliances that use real-time pricing (RTP). This programming methodology also ensures user convenience. Intelligent appliances can be classified into two categories: electrical control loads and thermal control loads. Previous studies have examined various peer-to-peer (P2P) energy exchange systems. This study investigates several elements, including price comparisons using Real-Time Pricing (RTP) and the supply–demand ratio. Table 1 shows that the proposed trade cost consistently remains below the network tariff.

Table 1.
Factors addressed in various P2P energy trade solutions.
A novel intelligent energy management system has been developed for smart homes that integrate solar energy with energy from battery storage devices. The aim is to decrease reliance on the power grid and enhance the system’s economic efficiency. The suggested system efficiently regulates and organizes the distribution of electricity among energy storage devices, grid power, and photovoltaics to meet the energy demands of the intelligent house. The power grid can absorb excess electricity from the designated system during periods of low demand. Conversely, it can supply power to the system during high demand. This allows users to generate additional income by selling surplus power. A comprehensive system simulation has been conducted, demonstrating this approach’s effectiveness in terms of energy allocation among various sources.
The paper presents a system that integrates demand response (DR) deployment with auction-based peer-to-peer (P2P) trading. Section 2 outlines the proposed approach, while Section 3 discusses the mathematical modeling and optimization algorithms for implementing demand response and peer-to-peer trading. Section 4 presents and examines the simulation findings acquired for the proposed system. Finally, Section 5 provides the conclusion.
2. Methodology
2.1. The Proposed Design
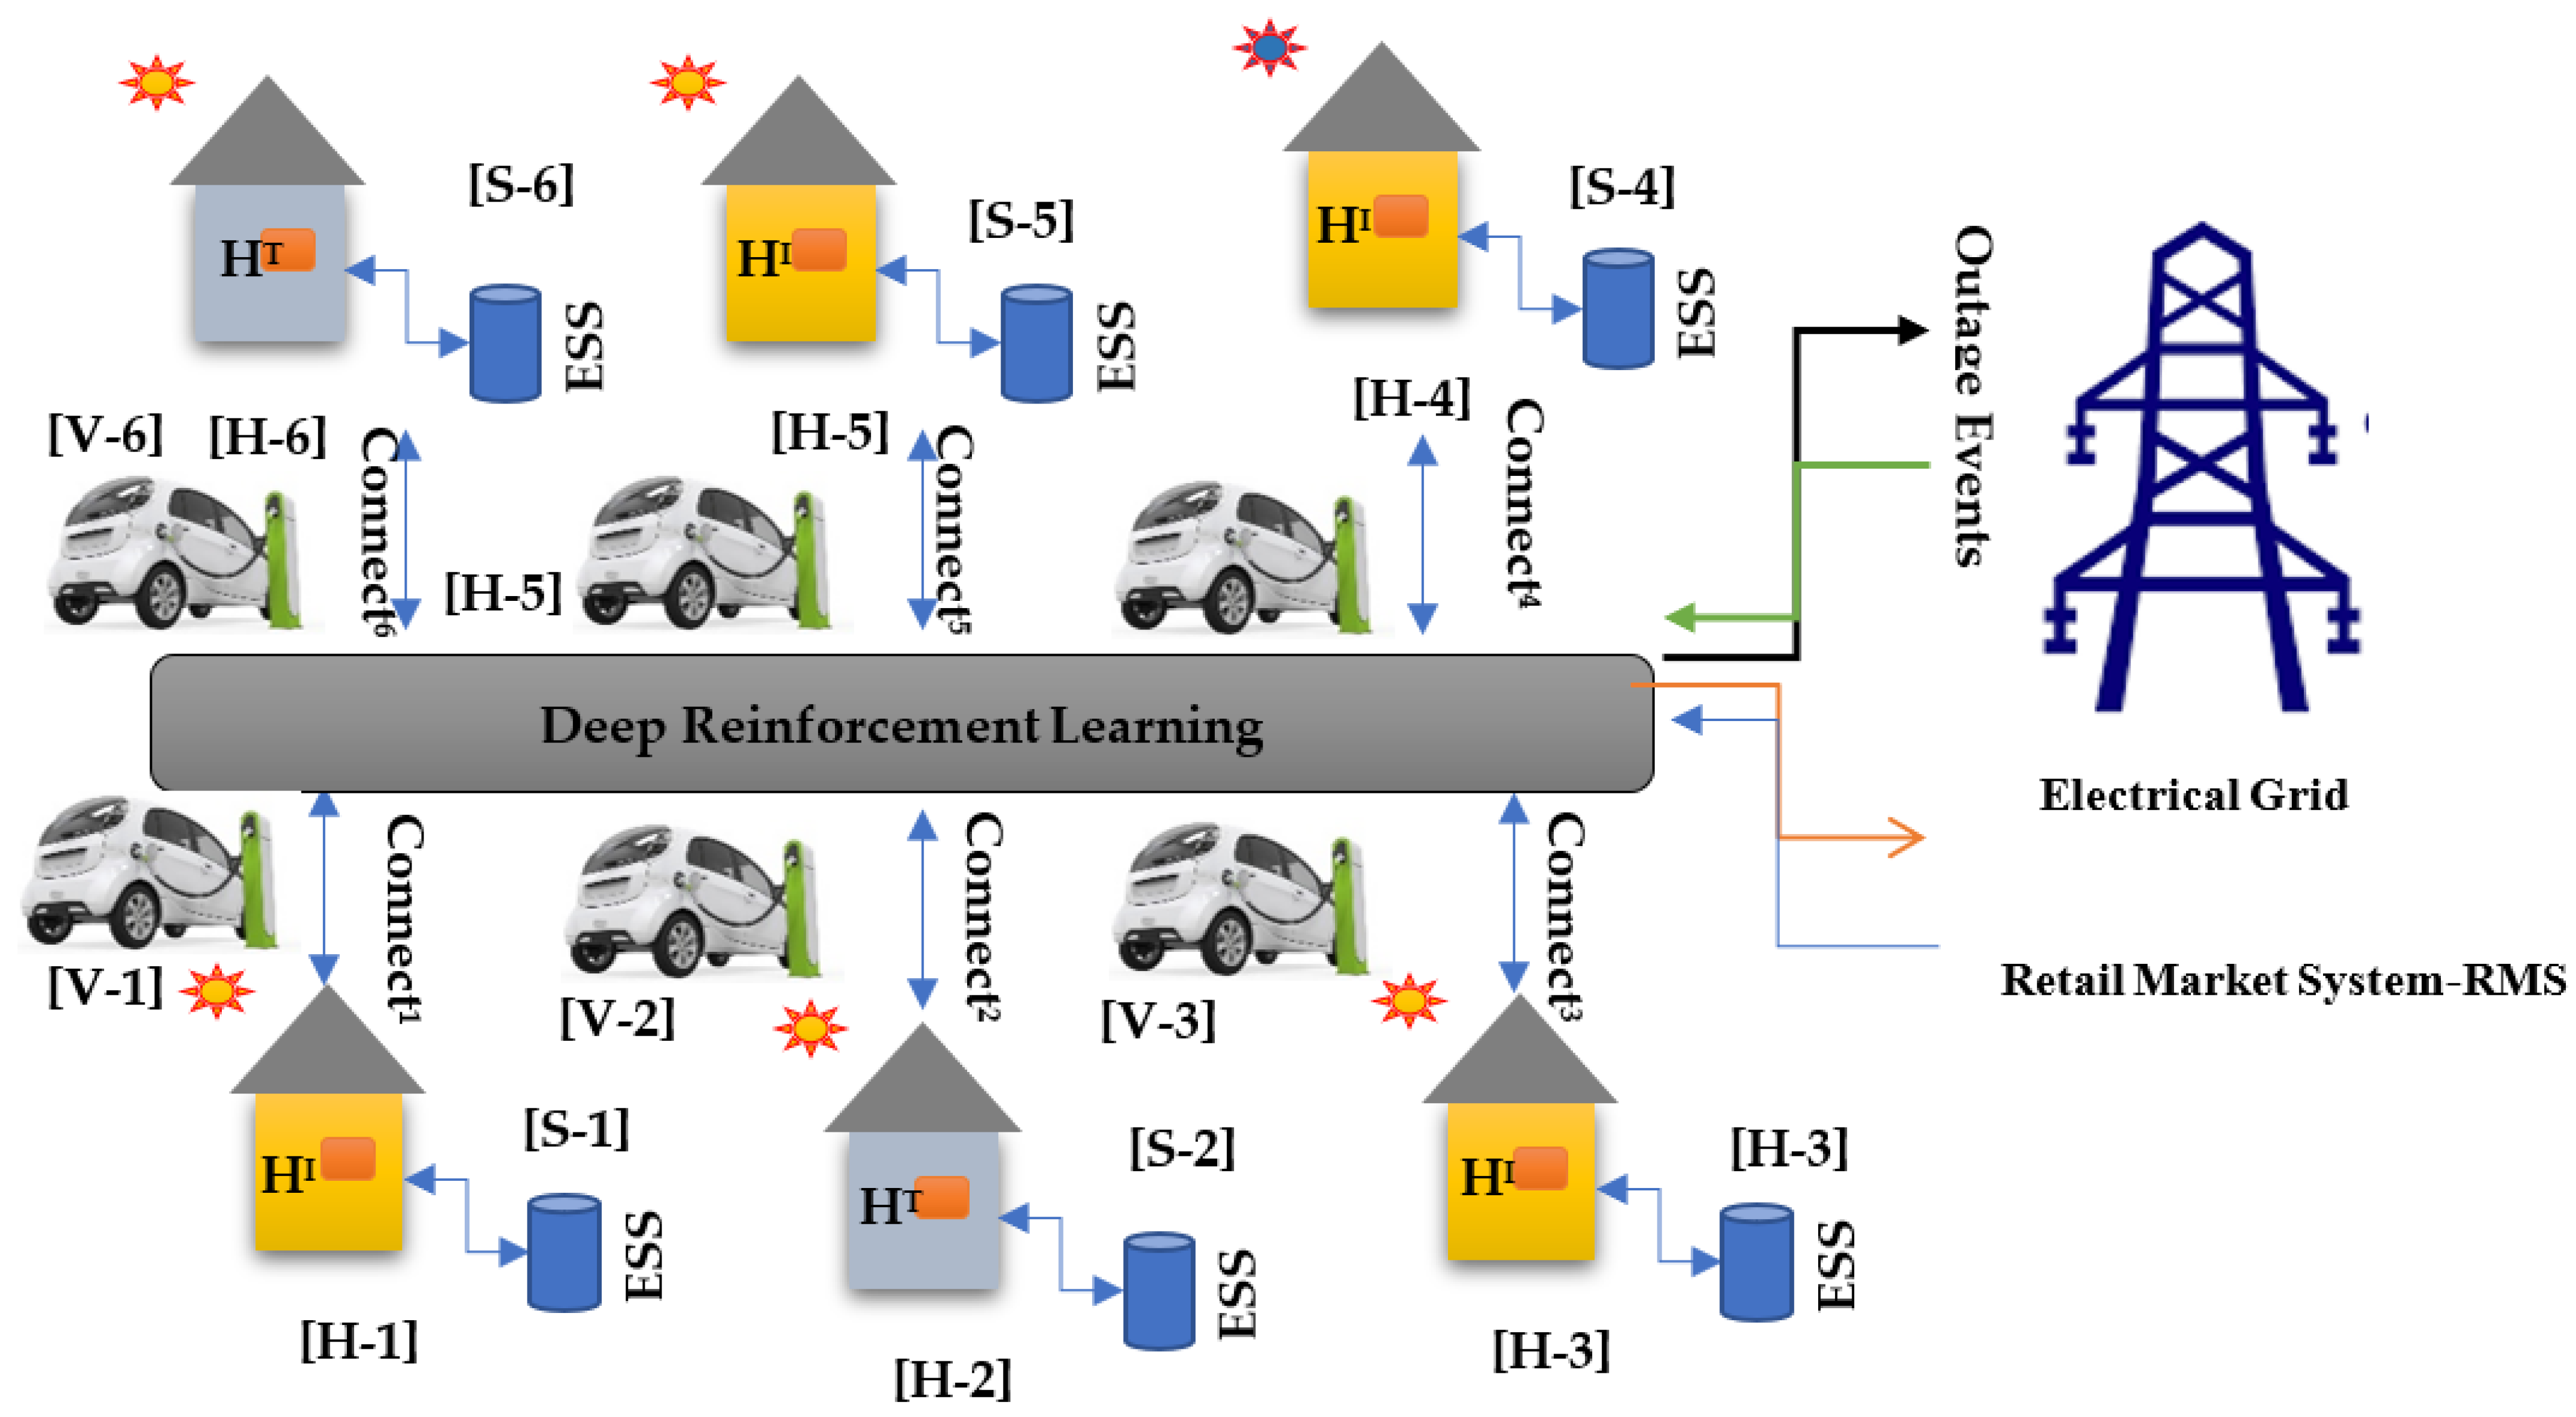
This section uses P2P to discuss how six households with different production and consumption profiles can function perfectly. Prosumers can actively engage in peer-to-peer trading and achieve energy savings, thereby optimizing the efficiency of the distribution network, as shown in Figure 1.
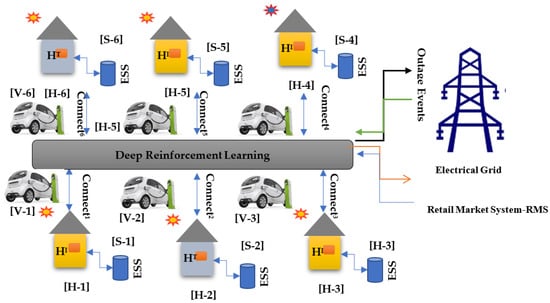
Figure 1.
Peer-to-peer energy system design.
The peer-to-peer market enables the sale of excess energy beyond local household consumption at the current market price for grid sales. During high-demand periods, the grid sets the price for electricity purchased from the distribution company. The P2P market structure facilitates reducing energy costs and improving social well-being by offering the most advantageous prices to local households. This study aims to improve the circumstances of six participants in four distinct situations. The model interface allows users to monitor and track expenses resulting from the model. The study examines the impact of different family dynamics on interconnected systems, including the use of home photovoltaic systems (PV), energy storage systems (ESSs), and electric vehicles (EVs) in both energy generation and consumption scenarios. Possible situations or events that could occur include consumers actively participating in the market by identifying the most economically efficient method to utilize the energy they generate and consume through this system. The cost of the exchange can be precisely computed using the suggested algorithm. The proposed intelligent exchange algorithms employ the double auction technique and take into account both consumers and providers.
2.2. Supply–Demand Correlation
2.2.1. Smart Bidding Approach
Using machine learning and intelligent buying techniques can improve the number of auction conversions. This strategy is called “bidding at auction time.” “Smart bidding” refers to systems that aim to obtain the highest possible expected price per conversion and cost per acquisition. Critical terms for the innovative bidding approach are supply–demand correlation (DSC), bid (B), and quote (Q). A bidding strategy adjusts ad bids based on the likelihood of a click and sale. Equation (1) is included to calculate direct support costs, bid and quote amounts, and transaction costs using the innovative procurement approach provided. Below is a preliminary calculation of the direct support cost related to the intelligent bidding strategy [26].
2.2.2. Bid and Quote
Smart bidding utilizes advanced optimization algorithms and artificial intelligence. These mathematical algorithms are trained on large amounts of data to improve their ability to predict the impact of bid levels on sales. Equation (2) determines the bid and quote for each home.
The proposed intelligent sourcing strategy calculates trading costs from prosumers to consumers based on SDC and RTP. The support cost is always lower than the RTP, reducing costs for both parties. The SDC (subsidy discount) strategy minimizes costs for prosumers and consumers, providing significant benefits for both parties [27]. Equation (3) calculates the transaction cost of P2P energy transferred between consumers [28].
2.3. Objective Function
The ultimate goal of the optimal algorithm for the P2P energy market is to have the most significant social impact by providing energy to all consumers at home at the most affordable price. To achieve this, a P2P supplier, marketer, energy storage system, or grid sells the energy it produces back to the system operator (DSO) and the market, with the costs associated with the purchase and sale appearing on the billing statement.
DR Implementation: Appliance Scheduling of Smart Homes
The objective function is a mathematical equation designed to maximize production benefits. The interrelated components determine the result, simultaneously making it a strategy for reaching financial and production targets. The aim is to keep the PV/BT cost of a detached home as low as possible during its lifespan (see Equations (4) and (5)) [29]. The objective functions of consumers (ID: 1 and ID: 6) and consumers (ID: from (2) to (4)) are as follows:
2.4. Single Home Case Study
2.4.1. PV System
The installation of an MPPT controller and a DC/DC converter in the PV module transforms the PV array into a variable energy source. The expression of the PV power generation on the roof of the house is as presented in Equations (6) and (7) [30].
2.4.2. Households Load Consumptions
The Household Load Consumption Agent is a geolocated tool that tracks a household’s total energy consumption based on appliance usage (e.g., lighting, heating, entertainment, cooking, etc.). The table below displays the average energy demand matrix for all devices. The energy demand matrixes for each appliance category are denoted as follows: movable appliances (J(a,s)), non-movable appliances J(a,n), and fixed appliances (J_(a,f)), as shown in Equation (8) [31].
Task 1: Turn on the home appliances (1 = ).
Task 2: Examine the deficit and excess rate using THA and SHA agent.
Task 3: Turn off THA home’s devices one by one, based on their importance, until the power is balanced (0 = ).
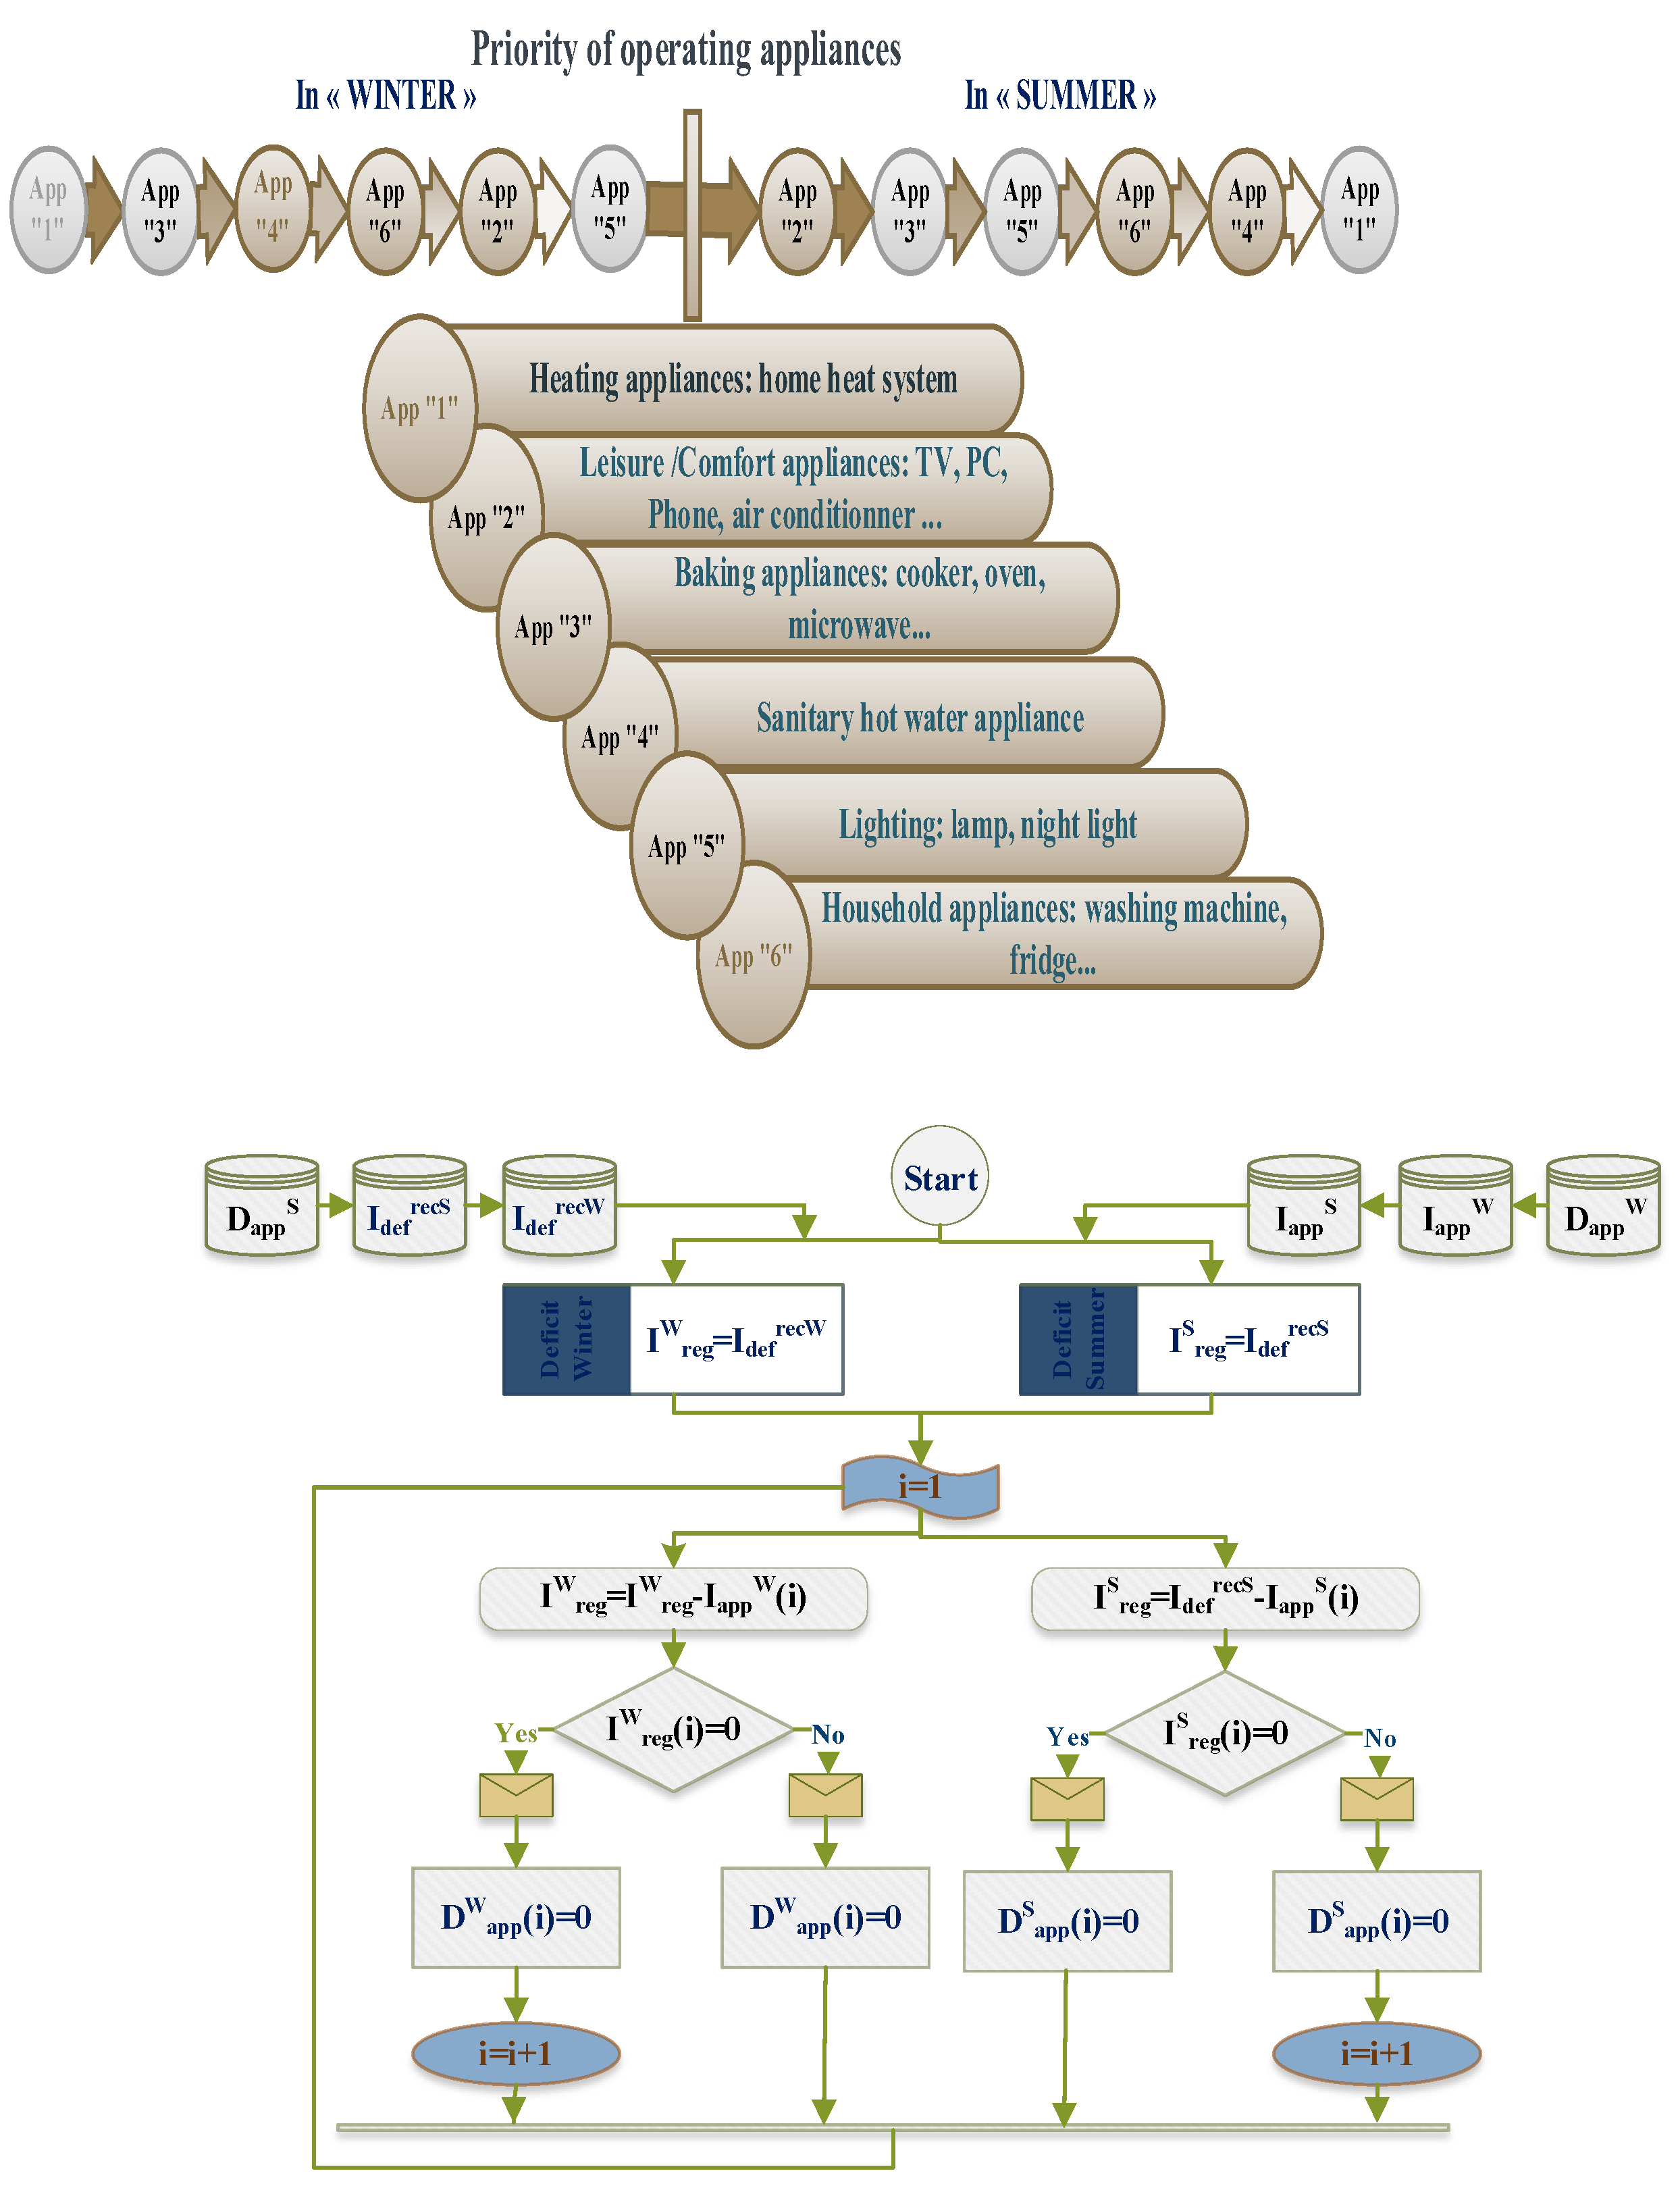
The system regulates the operation of home appliances to balance energy expenditure and production flows by considering the responsibilities outlined in Figure 2.
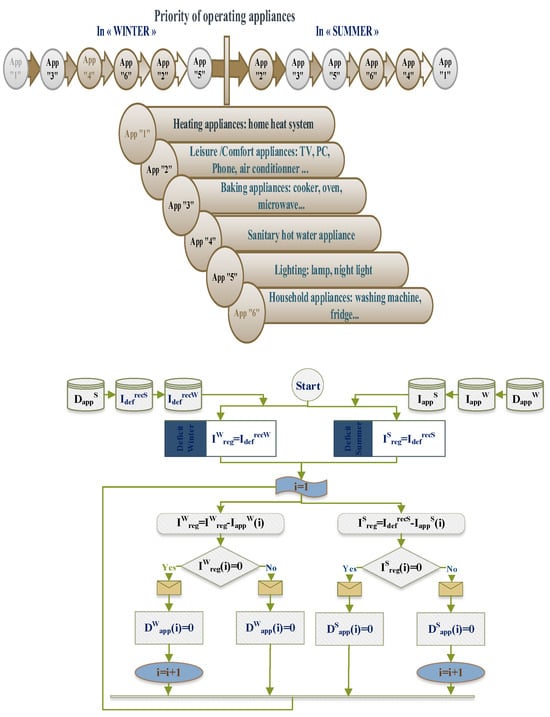
Figure 2.
Home Appliance-Operating Control.
2.4.3. Storage System
Equation (9) determines the maximum power output of the BT. The charging and discharging processes are mutually exclusive and cannot co-occur.
This equation also expresses the state of charge of the BT, which depends on the battery’s capacity and the discharge depth. Equation (9) pertains to the BT system and provides information on the initial and final charge states. In [32], the authors estimated the extra energy stored under normal operating conditions.
2.4.4. Potential Budget
The energy balance assesses the electricity consumption of the system. Electricity production and consumption vary according to the mode of operation. Electricity production and consumption are likely to change. Energy budgeting starts with identifying the largest energy consumers [33]. Users can influence the design of applications for the next generation of houses. The initial solution now includes the constraint (10). We will summarize the energy consumption. Homeowners’ budgets strongly influence the design of the smart home. Equation (10) reflects the limitations of this issue. According to the same equation, the initial project expenditure cannot exceed CIntialBudget.
2.4.5. Time-of-Use Tariff
Residential energy consumers are experiencing new pricing structures that electricity companies have implemented nationwide. Time-of-use (TOU) rates, sign-up fees, and real-time pricing encourage consumers to adjust their energy consumption patterns by encouraging use during low electricity cost periods and discouraging use during high electricity cost periods. Understanding the mechanics of time-of-use tariffs can help individuals effectively reduce their monthly energy expenditure. Time-of-use (TOU) pricing strategies vary from place to place. This study looks at the 2018 electricity prices in the province of Jeddah in the Kingdom of Saudi Arabia (KSA). It looks at the prices to buy electricity, shown as in Equation (11), and the costs to sell electricity, shown as , for businesses, industrial prosumers, and consumers, as shown in Equation (12). The time-of-use (TOU) price structure is presented as follows:
2.4.6. Energy Balance
Energy is subject to the law of conservation, which states that it cannot be created, destroyed, gained, or lost, according to the thermodynamic principle. To meet this requirement, the energy management system must be able to perform programming tasks on a low-cost device while the operating system remains operational. In [34], the authors stated that constraints (13) must be satisfied to ensure compliance with the requirements.
2.4.7. EV Constraints
Equation (14) shown the electric vehicle (EV) system governed by the restrictions provided, the transmission of power from the electric vehicle (EV) to the grid (V2G), he charge and discharge power as well as the state of energy.
3. Deep Reinforcement Learning Solution
The optimization problem presented involves continuous decision making among multiple agents. In this competition, participants, whether consumers or prosumers, make decisions about their energy exchange and load management tactics in an environment characterized by unpredictability and constant change. P2P and demand-side management (DSM) businesses within the energy sector create a marketplace characterized by the intermittent availability of public knowledge. Making accurate and reliable choices can be challenging. Model-free dynamic reinforcement learning is considered one of the most advanced approaches in machine learning [35]. The optimal method can be selected based on an individual’s prior academic training or experiential background. Firstly, the structure of the DSM model will be modified to include the DSM and peer-to-peer energy transaction issues examined in the DRL design.
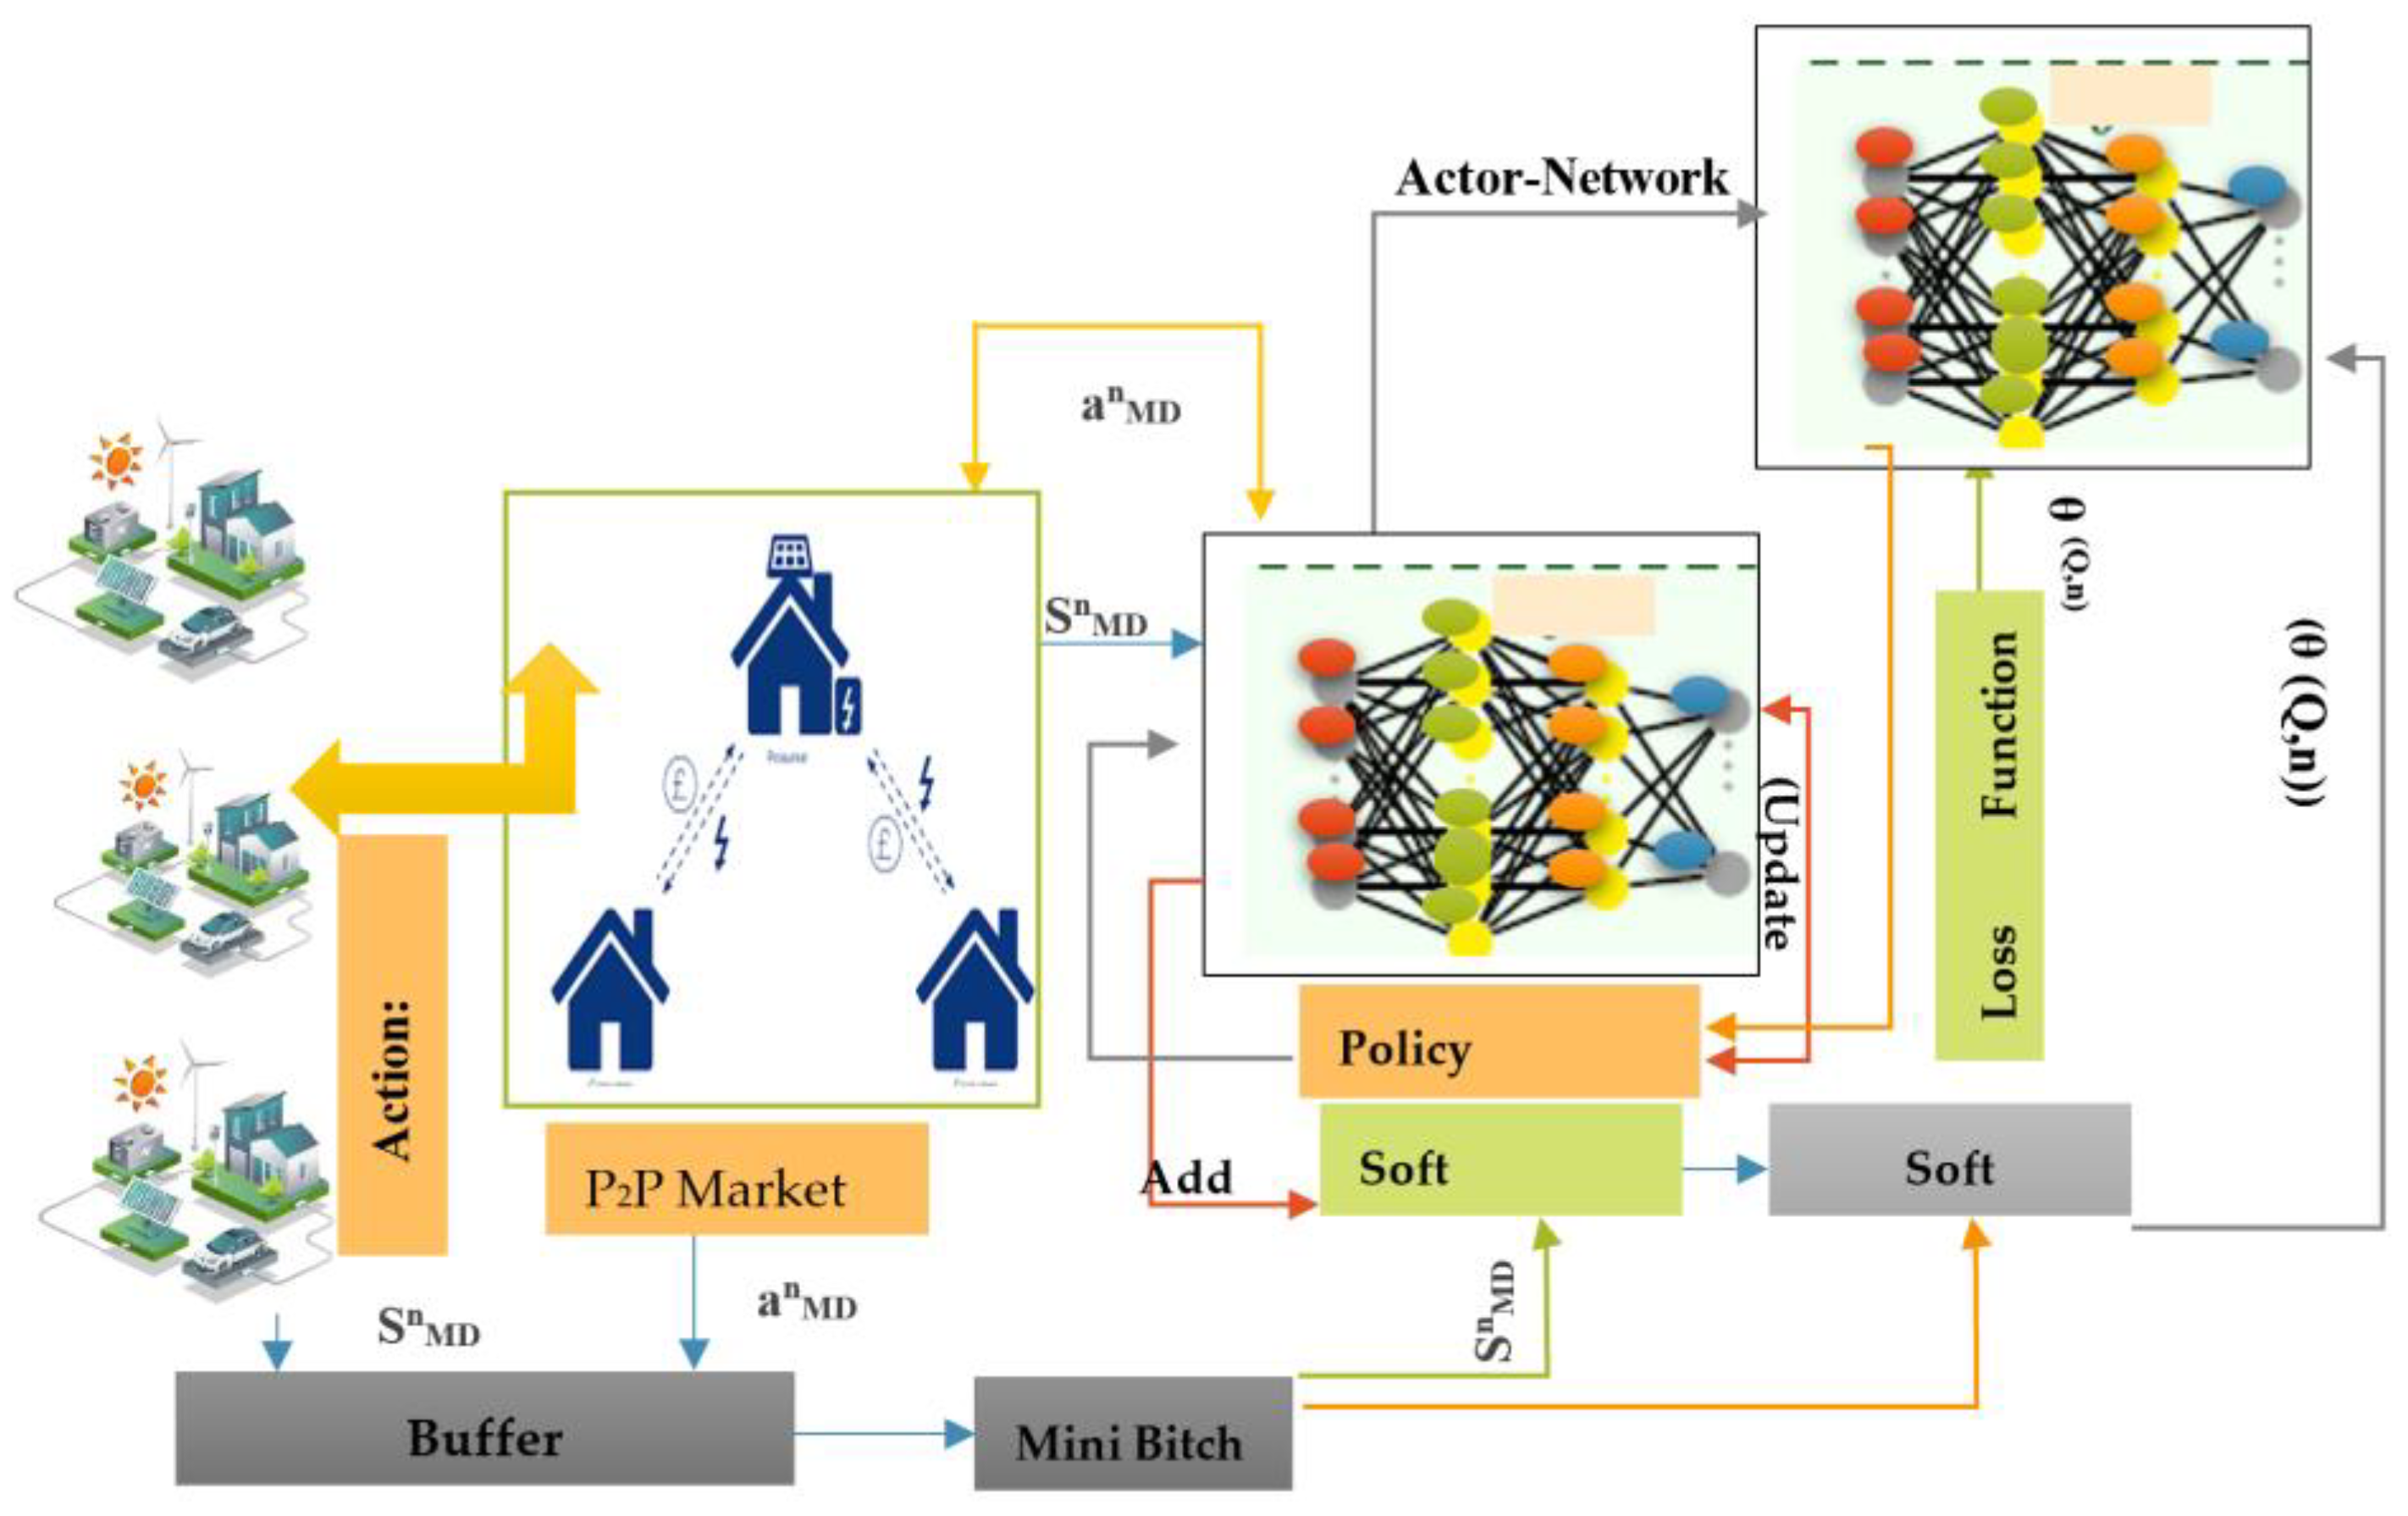
The next step is to use a multi-agent deep reinforcement learning (DRL) algorithm in a decentralized training environment to find the best ways to manage homes (see Figure 3).
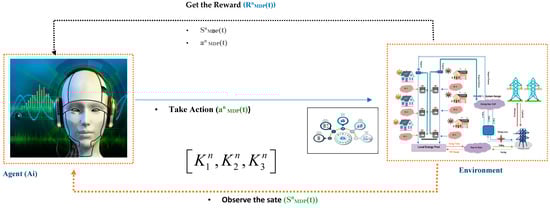
Figure 3.
Agent and environment interactions.
Markov Decision Process Formulation
The Markov Decision Process (MDP) represents sequential, discrete, and stochastic decision making. According to the paradigm, a decision maker or agent resides in an environment that changes randomly as a function of his or her activities. The MDP consists of state (condition, SMDP), action (aMDP), and reward (RMDP) (see Equations (15)–(17)).
State: SnMDP(t)
The photovoltaic output, the total amount of BT state of charge, and the purchase and sale prices offered by the local electricity company are the elements that make up the state vector SnMDP(t) of household n at time t. This vector is written as follows:
Action: anMDP
The illustration on the right represents the action vector anMDP for six houses at time t and scenario s. anMDP deploys the Home Energy Trading (K1), load scheduling of six houses (K2), and BT energy storage (K3).
Reward: RnMDP(t)
The reward function RnMDP(t) is the immediate advantage earned by household n at time t to execute the action a t based on the state in t, which is defined as an expression of the reward function rn t.
Figure 4 shows the recommended ANN model, which consists of an input data layer containing five neurons, three hidden data layers containing seventeen neurons, and an output data layer containing one neuron. Each layer determines the weighted sum of the input vector using the weighting (wi) while preserving the bias. The transfer functions pass this weighted sum to the next layer. This study used the ReLu (corrected linear unit function) transfer function. The coefficient of the optimization algorithm was set to 0.005. Machine learning uses RL for non-deterministic judgments. Figure 3 illustrates the interaction of the worker with the environment after the impersonation. The environment influences the agent’s behavior. Continue until the benefits of the climate are exhausted. The agent looks for the most efficient way to increase its income. The experimental control informs the MDP in this investigation. The state of an agent depends on its current condition and its actions in that state. Q-learning is a well-established technology for RL decision making.
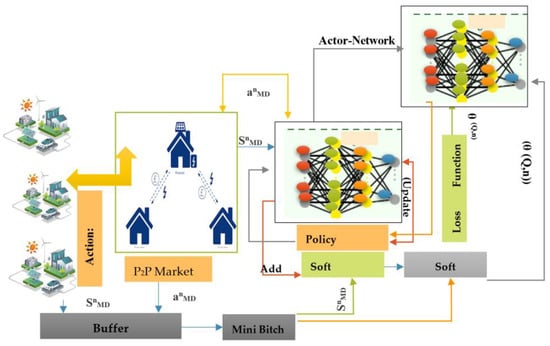
Figure 4.
The proposed Interactions Multi-agent approach.
Q-learning simultaneously calculates Q-values for the state SnMDP(t) and action (MD) (see Equation (18)). The Bellman equation gives a maximum approximation of Q for rewards and updates.
Equation (19) defines the optimal Q-value Q(SnMDP(t), an MDP) with the relative discount coefficient g in the interval [0, 1] as the sum of the immediate reward R(SnMDP(t), an MDP) and the maximum future reward g max Q(SnMDP(t), an MDP). The State Procedure Table (SPT), the Q-value table, records all Q(SnMDP(t), anMDP) values and their changes. At time t, the agent selects an action from the Q-value table and notifies the item (Q-value) using the Bellman equation [36].
The Δζ (∈ [0, 1]) notation appears in Equation (18). When Δζ = 1, the agent changes Q without taking advantage of it, considering both the current situation and the discounted maximum future payment. The algorithm can choose between exploration and exploitation by entering a value between [0, 1] (when Δζ = 0). The agent can learn the total value of k* by gradually increasing Q (SnMDP(t), anMDP).
The deterministic policy (k*) of the actor–network (ANe) loss estimates the separation between the two parts (consumers and consumers) of the Bellman equation (L(θ), (the critic network), θ(the actor-network): soft update) when the deterministic policy is derived from the player network (see Equation (20)). The distance between the two parties determines this loss. Training involves a reduction in the size of the loss function [37]. The DRL learning method of the proposed multi-agent DRL algorithm is illustrated in Algorithm 1, which is presented below.
| Q-learning Algorithm 1. P2P Energy Trading Approach. |
Home Agent ID status, SoCBT
Output groups- N (s), Q-value records, Optimal action an MDP
|
4. Case Study
4.1. General Setup
We conducted this simulation for one week in a neighborhood with ten separate residences and assigned each participant a number between one and ten (M = 1, 2, 3,…, 9, 10). The duration is ΔT = 680 distinct time segments—with 20 min time slots. Tunisian meteorology provides profiles of solar production and energy demand needed for 7–15 June 2021 [38]. The utility grid buys domestic energy for USD 0.08 per kilowatt-hour. The company can also charge homes different electricity rates depending on the time of day and day of the week. Table 2 shows these rates.
Table 2.
System technical parameters.
Initialization
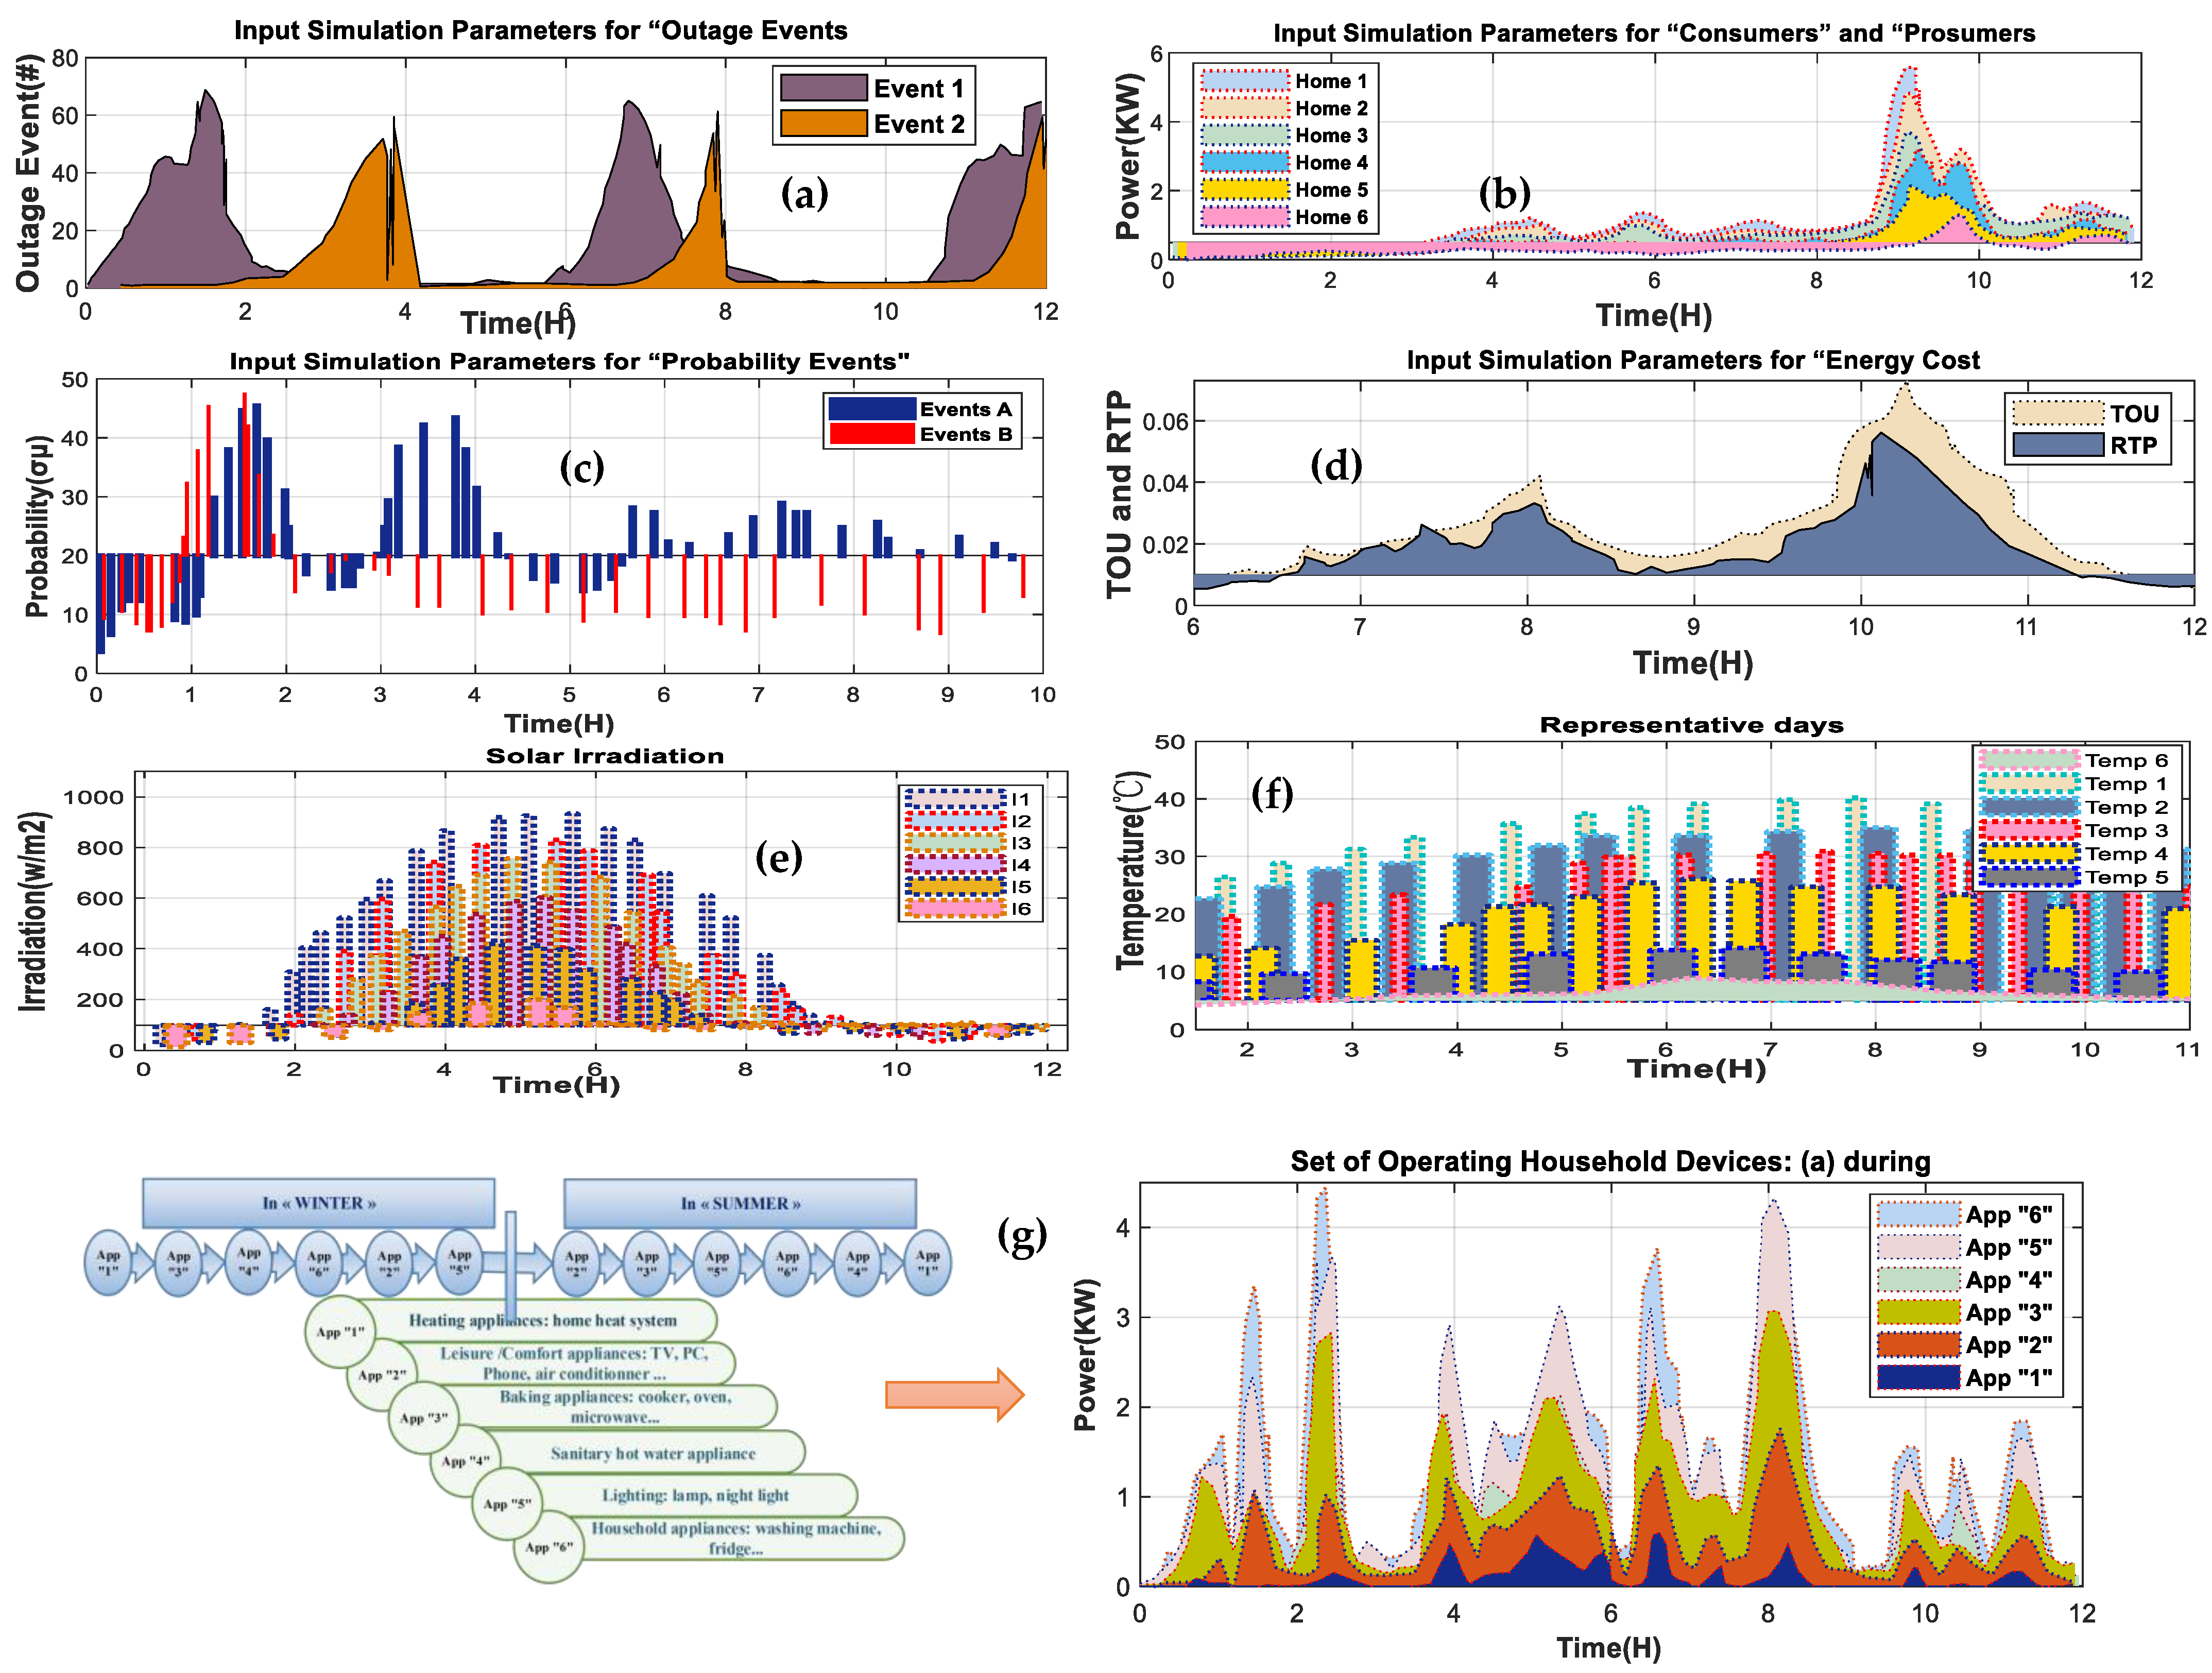
The research investigated the benefits of implementing the Q-learning algorithm for an intelligent home user using a test of six users and an energy tank. The trials also investigated the feasibility of using alternative renewable energy sources. The energy storage system works with smart home users to store and exchange energy twice a day. The system must maintain high accuracy at all times without time constraints. The control approach was evaluated in the MATLAB/Simulink environment, and the results showed its effectiveness in managing the system’s load requirements. The system model was built using photovoltaic data (radiation and temperature) from Tunisian weather forecasts (see Figure 5). The information is updated over the next two days based on data from the nearby weather station. We use simulation data to evaluate the approach proposed in this section. Electricity can only leave the grid in one way. Solar photovoltaic systems will be able to supply the electricity needed. Each city uses solar energy as well as electricity to recharge its batteries (see Figure 5d). By using the batteries during peak hours and considering the RTP, the optimizer will reduce the cost of electricity for households and businesses. The system parameters are detailed in Appendix A. The busiest hours of the day will see the activation and integration of a bidirectional electricity network. Both solar PV and the grid are required to charge the batteries. Solar PV will provide the necessary capacity, while the mortar (a house) will be used to sell the extra energy to the grid. The combination of solar and grid electricity can increase the power of the off-grid batteries. Figure 5a and c show the red lines of the PDFs assigned according to the data. The Set of Operating Households devices during summer and winter is shown in Figure 5g. The system’s technical parameters are illustrated in Table 2.
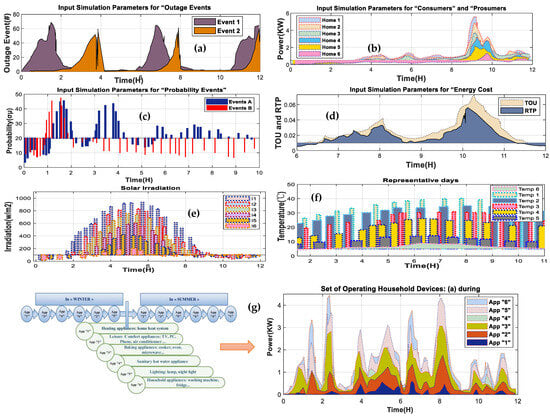
Figure 5.
Representative days taken when requesting non-deferrable households (b); solar radiation (w/m2) and ambient temperature (0C) (e,f); TOU and RTP prices taken into account in the simulation (d). The data available for the main grid breakdowns that occurred in Tunisia during the period of 2020 (a,c). The Set of Operating Households devices during summer and winter (g).
4.2. Single Home
4.2.1. Results with Utility Grid
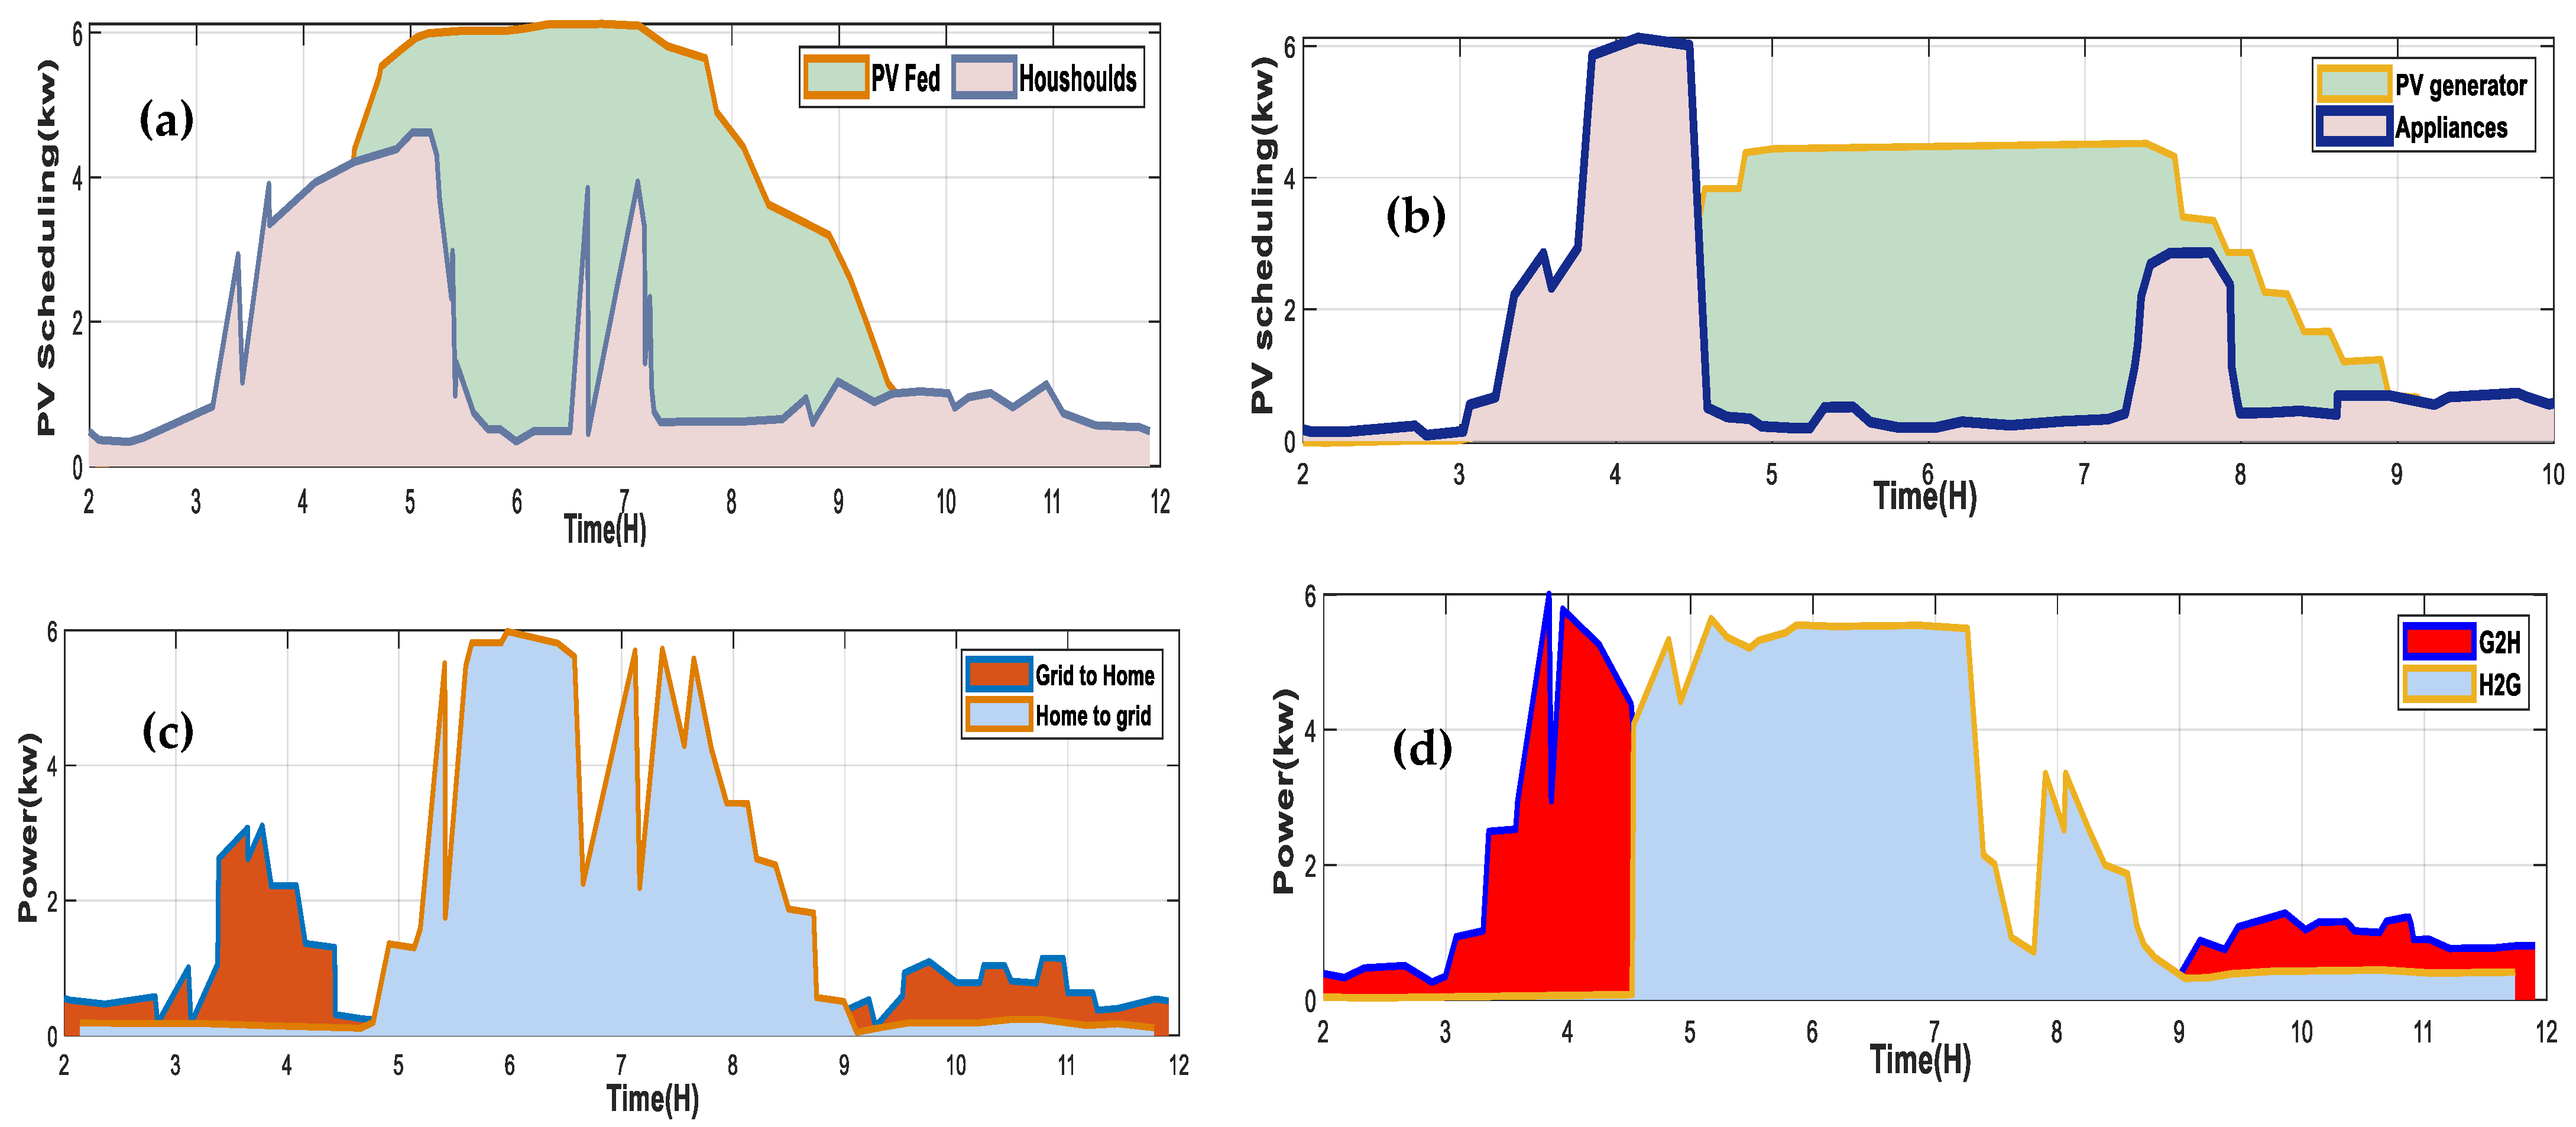
Figure 6a,b show the results of two case studies. One case study includes photovoltaic (PV) and biotechnology (BT), while the other does not. The distribution system is assumed to be reliable, so improving operations or adding a storage device is more helpful. Adding a storage device is not feasible. Our research has shown that solar arrays can effectively reduce overall costs. Implementing a solar array can significantly reduce expenses under time-of-use (TOU) tariffs, up to USD 3800, and time-of-use/real-time pricing (TOU/RTP) tariffs, up to USD 2989. Using a photovoltaic calendar has reduced the total financial expenditure for consumers through two mechanisms. Firstly, the prosumer can operate autonomously when the photovoltaic potential is high. Secondly, excess energy from prosumers can be sold to the grid to generate income. Figure 6c,d illustrates a typical day for the BT system, which schedules the PV array and deferred and non-deferred homes. During periods of high demand, such as at night, the PV unit can meet the needs of each family.

Figure 6.
Typical day without blackouts: (a–d) PV-BS system scheduling result with RTP TOU tariffs.
During this period, the PV array may generate surplus electricity that is fed into the grid. Various technologies are being implemented to reduce costs. Figure 7 shows the results of carrying equipment over to the next day. The deferrable equipment is intended to reduce costs and increase revenue. Figure 7a–d display the dataset outcomes.
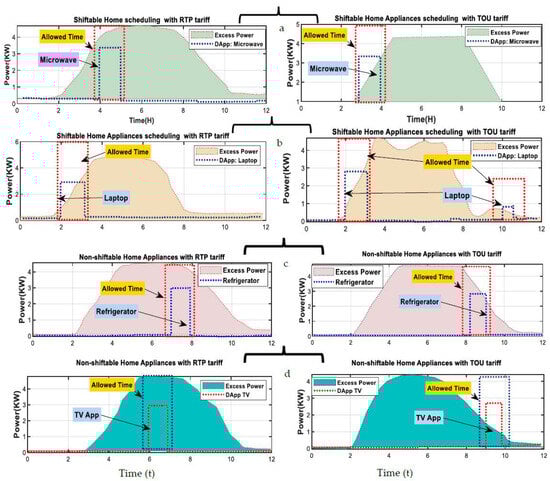
Figure 7.
Typical day without Blackouts: (a–d): Shiftable and Non-shiftable Home Appliances scheduling for a with RTP and TOU tariff.
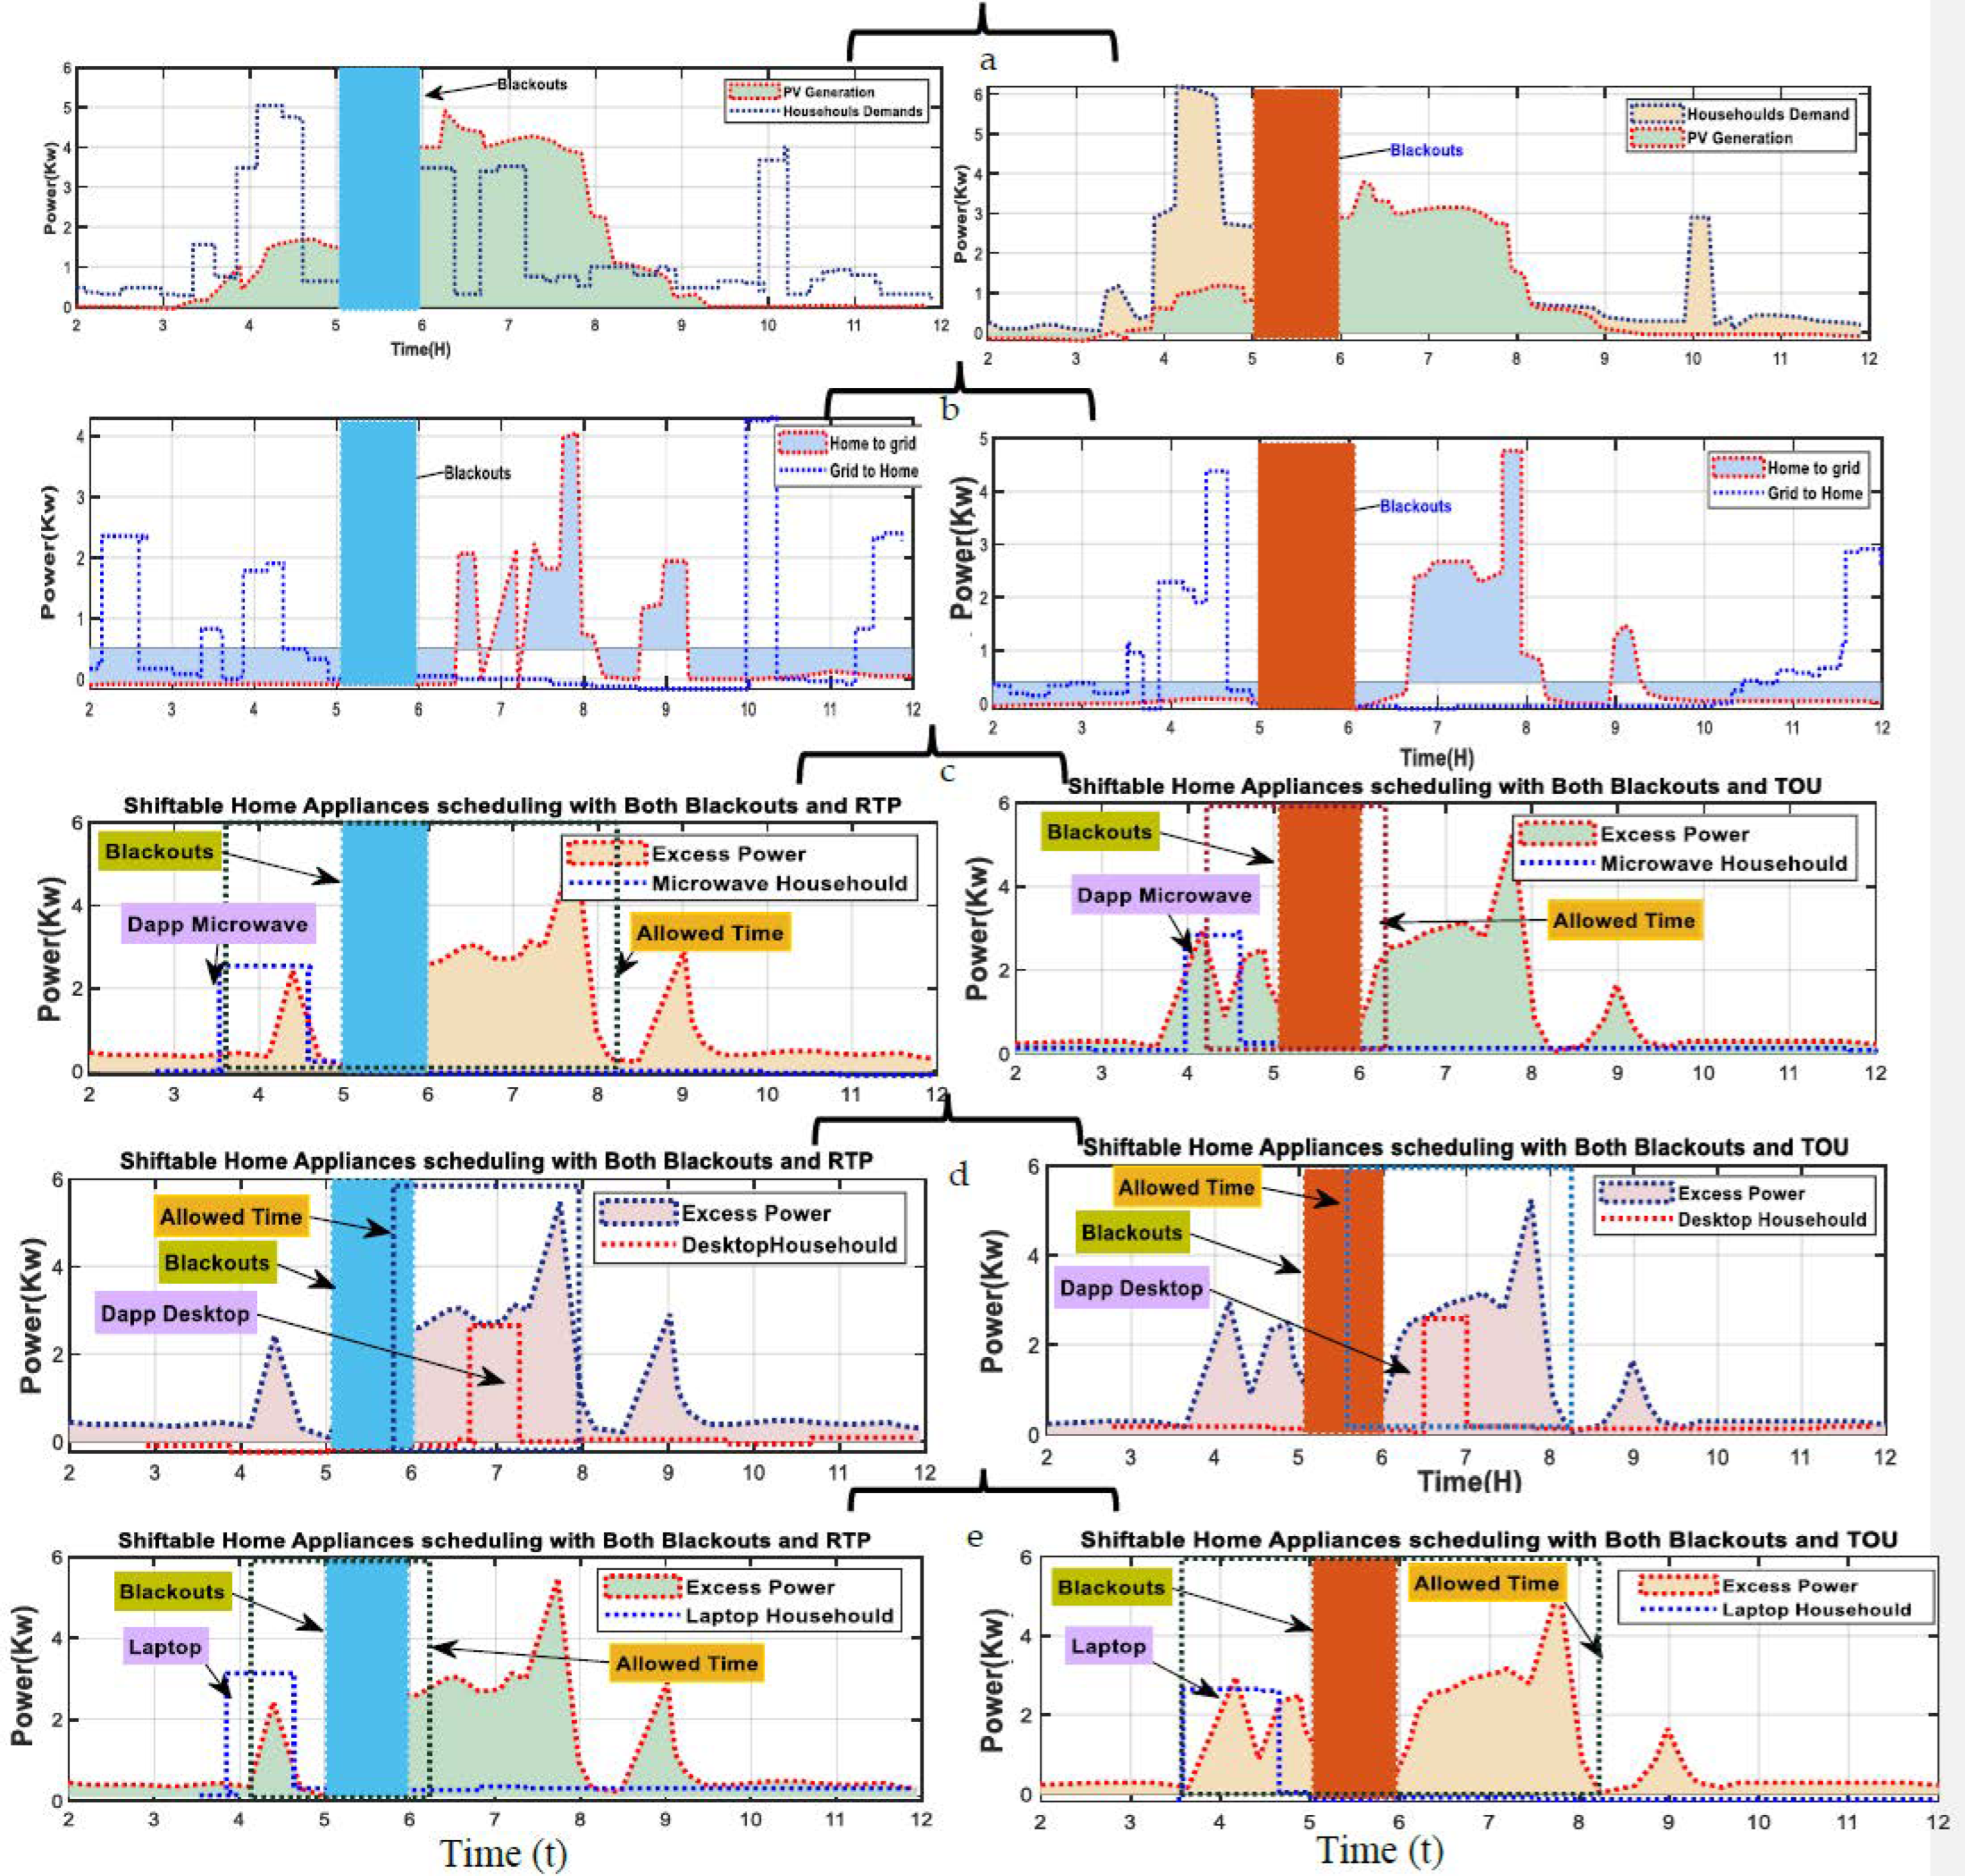
4.2.2. Results Considering Grid with Blackouts
Figure 8 displays a typical photovoltaic (PV) system with BT electricity over a single day. The grid experienced damage between 9.30 a.m. and 12.30 p.m., as illustrated in Figure 8a–c. Depending on the solar irradiation level, the PV array or battery system will supply sufficient energy to meet residential demand when the grid is unavailable. Furthermore, the LV system reduces reliance on the conventional electricity grid. The battery unit is often utilized during peak evening and night hours to meet household demand, while energy is recovered during the afternoon when energy expenditure is at its lowest. Figure 8d,e demonstrate that the results of the programs for the two tariffs are identical. Devices that are portable and used intermittently, such as microwaves, laptops, and desktop computers, are used when the power supply is unavailable. Battery storage can supply power to these devices, but its expanded capacity has increased procurement and maintenance costs. Prices increase significantly during periods of high demand, which are divided into two seasons. Peak periods are associated with increased expenditure. Two distinct pricing periods—peak and off-peak—determine the hourly rate. Tariff structures consider seasonal and validity periods.
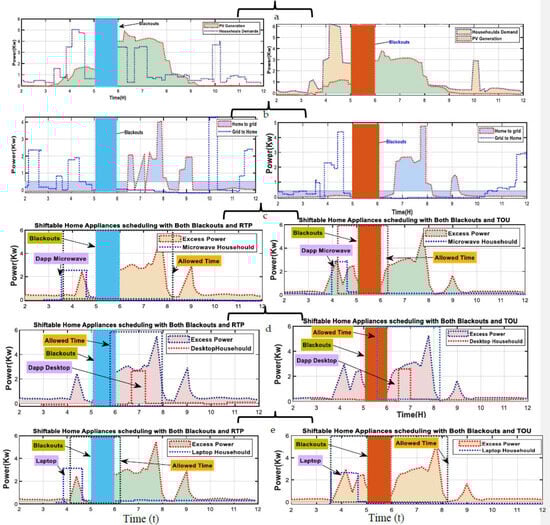
Figure 8.
A typical blackout day: PV-BT system scheduling using RTP TOU tariffs (a–c), RTP/TOU tariff deferrable device scheduling (d,e).
4.3. Case Study: Multi-House Community
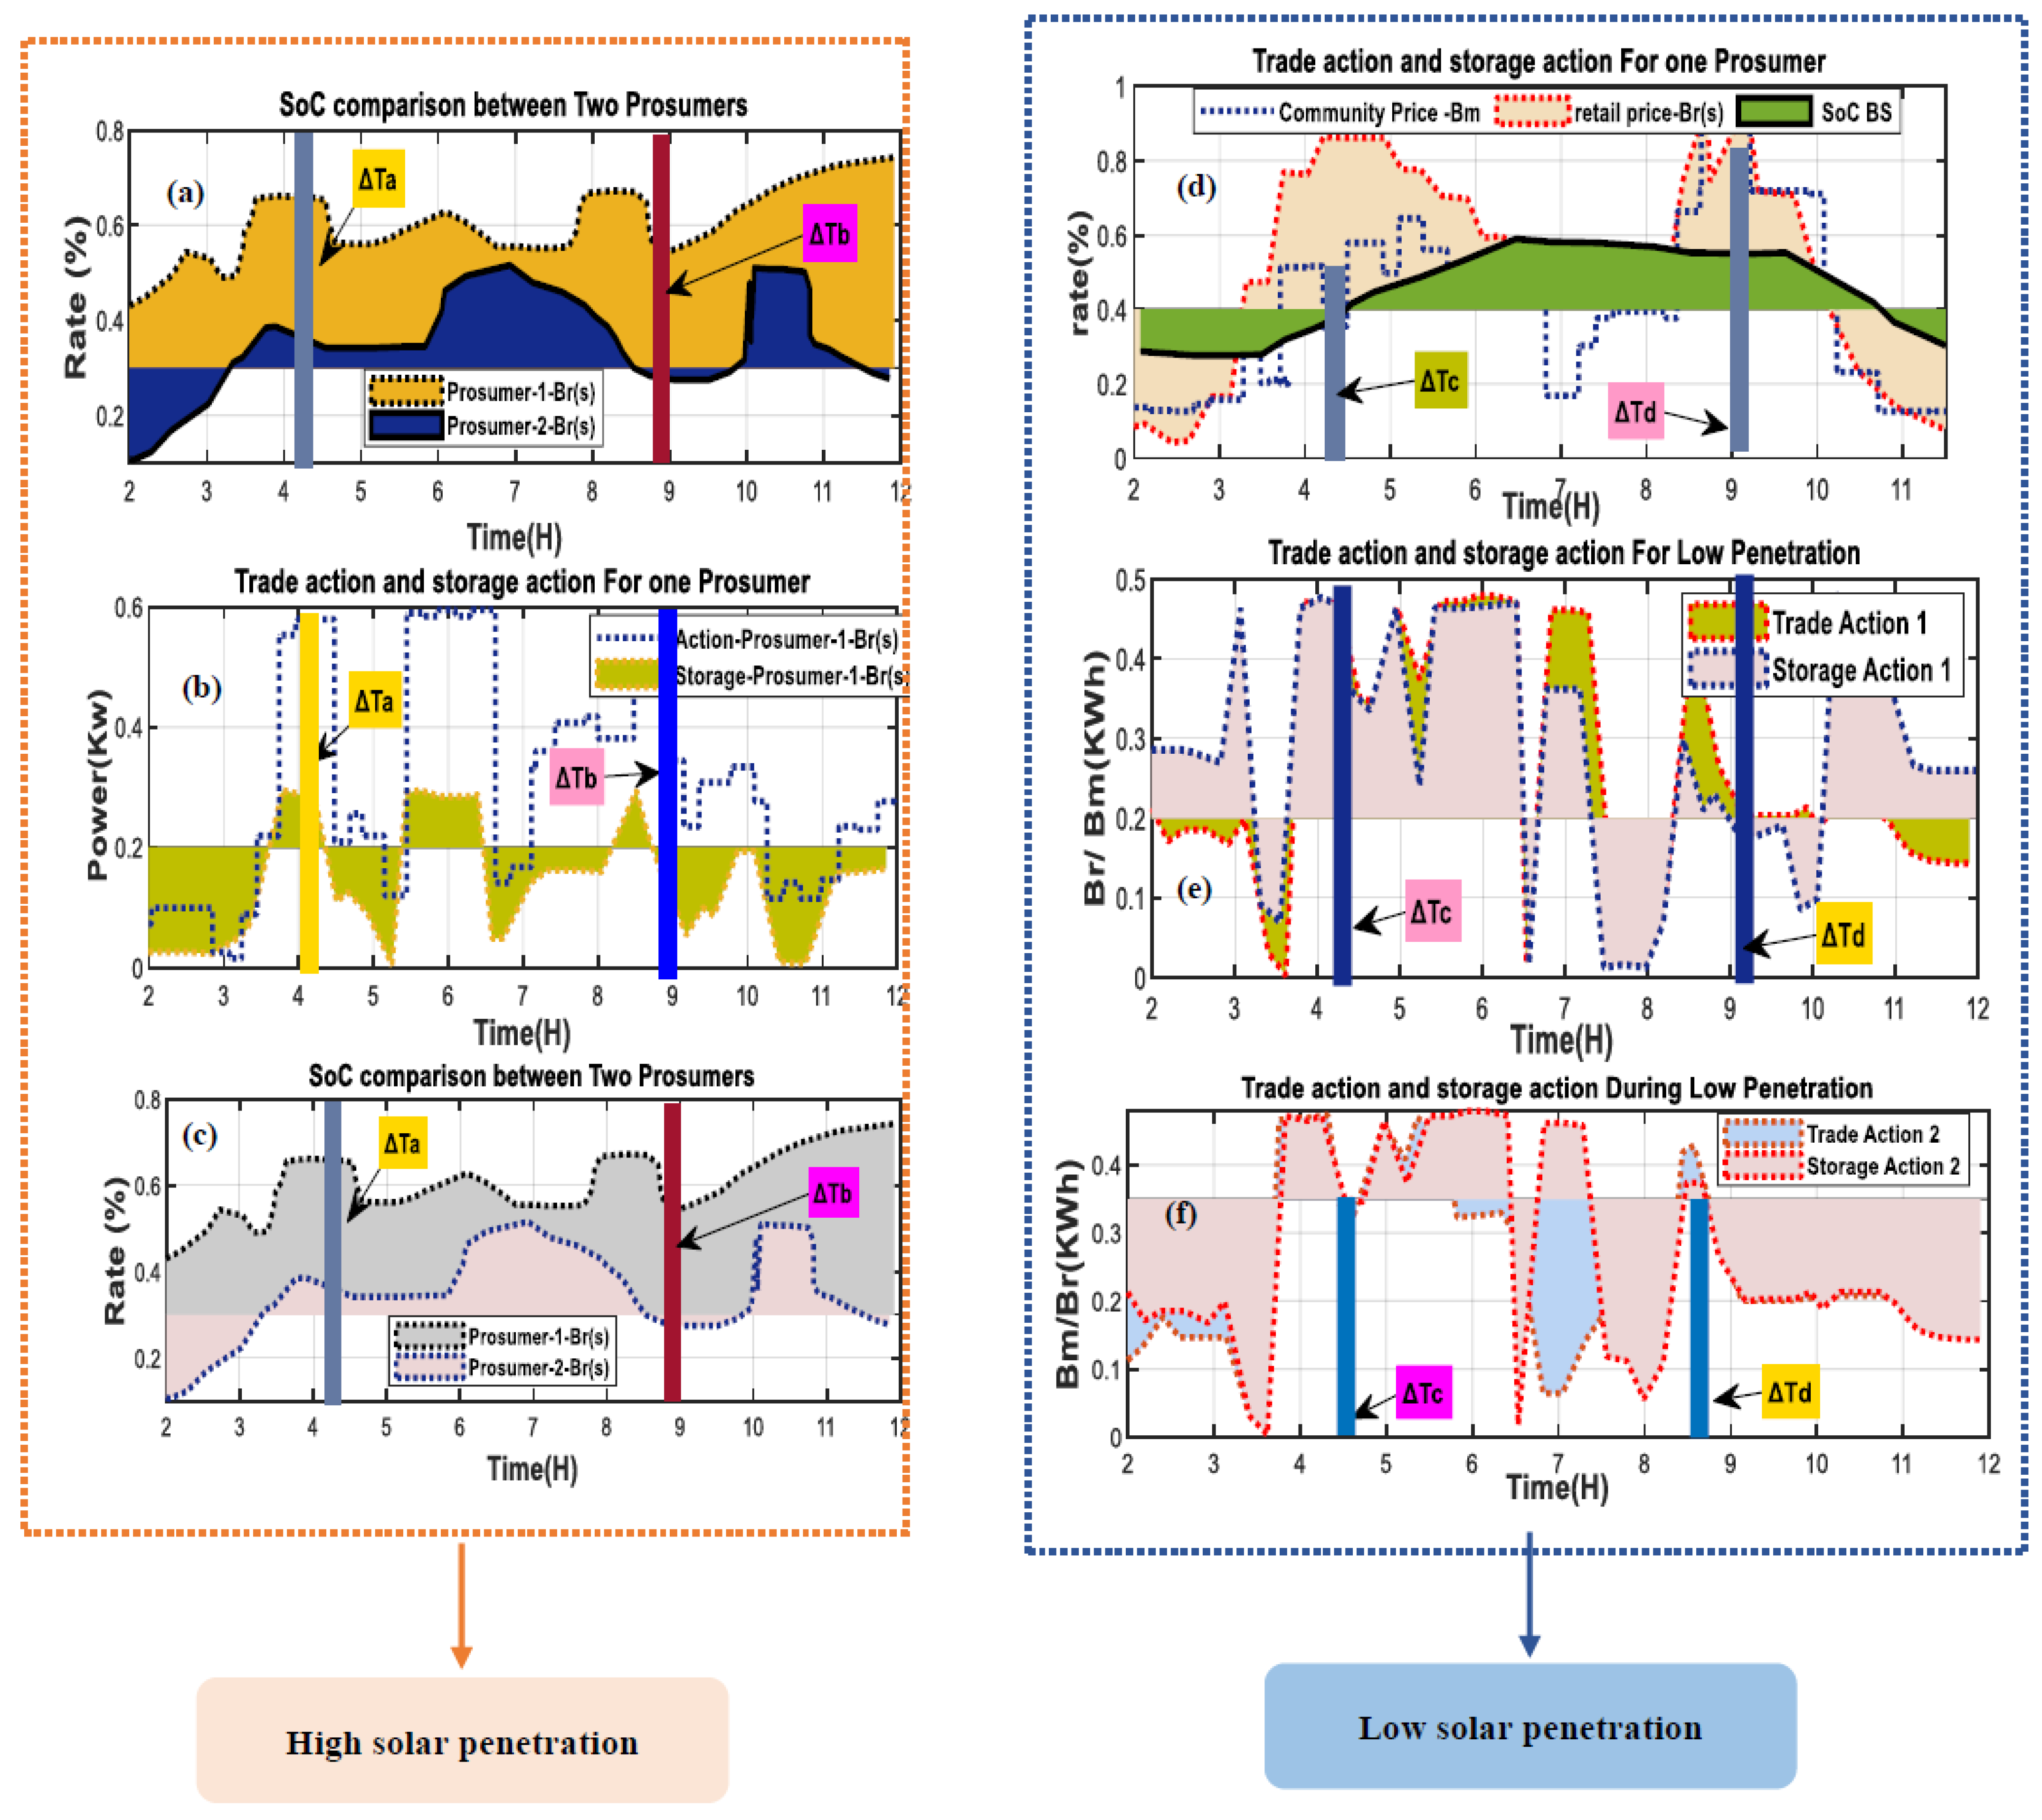
4.3.1. High Solar Penetration
Figure 9 illustrates the variation in retail prices within the community. The author demonstrates the evolution of the Knowledge Organization System (KOS) for price fluctuations. The community tariff is generally less expensive than the retail tax due to the sale of excess collector capacity and the surplus increase in demand, thanks to solar energy. At times, however, the cost of the energy complex exceeds the retail price. To maintain market demand, the cost of the energy complex is set higher than the expected tariff. Using the Q-learning algorithm method, the agent decides whether to load or unload based on the amount of energy stored, considering both the decision’s cost and effect. For instance, if ΔTa is 4.66, the retail price is high, and the community price is low. According to the agent, energy storage is the optimal option, with the highest return for fully charging the house. When ΔTb is 9, retail and community prices reach record levels, as shown in Figure 9b.

Figure 9.
Prosumers with high solar penetration: (a) retail price vs. community; (b) prosumer trade action and storage action; (c) SoCBT comparison between two prosumers; (d) retail price vs. community; (e) trade and storage action 1; (f) trade and storage action 2.
4.3.2. Low Solar Penetration
Figure 9d depicts two customer handling and storage processes from T = 0 to ΔTd. Figure 9 compares retail and community prices with limited solar penetration. The community price is higher than that in Figure 5 because the local power pool has acquired less solar power. This will limit the return on battery storage devices used by savvy users and their participation in the societal energy trade. Contrary to the initial idea, only a few people will buy electricity from the power pool. The electricity costs for the intelligent user are higher than in the first example. The presented algorithm can benefit consumers, as shown in Figure 9f. Both agents’ trade actions are comparable, indicating the algorithm’s reliability. Table 3 suggests that the proposed approach may lead to cost savings for users and the energy community. The proposed methodology is solid and pervasive. Fuzzy Q-learning aims to increase renewable energy usage. For instance, the surplus–demand ratio is high at midday when solar energy is abundant. To demonstrate the effectiveness of the proposed algorithm in promoting the use of renewable energy, it is implemented in case 1 with the inclusion of renewable energy penetration. In this scenario, the local energy pool only collects 30% of the available solar energy, which may lead to higher prices and lower participation in the community’s energy exchange.
Table 3.
Energy cost in the community with/without Q-learning algorithm.
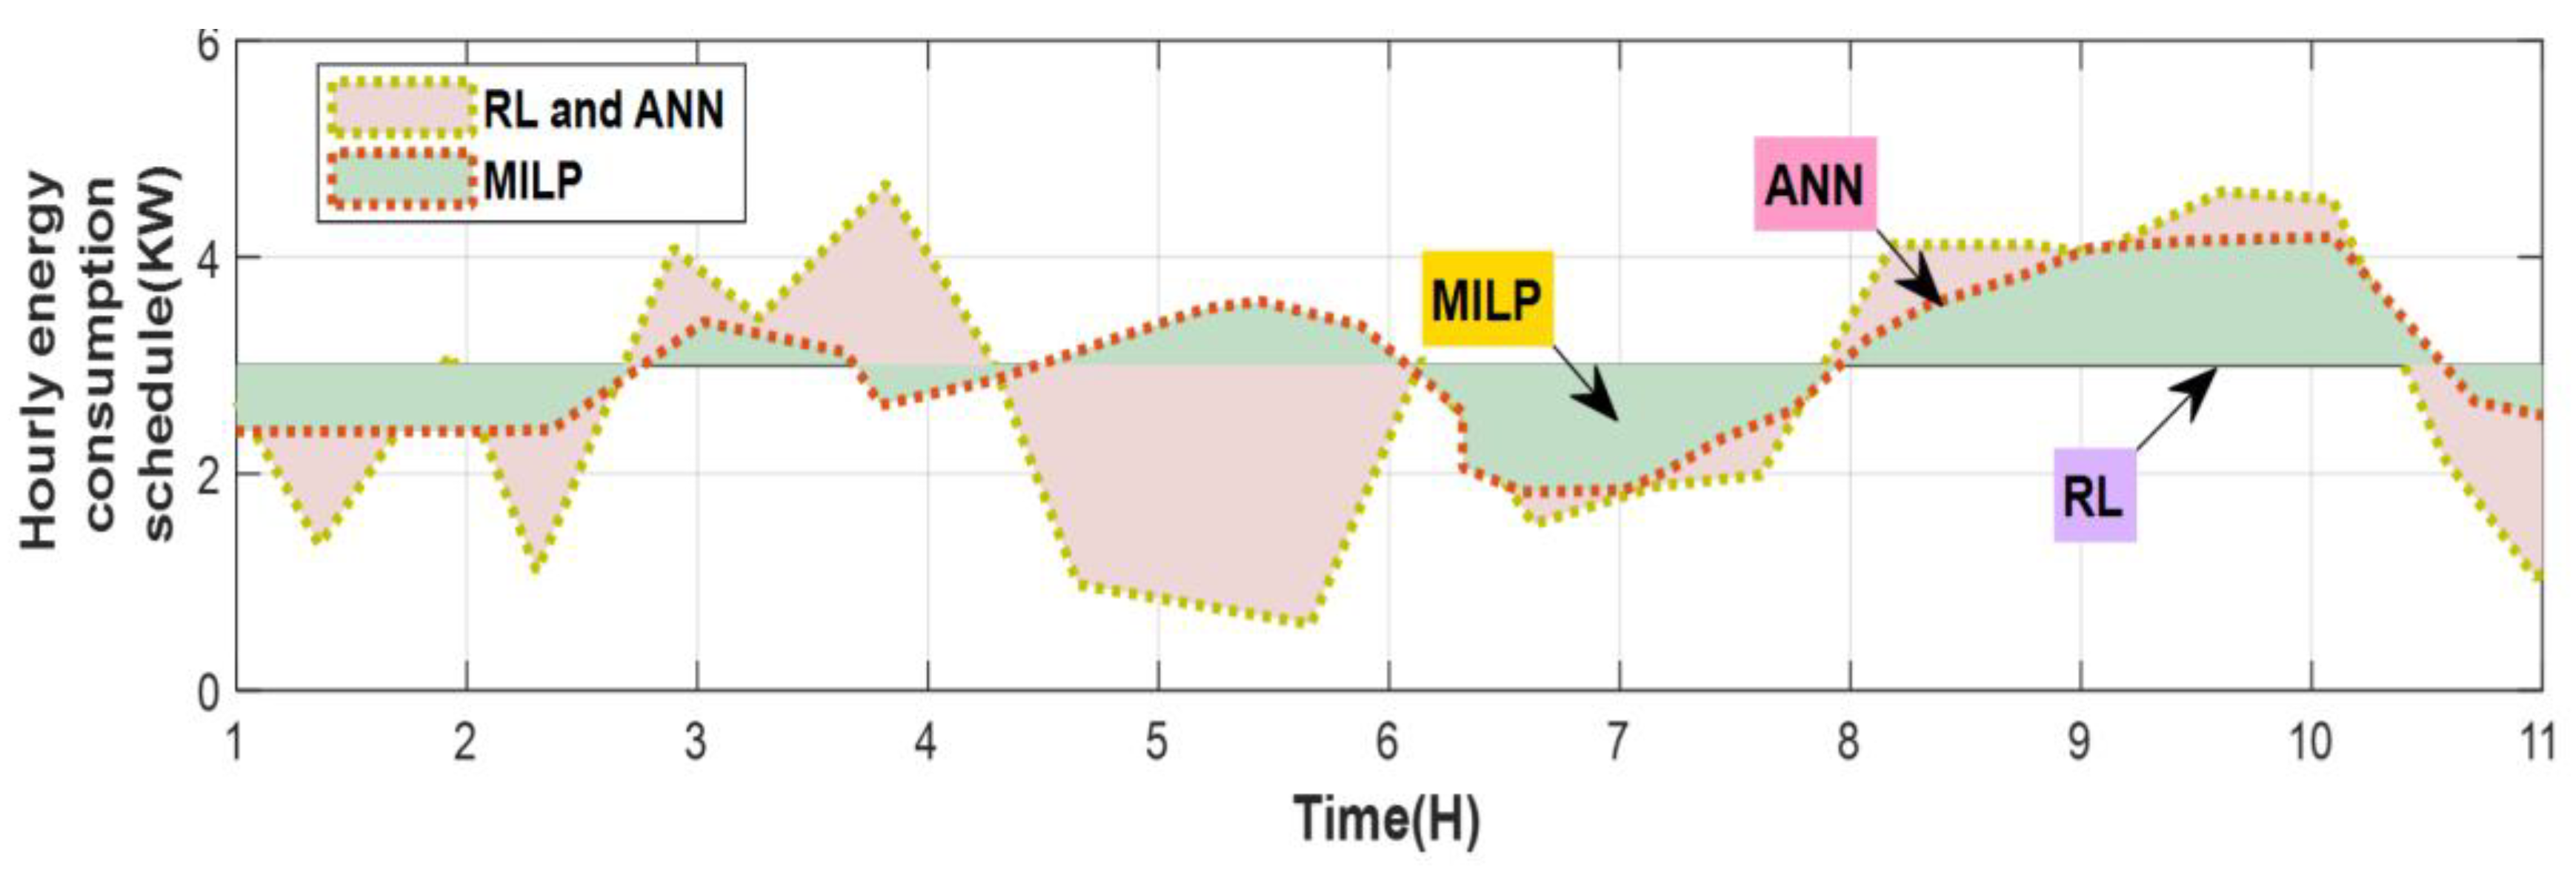
In low solar penetration scenarios, intelligent homes trade with the neighborhood’s energy pool, as shown in Figure 10. The power pool and competent user do not exchange electricity from ΔTc (4.6) to ΔTd (9). Community prices increase while solar energy penetration is low, prompting users to either sell or store electricity. These phenomena demonstrate the accuracy of the algorithm. After learning how to maximize energy management empirically, the agent selects the best version based on the q-value table. Although less effective than global optimization, continuous, form-free online processes are still possible. With the help of the suggested method, smart consumers can reduce their electricity costs and make it easier to use solar energy. The use of the proposed fuzzy Q-learning algorithm can encourage growth in renewable energy by increasing consumer revenue.

Figure 10.
Lowering power costs due to various operation conditions for electric appliances.
4.3.3. Performance Evaluation Using RL/ANN and MILP
Figure 10 shows that the RL approach is superior to the MILP method in minimizing the utilization of alternating current. The MILP model predicted an electricity cost of USD 394.22 per kilowatt-hour, while the RL model projected a price of USD 199.73 per kilowatt-hour, resulting in a decrease in electricity expenses of USD 219.158. Additionally, Figure 8 illustrates that incorporating more parameters in the RL model reduces the total energy expenditure. To obtain an accurate evaluation of the required energy, Equation (21) is integrated using Mixed Integer Linear Programming (MILP) and Reinforcement Learning/Artificial Neural Networks (RL/ANNs) [39,40,41].
4.4. Regarding the General Applicability of the Offered Approach
To avoid excessive costs, we have presented the results of a single case study. The study focuses on a peer-to-peer system with four prosumers and consumers. This section explains how the technology can be applied to other residential systems, different types of faults, and the regular operation of the peer-to-peer system. Prosumers and consumers often find themselves in problematic situations. The proposed strategy can be modified to suit different occasions and only requires general data, which can be found in publicly available databases or checked instantly using smart devices. The deep learning model can be modified effectively in different contexts. Including variables and limitations for all loads or appliances under consideration is essential. For instance, multiple renewable energy sources specific to each home were considered, and the timed devices described in Section 2 were considered. The previous set of circumstances can be perfectly extrapolated to the current situation, as demonstrated in Section 2, where it was shown that the household market represents only a fraction of the community. To address this issue, removing any limitations imposed by the local electricity network on the energy flow into each residential system is necessary. This study has yet to explore devices and loads in the regional grid, such as electric vehicles (EVs) and electricity storage. Examples of these elements can be found. When applied to a sufficiently simple model, these elements are easy to implement and can significantly improve the effectiveness of a business model. The study of demand is also an exciting and fruitful area of research. It is possible to detect a link.
4.5. Discussion
Several approaches can be used to reduce an area’s average monthly energy costs. One innovative solution is to create an energetic community with a shared energy supply. The proposed pricing mechanism will ensure that the price is between the cost of production and retail expenditure. Statistics show that this pricing can help energy consumers reduce their monthly energy expenditure while increasing their income. Q-learning can be implemented through reinforcement in SG 2.0, for example, via community energy trading. SG 2.0 can continuously improve its means and choices to regulate energy consumption. The proposed case study has enabled both traditional users and “prosumers” to benefit from the increased efficiency offered by SG 2.0 and the production of renewable domestic energy. The community power plant offers affordable electricity, and savvy users can earn money by selling excess electricity back to the community. The SG 2.0 concept enables users to transition from consumers to producers, using sophisticated storage and control systems to participate in the energy market, influencing electricity pricing and boosting revenues. The study found that enhancing Q-learning can address the issue of high energy consumption costs, regardless of the level of photovoltaic penetration. This approach can effectively tackle the persistent challenges associated with SG 2.0. The results indicate that the proposed algorithm can potentially reduce consumer energy bills. The algorithm’s consistency and accuracy were evaluated using two users and three customers, each consuming the same energy. While Consumer 1′s SOC is 0.45, Consumer 2′s SOC is only 0.29.
5. Conclusions and Future Works
This research presents a peer-to-peer energy-sharing mechanism explicitly designed for residential homes. The optimal outcome of this model is achieved by using a multi-agent deep reinforcement learning algorithm within a decentralized training environment. The suggested model employs a deep learning methodology to assess the energy usage of intelligent and traditional homes in the community pool. It also analyzes the charging and discharging of the energy storage battery and the energy exchange methods utilized in the proposed peer-to-peer energy market. The anticipated competitive issue is resolved through the utilization of deep reinforcement learning derived from the decentralized training of the recommended agent. The goal is to minimize the expenses associated with dissatisfaction and electricity expenditure. Simulations are conducted in a residential area comprising multiple prosumers and consumers. The simulation findings demonstrate that the proposed strategy can achieve superior results in maximizing rewards compared to the other two state-of-the-art learning methods examined. The suggested multi-agent deep reinforcement learning technique has the potential to enhance the average household reward by 9.3% and 16.07% in comparison to existing methodologies. Our future research will concentrate on the computing complexity of managing many players. It is widely recognized that a centralized market structure would substantially increase computational effort when applied to multiple market participants. Furthermore, future considerations will encompass network limitations and energy provision by implementing a two-stage coordination approach: The model’s upper stage calculates transaction prices and the quantity of energy exchanged. In the lower stage, the centralized market coordinator analyzes the energy flow issue and allocates and supplies power. A two-stage coordinating methodology will be employed to accomplish this task in the future.
Author Contributions
Methodology, M.M.K. and B.S.; Software, B.S.; Formal analysis, B.S.; Investigation, M.M.K. and B.S.; Resources, M.M.K.; Writing—original draft, B.S.; Funding acquisition, M.M.K. and B.S. All authors have read and agreed to the published version of the manuscript.
Funding
This research received funding from Deanship of Scientific Research at Umm Al-Qura University by Grant Code 22UQU4400271DSR03.
Data Availability Statement
The data presented in this study are available in https://www.sciencedirect.com/science/article/abs/pii/S0952197623005729 and https://www.sciencedirect.com/science/article/abs/pii/S0959652621020102.
Conflicts of Interest
The authors declare no conflicts of interest.
Appendix A
Table A1.
Nomenclature.
Table A1.
Nomenclature.
| Mathematical Formulation | Mathematical Formulation | ||
|---|---|---|---|
| DSCID=1T(t) | Consumer 1 Demand–Supply Correlation at time “t” | DSCID=2S(t) | Prosumer 4 Demand–Supply Correlation at time “t” |
| DSCID=2S(t) | Prosumer 2 Demand–Supply Correlation at time “t” | DSCID=3S(t) | Prosumer 5 Demand–Supply Correlation at time “t” |
| DSCID=3S(t) | Prosumer 3 Demand–Supply Correlation at time “t” | DSCID=6T(t) | Consumer 6 Demand–Supply Correlation at time “t” |
| Pinj-PV1 (t) | Power delivered by PV1 at time “t” in kW | Pinj-PV4 (t) | Power delivered by PV4 at time “t” in kW |
| Pinj-PV2 (t) | Power delivered by PV2 at time “t” in kW | Pinj-PV5 (t) | Power delivered by PV5 at time “t” in kW |
| Pinj-PV3 (t) | Power delivered by PV3 at time “t” in kW | Pinj-PV6 (t) | Power delivered by PV6 at time “t” in kW |
| PGrid-home1 | Power supplied by the grid to home 1 at time e “t” | PGrid-home5 | Power supplied by the grid to home 5 at time “t” |
| PGrid-home2 | Power supplied by the grid to home 2 at time “t” | PGrid-home6 | Power supplied by the grid to home 6 at time “t” |
| PGrid-home3 | Power supplied by the grid to home 3 at time “t” | Bid and Quote | |
| PGrid-home4 | Power supplied by the grid to home 4 at the time “t” | QID=3S(t) | Quote pricing provided by Prosumer 2 at time “t” |
| Bid and Quote | QID=4S(t) | Quote pricing provided by Prosumer 3 at time “t” | |
| BID=1T(t) | Bid pricing provided by Customer 1 at time “t” | QID=5S(t) | Quote pricing provided by Prosumer 4 at time “t” |
| BID=2T(t) | Bid pricing provided by Customer 6 at time “t” | QID=6S(t) | Quote pricing provided by Prosumer 5 at time “t” |
| PRTPgrid(t) | Grid and RTP tariff at time “t” | Objective Function | |
| Trading costs from prosumers to consumers | Switch1 con(t) | A numerical value indicating the amount of power that was extracted from the grid at time t | |
| min B(t) | Minimum offering quantity at time “t” | PRTPGrid(t) | RTP pricing at time “t” |
| Trad1cost(t) | Power price that Consumer 1 bought at time “t” | PGrid (t) | Power delivered by the grid at time “t” in kW |
| Trad2cost(t) | Power price that Prosumer 2 bought at time “t” | MPV (t) | Maintenance expenses for solar power systems |
| Objective Function | MBT (t) | Maintenance expenses for BT energy storage in kW | |
| PPV (t) | Power delivered by PV at time “t” in kW | PBTDis (t) | Battery power discharged at time t expressed in kW |
| Consumer(K,t) | Electricity transferred from the customer at time t in kW | Prosumer(K,t) | Electricity transferred from the consumer at time t in kW |
| S(i,t) | Binary value (on/off) denotes the exchanges with consumer i at time t | ||
| Energy Balance | |||
| J1 | Power Balance for Prosumer i = (ID: 1,3.4,5) at time t | J3 | Power Balance for Consumer i = (ID: 6) at time t |
| J2 | Power Balance for Consumer i = (ID: 2) at time t | PGH (t,s) | Power delivered from the grid to home at time t in kW |
| Pneeded (t,s) | Energy demand by each Prosumer i = (ID: 1,3.4,5) at time t in kW | PNG (t,s) | Power delivered from the home to the grid at the time t in kW |
| PBTCharge (t,s) | Battery backup during time t in kw | PBTDis (t) | Battery power discharged at time t expressed in kW |
| Electric Vehicle | |||
| Yn, tEV, Cons | Household electrical energy usage, n, over time t, measured in kW | Yn, tEV, dis | The household “n’s” electric vehicle (EV) power discharging during t is noted (kW) |
| Yn, tEV, Sell | The household “n’s” electric vehicle (EV) power sales during t is noted (kW) | ψn, tEV | The domestic electric vehicle (EV) battery charging efficiency is its charging efficiency. It measures the efficiency with which the EV battery stores energy from the charging source (kW). |
| Yn, tEV, char | The household “n’s” electric vehicle (EV) power charging during t is noted (kW) | χn, tEV | A binary variable can only take two values, commonly 0 and 1. If the EV is charged during t, the value is 1; otherwise, 0. |
| Tn1 | The anticipated arrival time of household n’s EV | Dn, tEV | EV charge efficiency of household n |
| Tn2 | The anticipated departure time of household n’s EV | ƞn, tEV, Cons | EV discharge efficiency |
| SINGLE HOME SHARING ENERGY | |||
| Isolar(t) | PV supply at the time t in kw | ea, x | Switching vector selects power consumption |
| Ja,x | Appliance average power demand matrices | SoC0BT(t) | Battery state of charge at time 0 |
| SoCBT(t) | Battery state of charge at time t | CBT max | Battery maximum capacity at time t |
| ηc | BT charging efficiency | ηd | BT discharging efficiency at time t |
| CBT 0 | Battery capacity at time t0 | pd(t,s) | Power delivered by the BT at time t |
| CIntialBudget | Initial budget (USD) at the time t | ϕpv | PV array Capital Cost (USD/kW) at time t |
| ϕBT | BT Capital-Cost (USD/kW) at the time t | ClimitBudget | Fixed budget limit (USD) at time t |
| Deep reinforcement learning solution | |||
| SnMDP(t) | MDP state vector condition at time t | K1 | Home Energy Trading at time t |
| anMDP(t) | MDP action vector condition at time t | K2 | Load scheduling of six houses at time t |
| RnMDP(t) | MDP reward vector condition at time t | K3 | BT energy storage at time t |
| wi | The weighted sum of the input vector at time t | Q(Sn, an) | Optimal Q-value at time t |
| g | The relative discount coefficient at time t | k* | Deterministic policy at time t |
| Δζ | Counted maximum future payment at time t | L(θ) | Bellman equation at time t |
| θ | Soft update coefficient at time t | θnQ | Soft update at time t |
| gn(T) | The loss function at time t | Cbuy(t) | The electricity sale prices at time t |
| Cbuy(t) | The electricity purchase prices at time t | ||
References
- Jenisha, C.M. Decoupled control with constant DC link voltage for PV-fed single-phase grid-connected systems. Integr. Renew. Energy Sources Smart Grid 2021, 9, 171–185. [Google Scholar]
- Khodoomi, M.; Sahebi, H. Robust Optimization and pricing of peer-to-peer energy trading considering battery storage. Comput. Ind. Eng. 2023, 179, 109210. [Google Scholar] [CrossRef]
- Wang, J.; Xu, H.; Xu, J. Can the target responsibility system of air pollution control achieve a win-win situation of pollution reduction and efficiency enhancement? Front. Energy Res. 2022, 9, 821686. [Google Scholar] [CrossRef]
- Steele, K. Pareto improvements and feasible climate solutions. In Philosophy and Climate Change; Oxford University Press: Oxford, UK, 2021; pp. 346–369. [Google Scholar]
- Yu, V.F.; Le, T.H.; Gupta, J.N.D. Sustainable Microgrid Design with peer-to-peer energy trading involving government subsidies and uncertainties. Renew. Energy 2023, 206, 658–675. [Google Scholar] [CrossRef]
- Fernandez, E.; Hossain, M.J.; Ali, S.M.N.; Sharma, V. An efficient P2P energy trading platform based on evolutionary games for prosumers in a community. Sustain. Energy Grids Netw. 2023, 34, 101074. [Google Scholar] [CrossRef]
- Horowitz, M.J.; Haeri, H. Economic efficiency V energy efficiency. Energy Econ. 1990, 12, 122–131. [Google Scholar] [CrossRef]
- Mokryani, G. Control of distribution networks with integration of renewable sources. In Future Distribution Networks; AIP Publishing LLC: Melville, NY, USA, 2022; pp. 1–16. [Google Scholar]
- Xia, Y.; Xu, Q.; Li, F. Grid-friendly pricing mechanism for peer-to-peer energy sharing market diffusion in communities. Appl. Energy 2023, 334, 120685. [Google Scholar] [CrossRef]
- Ghaemi, S.; Anvari-Moghaddam, A. Local energy communities with strategic behavior of multi-energy players for peer-to-peer trading: A techno-economic assessment. Sustain. Energy Grids Netw. 2023, 34, 101059. [Google Scholar] [CrossRef]
- Ben Slama, S.; Mahmoud, M. A deep learning model for Intelligent Home Energy Management System using renewable energy. Eng. Appl. Artif. Intell. 2023, 123, 106388. [Google Scholar] [CrossRef]
- Ben Slama, S. Prosumer in smart grids based on Intelligent edge computing: A review on Artificial Intelligence Scheduling Techniques. Ain Shams Eng. J. 2022, 13, 101504. [Google Scholar] [CrossRef]
- Ben Slama, S. Design and implementation of Home Energy Management System using vehicle to home (H2V) approach. J. Clean. Prod. 2021, 312, 127792. [Google Scholar] [CrossRef]
- Seo, S.-K.; Yun, D.-Y.; Lee, C.-J. Design and optimization of a hydrogen supply chain using a centralized storage model. Appl. Energy 2020, 262, 114452. [Google Scholar] [CrossRef]
- Gbadega, P.A.; Sun, Y. Centralized peer-to-peer transactive energy market approach in a prosumer-centric residential smart grid environment. Energy Rep. 2022, 8, 105–116. [Google Scholar] [CrossRef]
- Yang, Y.; Hu, W.; Chen, X.; Cao, G. Energy-aware CPU frequency scaling for mobile video streaming. IEEE Trans. Mob. Comput. 2019, 18, 2536–2548. [Google Scholar] [CrossRef]
- Zakeri, B.; Gissey, G.C.; Dodds, P.E.; Subkhankulova, D. Centralized vs. distributed energy storage—Benefits for residential users. Energy 2021, 236, 121443. [Google Scholar] [CrossRef]
- Jiang, Y.; Zhou, K.; Lu, X.; Yang, S. Electricity trading pricing among prosumers with game theory-based model in Energy Blockchain Environment. Appl. Energy 2020, 271, 115239. [Google Scholar] [CrossRef]
- Talari, S.; Khorasany, M.; Razzaghi, R.; Ketter, W.; Gazafroudi, A.S. Mechanism design for decentralized peer-to-peer energy trading considering heterogeneous preferences. Sustain. Cities Soc. 2022, 87, 104182. [Google Scholar] [CrossRef]
- Sheikh, M.A.; Kamuni, V.; Fulpagare, M.; Suryawanshi, U.; Wagh, S.; Singh, N.M. Blockchain-based decentralized, flexible, and transparent energy market. In Flexibility in Electric Power Distribution Networks; CRC Press: Boca Raton, FL, USA, 2021; pp. 233–253. [Google Scholar]
- Mukherjee, M.; Hardy, T.; Fuller, J.C.; Bose, A. Implementing multi-settlement decentralized electricity market design for transactive communities with Imperfect Communication. Appl. Energy 2022, 306, 117979. [Google Scholar] [CrossRef]
- Zhao, X.; Li, L.; Tao, Y.; Lai, S.; Zhou, X.; Qiu, J. Aggregated operation of heterogeneous small-capacity distributed energy resources in peer-to-peer energy trading. Int. J. Electr. Power Energy Syst. 2022, 141, 108162. [Google Scholar] [CrossRef]
- Zhou, Y.; Lund, P.D. Peer-to-peer energy sharing and trading of renewable energy in Smart Communities ─ trading pricing models, decision-making and agent-based collaboration. Renew. Energy 2023, 207, 177–193. [Google Scholar] [CrossRef]
- Mahmood, D.; Javaid, N.; Ahmed, G.; Khan, S.; Monteiro, V. A review on optimization strategies integrating renewable energy sources focusing uncertainty factor—Paving path to eco-friendly smart cities. Sustain. Comput. Inform. Syst. 2021, 30, 100559. [Google Scholar] [CrossRef]
- Aygun, B.; Gunel Kilic, B.; Arici, N.; Cosar, A.; Tuncsiper, B. Application of binary PSO for Public Cloud Resources Allocation System of Video on Demand (VOD) services. Appl. Soft Comput. 2021, 99, 106870. [Google Scholar] [CrossRef]
- Alsenani, T.R. The participation of electric vehicles in a peer-to-peer energy-backed token market. Int. J. Electr. Power Energy Syst. 2023, 148, 109005. [Google Scholar] [CrossRef]
- Bellos, E.; Iliadis, P.; Papalexis, C.; Rotas, R.; Nikolopoulos, N.; Kosmatopoulos, E.; Halmdienst, C. Dynamic investigation of centralized and decentralized storage systems for a district heating network. J. Energy Storage 2022, 56, 106072. [Google Scholar] [CrossRef]
- Zhang, F.; Yang, Q.; Li, D. A deep reinforcement learning-based bidding strategy for participants in a peer-to-peer energy trading scenario. Front. Energy Res. 2023, 10, 1017438. [Google Scholar] [CrossRef]
- Zhou, Y.; Wu, J.; Song, G.; Long, C. Framework design and optimal bidding strategy for ancillary service provision from a peer-to-peer energy trading community. Appl. Energy 2020, 278, 115671. [Google Scholar] [CrossRef]
- Zhou, Y.; Liu, J. Agent-based peer-to-peer energy trading between prosumers and consumers with cost-benefit business models. In Sustainable Developments by Artificial Intelligence and Machine Learning for Renewable Energies; Elsevier: Amsterdam, The Netherlands, 2022; pp. 273–289. [Google Scholar]
- Wang, Z.; Yu, X.; Mu, Y.; Jia, H.; Jiang, Q.; Wang, X. Peer-to-peer energy trading strategy for Energy Balance Service Provider (EBSP) considering market elasticity in community microgrid. Appl. Energy 2021, 303, 117596. [Google Scholar] [CrossRef]
- Yaldız, A.; Gökçek, T.; Şengör, I.; Erdinç, O. Optimal Sizing and economic analysis of photovoltaic distributed generation with Battery Energy Storage System considering peer-to-peer energy trading. Sustain. Energy Grids Netw. 2021, 28, 100540. [Google Scholar] [CrossRef]
- Issi, F.; Kaplan, O. The Determination of Load Profiles and Power Consumptions of Home Appliances. Energies 2018, 11, 607. [Google Scholar] [CrossRef]
- Chen, Y.; Pei, W.; Xiao, H.; Ma, T. Incentive-compatible and budget balanced AGV mechanism for peer-to-peer energy trading in smart grids. Glob. Energy Interconnect. 2023, 6, 26–35. [Google Scholar] [CrossRef]
- Sahebi, H.; Khodoomi, M.; Seif, M.; Pishvaee, M.; Hanne, T. The benefits of peer-to-peer renewable energy trading and battery storage backup for local grid. J. Energy Storage 2023, 63, 106970. [Google Scholar] [CrossRef]
- Wang, J.; Li, L.; Zhang, J. Deep reinforcement learning for energy trading and load scheduling in residential peer-to-peer energy trading market. Int. J. Electr. Power Energy Syst. 2023, 147, 108885. [Google Scholar] [CrossRef]
- Pereira, H.; Gomes, L.; Vale, Z. Peer-to-peer energy trading optimization in energy communities using multi-agent deep reinforcement learning. Energy Inform. 2022, 5, S4. [Google Scholar] [CrossRef]
- Lopez, H.K.; Zilouchian, A. Peer-to-peer energy trading for photo-voltaic prosumers. Energy 2023, 263, 125563. [Google Scholar] [CrossRef]
- Hou, S.; Fujimura, S. Day-Ahead multi-objective microgrid dispatch optimization based on demand side management via particle swarm optimization. IEEJ Trans. Electr. Electron. Eng. 2022, 18, 25–37. [Google Scholar] [CrossRef]
- Mensin, Y.; Ketjoy, N.; Chamsa-ard, W.; Kaewpanha, M.; Mensin, P. The P2P energy trading using maximized self-consumption priorities strategies for sustainable microgrid community. Energy Rep. 2022, 8, 14289–14303. [Google Scholar] [CrossRef]
- Wang, J.X.; Kurth-Nelson, Z.; Kumaran, D.; Tirumala, D.; Soyer, H.; Leibo, J.Z.; Hassabis, D.; Botvinick, M. Prefrontal cortex as a meta-reinforcement learning system. Nat. Neurosci. 2018, 21, 860–868. [Google Scholar] [CrossRef]


Disclaimer/Publisher’s Note: The statements, opinions and data contained in all publications are solely those of the individual author(s) and contributor(s) and not of MDPI and/or the editor(s). MDPI and/or the editor(s) disclaim responsibility for any injury to people or property resulting from any ideas, methods, instructions or products referred to in the content. |
© 2024 by the authors. Licensee MDPI, Basel, Switzerland. This article is an open access article distributed under the terms and conditions of the Creative Commons Attribution (CC BY) license (https://creativecommons.org/licenses/by/4.0/).