Abstract
With the rapid development of information technology, the complexity of data networks is increasing, especially in electric power systems, where data security and privacy protection are of great importance. Throughout the entire distribution process of the supply chain, it is crucial to closely monitor the propagation paths and dynamics of electrical data to ensure security and quickly initiate comprehensive traceability investigations if any data tampering is detected. This research addresses the challenges of data network complexity and its impact on the security of power systems by proposing an innovative data network propagation path tracing model, which is constructed based on graph convolutional networks (GCNs) and the BERT model. Firstly, propagation trees are constructed based on the propagation structure, and the key attributes of data nodes are extracted and screened. Then, GCNs are utilized to learn the representation of node features with different attribute feature combinations in the propagation path graph, while the Bidirectional Encoder Representations from Transformers (BERT) model is employed to capture the deep semantic features of the original text content. The core of this research is to effectively integrate these two feature representations, namely the structural features obtained by GCNs and the semantic features obtained by the BERT model, in order to enhance the ability of the model to recognize the data propagation path. The experimental results demonstrate that this model performs well in power data propagation and tracing tasks, and the data recognition accuracy reaches 92.5%, which is significantly better than the existing schemes. This achievement not only improves the power system’s ability to cope with data security threats but also provides strong support for protecting data transmission security and privacy.
1. Introduction
With the rapid development of information technology, data networks have become increasingly complex, where nodes represent entities (such as users, websites, or devices), and edges represent the relationships or connections between them [1]. Data networks not only contain rich attribute information but also entail complex interrelationships. As data networks continue to evolve and expand, the scale of networks is growing exponentially, leading to increasingly complex topological structures and a greater variety of propagation paths becoming more challenging to predict. Especially in electric power systems, security and privacy protection of data are paramount. This is because the derived data may be subject to illegal tampering and could be entirely disconnected from the original data, which poses a serious threat to the normal operation of power systems [2].
The technology of data provenance originated in the 1990s, based on recorded provenance data to trace the origin and generation process of data [3]. With this technology, we can trace the source of a specific object, verify its authenticity, or gain a comprehensive understanding of the details of the object being traced. Traditional data provenance systems mostly adopt a centralized storage model, where the database primarily stores and maintains the current state of the data. The historical information and processing steps of the data are usually recorded in the database logs, mainly for fault recovery, and do not directly provide query services [4]. In the power system, recording the data propagation path through provenance data is a common practice, but it requires a significant investment of human resources and financial resources for maintenance. Moreover, provenance data themselves are also data. Without proper protective measures, they may be subject to accidental damage, tampering, or deletion, which can compromise the accuracy of the data and thus lose the significance of data provenance [5]. Amidst rapid information flow, traditional traceability methods are too slow and laborious for querying and tracing. There is an urgent need for a new method to swiftly verify data authenticity and reliability.
Traditional methods based on rules or models often overlook the role of propagating users in the data dissemination process. Relying solely on text features or propagation structure features for path tracing may result in unsatisfactory performance. Therefore, it is necessary to deeply explore the potential patterns and patterns in the data network to improve performance.
Rumor detection research is dedicated to identifying and curbing the spread of false information to maintain the credibility and security of information online [6]. The idea of identifying tampered data through transmission path and data content can be applied to ensure the accurate and secure transmission of data in power systems.
In order to better understand and analyze the propagation paths of data in complex networks, researchers have begun to explore advanced algorithms that can capture and utilize complex structures and attribute information. Graph convolutional networks (GCNs) [7] have become a research hotspot in this field due to their unique advantages in handling graph-structured data.
This paper proposes a data network propagation path tracing (DNPPT) model based on graph convolutional networks (GCNs) and the BERT model [8]. It integrates the features of propagation structures and utilizes GCNs to learn representations of propagating users and structures. The model combines original text features and propagation structure features to better capture the relationships and characteristics among nodes in the data propagation network. Our experimental results demonstrate that the application of this model enables the electric power system to trace data propagation paths more accurately and promptly detect and respond to potential data security threats.
2. Related Work
In the field of data propagation research, rumor detection in social networks has made significant contributions. Rumor detection studies aim to identify and mitigate the spread of false information, thereby maintaining the credibility and security of the networks. Some studies focus on detecting rumors based on textual content [9,10,11,12,13,14]. For example, Liang et al. [15] proposed a rumor detection method, which uses a hybrid neural network enhanced by the BERT model. This approach utilizes the BERT model to vectorize text as input to the model, employing the learned vectors for rumor detection.
Xu et al. [13] proposed a topic-driven rumor detection model that employs convolutional neural networks [9] (CNNs) to extract key thematic information from textual content and integrate it with the content’s semantic information, thereby enhancing the accuracy of rumor identification.
Other researchers model the propagation structure of rumors as propagation trees [16,17] or propagation graphs [17,18,19,20]. They consider global forwarding relationships based on both propagation structure and content for rumor detection, achieving favorable detection outcomes. Ou et al. [21] developed a heterogeneous graph attention network, BGHGAN, that integrates the BERT model and GNNs for early rumor detection. By leveraging the BERT model’s deep semantic understanding and GNNs’ capability to capture complex relationships, the method enhances feature integration using graph attention mechanisms, significantly improving the accuracy and efficiency of early rumor identification.
Researchers have begun to apply the experiences and techniques from rumor detection research in social networks to a broader field of data tracing. In particular, in the field of data propagation, GCNs have been introduced as a critical tool for handling graph-structured data. GCNs have demonstrated excellent performance in tasks such as node classification, graph classification, and graph signal processing. They are capable of effectively capturing the complex relationships between nodes in data networks and facilitating adaptive aggregation, thereby maintaining node features. With GCNs, researchers can conduct more in-depth and comprehensive analyses of data networks across various domains, including social networks [9,10,11,12,13,18], recommendation systems [22,23], bioinformatics [24], and traffic networks [25,26].
Additionally, multi-feature fusion techniques enhance the expressive power of GCNs by integrating feature information from different perspectives. In the context of data network propagation path tracing, this implies the ability to simultaneously consider multiple attributes of nodes and various relationships between edges, thereby obtaining a more comprehensive network representation. For instance, FastGCN [27] optimizes the training process of GCNs through importance sampling, indicating that carefully designed feature fusion strategies can significantly improve learning efficiency while maintaining predictive performance.
Chen et al. proposed a learnable graph convolutional network and feature fusion framework (LGCNs-FF) [28], which jointly trains feature fusion networks and learnable graph convolutional networks. This framework simultaneously learns features from multi-view data and graph structural information to enhance semi-supervised classification performance.
In the realm of data network propagation path tracing, researchers have explored various methods to enhance the performance of GCNs. One approach involves improving the information propagation mechanism, such as substituting the traditional “Sink→Source” mode with the “Source→Sink” mode to simulate the propagation process of information in the graph more effectively. This method has been applied in the Flow Graph Network (FlowGN) [29] framework, which precisely defines information flow paths, thereby enhancing the efficiency and flexibility of information propagation.
Through GCNs, researchers can efficiently learn representations of complex data networks and analyze information propagation, thereby revealing the flow paths and propagation patterns of data in the network. Against this backdrop, this paper proposes a data network propagation path tracing model based on GCNs and the BERT model, which integrates original text features, user propagation features, and propagation structure features. The aim is to achieve efficient tracing of data network propagation paths and precise data provenance localization. Initially, this study constructs a propagation graph based on the propagation structure and user propagation, using combinations of multiple user attributes as propagation node features. Subsequently, multiple graph convolutional networks are employed to learn representations of the propagation graph under different combinations of user attributes. Finally, leveraging the strong performance of the BERT model in extracting deep semantic features from text, original text content features are learned using the BERT model and fused with the features learned from the graph convolutional networks to achieve data propagation path tracing.
3. Proposed Method
Electricity data not only contain sensitive customer privacy information but also constitute highly confidential data within the power company. Any tampering behavior during data transmission may pose a serious threat to the security of the system [30]. Therefore, accurately tracing and pinpointing the source of tampering behavior is crucial. In response to this demand, we have designed an innovative model named data network propagation path tracing (DNPPT), which integrates multi-feature analysis techniques from GCNs and the BERT model [31].
The essence of the DNPPT approach is to create a propagation graph for electricity. Based on this graph, structural features of data propagation are captured through the GCN module. Simultaneously, the BERT model extracts semantic information from the electricity data text. By effectively integrating these two types of feature vectors, our method can provide an analytical basis for the decision module to accurately determine whether the data have been tampered with during the network propagation process.
The DNPPT framework consists of three key components: the GCN module, the BERT module, and the decision module. The system workflow is illustrated in Figure 1: first, the system constructs a propagation graph based on the transmission paths of electricity data. Then, the GCNs module is tasked with extracting key feature information from the graph. Meanwhile, the BERT module conducts an in-depth analysis of the textual data from the power data, extracting rich semantic features. Finally, the system integrates the feature vectors extracted from both modules into a multi-feature fusion vector, which is the input to the decision module for comprehensive analysis to determine the integrity and authenticity of the data.
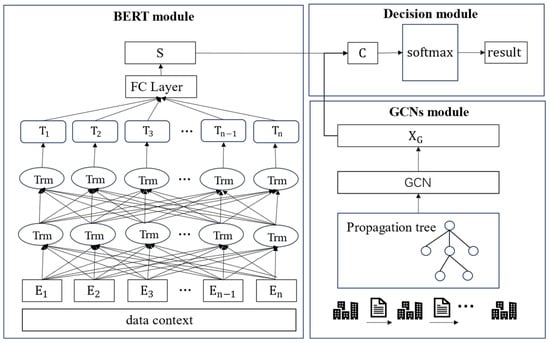
Figure 1.
DNPPT architecture diagram.
3.1. GCN Module
The core principle of graph convolutional neural networks is to update node feature vectors by learning the propagation of information between nodes [1]. Specifically, GCNs iteratively aggregate information from the node itself and its neighboring nodes to generate a new feature vector for the node. This section will introduce the specific process of using graph convolutional neural networks to extract feature vectors from the propagation graph.
3.1.1. Construction of the Propagation Graph
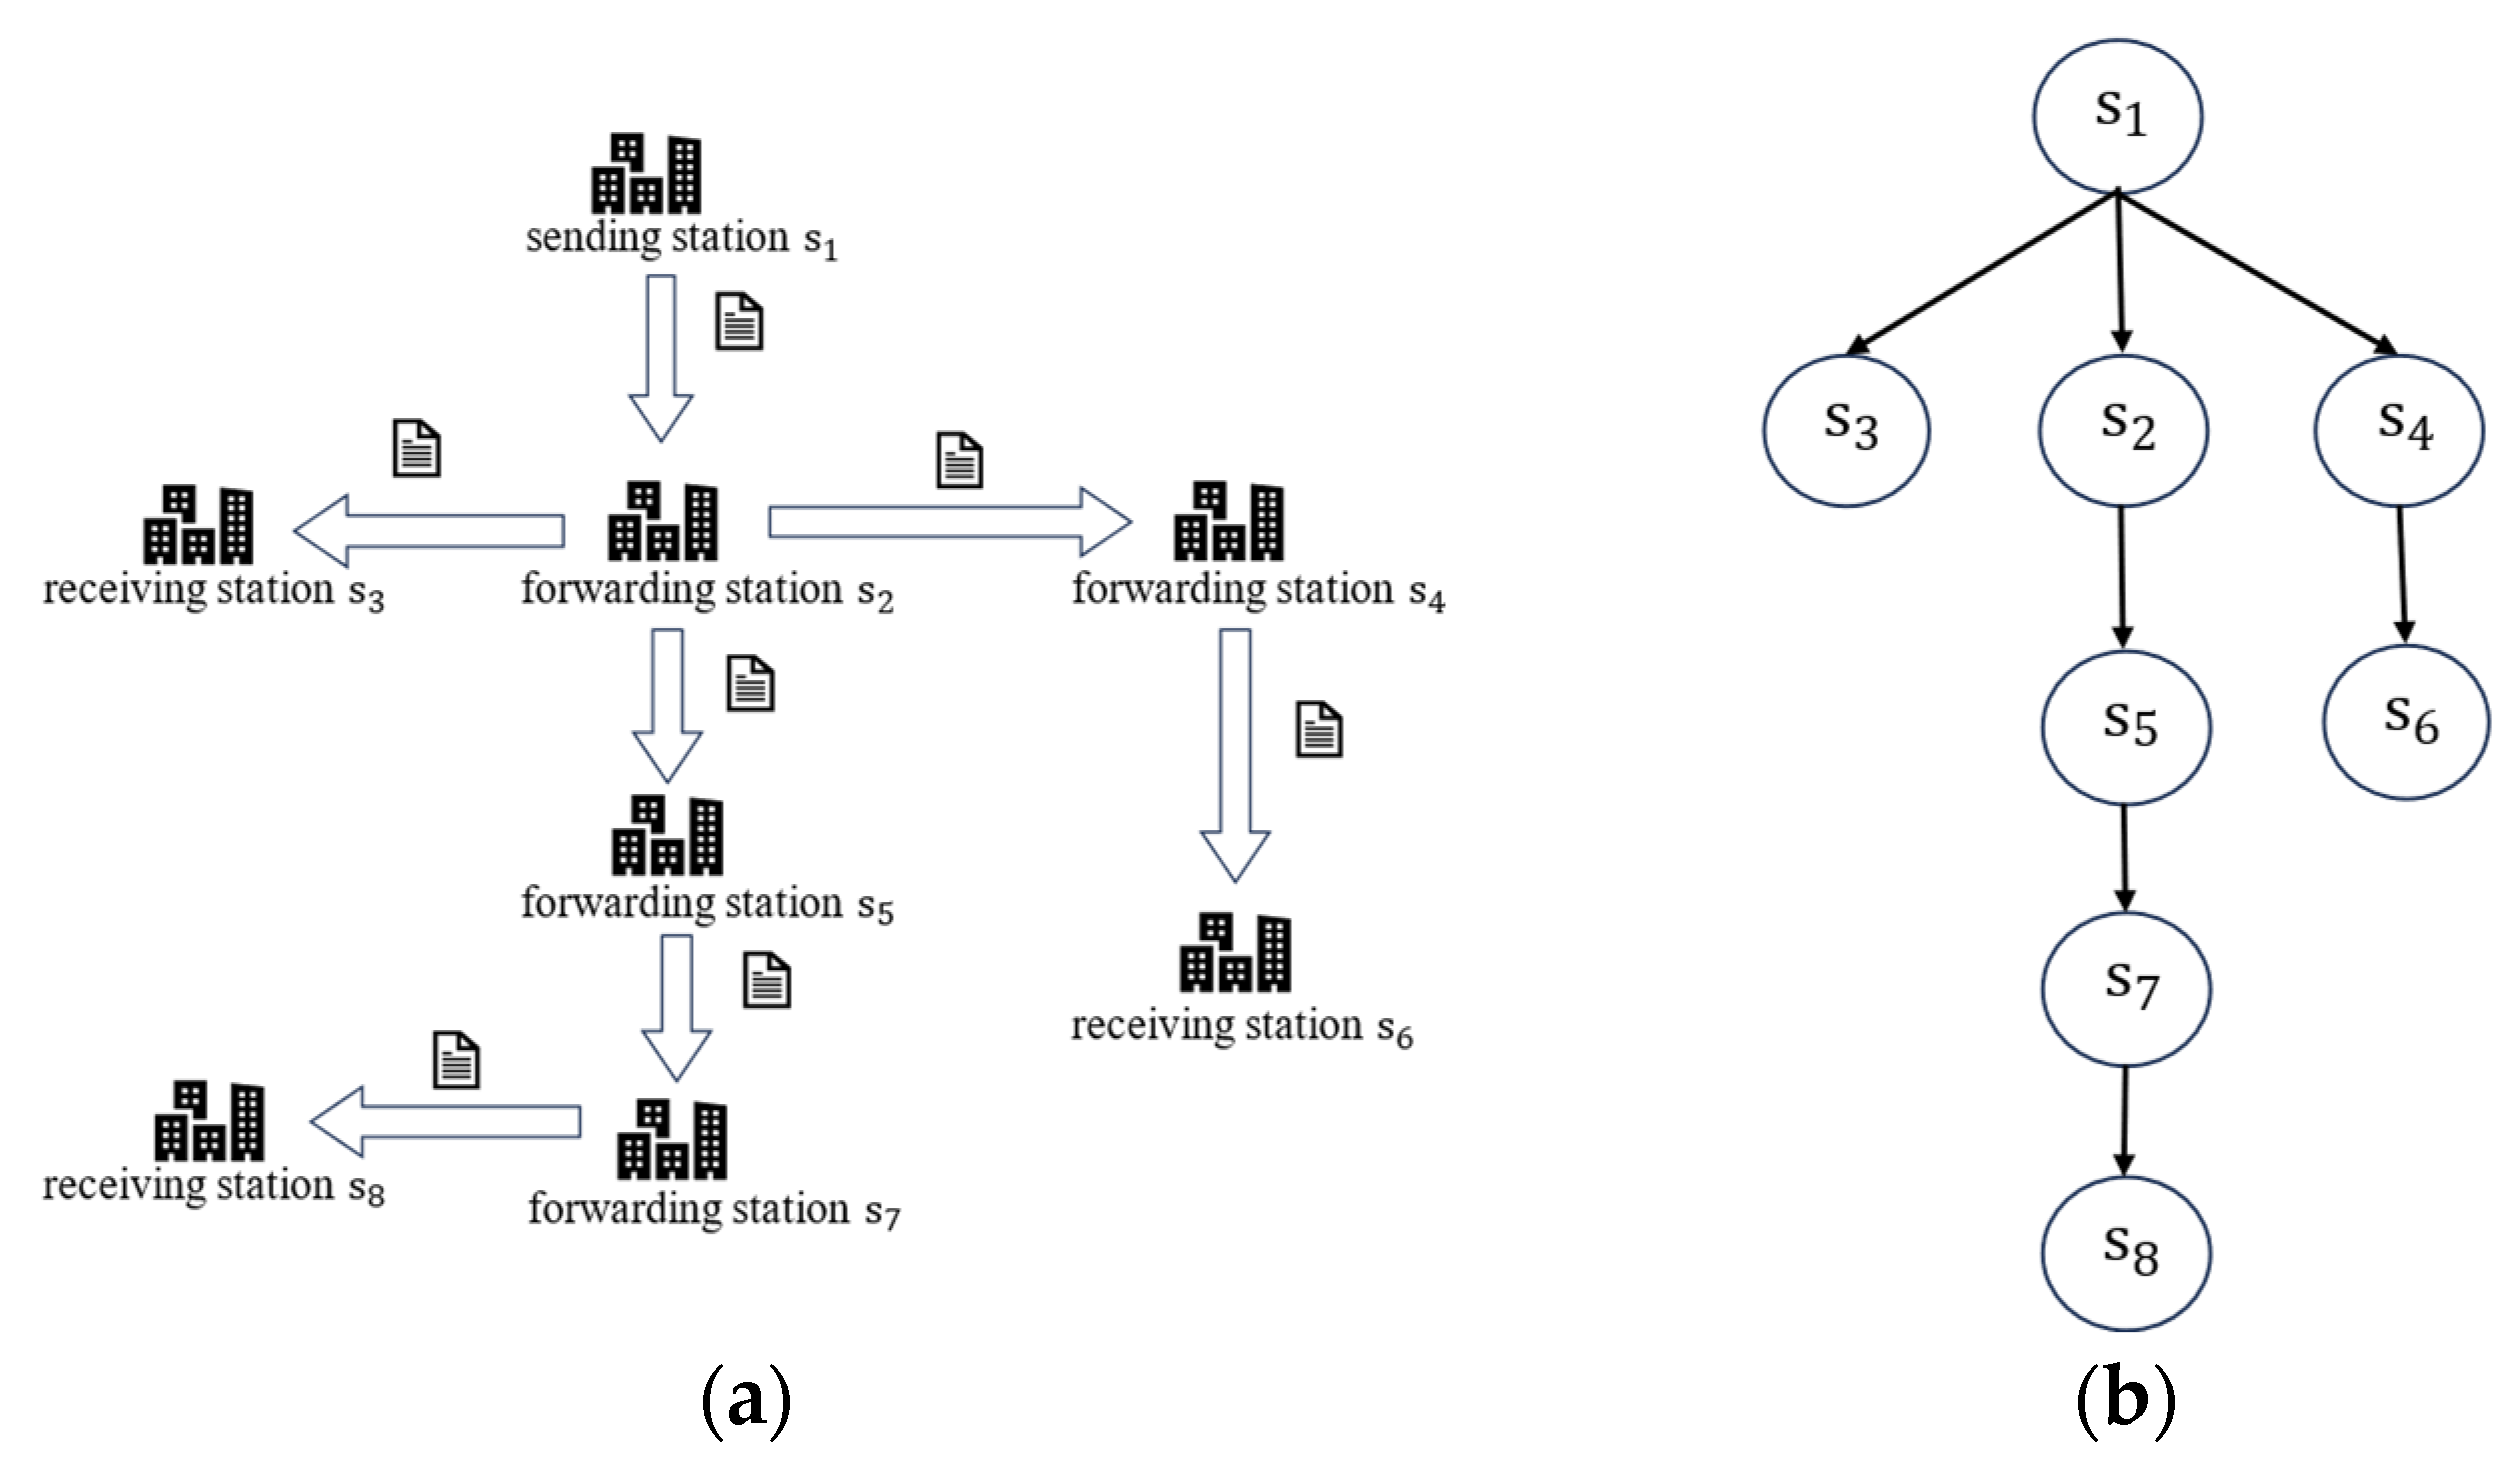
Before reaching the destination site, electricity data may pass through multiple intermediate stations [32], where new data information could be added to the original data. The propagation path of data in the network forms a tree-like structure, which is also referred to as a propagation tree. Based on this, we constructed the propagation graph of electricity data, where the root node represents the initial forwarding point of the data, and other nodes represent the new data generated after passing through intermediate stations.
Suppose there exists an electric power dataset , where represents the original data information and represents the data information transmitted through the -th transit station. denotes the number of transit stations the data pass through during propagation. For each data at a transit station, it consists of a set of elements, i.e., , where is the data transmitted from the -th transit station and indicates the -th transit station through which data passes. DNPPT classifies the electric power data information into two categories: tampered and untampered. Each data can be labeled with a category tag , where is the set of all possible category tags, and , where 0 denotes untampered and 1 denotes tampered. The task of determining whether the data have been tampered with or not can be abstracted as learning a mapping function . This function can map each data point to its corresponding category tag .
Based on the propagation relationship of data , we constructed a propagation graph . In this graph, is an undirected graph, where the vertex set represents the transit stations through which the forwarded data passes. The edge set represents all edges in the propagation graph. Figure 2 illustrates an instance of the propagation graph corresponding to a specific data forwarding process. We define an adjacency matrix , which details the connectivity between nodes in the graph. The elements of this adjacency matrix are given by Equation (1).
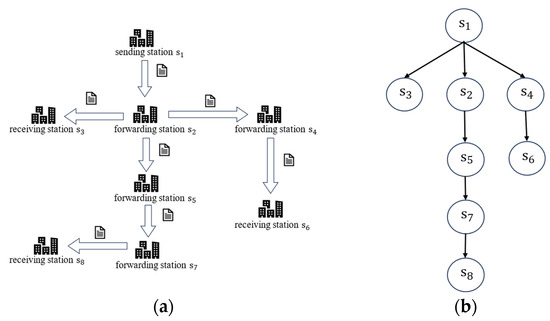
Figure 2.
Construction method diagram of the propagation graph in the power data forwarding scenario: (a) forwarding diagram and (b) propagation tree.
3.1.2. Feature Vectors of the Propagation Graph
After constructing the propagation graph, we employed GCNs for feature extraction from the graph. GCNs utilize information from adjacent nodes to update the hidden layer information of each node. The input to this process mainly consists of two parts [33]: one is the feature matrix of the nodes and the other is the adjacency matrix describing the connections between nodes. In a multi-layer GCN model, by recursively aggregating features from a broader set of neighboring nodes, we can generate a more enriched and exhaustive feature representation, thus providing nodes with deeper semantic information. In a multi-layer GCN model, aggregating feature information from more adjacent nodes can result in a richer feature matrix. Therefore, the feature matrix of the -th hidden layer in the GCN is calculated as shown in Equation (2).
In the equation, represents the feature matrix after the graph convolution operation, where denotes the activation function, represents the learnable parameters, and denotes the number of layers in the graph convolution operation. represents the normalization of the information propagated to neighbors, and the normalized adjacency matrix is shown in Equation (3).
GCNs typically add self-connections when updating theirown nodes, combining the features of the node itself and its neighbors to update the node, as shown in Equation (4).
In the equation, represents the degree matrix corresponding to the propagation graph, defined as . After five graph convolution operations, the feature matrix is obtained. To prevent overfitting and reduce the size of the parameter matrix, an average pooling layer is added after the graph convolution operation. The updated feature vector is represented as:
3.2. BERT Module
Power data contain rich privacy information, and the BERT model is capable of extracting this information, thereby obtaining deeper features. In this study, we utilized a pre-trained BERT model [34] to learn and extract subtle semantic information from the text data in the power dataset.
3.2.1. Word Embedding Layer
The input of the BERT model consists of three embedding layers: Token Embeddings, Segment Embeddings, and Position Embeddings. Through these embedding layers, the BERT model can transform the text data of power data into vectors with rich semantic information. We represent power data text of length as , where represents the -th word in the original text . After inputting , we obtain word vectors , text vectors , and position vectors . These three vectors are stacked together to form a new vector , which can be represented as:
3.2.2. Encoding Layer
The task of the encoding layer is to encode the vectors generated by the token embedding layer into sequence vectors containing contextual information. The BERT model’s internal structure utilizes the encoder part of the Transformer [34], where each encoder consists mainly of a multi-head attention mechanism and feedforward neural network. Through the multi-head attention mechanism, the BERT model’s can learn the contextual semantic information of the input text in parallel. Multi-head attention can be represented as:
In the equation, represents the number of heads in the multi-head attention mechanism, denotes the output of the -th head; , , and are obtained by linear transformation of the input feature matrix; and , , and are parameter matrices learned after training for , , and respectively.
Finally, the feature vectors learned in the multi-head attention layer are input into a fully connected feedforward neural network layer to obtain the semantic representation of the power text.
3.3. Decision Module
The decision module is essentially a classifier whose purpose is to learn the multi-feature vectors of the input power data and determine whether the data have been tampered with, thereby providing the corresponding classification labels.
To enhance the robustness of the entire network, we introduced two fully connected layers on top of the graph convolutional neural network (GCN), further integrating the feature information from the propagation graph to obtain the final feature vector. Then, we concatenated the propagation graph feature vector with the data text feature vector to form a multi-feature fusion vector, which serves as the input to the decision module.
The decision module mainly consists of fully connected layers, with a function used in the output layer for activation to generate the final classification probabilities.
In Equation (10), and are trainable parameters learned during training. The training objective of the model is to minimize the cross-entropy loss function, thereby reducing the error between the predicted labels and the true labels.
In Equation (11), k represents the number of categories for classification, denotes the model parameters, and represents the true label value.
4. Experimental Results
4.1. Experimental Dataset
The dataset utilized in this study was provided by the Southern Branch of the State Grid Customer Service Center. To comprehensively evaluate the performance of the data network propagation path tracing (DNPPT) model, the dataset encompasses 4000 sample data from multiple data stations. Each sample represents a unique data transmission event within the power network, with the total dataset size being approximately 5 GB, a capacity sufficient to capture a variety of data propagation scenarios.
The dataset is stored in structured formats such as CSV or JSON, based on the original transmission logs within the power grid. These logs meticulously document instances of data flow across nodes, including key information such as timestamps, source nodes, target nodes, and transmission metadata. Subsequently, a graph model of power data propagation will be constructed from these original logs.
To ensure that the propagation graph possesses complexity and diversity, the entire dataset was divided into 150 smaller dataset groups in this paper. Each group contains at least 15 to 20 data samples to reflect different data transmission patterns. Furthermore, these smaller datasets are divided into training and testing sets, with the training set comprising 100 of these smaller dataset groups and the testing set consisting of the remaining 50. This division scheme aims to provide the model with ample training and validation data to accurately assess its performance.
4.2. Performance Experiments of the DNPPT Model
In this study, we systematically trained the DNPPT model using the selected training set and evaluated its performance on the independent test set. The experimental results demonstrate the model’s commendable performance. In terms of model architecture, we set the number of layers of the graph convolutional network to 5 and the dimension of the hidden vector of each layer’s node to 256. To prevent overfitting, we incorporated a Dropout layer into the model. During the training process, we selected the Adam optimization algorithm, set the learning rate to 0.005, and specified 500 iterations to ensure the convergence and generalization ability of the model. Through the implementation of these strategies, we validated the efficiency and stability of the DNPPT model in data tracing tasks.
To comprehensively evaluate the performance of our proposed DNPPT solution, we selected several existing methods for comparative analysis:
- DTC: A decision tree classification model proposed in [35], which is based on manually designed statistical features to determine the credibility of information;
- LSTM: A Long Short-Term Memory (LSTM) model used in [36], which captures the overall dynamic changes in information propagation to identify the authenticity of information;
- Bi-GCN: A Bi-directional Graph Convolutional Network (Bi-GCN) proposed in [17], used for tracing and detecting rumor posts in social networks.
We conducted experiments using a dataset provided by the State Grid Corporation of China and measured the accuracy, precision, recall, and F1-score of the above schemes. The specific results are detailed in Table 1.

Table 1.
Experiment results table.
In this study, data samples that have not been tampered with are defined as genuine data samples. Accuracy represents the overall predictive ability of the model and is the proportion of data samples correctly classified by the model relative to the total number of samples. Precision indicates the proportion of samples that the model identifies as genuine data out of the actual genuine data samples. Recall signifies the proportion of tampered data samples correctly identified by the model out of all the actual tampered data samples. F1-score is used to provide a comprehensive assessment of the model’s performance on both precision and recall metrics.
4.3. Generalization Ability of the DNNPT Model
The experimental results indicate that DNPPT outperforms other comparative schemes on three key metrics: accuracy, precision, and recall. Specifically, the accuracy rate achieved by DNPPT reached 92.5%, and the F1 = score reached 95.6%. These results suggest that the DNPPT model is fundamentally capable of correctly predicting the data transmission paths and making accurate judgments on the authenticity of the data.
To comprehensively evaluate the generalization ability of the DNPPT model, we conducted tests on another dataset. Considering the relatively small scale of this dataset, we made appropriate adjustments to the parameters of the GCN model, setting the dimension of the hidden vectors d to 128 and reducing the number of layers to three. We conducted comparative experiments using models such as DTC and SVM, and the results are shown in Table 2. The experimental results demonstrate that DNPPT exhibits good performance across different datasets.
Table 2.
Comparative performance results table.
4.4. Ablation Experiment
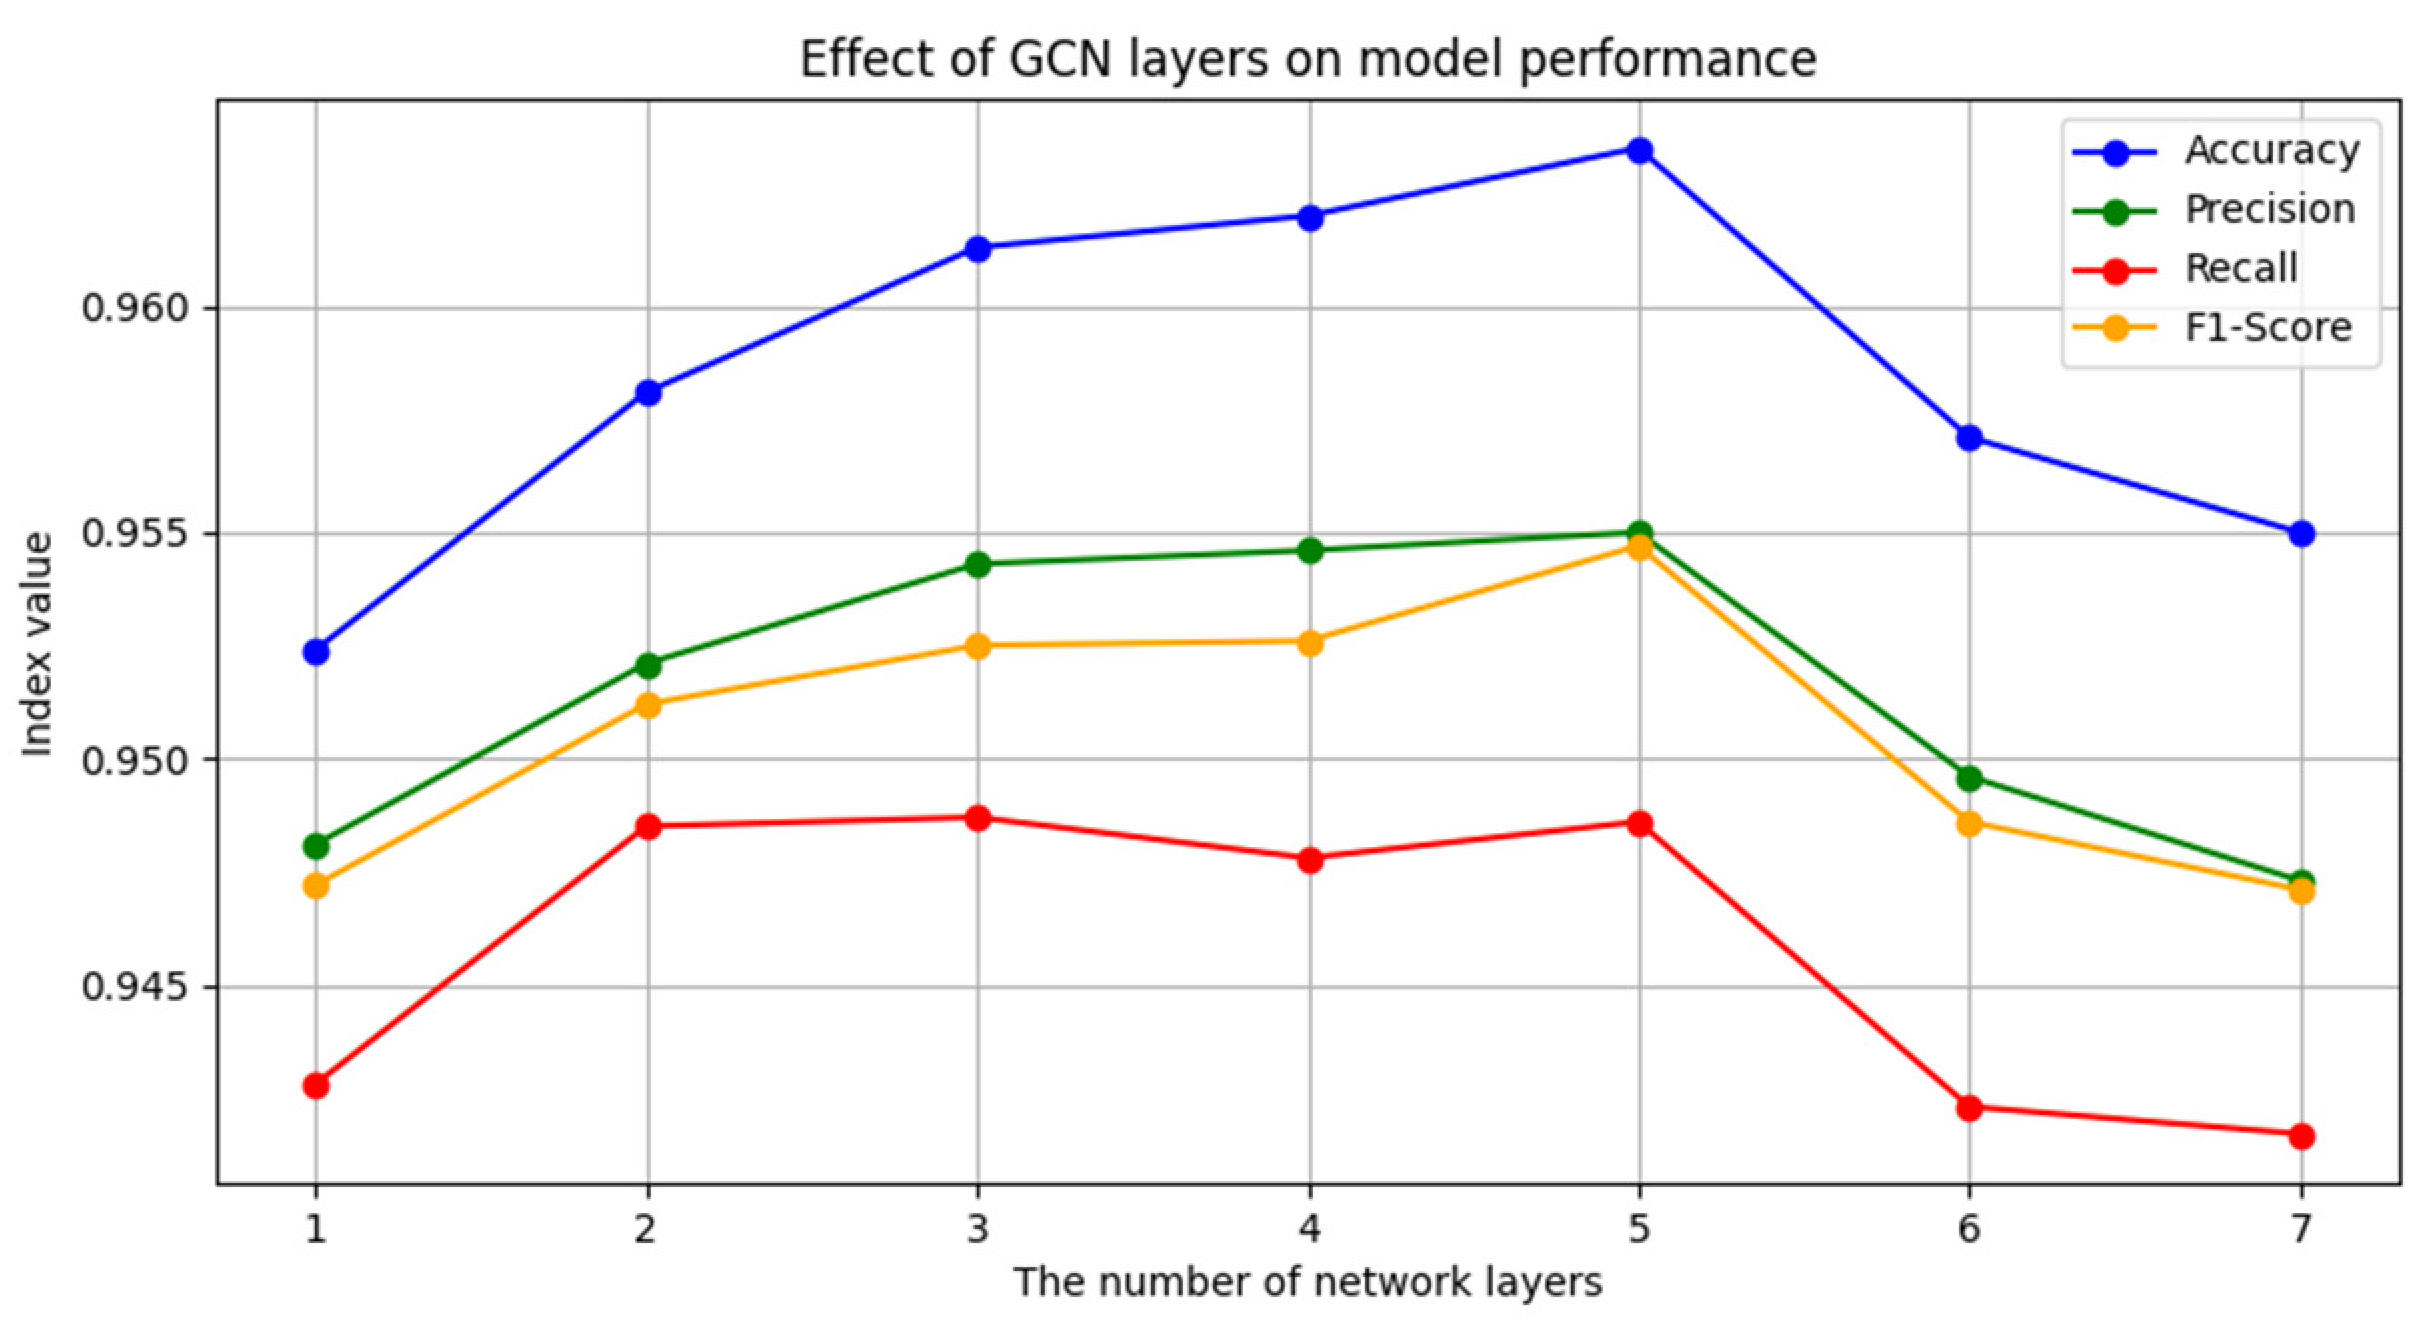
In the graph convolutional neural network (GCN) model, the number of network layers can influence the model’s performance to a certain extent. However, research [37] has shown that excessively increasing the number of network layers may lead to a decrease in performance. Therefore, we conducted an experiment to investigate the specific impact of different numbers of layers on the performance of the DNPPT model. To this end, we set up GCN models with layers ranging from one to seven and observed the corresponding effects of these layers on the model’s performance.
In the experiment, we trained models with different numbers of layers on the same dataset to evaluate their final impact. The experimental results demonstrate that when the number of layers in the GCN model is set to five, the DNPPT model achieves optimal performance in terms of accuracy and recall. The experimental results are depicted in Figure 3. This result confirms the rationale for selecting a five-layer GCN as the model architecture in this study. Additionally, with a further increase in the number of layers, the number of model parameters also increases, which may lead to overfitting and consequently a decrease in classification performance. This phenomenon is particularly evident when the number of layers is six or seven, as all evaluation metrics exhibit a downward trend at this point.
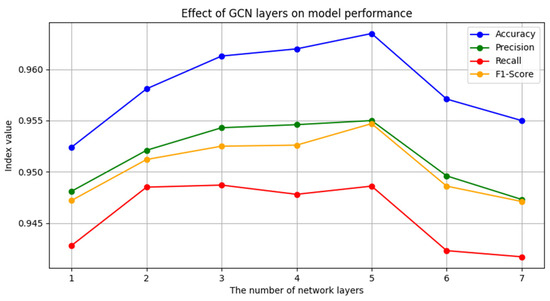
Figure 3.
The effect of the number of GCN layers on model performance.
5. Discussion
5.1. Risks
The proposed data network propagation path tracing (DNPPT) model, which integrates GCNs and the BERT model, demonstrates significant potential in tracing data propagation paths within electric power systems. However, there is a risk of misuse of this technology, such as it being potentially used by malicious attackers to obtain sensitive information from power grid customers. Therefore, the implementation of robust data security measures is crucial, including data encryption, access control, and strict usage protocols to effectively limit unauthorized access and potential misuse.
Moreover, machine learning models may generate false positives or false negatives when processing complex data [38], which can lead to bad judgments and decisions. Therefore, we recommend conducting thorough model validation and testing before system deployment to ensure its stability and reliability. It can also be combined with the judgment of human experts to verify and supplement the model output.
Finally, it is recommended to adopt a gradual approach during the actual deployment process, which can be evaluated through small-scale pilot and iterative optimization and then gradually expand the deployment. In this way, potential risks can be identified and mitigated, ensuring the security of the system and the privacy of user data.
5.2. Interpretability
In addition, due to the operational characteristics of GCNs on high-dimensional graph data, their decision-making process is often difficult to interpret [39]. This issue is particularly critical in areas such as power plant management, where regulatory bodies in many countries require decision outcomes to be explainable. Stakeholders need to understand the basis of the model’s decisions to ensure that these decisions are reasonable and compliant with relevant regulations. Therefore, addressing the opacity of GCNs to meet compliance requirements is a key focus of this study. To address the interpretability challenges of GCNs, this paper suggests the following strategies:
- Conducting feature importance analysis allows for the identification of the most significant features or nodes contributing to the model’s predictions [40]. By understanding which inputs have the greatest impact on the model’s decisions, stakeholders can better comprehend the decision-making process, thereby enhancing the model’s interpretability.
- Techniques such as attention mechanisms [41] can be utilized to generate node-level explanations within GCNs. These mechanisms highlight the most influential nodes or connections within the graph, providing a clearer picture of how the model processes information and making the model’s operations more transparent.
- Additionally, post hoc explanation methods, such as SHAP (SHapley Additive exPlanations) [42] or LIME (Local Interpretable Model-agnostic Explanations) [43], can be applied to GCNs. These methods approximate the model’s behavior around specific data points to provide explanations for individual predictions, enabling even complex GCN models to achieve a certain degree of interpretability in specific cases.
In the power industry, regulatory requirements typically mandate that decision-making processes be transparent and interpretable. This paper posits that the strategies outlined above can help address the interpretability challenges of the DNPPT model to a certain extent, thereby meeting compliance requirements. Furthermore, while enhancing interpretability is crucial, it is also important to balance it with model accuracy. Over-simplifying the model in the pursuit of interpretability may lead to a decrease in performance. Therefore, the key lies in finding a compromise that allows the model to maintain a high level of accuracy while also providing sufficient interpretability, thereby ensuring that it can offer reliable and compliant decision support in practical applications.
6. Conclusions
Ensuring the integrity and authenticity of electricity data during their circulation and propagation is crucial. To effectively detect and determine whether electricity data have been tampered with, this study proposes an innovative model named the data network propagation path tracing (DNPPT) model. The DNPPT model integrates GCNs and the BERT model, extracting not only the structural features of electricity data propagation but also delving deep into the semantic information within the data text. Through multi-feature fusion techniques, the model enhances the accuracy of detecting electricity data tampering. Our experimental results demonstrate that DNPPT can better utilize the overall characteristics in the electricity data propagation process, enabling more effective extraction of key textual features from electricity data.
Although the DNPPT method has demonstrated promising performance, there is still room for improvement. In future research, we plan to focus on exploring the following two directions for improvement:
- Further exploration and analysis of more information about electricity data during the propagation process, by combining electricity data text information to construct multimodal models to further enhance the accuracy and reliability of detecting electricity data;
- In-depth analysis of patterns of data tampering and changes to achieve more accurate data tracing.
Author Contributions
Methodology, D.J., Y.Y., R.F. and Y.L.; Software, D.J.; Validation, D.J.; Investigation, Y.Y., Z.G. and H.J.; Writing—original draft, D.J. and Y.Y.; Writing—review & editing, Z.G., R.F., Y.L. and H.J.; Supervision, Z.G. All authors have read and agreed to the published version of the manuscript.
Funding
This study was supported by the State Grid Jiangsu Electric Power Co., Ltd. Research Institute. The project name is: Research on software supply chain data security risk assessment and traceability tracing technology (Grant No. J2023181).
Data Availability Statement
Due to company privacy policies, we are unable to publicly share the dataset used in our research. The data contains sensitive information that must remain confidential.
Conflicts of Interest
Authors Dongsheng Jing, Yu Yang and Renjun Feng were employed by the company State Grid Suzhou Power Supply Company. Authors Zhimin Gu, Yan Li and Haitao Jiang were employed by the company State Grid Jiangsu Electric Power Co., Ltd. The remaining authors declare that the research was conducted in the absence of any commercial or financial relationships that could be construed as a potential conflict of interest.
References
- Dou, B.L.; Li, S.; Zhang, S.Y. Structural-Based Social Network Analysis. Chin. J. Comput. 2012, 35, 741–753. [Google Scholar] [CrossRef]
- Zhang, G.Y. Research on Data Tracing Technology Based on Blockchain. Ph.D. Thesis, Nanjing University of Posts and Telecommunications, Nanjing, China, 2019. [Google Scholar] [CrossRef]
- Ming, H.; Zhang, Y.; Fu, X.-H. Survey of Data Provenance. J. Chin. Comput. Syst. 2012, 33, 1917–1923. [Google Scholar]
- Li, X.M.; Wang, F.Y. Research on Data Provenance’s Security Model. J. Shandong Univ. Technol. 2010, 24, 57–64. [Google Scholar]
- Liu, J.P. Research on PROV Tracing Data Sharing Combined with Blockchain and Searchable Encryption. Doctoral Dissertation, Beijing University of Posts and Telecommunications, Beijing, China, 2023. [Google Scholar] [CrossRef]
- Gao, Y.J.; Liang, G.; Jiang, F.T.; Xu, C.; Yang, J.; Chen, J.R.; Wang, H. A Survey on Rumor Detection in Social Networks. Acta Electron. Sin. 2020, 48, 1421. [Google Scholar]
- Kipf, T.N.; Welling, M. Semi-Supervised Classification with Graph Convolutional Networks. In Proceedings of the 5th International Conference on Learning Representations, ICLR 2017, Toulon, France, 24–26 April 2017, Conference Track Proceedings; OpenReview.net: Red Hook, NY, USA, 2017. [Google Scholar]
- Devlin, J.; Chang, M.-W.; Lee, K.; Toutanova, K. BERT: Pre-Training of Deep Bidirectional Transformers for Language Understanding. Available online: https://aclanthology.org/N19-1423.pdf (accessed on 5 August 2024).
- Yamashita, R.; Nishio, M.; Do, R.K.G.; Togashi, K. Convolutional Neural Networks: An Overview and Application in Radiology. Insights Imaging 2018, 9, 611–629. [Google Scholar] [CrossRef]
- Ge, X.Y.; Zhang, M.S.; Wei, B.; Liu, J. Interpretable Rumor Detection Based on Dual Sentiment Perception. J. Chin. Inf. Process. 2022, 36, 129–138. [Google Scholar]
- Zhu, Y.; Wang, G.S.; Jin, W.W.; Huang, X.J.; Li, S. Web Rumor Detection Based on Text Semantic Enhancement and Comment Position Weighting [J/OL]. Explor. Comput. Sci. 2024, 1–15. Available online: http://kns.cnki.net/kcms/detail/11.5602.TP.20240410.2115.002.html (accessed on 4 August 2024).
- Alkhodair, S.A.; Ding, S.H.H.; Fung, B.C.M.; Liu, J. Detecting Breaking News Rumors of Emerging Topics in Social Media. Inf. Process Manag. 2020, 57, 102008. [Google Scholar] [CrossRef]
- Xu, F.; Sheng, V.S.; Wang, M. Near Real-Time Topic-Driven Rumor Detection in Source Microblogs. Knowl.-Based Syst. 2020, 207, 106391. [Google Scholar] [CrossRef]
- Chen, J.; Wu, Z.; Yang, Z.; Xie, H.; Wang, F.L.; Liu, W. Multimodal Fusion Network with Contrary Latent Topic Memory for Rumor Detection. IEEE MultiMedia 2022, 29, 104–113. [Google Scholar] [CrossRef]
- Liang, Z.J.; Dan, Z.P.; Luo, Y.C. Rumor Detection Based on Enhanced Hybrid Neural Network with BERT Model. Comput. Appl. Softw. 2021, 38, 147–152. [Google Scholar]
- Ma, J.; Gao, W.; Wong, K.-F. Rumor Detection on Twitter with Tree-Structured Recursive Neural Networks. In Proceedings of the 56th Annual Meeting of the Association for Computational Linguistics (Volume 1: Long Papers); Gurevych, I., Miyao, Y., Eds.; Association for Computational Linguistics: Melbourne, Australia, 2018; pp. 1980–1989. [Google Scholar] [CrossRef]
- Zhang, X.X.; Pan, S.L.; Mao, Q.J. Multi-Feature Rumor Detection Method Based on Propagation Tree. Acta Electron. Sin. 2024, 45, 1–10. [Google Scholar]
- Qiao, Y.H.; Jia, C.Y. Social Media Rumor Detection Based on Graph Self-Supervised Contrast Learning. J. Nanjing Univ. Nat. Sci. 2023, 59, 823–832. [Google Scholar]
- Wu, Z.; Pi, D.; Chen, J.; Xie, M.; Cao, J. Rumor Detection Based on Propagation Graph Neural Network with Attention Mechanism. Expert Syst. Appl. 2020, 158, 113595. [Google Scholar] [CrossRef]
- Bian, T.; Xiao, X.; Xu, T.; Zhao, P.; Huang, W.; Rong, Y.; Huang, J. Rumor Detection on Social Media with Bi-Directional Graph Convolutional Networks. arXiv 2020. [CrossRef]
- Ouyang, Q.; Chen, H.C.; Liu, S.X.; Wang, K.; Li, X. Early Rumor Detection Based on Bert-GNNs Heterogeneous Graph Attention Networks. Acta Electron. Sin. 2024, 52, 311–323. [Google Scholar]
- Ge, Y.; Chen, S.C. Graph Convolutional Networks for Recommendation Systems. J. Softw. 2020, 31, 1101–1112. [Google Scholar]
- Ying, R.; He, R.; Chen, K.; Eksombatchai, P.; Hamilton, W.L.; Leskovec, J. Graph Convolutional Neural Networks for Web-Scale Recommender Systems. In Proceedings of the 24th ACM SIGKDD International Conference on Knowledge Discovery and Data Mining, London, UK, 19–23 August 2018; ACM: New York, NY, USA, 2018; pp. 974–983. [Google Scholar]
- Li, S.; Tang, S.; Li, F.; Qi, J.; Xiong, W. Progress in Biomedical Data Analysis Based on Deep Learning. Sheng Wu Yi Xue Gong Cheng Xue Za Zhi 2020, 37, 349–357. (In Chinese) [Google Scholar] [CrossRef] [PubMed] [PubMed Central]
- Dai, J.M.; Cao, Y.; Shen, Q.Q.; Shi, Q. Traffic Flow Forecasting Based on Multi-Space-Time Graph Convolutional Networks. Appl. Res. Comput. 2022, 39, 3. [Google Scholar]
- Zhang, J.; Chen, Y.; Panchamy, K.; Jin, G.Y.; Wang, C.C.; Yang, L.X. Urban Rail Transit Network-Level Multi-Step Short-Term Passenger Flow Spatiotemporal Comprehensive Forecasting Model Based on Attention Mechanism. J. Geo-Inf. Sci. 2023, 25, 698–713. [Google Scholar]
- Chen, J.; Ma, T.; Xiao, C. FastGCN: Fast Learning with Graph Convolutional Networks via Importance Sampling. 2018. Available online: https://openreview.net/forum?id=rytstxWAW (accessed on 5 August 2024).
- Chen, Z.; Fu, L.; Yao, J.; Guo, W.; Plant, C.; Wang, S. Learnable Graph Convolutional Network and Feature Fusion for Multi-View Learning. Inf. Fusion 2023, 95, 109–119. [Google Scholar] [CrossRef]
- Wang, M.; Zhang, K.; Li, G.; Yang, K.; Si, L. Tracing the Propagation Path: A Flow Perspective of Representation Learning on Graphs. arXiv 2019, arXiv:1912.05977. [Google Scholar]
- Wang, X. Research on Key Technologies of Power Big Data Application for Smart Grid. Chin. J. Electr. Eng. 2015, 35, 500–510. [Google Scholar]
- Wu, Q. Research on Aspect-Level Sentiment Analysis Method Based on Attention Mechanism. Master’s Thesis, Zhejiang University of Science and Technology, Hangzhou, China, 2024. [Google Scholar] [CrossRef]
- Wang, X. Research on Secure Data Sharing for Smart Grids in Edge Computing. Master’s Thesis, East China Jiaotong University, Nanchang, China, 2023. [Google Scholar] [CrossRef]
- Liu, C. Research on Brain Network Feature Analysis and Application Based on Graph Convolutional Neural Networks. Master’s Thesis, Taiyuan Normal University, Jinzhong, China, 2024. [Google Scholar] [CrossRef]
- Zhang, M.; Zhou, H.; Cao, J. Research on Bidirectional Sentiment Text Classification Based on Attention Mechanism of Dual BERT. ZNXTXB 2022, 17, 1220–1227. [Google Scholar] [CrossRef]
- Castillo, C.; Mendoza, M.; Poblete, B. Information Credibility on Twitter. In Proceedings of the 20th International Conference on World Wide Web (WWW’11); Association for Computing Machinery, Hyderabad, India, 28 March–1 April 2011; pp. 675–684. [Google Scholar] [CrossRef]
- Liu, Y.; Jin, X.; Shen, H. Towards Early Identification of Online Rumors Based on Long Short-Term Memory Networks. Inf. Process Manag. 2019, 56, 1457–1467. [Google Scholar] [CrossRef]
- Xu, B.B.; Cen, K.T.; Huang, J.J.; Shen, H.W.; Cheng, X.Q. A Review of Graph Convolutional Neural Networks. J. Comput. Res. Dev. 2020, 43, 755–780. [Google Scholar]
- Pietraszek, T.; Tanner, A. Data Mining and Machine Learning—Towards Reducing False Positives in Intrusion Detection. Inform. Secur. Technol. Rep. 2005, 10, 169–183. [Google Scholar] [CrossRef]
- Fan, Y.; Yao, Y.; Joe-Wong, C. GCN-SE: Attention as Explainability for Node Classification in Dynamic Graphs. In Proceedings of the 2021 IEEE International Conference on Data Mining (ICDM), Auckland, New Zealand, 7–10 December 2021; IEEE: New York, NY, USA, 2021; pp. 1060–1065. [Google Scholar]
- König, G.; Molnar, C.; Bischl, B.; Grosse-Wentrup, M. Relative Feature Importance. In Proceedings of the 25th International Conference on Pattern Recognition (ICPR), Milan, Italy, 10–15 January 2021; IEEE: New York, NY, USA, 2021; pp. 9318–9325. [Google Scholar]
- Niu, Z.; Zhong, G.; Yu, H. A Review on the Attention Mechanism of Deep Learning. Neurocomputing 2021, 452, 48–62. [Google Scholar] [CrossRef]
- Antwarg, L.; Miller, R.M.; Shapira, B.; Rokach, L. Explaining Anomalies Detected by Autoencoders Using Shapley Additive Explanations. Expert Syst. Appl. 2021, 186, 115736. [Google Scholar] [CrossRef]
- Palatnik de Sousa, I.; Vellasco, M.B.; Costa da Silva, E. Local Interpretable Model-Agnostic Explanations for Classification of Lymph Node Metastases. Sensors 2019, 19, 2969. [Google Scholar] [CrossRef]
Disclaimer/Publisher’s Note: The statements, opinions and data contained in all publications are solely those of the individual author(s) and contributor(s) and not of MDPI and/or the editor(s). MDPI and/or the editor(s) disclaim responsibility for any injury to people or property resulting from any ideas, methods, instructions or products referred to in the content. |
© 2024 by the authors. Licensee MDPI, Basel, Switzerland. This article is an open access article distributed under the terms and conditions of the Creative Commons Attribution (CC BY) license (https://creativecommons.org/licenses/by/4.0/).