Abstract
Light field images can record multiple information about the light rays in a scene and provide multiple views from a single image, offering a new data source for 3D reconstruction. However, ensuring the quality of light field images themselves is challenging, and distorted image inputs may lead to poor reconstruction results. Accurate light field image quality assessment can pre-judge the quality of light field images used as input for 3D reconstruction, providing a reference for the reconstruction results before the reconstruction work, significantly improving the efficiency of 3D reconstruction based on light field images. In this paper, we propose an Adaptive Vision Transformer-based light-field image-quality assessment model (AViT-LFIQA). The model adopts a multi-view sub-aperture image sequence input method, greatly reducing the number of input images while retaining as much information as possible from the original light field image, alleviating the training pressure on the neural network. Furthermore, we design an adaptive learnable attention layer based on ViT, which addresses the lack of inductive bias in ViT by using adaptive diagonal masking and a learnable temperature coefficient strategy, making the model more suitable for training on small datasets of light field images. Experimental results demonstrate that the proposed model is effective for various types of distortions and shows superior performance in light-field image-quality assessment.
1. Introduction
Light field images, due to their ability to simultaneously record the position and directional information of light rays in space and their resistance to external environmental influences, provide a new solution approach for 3D reconstruction tasks. Compared to traditional two-dimensional and three-dimensional images, light field images possess unique technical characteristics. They can capture both angular and spatial information, presenting viewers with a more realistic sense of depth and stereoscopy. This unique capability gives light field images a broad application prospect in fields such as immersive media, virtual reality, and augmented reality. Through light field images, users can obtain more lifelike and immersive visual experiences, feeling a more authentic sense of depth and stereoscopic effect.The application potential of light field images is vast. They can be used in movies, games, education, healthcare, and design, providing users with a more realistic and immersive visual experience. With continuous technological advancements and innovations, light field images are expected to further drive the development of virtual reality and augmented reality technologies, offering richer and more immersive visual experiences to people. However, during the processes of acquisition, encoding, compression, and transmission, light field images unavoidably suffer from various distortion factors, making it challenging to guarantee the quality of light field images and ultimately affecting the accuracy of 3D reconstruction results. At the same time, because light field images contain more complex spatial and angular information, their quality assessment involves more factors, such as angular consistency and depth information accuracy. Traditional image quality assessment methods, when directly applied to light-field image-quality evaluation, often fail to accurately extract light field features and thus do not achieve satisfactory results. Therefore, establishing a quality evaluation system for light field images holds significant academic value for 3D reconstruction tasks based on light field images.
In recent years, quality assessment of light field images has become one of the hot research topics in the field of computer vision, and many scholars have conducted relevant work on the evaluation of light field image quality. Using a full-reference light-field image-quality assessment method, Fang et al. [1] combined global features extracted from the Epipolar Plane Image (EPI) with local features extracted from the sub-aperture image (SAI) to evaluate the quality of light field images and calculate the final quality score. In the no-reference light-field image-quality assessment, Shan et al. [2] combined ordinary 2D features of SAIs with a sparse gradient dictionary of LF depth maps, and conducted research using depth characteristics. Xiang et al. [3] computed the average differential images from SAIs to describe the depth and structural information of LFIs, and used curvelet transform to reflect the multi-channel characteristics of the human visual system.
This paper proposes an Adaptive Vision Transformer-based light-field image-quality assessment model (AViT-LFIQA). To address the issue of redundant information from all sub-aperture images decomposed from light field images leading to low training efficiency, we designed a multi-view sub-aperture image sequence input method. By selecting only the sub-aperture sequences in the horizontal, left diagonal, vertical, and right diagonal directions, we can recover most of the information contained in the original light field image. This significantly reduces the number of input images, alleviates the neural network’s burden, and improves training efficiency. This method is based on the angular consistency of light field images in four directions. By treating three consecutive sub-aperture images in these directions as an image sequence, the deep residual network extracts features and angular information from each direction, allowing the network to better learn previously overlooked features in the angular domain of the light field.To overcome the limitations of convolutional neural networks in learning global visual cues, we introduced the Vision Transformer (ViT) network, which can better capture global information and achieve a larger receptive field. To mitigate the lack of inductive bias in ViT, we designed an adaptive, learnable attention layer based on ViT, employing strategies such as diagonal masking and learnable temperature coefficients. This enables the ViT model to better learn the spatial structure information of light field images from small datasets. Experimental results demonstrate that this model accurately simulates the perception of light field images by the human visual system (HVS), and is applicable to various types of distortions, so it can achieve precise light-field image-quality assessment.
The main contributions of this paper are as follows:
- After selecting the sub-aperture images in four directions, we input them in sequences of three consecutive images. This approach reduces redundant information in the input images without compromising the integrity of the light field image information, thereby improving training efficiency.
- Based on the ViT architecture, we designed an adaptive learnable attention layer that incorporates strategies such as diagonal masking and learnable temperature coefficients. These adaptive strategies mitigate the lack of inductive bias in ViT, enabling it to achieve better performance on small datasets.
2. Related Work
2.1. Light-Field Image-Quality Assessment
In recent years, the gradual development of light field technology has attracted increasing attention from scholars towards the quality assessment of light field images. In the field of full-reference light-field image-quality assessment, Tian et al. [4] proposed a model that extracts multi-order derivative features from the sub-aperture images (SAIs) by taking multiple derivatives on SAIs. However, their analysis still remains focused on the texture aspect of spatial information, lacking an analysis of the relationship between angular and spatial information. Meng et al. [5] measured the spatial and angular quality of distorted light field images (LFIs) by utilizing the similarity between original SAIs, distorted SAIs, and refocused images. Min et al. [6] computed spatial quality by averaging the structural similarity across all viewpoints and analyzed the amplitude spectrum of mean square error along the viewpoint edges to represent angular quality. Tian et al. [7] performed radial symmetric transformation on the luminance components of all dense viewpoints to extract symmetric features and utilized depth maps to measure the structural consistency between viewpoints, exploring the human perception of structure and geometry. Huang et al. [8] proposed the SGFM model, which applies contourlet transform on SAIs to extract spatial features and 3D-Gaber filtering on SAIs to extract geometric features, combining spatial and geometric features for LFI evaluation. Meng et al. [9] established a crucial refocused image extraction framework based on maximum spatial information contrast and minimum angular information change to reduce redundancy in quality assessment within focus stacks.
In the field of reduce-reference light-field image-quality assessment, Paudyal et al. [10] investigated the relationship between depth map quality and overall quality of low-frequency images, and also proposed simplified reference quality assessment indicators for LFIs. To predict the quality of distorted LFIs, distortion measures from the depth map were used.
In the field of no-reference light-field image-quality assessment, since light field images can be considered as a low-rank tensor, Shi et al. [11] utilized the tensor structure of light field image arrays to study their angular and spatial characteristics. They designed a Blind Quality Evaluator Of Light Field Image (BELIF) that generates the first component of the hyper-volume image tensor through Tucker decomposition, and evaluates the spatial quality and angular consistency of distorted LFIs based on the features and structural changes of the tensor in space. Luo et al. [12] assessed angular consistency using global entropy and uniform local binary pattern features of micro-lens images, and measured spatial quality using information entropy of SAIs. Shi et al. [13] proposed a no-reference light-field image-quality assessment (NR-LFQA) method, which evaluates the quality of distorted LFIs by combining the naturalness distribution features of light field toroidal image arrays and the global and local features of Epipolar Plane Images. Zhou et al. [14] extracted spatial–angular features using tensor decomposition of view stack tensors in four directions. While BELIF and NR-LFQA did not consider the chromatic effect and different directions of LFIs, and Tensor-NLFQ did not fully utilize the two-dimensional directional information of macro-pixels, especially the relationships between macro-pixels in LFIs, Cui et al. [15] not only measured spatial quality by directly extracting perceptual features from SAIs but also explored quality perception features from MPRBs and MPV images to measure LFI quality. Xiang et al. [13] proposed a no-reference image-quality assessment method based on depth, structure, and angular information (depth, structural, and sngular (DSA)), defining Mean Difference Images (MDIs) and analyzing differences between horizontal MDI, vertical MDI, and SAIs using CMMD (curvelet multi-scale and multi-directional decomposition) to obtain features related to LFI depth and structure information. They quantified the direction of local slopes on EPI using the Local Maximum Similarity Index statistical algorithm and pooled the obtained features to obtain the quality score of distorted LFIs. Pan et al. [16] proposed a method called Combining Tensor Slice and Singular Value for Blind Light-Field Image-Quality Assessment (TSSV-LFIQA) based on the powerful ability of tensors to represent the high-dimensional data and distortion characteristics of LFIs. Existing blind LFIQA methods mainly focus on designing feature extractors inspired by the high-dimensional nature of LFIs without sufficient consideration of LFI visualization. Therefore, Xiang et al. [17] proposed a new no-reference light-field image-quality assessment method that combines the high dimensionality of LFIs with visualization techniques, which is more in line with human perception.
2.2. Quality Assessment of Light Field Images Based on Deep Learning
The recent trend in research is to combine deep learning with light field to obtain more robust light-field image-quality assessment models. Zhao et al. [18] proposed a light field quality assessment method based on a multi-task convolutional neural network, using EPI slices as input. Guo et al. [19] introduced a method based on deep neural networks that leverages SAI fusion and a global context-aware model to capture relationships between SAIs. To address the issue of limited datasets, they proposed a ranking-based method to generate pseudo-labels for pre-training the quality assessment network and fine-tuning the model with real labels on a small-scale dataset. Lamichhane et al. [20] presented a CNN-based light field IQA method for measuring distortion in saliency maps, confirming a strong correlation between the distortion levels of normalized images and their corresponding saliency maps. Sana et al. [21] proposed a light-field image-quality assessment model based on a long short-term memory deep neural network (LSTM-DNN), extracting distortion features with long-term dependencies from horizontal EPIs. They fed micro-lens images into a pre-trained network to extract features and used a summation operation to combine features for quality score regression.
Following the success of the Transformer model [22] in the field of Natural Language Processing (NLP), researchers in the computer vision domain have introduced the Vision Transformer and applied it to tasks such as object detection, image recognition, and image quality assessment, achieving promising results. Chen et al. [23] applied ViT to image classification, training a sequence ViT for pixel regression. Carion et al. [24] utilized Transformer in the detection head for object detection, eliminating the reliance on non-maximum suppression. You et al. [25] proposed TRIQ (Transformer for Image Quality assessment), using an adaptive encoder to handle images of varying resolutions. They extracted image features using CNN as input for the Transformer and then utilized a multi-layer perceptron to regress and predict quality scores. Subsequently, Cheon et al. [26] introduced IQT (Image Quality Transformer), which employed the Adam optimizer and Mean Squared Error (MSE) loss function, achieving first place in the NTIRE competition. Ramachandran et al. [27] proposed a fully attentional visual model by replacing limited receptive field convolutions with independent attention layers. Qu et al. [28] proposed LFACon, which introduces a multi-head self-attention mechanism in the angular domain of light field images and presented three new attention kernels to achieve global or selective extraction of multi-angle features. Zhang et al.’s [29] method, PVBLiF, represents light field images as pseudo-video block sequences and employs convolutional neural networks for quality assessment.
Light-field image-quality assessment is an important task for evaluating the visual quality of light field images, involving the comprehensive analysis of multi-view and multi-dimensional information. Subjective assessment methods rely on the visual ratings of observers, which, although accurate, are subjective and costly. Objective assessment methods include full-reference, no-reference, and reduced-reference approaches. Full-reference methods use undistorted reference images for quality evaluation, such as the evaluation method based on angular–spatial characteristics. No-reference methods do not require reference images and often use machine learning or deep learning models, such as visualization-based no-reference quality assessment methods. Reduced-reference methods achieve a balance between evaluation accuracy and computational efficiency by using limited reference information. Feature-based methods assess quality by extracting features such as multi-order derivatives from the images, while data-driven methods rely on large-scale databases to train models for automatically predicting light field image quality. Each of these methods has its own advantages and disadvantages, and the choice should be made based on specific application scenarios and requirements. Overall, light-field image-quality assessment methods are continuously evolving to improve accuracy and robustness, aiming to meet the demands of various applications.
3. Method
The perception of image quality by the HVS depends not only on local distortions but also on the global context. Traditional CNN-based IQA models operate only in local regions with a limited receptive field, thus failing to capture global visual information. However, the self-attention mechanism of ViT can capture global information and achieve a larger receptive field. This paper proposes an Adaptive Vision Transformer-based light-field image-quality model (AViT-LFIQA). The specific process is shown in Figure 1.
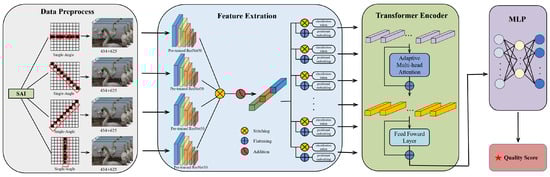
Figure 1.
The flowchart of the AViT-LFIQA.
First, based on angle consistency, select sub-aperture images of the light field in four directions: horizontal, left diagonal, vertical, and right diagonal. Organize these sub-aperture images into image sequences as the network input, with 3 sets for each direction containing 3 images each, totaling 9 sub-aperture images for each direction. This significantly reduces the input scale of training data compared to inputting sub-aperture images in all directions.
Next, the preprocessed subsequences of sub-aperture images in the four directions from the above-mentioned SAI-IS are separately input into four ResNet50 networks with the same parameters pre-trained. By continuously stacking convolutional layers, the networks extract image perceptual features from local to global, replacing manually extracted visual clues such as image textures and edge structures. Finally, the features output from the four ResNet50 networks are concatenated.
Subsequently, the concatenated features are input into the ViT encoder with adaptive self-attention mechanism to learn global perceptual features and capture context information in light field images. The ViT encoder designed in this paper adopts adaptive strategies such as diagonal masking and learnable temperature coefficients, which can alleviate the lack of inductive bias in ViT.
Lastly, the output of ViT is fed into a Multilayer Perceptron (MLP) to regress the final quality score.
3.1. Input
Compared to regular planar images, light field images contain more information. Therefore, when evaluating their quality, it is essential to consider not only the spatial quality but also the degradation in quality from different angles. To address this, we use the angular consistency of light field images in various directions and employ SAI image sequencing (SAI-IS) in each direction to represent angular information. This approach, combined with the spatial information of each image, better demonstrates the distinction between light-field image-quality assessment and planar image quality assessment due to the higher dimensionality and greater information content.
Given a light field image with dimensions , we obtain SAIs through a fixed process . Each SAI includes images from all viewpoints corresponding to the specified light field image, reflecting the main content of the scene and the changes in the target scene from different viewpoints. The surrounding view images of one angular direction of the light field image contain sub-pixel shifts in a specific spatial direction. As shown in Figure 2, assuming the angular resolution of the light field image is , each SAI has angular consistency in four directions, namely , , , and , representing the horizontal, left diagonal, vertical, and right diagonal directions, respectively.
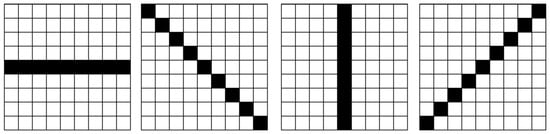
Figure 2.
Angular consistency of SAIs in four directions.
Figure 3 shows the SAIs from different viewpoints of a given scene, with the original light field image on the left and the SAIs from different viewpoints on the right. It can be observed that the SAIs corresponding to the same scene exhibit some angular shifts in the image content due to changes in viewpoint. However, it is evident that the majority of the content remains the same. Training a neural network with all SAIs corresponding to a single scene would significantly increase the network’s burden and reduce its efficiency. Through multiple experiments, this chapter selects an SAI image input method that achieves a balance between quality and efficiency, as illustrated in Figure 4. For a light field image with an angular resolution of and a spatial resolution of , we denote the SAI image at row x column y as . SAI-IS consists of 4 sets of SAIs representing the directions of horizontal, left diagonal, vertical, and right diagonal, denoted as . Each subsequence comprises concatenated images from 3 continuous sets of 3 images each, totaling 9 images in the RGB color channel direction of its respective direction. For example, the subsequence in the horizontal direction is composed of image sets , , and , with each set containing 3 images. These sets are concatenated to form a total of 9 images in the RGB channel.
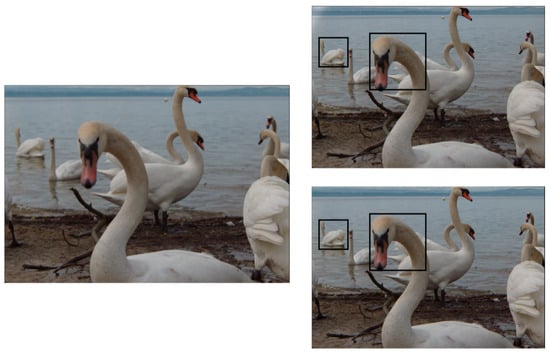
Figure 3.
Light field image and SAIs from different viewpoints. The black boxes showcase the same scene’s corresponding SAIs, where the content within the images shifts slightly in angle due to changes in viewpoint.
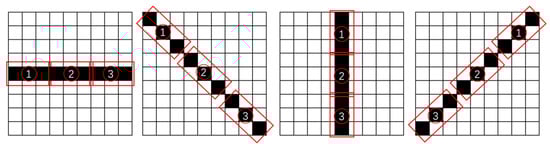
Figure 4.
SAI sequences from different angles for input.
When training deep learning models, data preprocessing is a crucial step:
- Image grayscale conversionGrayscale conversion of the input SAI group refers to setting each pixel of the image to a single color, resulting in a grayscale representation of the image. This means converting the original image, which has three channels, into a single-channel image, making it more convenient for processing. Additionally, grayscale reflects important information such as light intensity, which can be used to extract edge information and improve network computation speed.In this method, we first randomly divide the dataset into an 80:20 ratio, where 80 percent is allocated to the training set and 20 percent to the test set. As described above, taking a light field image with an angular resolution of 9 × 9 and a spatial resolution of 434 × 625 as an example, we consider the image sequence of each light field image , denoted as SAI-IS. The original dimension of each image subsequence is (9,434,625). After grayscale conversion, the 3-channel image becomes a 1-channel image, reducing the dimension of to (3,434,625). Therefore, the final input image sequence, SAI-IS, has a dimension of (4,3,434,625).
- Image standardization and normalizationStandardization, in simple terms, involves calculating the variance and mean of each channel’s data, then subtracting the mean and dividing by the variance for each data point within each channel. This process yields normalized results. In deep learning image processing, after standardization, data can better respond to activation functions, enhancing data expressiveness, and reducing the occurrence of gradient explosion and vanishing. Normalizing images involves adjusting the magnitude of feature values to a similar range by dividing all pixel values by the maximum pixel value. This can reduce computational costs and improve efficiency.
3.2. The ViT with Adaptive Attention Mechanism
The introduction of the adaptive attention mechanism enables the ViT model to possess greater flexibility, efficiency, and generalization capability. It can handle image data of varying scales and complexities, effectively learn relationships between visual features, and achieve superior performance across multiple visual tasks.
In this section, we directly utilize the pre-trained ResNet50 network model on the ImageNet dataset. ImageNet is a large-scale image dataset containing over 15 million images spanning more than 20,000 categories. By using the ImageNet dataset as the training set and employing the ResNet50 deep learning architecture to train the network parameters, the pre-trained model learns various structural features of images. This addresses the issue of poor model generalization due to the limited samples in the original light field dataset and accelerates the training speed of the model.
Feature extraction is an indispensable part of image quality assessment, aiming to extract features from input images for better scoring by subsequent networks. In this chapter, we also use ResNet50 as the feature extraction network structure. Preprocessed SAI-IS with dimensions of enter convolutional layers, BN layers, ReLU layers, and max-pooling layers successively, resulting in outputs with dimensions of . After passing through four residual blocks, the image feature dimension becomes .
In the feature extraction process by the ResNet50 network, shallow layers have relatively small network receptive fields, which can generate high-resolution feature maps expressing weak semantic information and strong geometric structure information. Conversely, deep layers can express strong semantic information and geometric structure information in low-resolution feature maps, generating feature maps with larger resolutions and richer semantic information.
After completing the aforementioned tasks, to better integrate with ViT, before feeding SAI-IS features into the ViT encoder, we first apply a convolutional layer with a kernel size of 1 and a stride of 1. This converts the original channel count, which is , into a channel count D consistent with the dimensions of the ViT encoder model. Subsequently, the feature map is flattened along the two spatial dimensions, transforming the original feature dimension of into a shape of . We denote this series of tokens as F. Before entering the ViT encoder, a token specifically used to evaluate the image quality score needs to be generated, denoted as . It is then concatenated with F, and trainable position embeddings (PEs) are added. This series of steps can be expressed by Equation (1):
where is the input for the ViT encoder. The position encoding of added token is fixed and aggregates information from all other tokens. Moreover, since it is not based on image content itself, it can avoid bias towards any specific token in the sequence. Furthermore, its fixed position encoding helps to prevent output from being affected by position encoding interference.
Each layer consists of an Adaptive Multi-Attention (AMA) layer and a feed forward network (FFN), with Layer Normalization (LN) used to normalize the residual connections in both sub-layers. The ViT encoder can be represented as follows, according to Equation (2):
The adaptive multi-head attention layer is different from the standard self-attention or multi-head attention layer in a typical ViT. The basic self-attention mechanism applies a linear transformation to the input vector of each layer, expanding into three sub-vectors, as shown in Equation (3):
Then, each is split into three sub-vectors , , . Essentially, these three vectors are equal. Next, each attends to each , and the calculation formula is shown in Equation (4):
where d is the dimension of q and k, divided by to achieve normalization effect. Each vector also calculates its correlation with itself, and then all undergo a Softmax operation, as illustrated in Figure 5.
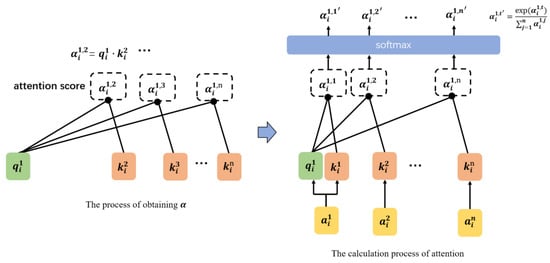
Figure 5.
Obtain and calculate attention.
The required attention scores are obtained, and the overall process is as shown in Equation (5):
Based on this, the multi-head attention mechanism utilizes multiple QKV computations to linearly map parallel selections of information from the input, allowing each attention head to focus on different parts of the input to generate content. Finally, these outputs are concatenated and projected to generate the output value, as obtained in Equation (6):
where is the attention score for each head.
Building upon this, to address the issue of ViT requiring a large amount of data for training, this chapter employs AMA to alleviate the problem of ViT lacking inductive bias. The specific improvements are as follows:
- Diagonal maskingFrom the token calculation mechanism, it can be observed that the self-token lies on the diagonal, which represents the dot product with itself. At this point, diagonal masking plays a crucial role in enhancing the scores for token interactions. Specifically, the values on the diagonal components are set to , as shown in the following equation. This ensures that the attention of ViT is more focused on other tokens rather than itself. The specific calculation formula is shown in Equation (7):where is each component of the masked similarity matrix.
- Learnable temperature coefficientIn a standard ViT, the temperature in Softmax is a constant, typically the square root of the dimensionality, used for normalization. However, the learnable temperature coefficient allows ViT to determine the temperature of the Softmax during the learning process. Figure 6 illustrates the average learning temperature based on depth when the Softmax temperature is used as a learnable parameter in the equation. It can be observed that the average learning temperature is lower than the temperature coefficient in standard ViT. Generally, a lower temperature in Softmax sharpens the score distribution. Therefore, the learnable temperature scaling makes the distribution of attention scores clearer.
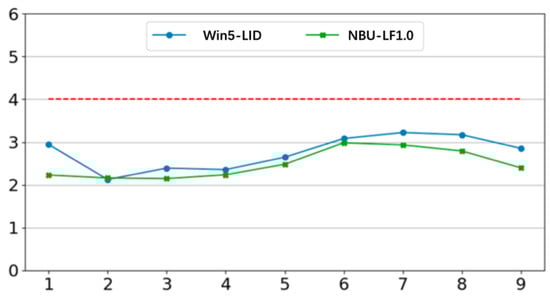 Figure 6. Temperature curve of learnable temperature coefficients obtained in two datasets.
In other words, AMA addresses the phenomenon of smoothed attention scores.
The FFN consists of two fully connected layers, Gelu function, and two dropout layers, as shown in Equation (8):
where represents the learnable parameters of the feed forward neural network layer. To expedite model training, residual connections are used in each sub-layer, and layer normalization is applied for generalization capability.
After passing through the ViT encoder, the dimensions of the input and output remain unchanged. Because we only need information about the image quality score, the corresponding result extracted from token is obtained. Subsequently, through the MLP, regression is performed to obtain the final image quality score result. The MLP consists of two linear mappings and one Gelu function layer. The specific process is shown in Equation (9):
where output represents the predicted image quality score by the model.
4. Experiment
4.1. Experimental Procedure
The datasets used in this chapter are Win5-LID [30] and NBU-LF1.0 [31], which are used to validate the effectiveness of the proposed model. Different distortion examples from the Win5-LID dataset are shown in Figure 7. The dataset was strictly divided into training and testing sets based on image partitioning. Specifically, the original light field image dataset was randomly split into an 8:2 ratio for training and testing sets using a program, followed by further partitioning to SAI. The network framework used in the experiments is PyTorch, the CPU is i9-13900KS, and the GPU is NVIDIA 3080Ti. The image quality evaluation metrics used are Pearson Linear Correlation Coefficient (PLCC), Spearman Rank Correlation Coefficient (SROCC), and RMSE. PLCC and SROCC are commonly used metrics to evaluate the performance of image quality assessment algorithms, with PLCC measuring the linear relationship between algorithm outputs and human ratings, while SROCC assesses the non-linear relationship between them. The disadvantage of PLCC is its sensitivity to outliers, whereas SROCC is more robust to outliers and can provide reliable results even in the presence of outliers.
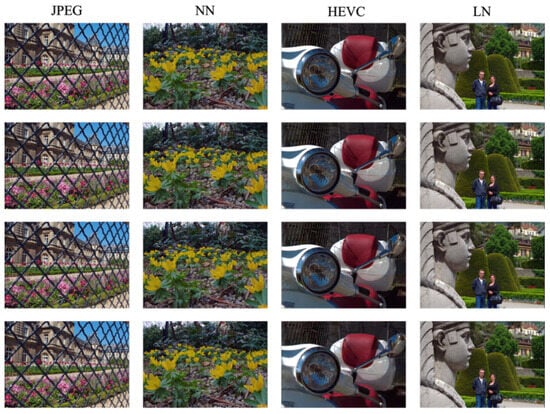
Figure 7.
Different distortion examples from the WIN5-LID datase.
During training, we set the encoder of ViT to have 14 layers, including 6 attention heads. The dropout rate is set to 0.1, the learning rate is 0.0001, and the training epochs are set to 1000. During the image preprocessing stage, the mean is set to 0.5 and the variance is set to 0.22.
4.2. Performance Analysis
This chapter uses PLCC, SROCC, and RMSE to evaluate the proposed LFIQA model. To verify the comprehensive performance of this model, comparisons and analyses were conducted with four existing full-reference two-dimensional image-quality assessment models, four no-reference light-field image-quality assessment models, and two full-reference light-field image-quality assessment models on the same databases. These models include IWSSIM [32], SSIM [33], FSIM [34], MS-SSIM [35], BELIF [11], NR-LFQA [13], Tensor-NLFQ [14], VBLFI [3], MDFM [4], and MPFS [36]. In the table below, the best result for each evaluation metric is presented in bold with underline, the second best result is shown in bold, and “-” indicates missing performance metrics in the paper.
Table 1 presents the comparison of various image quality assessment algorithms on the Win5-LID and NBU-LF1.0 datasets. The experimental results show that our model achieves significant improvements in terms of PLCC, SROCC, and RMSE compared to other models, demonstrating the best performance. This study not only utilizes deep learning but also addresses key issues such as the insufficient number of light field image datasets and the multi-view clues of light field image features, resulting in superior results. In order to show the prediction results more clearly, Figure 8 shows the scatter plots and Figure 9 shows the training curves on the Win5-LID and NBU-LF1.0 databases.

Table 1.
Performance comparison on Win5-LID and NBU-LF1.0 datasets.
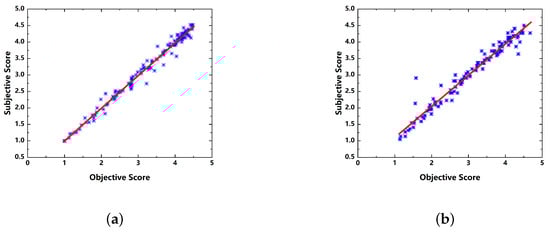
Figure 8.
Scatterplots of predicted quality scores against the MOS value on the Win5-LID and NBU-LF1.0 databases. The horizontal and vertical axes in each figure represent the predicted quality scores and MOS values, respectively.The blue asterisk represents the subjective and predicted score of an image. The red line is the fitted curve. (a) Scatterplots on Win5-LID database. (b) Scatterplots on NBU-LF1.0 database.
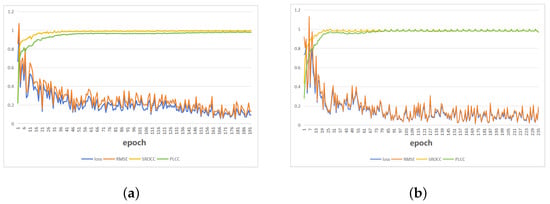
Figure 9.
In-training curves on the Win5-LID and NBU-LF1.0 databases. The horizontal axis in each figure represents the epoch and the vertical axis represents the scores. (a) Curves on Win5-LID database. (b) Curves on NBU-LF1.0 database.
4.3. Ablation Experiment
This chapter conducted ablation experiments to demonstrate the effectiveness of AMA and SAI-IS. As shown in Table 2, this chapter evaluated the performance based on the baseline multi-head attention mechanism and feeding a single SAI into the network. From the table, it can be observed that the results obtained by the methods used in this chapter are significantly higher than the performance of either the multi-head attention mechanism or feeding a single SAI into the network alone. This proves that the algorithms used in this chapter effectively improve the accuracy of the IQA model. In the table below, the best result for each evaluation metric is presented in bold with underline.
Table 2.
Ablation experiment results.
4.4. Performance Analysis of Different Distortion Types
On the Win5-LID and NBU-LF1.0 datasets, there are different levels of image distortion types. This chapter conducted detailed experiments on the distortion types in Win5-LID, including NN, LN, HEVC, JPEG, USCD, and EPICNN, as well as in NBU-LF1.0, including NN, EPICNN, BI, VDSR, and DR. The experimental results are shown in Table 3 and Table 4. Examples of various distortion types are illustrated in Figure 7 and Figure 10. It can be observed that the most accurately evaluated distortion types in Win5-LID are USCD and JPEG. However, the model does not perform well in predicting the EPICNN distortion type. In the NBU-LF1.0 dataset, the model accurately predicts the BI distortion type, while the EPICNN distortion type also shows poor performance.
Table 3.
Experimental results of different distortion types on Win5-LID.
Table 4.
Experimental results of different distortion types on NBU-LF1.0.
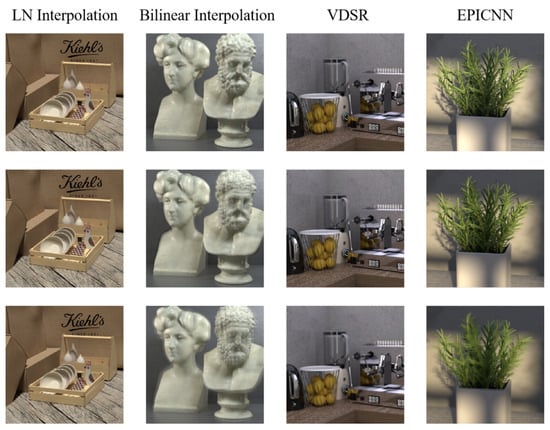
Figure 10.
Different distortion examples from NBU-LF1.0 dataset.
4.5. Discussion
The experimental results presented above strongly demonstrate the effectiveness of our model in the quality assessment of light field images.
In alignment with a rigorous scientific approach, we conducted a comprehensive analysis of the data and scatter plots, leading to the identification of a notable observation within the NBU dataset. Specifically, under the ninth distortion type EPICNN (k = 2) for the SRC05 image, the Mean Opinion Score (MOS) is reported at 2.9091, while the objective score is measured at 1.5795. The objective score is significantly lower than the MOS, which indicates a conspicuous anomaly.
We believe there are two reasons for this anomaly. Firstly, the presence of a large area of stone sculptures in the image attracts the attention of observers, who may not pay much attention to other distant scenes. Therefore, the high subjective score is influenced by the quality of the stone sculptures, without considering the presence of people in the image. Secondly, the texture of the stone sculptures is simple and flat, lacking complex structural lines. Therefore, the EPICNN distortion with k = 2 does not significantly affect the reconstruction quality, leading to a higher subjective quality score.
Other data also support the above speculation. We found that for other original images under distortion types 7, 8, and 9, the image quality significantly deteriorates, with subjective scores decreasing by more than one point. However, in the case of SRC05, due to the aforementioned reasons, the image quality degradation is not as obvious, resulting in only a slight decrease of 0.6 points in the subjective score. This leads to an overestimated subjective score.
Based on the aforementioned analysis and results, we believe that our model can improve the training speed of image evaluation models. Additionally, due to the reduced input data volume, it can support lighter training hardware while maintaining relatively accurate evaluation performance.
5. Conclusions
This study proposes an adaptive attention-based ViT model for quality assessment of light field images (AViT-LFIQA). By introducing multi-view sub-aperture image sequences and adaptive attention mechanisms into the ViT model, this approach partially alleviates some existing issues in light-field image-quality assessment. By selecting only SAI images from four directions, information redundancy is reduced, significantly decreasing the input data scale, alleviating network pressure, and improving training speed. Through the incorporation of adaptive strategies such as diagonal masking and learnable temperature coefficients, an adaptive and learnable attention layer is designed, enabling ViT to be better applied in the field of light-field image-quality assessment. Experimental results demonstrate that the model can more accurately simulate a human visual system perception of light field images, is applicable to various distortion types, and achieves precise light-field image-quality assessment.
The main contributions of this study include the following:
- Designing a multi-view sub-aperture image sequence input method, reducing redundant information in input images and improving training efficiency.
- Designing an adaptive learnable attention layer based on ViT, incorporating adaptive strategies such as diagonal masking and learnable temperature coefficients, effectively mitigating the issue of ViT’s lack of inductive bias.
Despite achieving certain results, this study also has some limitations. Firstly, the performance of the model relies on the quality and quantity of the training data. Secondly, although adaptive strategies are employed, there is still room for improvement in the model’s performance when dealing with extreme distortion types. Future research could further optimize the model structure, integrate more light field image data, to enhance the model’s generalization ability and robustness.
In summary, this study provides an effective method for light-field image-quality assessment and lays the foundation for the development of future work on three-dimensional reconstruction of light field images.
Author Contributions
Conceptualization, Y.D. and X.H.; Methodology, Y.D. and H.Z.; Software, W.L. and Y.W.; Validation, Y.D., X.H. and H.Z.; Investigation, L.Z.; Resources, W.L. and Y.W.; Data curation, L.Y. and Y.W.; Writing—original draft, Y.D., W.L. and L.Y.; Writing—review and editing, Y.D., L.Y., H.Z., L.Z. and Y.W.; Visualization, X.H. and Y.W.; Supervision, H.Z. and L.Z.; Project administration, Y.D. and H.Z.; Funding acquisition, W.L. All authors have read and agreed to the published version of the manuscript.
Funding
This research was funded by the Key R&D Program of Zhejiang under Grant No. 2022C01200.
Data Availability Statement
Win5-LID (Win5 Light Field Image Database) is designed for light field image quality assessment. NBU-LF1.0 is a light field image database released by Ningbo University for light field image quality assessment. Link to paper on Win5-LID: https://ieeexplore.ieee.org/document/8451077, accessed on 10 June 2024. Link to paper on NBU-LF1.0: https://ieeexplore.ieee.org/document/8909170, accessed on 10 June 2024.
Conflicts of Interest
Author Wei Lang was employed by the company Zhejiang Huali Intelligent Equipment Co., Ltd. The remaining authors declare that the research was conducted in the absence of any commercial or financial relationships that could be construed as a potential conflict of interest.
Abbreviations
| Adaptive Vision Transformer-based Light-Field Image-Quality Assessment | AViT-LFIQA |
| Vision Transformer | ViT |
| Human Visual System | HVS |
| Sub-aperture Images | SAIs |
| Light Field Images | LFIs |
| Blind Quality Evaluator Of Light Field Image | BELIF |
| No-reference light-field image-quality assessment | NR-LFQA |
| Mean Difference Image | MDI |
| Curvelet Multi-scale and Multi-directional decomposition | CMMD |
| Combining Tensor Slice and Singular Value for Blind light-field image-quality Assessment | TSSV-LFIQA |
| Long Short-Term Memory deep neural network | LSTM-DNN |
| Natural Language Processing | NLP |
| Transformer for Image Quality | TRIQ |
| Image Quality Transformer | IQT |
| Mean Squared Error | MSE |
| Multilayer Perceptron | MLP |
| SAI Image Sequences | SAI-IS |
| Position Embeddings | PEs |
| Adaptive Multi-Attention | AMA |
| Feed Forward Network | FFN |
| Layer Normalization | LN |
| Pearson Linear Correlation Coefficient | PLCC |
| Spearman Rank Correlation Coefficient | SPOCC |
| Root Mean Square Error | RMSE |
References
- Fang, Y.; Wei, K.; Hou, J.; Wen, W.; Imamoglu, N. Light filed image quality assessment by local and global features of epipolar plane image. In Proceedings of the 2018 IEEE Fourth International Conference on Multimedia Big Data (BigMM), Xi’an, China, 13–16 September 2018; pp. 1–6. [Google Scholar]
- Shan, L.; An, P.; Meng, C.; Huang, X.; Yang, C.; Shen, L. A no-reference image quality assessment metric by multiple characteristics of light field images. IEEE Access 2019, 7, 127217–127229. [Google Scholar] [CrossRef]
- Xiang, J.; Yu, M.; Chen, H.; Xu, H.; Song, Y.; Jiang, G. VBLFI: Visualization-based blind light field image quality assessment. In Proceedings of the 2020 IEEE International Conference on Multimedia and Expo (ICME), London, UK, 6–10 July 2020; pp. 1–6. [Google Scholar]
- Tian, Y.; Zeng, H.; Xing, L.; Chen, J.; Zhu, J.; Ma, K.K. A multi-order derivative feature-based quality assessment model for light field image. J. Vis. Commun. Image Represent. 2018, 57, 212–217. [Google Scholar] [CrossRef]
- Meng, C.; An, P.; Huang, X.; Yang, C.; Liu, D. Full reference light field image quality evaluation based on angular-spatial characteristic. IEEE Signal Process. Lett. 2020, 27, 525–529. [Google Scholar] [CrossRef]
- Min, X.; Zhou, J.; Zhai, G.; Le Callet, P.; Yang, X.; Guan, X. A metric for light field reconstruction, compression, and display quality evaluation. IEEE Trans. Image Process. 2020, 29, 3790–3804. [Google Scholar] [CrossRef] [PubMed]
- Tian, Y.; Zeng, H.; Hou, J.; Chen, J.; Zhu, J.; Ma, K.K. A light field image quality assessment model based on symmetry and depth features. IEEE Trans. Circuits Syst. Video Technol. 2020, 31, 2046–2050. [Google Scholar] [CrossRef]
- Huang, H.; Zeng, H.; Hou, J.; Chen, J.; Zhu, J.; Ma, K.K. A spatial and geometry feature-based quality assessment model for the light field images. IEEE Trans. Image Process. 2022, 31, 3765–3779. [Google Scholar] [CrossRef] [PubMed]
- Meng, C.; An, P.; Huang, X.; Yang, C.; Shen, L.; Wang, B. Objective quality assessment of lenslet light field image based on focus stack. IEEE Trans. Multimed. 2021, 24, 3193–3207. [Google Scholar] [CrossRef]
- Paudyal, P.; Battisti, F.; Carli, M. Reduced reference quality assessment of light field images. IEEE Trans. Broadcast. 2019, 65, 152–165. [Google Scholar] [CrossRef]
- Shi, L.; Zhao, S.; Chen, Z. BELIF: Blind quality evaluator of light field image with tensor structure variation index. In Proceedings of the 2019 IEEE International Conference on Image Processing (ICIP), Taipei, Taiwan, 22–25 September 2019; pp. 3781–3785. [Google Scholar]
- Luo, Z.; Zhou, W.; Shi, L.; Chen, Z. No-reference light field image quality assessment based on micro-lens image. In Proceedings of the 2019 Picture Coding Symposium (PCS), Ningbo, China, 12–15 November 2019; pp. 1–5. [Google Scholar]
- Shi, L.; Zhou, W.; Chen, Z.; Zhang, J. No-reference light field image quality assessment based on spatial-angular measurement. IEEE Trans. Circuits Syst. Video Technol. 2019, 30, 4114–4128. [Google Scholar] [CrossRef]
- Zhou, W.; Shi, L.; Chen, Z.; Zhang, J. Tensor oriented no-reference light field image quality assessment. IEEE Trans. Image Process. 2020, 29, 4070–4084. [Google Scholar] [CrossRef]
- Cui, Y.; Yu, M.; Jiang, Z.; Peng, Z.; Chen, F. Blind light field image quality assessment by analyzing angular-spatial characteristics. Digit. Signal Process. 2021, 117, 103138. [Google Scholar] [CrossRef]
- Pan, Z.; Yu, M.; Jiang, G.; Xu, H.; Ho, Y.S. Combining tensor slice and singular value for blind light field image quality assessment. IEEE J. Sel. Top. Signal Process. 2021, 15, 672–687. [Google Scholar] [CrossRef]
- Xiang, J.; Yu, M.; Jiang, G.; Xu, H.; Song, Y.; Ho, Y.S. Pseudo video and refocused images-based blind light field image quality assessment. IEEE Trans. Circuits Syst. Video Technol. 2020, 31, 2575–2590. [Google Scholar] [CrossRef]
- Zhao, P.; Chen, X.; Chung, V.; Li, H. Low-complexity deep no-reference light field image quality assessment with discriminative EPI patches focused. In Proceedings of the 2021 IEEE International Conference on Consumer Electronics (ICCE), Las Vegas, NV, USA, 10–12 January 2021; pp. 1–6. [Google Scholar]
- Guo, Z.; Gao, W.; Wang, H.; Wang, J.; Fan, S. No-reference deep quality assessment of compressed light field images. In Proceedings of the 2021 IEEE International Conference on Multimedia and Expo (ICME), Shenzhen, China, 5–9 July 2021; pp. 1–6. [Google Scholar]
- Lamichhane, K.; Battisti, F.; Paudyal, P.; Carli, M. Exploiting saliency in quality assessment for light field images. In Proceedings of the 2021 Picture Coding Symposium (PCS), Bristol, UK, 29 June–2 July 2021; pp. 1–5. [Google Scholar]
- Alamgeer, S.; Farias, M.C. No-reference light field image quality assessment method based on a long-short term memory neural network. In Proceedings of the 2022 IEEE International Conference on Multimedia and Expo Workshops (ICMEW), Taipei City, Taiwan, 18–22 July 2022; pp. 1–6. [Google Scholar]
- Vaswani, A.; Shazeer, N.; Parmar, N.; Uszkoreit, J.; Jones, L.; Gomez, A.N.; Kaiser, Ł.; Polosukhin, I. Attention is all you need. Adv. Neural Inf. Process. Syst. 2017, 30. [Google Scholar] [CrossRef]
- Chen, M.; Radford, A.; Child, R.; Wu, J.; Jun, H.; Luan, D.; Sutskever, I. Generative pretraining from pixels. In Proceedings of the International Conference on Machine Learning, PMLR, Virtual, 13–18 July 2020; pp. 1691–1703. [Google Scholar]
- Carion, N.; Massa, F.; Synnaeve, G.; Usunier, N.; Kirillov, A.; Zagoruyko, S. End-to-end object detection with transformers. In Proceedings of the European Conference on Computer Vision, Glasgow, UK, 23–28 August 2020; Springer: Berlin/Heidelberg, Germany, 2020; pp. 213–229. [Google Scholar]
- You, J.; Korhonen, J. Transformer for image quality assessment. In Proceedings of the 2021 IEEE International Conference on Image Processing (ICIP), Anchorage, AK, USA, 19–22 September 2021; pp. 1389–1393. [Google Scholar]
- Cheon, M.; Yoon, S.J.; Kang, B.; Lee, J. Perceptual image quality assessment with transformers. In Proceedings of the IEEE/CVF Conference on Computer Vision and Pattern Recognition, Nashville, TN, USA, 20–25 June 2021; pp. 433–442. [Google Scholar]
- Ramachandran, P.; Parmar, N.; Vaswani, A.; Bello, I.; Levskaya, A.; Shlens, J. Stand-alone self-attention in vision models. Adv. Neural Inf. Process. Syst. 2019, 32. [Google Scholar] [CrossRef]
- Qu, Q.; Chen, X.; Chung, Y.Y.; Cai, W. Lfacon: Introducing anglewise attention to no-reference quality assessment in light field space. IEEE Trans. Vis. Comput. Graph. 2023, 29, 2239–2248. [Google Scholar] [CrossRef]
- Zhang, Z.; Tian, S.; Zou, W.; Morin, L.; Zhang, L. Pvblif: A pseudo video-based blind quality assessment metric for light field image. IEEE J. Sel. Top. Signal Process. 2023, 17, 1193–1207. [Google Scholar] [CrossRef]
- Shi, L.; Zhao, S.; Zhou, W.; Chen, Z. Perceptual evaluation of light field image. In Proceedings of the 2018 25th IEEE International Conference on Image Processing (ICIP), Athens, Greece, 7–10 October 2018; pp. 41–45. [Google Scholar]
- Huang, Z.; Yu, M.; Jiang, G.; Chen, K.; Peng, Z.; Chen, F. Reconstruction distortion oriented light field image dataset for visual communication. In Proceedings of the 2019 International Symposium on Networks, Computers and Communications (ISNCC), Washington, DC, USA, 22–25 October 2019; pp. 1–5. [Google Scholar]
- Wang, Z.; Li, Q. Information content weighting for perceptual image quality assessment. IEEE Trans. Image Process. 2010, 20, 1185–1198. [Google Scholar] [CrossRef]
- Wang, Z.; Bovik, A.C.; Sheikh, H.R.; Simoncelli, E.P. Image quality assessment: From error visibility to structural similarity. IEEE Trans. Image Process. 2004, 13, 600–612. [Google Scholar] [CrossRef]
- Zhang, L.; Zhang, L.; Mou, X.; Zhang, D. FSIM: A feature similarity index for image quality assessment. IEEE Trans. Image Process. 2011, 20, 2378–2386. [Google Scholar] [CrossRef]
- Wang, Z.; Simoncelli, E.P.; Bovik, A.C. Multiscale structural similarity for image quality assessment. In Proceedings of the Thirty-Seventh Asilomar Conference on Signals, Systems & Computers, Pacific Grove, CA, USA, 9–12 November 2003; Volume 2, pp. 1398–1402. [Google Scholar]
- Meng, C.; An, P.; Huang, X.; Yang, C.; Chen, Y. Image quality evaluation of light field image based on macro-pixels and focus stack. Front. Comput. Neurosci. 2022, 15, 768021. [Google Scholar] [CrossRef] [PubMed]
Disclaimer/Publisher’s Note: The statements, opinions and data contained in all publications are solely those of the individual author(s) and contributor(s) and not of MDPI and/or the editor(s). MDPI and/or the editor(s) disclaim responsibility for any injury to people or property resulting from any ideas, methods, instructions or products referred to in the content. |
© 2024 by the authors. Licensee MDPI, Basel, Switzerland. This article is an open access article distributed under the terms and conditions of the Creative Commons Attribution (CC BY) license (https://creativecommons.org/licenses/by/4.0/).