Abstract
Industrial defect detection has great significance in product quality improvement, and deep learning methods are now the dominant approach. However, the volume of industrial products is enormous and mainstream detectors are unable to maintain a high accuracy rate during rapid detection. To address the above issues, this paper proposes AMFF-YOLOX, an improved industrial defect detector based on YOLOX. The proposed method can reduce the activation function and normalization operation of the bottleneck in the backbone network, and add an attention mechanism and adaptive spatial feature fusion within the feature extraction network to enable the network to better focus on the object. Ultimately, the accuracy of the prediction is enhanced without excessive loss of speed in network prediction, with competitive performance compared to mainstream detectors. Experiments show that the proposed method in this paper achieves 61.06% (85.00%) mAP@0.5:0.95 (mAP@0.5) in the NRSD-MN dataset, 51.58% (91.09%) is achieved in the PCB dataset, and 49.08% (80.48%) is achieved in the NEU-DET dataset. A large number of comparison and ablation experiments validate the effectiveness and competitiveness of the model in industrial defect detection scenarios.
1. Introduction
In the field of industrial manufacturing, ensuring the quality of industrial products is an important task in this field. For industrial products, a small defect can sometimes jeopardize the overall effect. For instance, broken points in printed circuit boards can affect the stable conduction of signals from equipment, and metal cracks can affect the aesthetics and strength of products. Typically, general industrial product quality inspection is performed by humans, which has a number of drawbacks, including the necessity for substantial initial inspection crew training, which raises the cost of people training. As the time of personnel on duty inspection increases, the rate of false detection due to their reasons rises. With the development of computer vision, the usage of automated quality inspection has become the industry’s solution. Vision detection of industrial defects can reduce costs and improve efficiency.
Over the past decade, large competitions and public datasets [1,2,3] have driven the advancement of deep learning frameworks and object detectors. You Only Look Once (YOLO) [4] is a widely-used real-time one-stage object detection algorithm. It aims to detect and locate objects in an image and predict the category and positional information of each object. This process can be viewed as regressing the predicted location coordinates and class labels for each object. YOLO is known for its speed and simplicity in comparison to other object detection algorithms, making it a favored choice for a variety of applications including industrial defect detection. Kou et al. [5] utilize an anchor-free feature selection mechanism based on YOLOv3 [6] to select the ideal feature scale for steel defect detection. However, the structure of this detector cannot be effectively identified during small defect detection, resulting in a loss of accuracy. The MSFT-YOLO [7] is proposed to detect defects in the steel surface and the transformer module has been added to the backbone and detection heads. This design does result in a positive improvement compared with YOLOv5, but the speed is decreased by 50%, and the model increases more parameters. Tian et al. [8] propose an anchor-free detector based on CenterNet. The detector also had some problems, such as not being able to distinguish defects when the background image is noisy and causing false recognition if the defect boundary is not clearly defined. Although the above detector has achieved relatively good speed, it is unable to reach a high accuracy rate and cannot achieve a good balance between speed and accuracy to meet practical industrial needs. Existing detectors are not competitive in the detection of multiple defective targets, and industrial scenarios are more common than the detection of small defects, incomplete detection of multiple types of defects, and insufficient overall ability of the model.
To meet the demand for defect detection, this paper performs a variety of data augmentation to ensure data diversity for a small number of industrial datasets, proposes an improved industrial defect detector based on YOLOX [9], adds attention mechanism and adaptive spatial feature fusion (ASFF) [10] to the feature extraction network, reduces the activation function and normalization operation for the bottleneck in the backbone network, meets the demand of industrial defect identification and localization for multiple complex scenes, and improves the accuracy of the detector. The proposed method in this paper achieves 61.06% mAP@0.5:0.95 in the no-service rail surface defects (NRSD-MN) [11] dataset, which is 2.79% improvement compared to the baseline and 8.96% improvement compared to YOLOv5-s in the detection. The detection mAP@0.5:0.95 in the printed circuit board (PCB) [12] dataset is 51.58%, an improvement of 1.86% compared to the baseline and 6.39% compared to YOLOv5-s in the detection. The result of the northeastern university surface defect dataset for detection (NEU-DET) [13] is 49.08%, which is 1.47% improvement compared to the baseline and 11.61% improvement compared to YOLOv5-s in the detection.
To summarize, the main contributions of this paper are as follows:
- (1)
- This paper proposes a novel industrial detection network using the efficient channel attention (ECA) mechanism and adaptive spatial feature fusion (ASFF). Three ECA modules are added to the backbone network at three output locations. Four ECA modules are appended after the cross-stage partial (CSP) layer of the feature extraction network. ASFF is designed in front of the decoupled head for better focus on defect details.
- (2)
- The bottleneck of the backbone network is modified to reduce the activation function and normalization operation. A SiLU activation function is removed after the 1 × 1 convolution of the construction, and a normalization function is removed after the 3 × 3 convolution. It simplifies the calculation and speeds up the convergence of the model.
- (3)
- Through comparison experiments with other mainstream models, it is proved that the model in this paper is effective in detecting industrial defects and reflects the overall effectiveness of the model. Extensive ablation experiments proved that the detection effect of the improved model has improved in the visual object classes (VOC) dataset and public industrial dataset (NRSD-MN, PCB, and NEU-DET), which verifies the effectiveness of each module.
- (4)
- We re-labeled the NRSD-MN dataset for detection and segmentation and make it public. The code in this paper is also publicly available on GitHub. Furthermore, all of the project is available under: https://github.com/chairc/NRSD-MN-relabel (accessed date on 1 March 2023).
The rest of the paper is organized as follows. In Section 2, this paper presents an introduction to the mainstream object detectors in recent years and recent work on detection and segmentation in the field of industrial defects. Section 3 is to improve the overall structure of the network and the improved method of each part. The details of the experiments are then presented in Section 4. Section 5 concludes the paper.
2. Related Work
2.1. Convolutional Neural Networks and Object Detectors
During the decade of rapid development of deep convolutional neural networks, AlexNet proposed by Krizhevsky et al. [14] was the gateway to the opening of convolutional neural networks. Subsequently, Szegedy et al. [15] introduced the concept of depth based on this, increasing the depth of convolutional neural networks. Simonyan et al. [16] explored the importance of depth for the network even further by using 3 × 3 convolution instead of 7 × 7 convolution for the network. He et al. [17] came up with the residual network (ResNet) as a solution to the problem of gradient disappearance due to the over-deepening of the network. With the deepening of the network, to reduce the consumption problem caused by a large number of inferences, Wang et al. [18] proposed cross stage partial network (CSPNet) to achieve a rich gradient combination with less computational effort.
The development of deep learning networks is frequently accompanied by the development of object detectors. In the era of deep learning, object detectors are divided into one-stage and two-stage detectors. The former is to complete the detection in just one step, and the latter is from coarse to fine. As the object detector has been updated in recent years, the field of object detectors has rapid development in one-stage detection. The single shot multibox detector (SSD) [19] is a well-known one-stage detector, and the YOLO series [20,21,22] have long been the mainstream object detectors for one-stage detection now.
SSD introduces multi-reference and multi-resolution to improve object detection accuracy. YOLOv1 divides the images into S × S grids and treats the detection framework as a regression problem to determine the probabilities of bounding boxes and classes. YOLO9000 introduces the anchor box strategy, an approach that greatly improves recall rates. YOLOv3 adds multi-scale prediction and residual structure to optimize the detection of small objects. YOLOv4 compares the advanced methods that have been proposed at that time in terms of backbone networks, feature networks, and so on. The optimal method is selected for the combination, thus improving the object detection performance. YOLOv5 has a faster detection speed, a smaller network, and higher accuracy. YOLOX achieves a good balance between accuracy and speed. The problem of defining many anchor boxes for each pixel point on the feature map. This results in generating a large number of anchor boxes, which increases the number of predictions for the image. YOLOX discards the traditional anchor-based strategy and adopts the anchor-free strategy while introducing the decoupled head to make the network converge faster and better.
2.2. Application Development in Industry
In industrial defect detection, defect detection models assisted by the use of deep learning [23] have become the most suitable method to accomplish this task. In Table 1, we briefly summarized some research methods that are similar to ours in recent years. Tabernik et al. [24] overcame the problem of few samples in the field of surface crack detection by proposing a two-stage model design that ultimately achieves high accuracy, requires few labeled samples, and is computationally compact. Han et al. [25] made improvements for pixel class imbalance and an insufficient number of samples based on the Unet network for polycrystalline silicon wafer defect segmentation detection. Dai et al. [26] proposed a new framework for solder joint defect classification based on the concept of active and semi-supervised learning based on the YOLO detector for dense solder joint defect localization in printed circuit board images. He et al. [27] used ResNet as the backbone network and combined it with a multilevel-feature fusion network (MFN) to fuse different levels of feature maps. Furthermore, the region proposal network (RPN) [28] was used to make predictions on the fused complete feature maps to propose a novel inspection system for applications in steel surface scratch detection. Bao et al. [29] introduced the theory of few-shot metal generic surface defect segmentation to address the challenges of insufficient samples. The dataset proposed by Schlagenhauf et al. [30] for the wear inspection of industrial machine tool components can be applied to detect small defects on surfaces, which is an important direction for industrial defect detection applications. Zhang et al. designed a new surface defect detection method based on contextual information segmentation and proposed a new multi-information integration scheme by combining the characteristics of the extracted multi-information.
Emerging industrial detection methods have been proposed in the past year. In addition to its application to steel surface defects, it is also widely used in fabrics [31], wood [32] and other areas. Li and Shao [33] proposed an enhanced defect detection network using multi-head self-attention (MHSA), enabling better industrial product surface defect detection results. Zheng et al. [34] presented a solution for surface defect detection based on YOLOv3. MobileNet [35] was used as the backbone, and they introduced attention mechanism modules such as local self-attention architecture (HaloNet) [36] and squeeze-and-excitation network (SENet) [37] in order to gain a large receptive field. Wang et al. [38] via the way to replace Swin Transformer [39] as the backbone of YOLOX, also modified the detection heads and loss function in the Terahertz detection. Gao et al. [40] verified the effectiveness of defect detection in the Swin Transformer and finally proposed Cas-VSwin Transformer. The model was designed with a new window shift scheme and enhanced feature transfer. A novel nondestructive defect detection network (NDD-Net) [41] was designed by Yang et al. The encoder-decoder structure allows for better localization of defects and the model can focus well on contextual features.

Table 1.
Summary of Previous Studies on Industrial Defect Detection Similar to Our Approach.
Table 1.
Summary of Previous Studies on Industrial Defect Detection Similar to Our Approach.
| Method | Year | Key Features |
|---|---|---|
| Kou et al. [5] | 2021 | An anchor-free feature selection mechanism based on YOLOv3. |
| Guo et al. [7] | 2022 | MSFT-YOLO was designed by incorporating the TRANS module, which is based on the Transformer. |
| Tian et al. [8] | 2022 | An anchor-free detector based on CenterNet was proposed. |
| Dai et al. [26] | 2020 | A novel based on the YOLO framework using active and semi-supervised learning. |
| Li et al. [33] | 2022 | An enhanced defect detection network used multi-head self-attention method. |
| Zheng et al. [34] | 2022 | The MobileNet was modified as the backbone. HaloNet and SENet were utilized in the network. |
| Wang et al. [38] | 2022 | It replaced the Swin Transformer as the backbone of YOLOX. |
3. Architecture of the Detection System
3.1. Baseline Overview
3.1.1. Baseline Selection
YOLOX has 6 different models: YOLOX-nano, YOLOX-tiny, YOLOX-s, YOLOX-m, YOLOX-l, and YOLOX-x. It uses the CSP-Darknet and spatial pyramid pooling (SPP) [42] as the backbone network structure, path aggregation network (PANet) [43] as the neck part of the network, and the head uses a different decoupled head from the previous generation of YOLO series. The benchmark object detector chosen for this paper is YOLOX, which achieves a good balance between speed and accuracy in the overall structure and each substructure. Moreover, it has better convergence in training.
3.1.2. Baseline Structure
CSPNet is designed to reduce the amount of network computation and improve the performance of gradients. Due to its excellent performance in terms of practical results and structural stability, CSP-Darknet is important as the main backbone network for subsequent versions of YOLOv4. The neck part of the baseline utilizes PANet for depth feature extraction and multi-scale feature fusion. The feature pyramid network (FPN) [44] structure is upsampled by top-down, and it outputs the feature maps containing stronger semantic information about industrial defects from the bottom layer to the PAN structure. The PAN structure is downsampled from the bottom up so that the top-level industrial defect features contain strong location information. The fused two features make the feature maps of different sizes contain strong defect semantic information and defect feature information, which ensures accurate prediction of industrial pictures of different sizes in the detection structure. The traditional YOLO head combines classification and regression in a 1 × 1 convolution. However, in the decoupled design, the head part is divided into two convolutions, which implement classification and regression separately. After that, the result of the forecast is incorporated.
3.2. Network Overview
3.2.1. Network Structure
As shown in Figure 1, this paper improves the overall structure of the YOLOX. The improved network structure is divided into a backbone network, a feature extraction network, and a detection network. The improved feature extraction network consists of a backbone network attention extraction layer, a multi-scale feature layer with an attention module, and an adaptive spatial feature fusion layer. The encoder consists of the underlying backbone network and the feature extraction network, and the detection decoder consists of three decoupled detection heads.
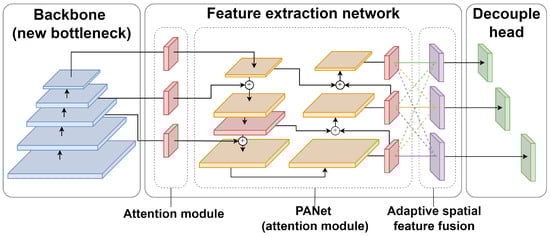
Figure 1.
An overview of the detection network. The blue block is the backbone, the red block is the attention module, the orange block is PANet, the purple block is the adaptive spatial feature fusion, and the green is the decouple head.
3.2.2. Network Improvement
To better focus on industrial defects, this paper adds an ECA [45] module to the back three layers of the backbone network and the output position of the CSP layer of PANet, as shown in Figure 2. Using the ECA module does not add too many parameters to the model in this study. At the same time, it assigns weighting coefficients to the correlation degree of different feature maps, so that it can play the role of strengthening the important features. In this paper, adaptive spatial feature fusion is added after PANet. It weighted and summed the three scale feature information outputs of the three layers after the feature extraction network to enhance the invariance of the feature scales.
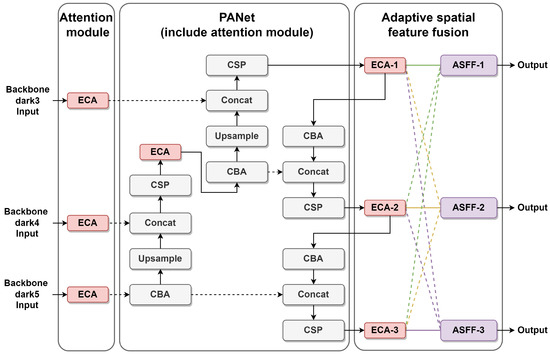
Figure 2.
An overview of the feature extraction network.
3.2.3. Attention Module
Efficient channel attention is a lightweight attention mechanism that is simple, effective, and easy to integrate into existing networks without the need for dimensionality reduction. Local cross-channel interactions are efficiently captured using 1D convolutions to extract inter-channel dependencies, allowing focused features to be reinforced without adding more parameters to the network. To enable the network to learn the desired features every time, this paper adds an ECA module to the improved model, as shown in Figure 3. Each attention group consists of a CSP layer, an ECA module, and a base convolutional block. The CSP layer enhances the overall network’s ability to learn features, and it passes the results of feature extraction into the ECA module. The first step of the ECA module performs an averaging pooling operation on the incoming feature maps. The second step calculates the result using a 1D convolution with a kernel of 3. In the third step, the above results are applied to obtain the weights of each channel using the Sigmoid activation function. In the fourth step, the weights are multiplied with the corresponding elements of the original input feature map to obtain the final output feature map. Finally, a base convolution is used as an overload for network learning. It outputs the results to subsequent base convolution blocks or individually.
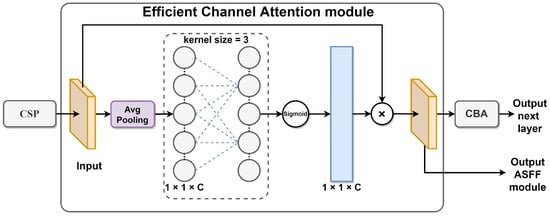
Figure 3.
An overview of the ECA module.
By introducing attention mechanisms, the network focuses more on defect regions, thereby improving detection accuracy. In the case of detecting objects with varying sizes, attention mechanisms can assist the network in processing defect regions of different scales better, thus minimizing the risk of missed detections or false alarms. In addition, attention mechanisms can learn contextual information about defect regions, which improves the robustness and accuracy of defect detection. The ECA module is shown to be effective in improving the accuracy of the network, as demonstrated by a large number of experiments in this paper.
3.2.4. Adaptive Spatial Feature Fusion with Attention Mechanism
The reason for adaptive spatial feature fusion is proposed to solve the inconsistency problem between multi-scale features. It enables the network to learn directly how to spatially filter the features at other levels so that only useful information is retained for combination. As shown in Figure 4, the feature extraction layer in this paper by retaining the ECA module final output of three different scales of feature maps. The adaptive spatial feature fusion mechanism weights and sums the feature map information at different scales of 20 × 20, 40 × 40 and 80 × 80 for these three feature map scales, and calculates the corresponding weights.
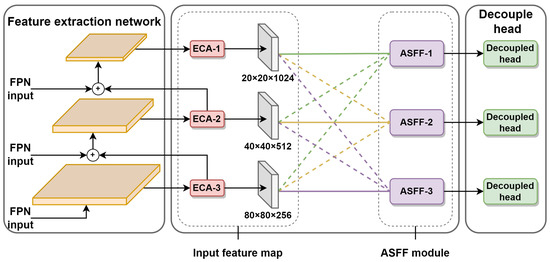
Figure 4.
An overview of the ASFF module with attention mechanism.
In Equation (1), , , represent the feature information from PANet’s three attention mechanisms (ECA-1, ECA-2 and ECA-3), respectively. We multiply the above feature information with the weight parameters , and (i.e., the feature vector shared by , , at position among channels), adjust them to the same size of the feature map and then add them together to get a new fusion layer.
In Equation (2), , and are defined by the softmax function as parameters with sum 1 and range belonging to [0,1] in Equation (3). Equation (4) is the calculation of each weight parameter, where , and are calculated by convolution in , , , and is the set of weight parameters , and .
The multi-scale information is enriched to achieve a spatial attention effect. In this paper, the ASFF module is introduced at the end position of PANet, which is simple to implement for the network, and the additional computational cost is suitable to significantly improve the experimental results.
3.2.5. Bottleneck Micro Design
The ConvNeXt network is proposed by Liu et al. [46] study. It uses an inverse bottleneck structure for large convolution kernels, and fewer normalization and activation functions to improve the model performance. Drawing on this idea, the model in this paper has a micro design of bottleneck in each CSP layer and tries to use the inverse bottleneck structure. However, the results are similar to the original results, and the effect is not significantly improved, so the inverse bottleneck structure is not used in this paper. Eventually, based on the CSP-Darknet model, this paper refers to the bottleneck design pattern of ConvNeXt. A SiLU activation function is removed after the 1 × 1 convolution of the model, and a normalization function is removed after the 3 × 3 convolution, as shown in Figure 5. After testing the reduced normalization and activation function operations separately, the final results are found to be better than the original structure.
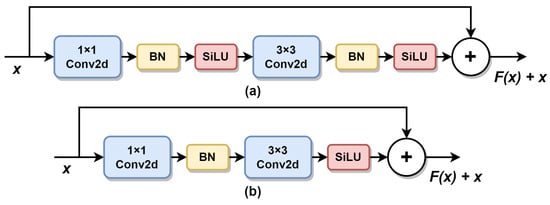
Figure 5.
The bottleneck design structure improvement. (a) The bottleneck structure of CSP-Darknet. (b) The bottleneck structure of the model in this paper.
3.3. Loss Function
In this paper, Binary Cross Entropy (BCE) with Logits Loss and Intersection over Union (IoU) [47] Loss are used in the model decoupling detection head. BCE with Logits Loss combines BCE Loss with a sigmoid function, which applies to both binary and multi-label classification problems. The BCE With Logits Loss function in Equation (5) is as follows:
where is Sigmoid function.
In Figure 6, IoU is the ratio of the intersection area between the bounding box detected by the object detection model and the ground truth annotation box to the union area between them. In this paper, IoU is the term used in this study to denote the intersection and union operation between the predicted coordinates and category information of the industrial defect detection picture results and the information of the real label file.
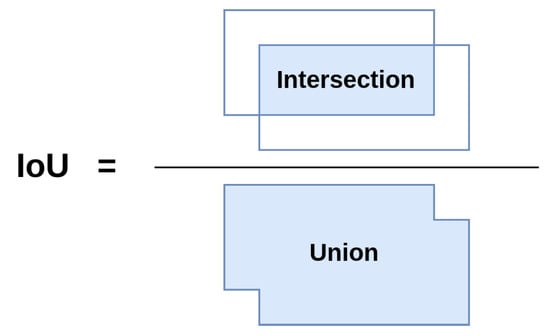
Figure 6.
IoU calculation method, blue represents the area to be calculated.
The IoU Loss function is ultimately implemented by Equation (6), which is as follows:
where is the intersection of ground truth and predicted labels, and is the merging of ground truth and predicted labels.
4. Experiment
This paper uses three publicly available industrial datasets to evaluate the model and reports the mean average precision (mAP@0.5, mAP0.5:0.95), and frames per second (FPS) for each dataset in the detection experiments.
4.1. Dataset
Here are the public datasets used in our experiment: NRSD-MN, PCB, and NEU-DET. The NRSD-MN dataset has a total of 4101 images in 1 category, with image sizes ranging from 400 to 800 pixels. The experiment is divided into 2971 training sets and 1130 validation sets. The PCB dataset has a total of 693 images in 6 categories, all of which are larger than 1000 pixels in size. These 6 categories are missing hole, mouse bite, open circuit, short, spur, and spurious copper. It is divided into 554 training sets and 139 validation sets in the experiment. The NEU-DET dataset consists of 1800 images with 6 types of defects labeled as crazing, inclusion, patches, pitted surface, rolled in scale, and scratches. Furthermore, the image size is 200 × 200 pixels. It is divided into 1620 training sets and 180 validation sets in the experiment. All validation sets are derived from the dataset’s own divisions.
Early industrial datasets have problems such as less variety, less obvious features, lower resolution, and poorer recognition accuracy, so such datasets cannot satisfy the requirements of current detection tasks. To detect complex or multiple defect cases, the bounding box is not limited to detecting defects. In this paper, we add the new annotation files required for the detection to the existing public NRSD-MN dataset for the experiment.
4.2. Processing
Data augmentation is a key part of data processing that can ensure the richness of data types and expand the size of data quantities by dealing with the diversity of image data styles. At the beginning of training, not only are the images randomly cut, scaled, flipped and other basic enhancement operations, but also the images are Mosaic and MixUp [48] processed to make the dataset pattern richer.
4.3. Implementation
The experimental environment for this paper is as follows: Ubuntu 18.04, Python 3.8, Pytorch 1.8.1, CUDA 11.1, and all models are trained and tested with the same NVIDIA RTX 3060 GPU with 12GB memory.
Before training, in order to retain as much as possible better results after the model learns features, the training settings in this paper are as follows. We set the size of the input image as 416 × 416 or 640 × 640. We train the model for 200 epochs, using warmup for 5 epochs. The optimizer is chosen as the stochastic gradient descent (SGD) method. We use the learning rate of 0.01 initially and the cosine lr schedule. To prevent memory overflow during training, the batch size is set to 8 and the network does not use pre-trained weights. We experiment with Mosaic and MixUp data augmentation turned on throughout the training of the NRSD-MN dataset. During training in the PCB and NEU-DET datasets, experiments are conducted using the latter 25 training epochs off Mosaic and MixUp data augmentation.
After training, to verify the effect of comparison experiments and ablation experiments. The comparison experiments are compared with YOLOv3-tiny, YOLOv5-s, YOLOv8-s, YOLOX-tiny, and YOLOX-s. The ablation experiments are contrasted in separate modules to ensure the rigor of the experiments.
4.4. Performance Metrics
The model evaluation metrics commonly used are precision, recall, and mAP. As shown by Equations (7)–(9).
where is the accuracy of the model in predicting industrial defect images and is the percentage of industrial defects correctly identified by the model as a percentage of all images in that category. represents the positive samples predicted by the model as the positive class. represents the negative samples predicted by the model as the positive class. represents the positive samples predicted by the model as negative class. is the average of the area of multiple category precision and recall.
4.5. Experiment Result and Analysis
In this study, we design one group of comparison experiments and four groups of ablation experiments with mAP@0.5:0.95, mAP@0.5, and FPS as evaluation metrics. The detector is based on YOLOX as the baseline. In the industrial defect detection experiments, the YOLOX-tiny and YOLOX-s are used as the basic models and compared with the YOLOv3-tiny, YOLOv5-s and YOLOv8-s. In the figure of the comparison of experimental results, (a) represents the ground truth of the images, (b) represents the predicted labels of the baseline, and (c) represents the predicted labels of the model in this paper. In the table of ablation experiments, this experiment uses A for the ECA module, B for the ASFF module, and C for the modified bottleneck module.
4.5.1. Model Comparison
AMFF-YOLOX in this paper all obtain better results in the defect datasets, as shown in Table 2 and Table 3. The score of 61.06 in the NRSD-MN dataset is higher than the highest score of 57.74 in the baseline, higher than the highest score of 52.10 in the state-of-the-art YOLOv5-s, and well above the highest score of 46.29 in the YOLOv3-tiny. In the PCB dataset, AMFF-YOLOX score in this paper is 51.58, which is higher than the highest score of 49.72 for the baseline, 45.19 for YOLOv5-s, and 42.48 for YOLOv3-tiny. In the NEU-DET dataset, AMFF-YOLOX in this paper achieved a score of 49.08, which is higher than the highest score of 47.61 for the baseline and much higher than the highest scores of YOLOv5-s and YOLOv3-tiny.
Table 2.
Comparative experimental results (mAP@0.5:0.95) of detection in the industrial defect dataset.
Table 3.
Comparative experimental results (mAP@0.5) of detection in the industrial defect dataset.
Compared with the latest YOLOv8 detector, AMFF-YOLOX performs better on the NRSD-MN and NEU-DET datasets but is 2.33% lower than the YOLOv8 on the PCB dataset. We believe that this issue occurred due to the large image size and small size of the defect targets. We plan to optimize the design to address this issue in the future.
The images of the results of AMFF-YOLOX in the NRSD-MN dataset at different luminance scenes are shown in Figure 7. We can see that the baseline has incomplete detection in the first and sixth images. There are multiple checks in the second and fourth images, and in the third image exists a missed check. In the fifth image, both the baseline and AMFF-YOLOX show the phenomenon of multiple detection boxes, but the model in this paper detects the defects completely while using fewer detection boxes than the baseline. In summary, AMFF-YOLOX is suitable for detection in different luminance scenes and achieves the overall expectation.
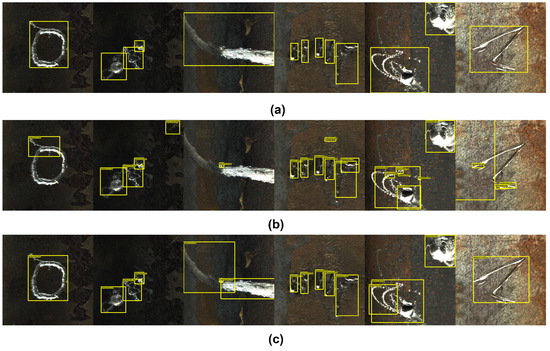
Figure 7.
The NRSD-MN dataset results. (a) Ground truth of the dataset. (b) Baseline prediction label. (c) Model prediction label of this paper.
In this paper, the result images in the NEU-DET dataset are shown in Figure 8. Baseline has the phenomenon of missing detection in the first image, multiple detections in the second image, and incomplete detection in the third image when a single image is used for one class of prediction. Furthermore, when multiple classes of prediction are performed on a single image, there is a missed detection on the fourth image. AMFF-YOLOX has small errors in the first and fourth predictions, although there are no misses, multiple detections, and incomplete detections.
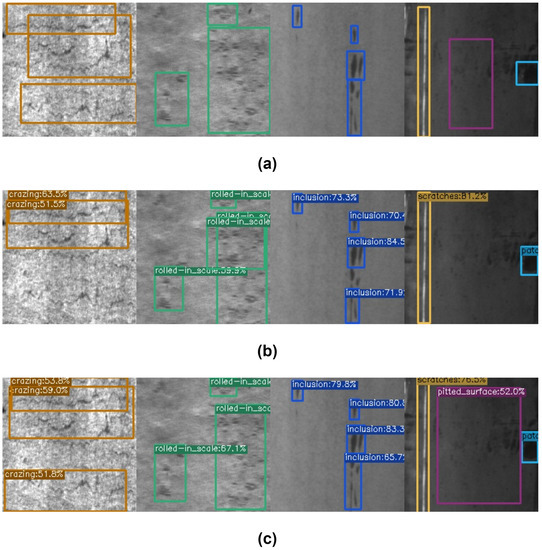
Figure 8.
The NEU-DET dataset results. (a) Ground truth of the dataset. (b) Baseline prediction label. (c) Model prediction label of this paper.
When examining the experimental results on the PCB dataset, we found that both AMFF-YOLOX and the baseline have missed detections, as shown in Figure 9. In the second image, there are also missed detections in the model of this paper, but the total count of missed detections is lower than that of the baseline. Overall, the model in this paper has relatively better performance after improvement.
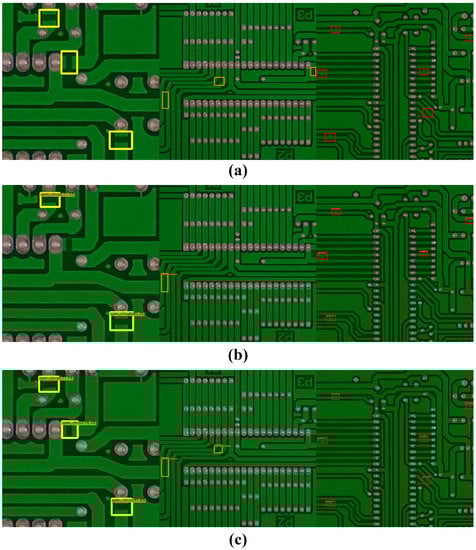
Figure 9.
The PCB dataset results. (a) Ground truth of the dataset. (b) Baseline prediction label. (c) Model prediction label of this paper.
4.5.2. Ablation Experiment in VOC Datasets
To verify the validity of each module of the model in this paper, ablation experiments are first performed in the classical VOC dataset. The experiment uses YOLOX-tiny as the baseline, sets the input size to 416 × 416, and the other training settings are the same as the basic settings, as shown in Table 4. We, respectively, add the attention mechanism to different positions of FPN and PAN of YOLOX-tiny. We discover that adding the attention mechanism to the whole feature extraction network improves the output by 0.11% over FPN alone. Adding the ASFF module after the feature extraction network improves it by 0.81% compared to the original network. We find that adding both the attention mechanism and the ASFF module improves 1.56% compared to the baseline. Regarding speed, all structures can complete inference on the VOC dataset within 3~4 ms. These combinations do not result in significant speed loss in the experimental findings. Therefore, the network in this paper chooses to incorporate an attention mechanism and the ASFF module in the overall feature extraction network as our model.
Table 4.
Results of ablation experiments in the VOC dataset.
4.5.3. Ablation Experiment in Industrial Datasets
The modules selected in this paper are validated for ablation experiments in the NRSD-MN dataset, the PCB dataset, and the NEU-DET dataset. We use YOLOX-s as the baseline and set the input size to 640 × 640 uniformly. Through the testing of YOLOX-tiny in the VOC public dataset, more effective experimental methods are extracted and added to the baseline of this paper.
The impact of each part of the model proposed in this paper on the resultant performance of all metrics is shown in Table 5. The experiments improve 0.98% over the baseline after using the ECA module in the NRSD-MN dataset, 1.40% after using the ASFF module, and 0.52% over the baseline after using the modified bottleneck structure. We add all the modules to the baseline, which is a 2.79% improvement over it. It can be seen that the results of the module included in this paper on a single defective kind of dataset like NRSD-MN improve more in comparison with the baseline. Despite the decrease in the detection rate of 15 FPS, the inference speed of 8ms per image is still maintained. The reduction in speed is not significant, which is sufficient for industrial defect detection applications. The model in this paper achieves a relatively well-improved accuracy without losing too much speed.
Table 5.
Results of ablation experiments in the NRSD dataset.
The results of the ablation experiments under the PCB dataset are shown in Table 6. Our model improves 0.72%, 1.55%, and 1.30% over the baseline using the ECA module, the ASFF module, and the new bottleneck module. When all of the modules were added to the baseline, it improved by 1.86%. As can be seen, the results of the modules added in this paper on a high-resolution dataset like PCB with multiple defect types are significantly improved over the baseline. AMFF-YOLOX can complete the inference of defect images within 8ms, and the inference speed can still reach 125 images per second.
Table 6.
Results of ablation experiments in the PCB dataset.
The results of the ablation experiments on the NEU-DET dataset are shown in Table 7. The model achieved an improvement of 0.87% over the baseline after applying the ECA module separately. Similarly, using only the ASFF module resulted in an improvement of 0.57% over the baseline, while using the modified bottleneck structure led to an improvement of 0.92% over the baseline. Combining all the modules in the baseline improved the model’s performance by 1.47% over the baseline. After using the new bottleneck structure, AMFF-YOLOX improved by 8 FPS compared to using only the ASFF structure, achieving a speed of 131 FPS on this dataset. The introduction of all modules is worthwhile.
Table 7.
Results of ablation experiments in the NEU-DET dataset.
4.5.4. Analysis of Model Performance
In this study, we proposed an improved industrial defect detection network called AMFF-YOLOX, which incorporates attention mechanisms, adaptive spatial feature fusion and improved bottleneck modules to enhance the accuracy of defect detection without sacrificing too much speed. The overall effectiveness and competitiveness of the model were verified through a large number of ablation experiments and comparisons with existing state-of-the-art methods.
One of the main advantages of AMFF-YOLOX is its ability to detect defects of different sizes quickly and accurately. The improved bottleneck structure added to the backbone network effectively enhances the feature extraction capability, allowing the model to capture more subtle details of the defects. It also simplifies the calculation and speeds up the convergence of the model. Moreover, the attention mechanisms and adaptive spatial feature fusion in PANet further improve the accuracy of the detection results by selectively emphasizing informative features and suppressing noise. These improvements are reflected in the experimental results, where the proposed model achieves a 1.58~4.5% improvement in detection accuracy while maintaining a fast inference speed of 6 to 8 ms.
The loss curves of our proposed models are shown in Figure 10. As we can see, all three models experience a rapid decline in loss during the initial training phase, followed by a slower convergence towards a minimum. However, the PCB curve exhibits some instability around the fifth iteration, which we consider to be a normal occurrence. It quickly shows a downward trend, remains in a converged state, and ultimately approaches stability. It is worth noting that the model on the NRSD-MN and NEU-DET datasets demonstrates faster convergence during the early stages of training, which is beneficial in scenarios with limited computational resources.
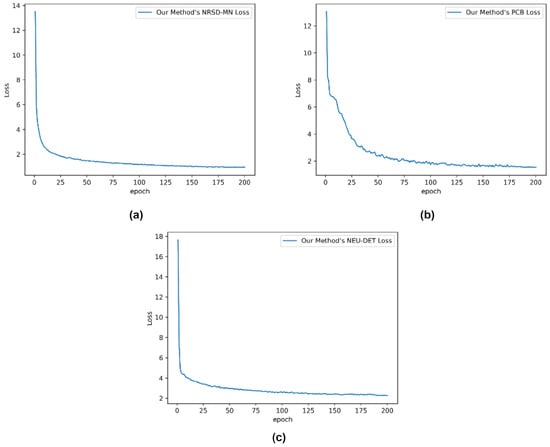
Figure 10.
The loss curve after training. (a) Loss curve of NRSD-MN. (b) Loss curve of PCB. (c) Loss curve of NEU-DET.
4.5.5. Analysis of Failure Cases
Although AMFF-YOLOX achieves decent performance on three public datasets, there are still instances of failed detection for certain types of defects, as depicted in Figure 11. Specifically, (a) shows the ground truth of the images, while (b) illustrates the predicted failure cases of the model in this paper.
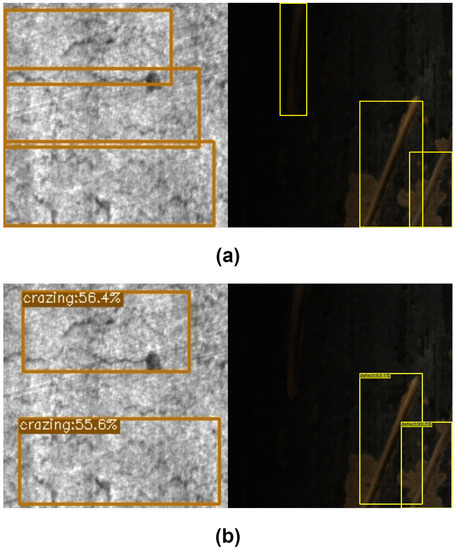
Figure 11.
The failure case results. (a) Ground truth of the dataset. (b) Model prediction failure cases of this paper.
In some cases, the detection performance is hindered by the background. For instance, in Figure 11b, the defect in the first image was missed due to the presence of noise in the background. In the second image, the shallow defect exhibits high similarity to the background information, leading to the detector’s inability to distinguish the color feature content between the background and the defect.
We acknowledge that addressing the similarities between background and flaws remains an open challenge. We believe this is due to the insufficient feature extraction of the model for similar objects, which leads to the model mistakenly identifying defects as background due to similar features, ultimately classifying defects as background. In order to address these limitations, we have three current plans. Firstly, we will modify the backbone network of the model by replacing CSP-Darknet with a multi-scale fusion network. Secondly, we will optimize the image pre-processing effect by adopting more data augmentation methods to increase the prediction of potential scenarios. Thirdly, we will optimize attention mechanisms by using self-attention or hybrid attention mechanisms to enhance feature extraction and improve the network’s ability to obtain contextual information. Further exploration of these limitations and proposing potential solutions or improvements to address them would be valuable in enhancing the detection performance of AMFF-YOLOX.
5. Discussion
For the speed and accuracy issue of the detector and the performance of the model in a variety of detection, this paper proposes an improved industrial defect detection network using the attention mechanism and adaptive spatial feature fusion. In AMFF-YOLOX, the backbone network is improved with a bottleneck structure. Attention mechanisms and adaptive feature fusion are added in PANet. In the end, the accuracy of the inference is enhanced without excessive loss of speed in the network. A large number of ablation experiments have verified the overall network effectiveness and competitiveness of the model in this paper, which can perform fast detection of defects of different sizes and also fast identification of precise defects. In this paper, the training method is also optimized so that the final training and detection results are improved in the VOC dataset and public industrial datasets. In addition, the NRSD-MN dataset is reworked for detection and segmentation annotation, and it is made public.
Mainstream one-stage detectors are general models and could not be optimized enough for industrial defect scenarios. In this paper, the model improves upon the problems existing in current detectors, with a speed loss ranging only within 15~22 FPS and detection inference time ranging from 6 to 8ms, while improving detection accuracy by 1.58~4.5%. However, the performance of the proposed model could also potentially be affected by the presence of background elements, and further research is needed to address potential challenges arising from similarities between background and defects. We will also explore the challenging problem of detecting small defects in defect detection, enabling our model to better adapt to various industrial inspection scenarios in the future.
We hope that the model proposed in this paper will assist industrial practitioners in diverse defect detection tasks and that it will be applicable to a wider array of detection tasks in other domains, such as medical image analysis, community security, autonomous driving, environmental monitoring and so on. Achieving better accuracy, efficiency, and flexibility in the final implementation.
Author Contributions
Conceptualization, Y.C. and H.H.; methodology, Y.C. and Y.T.; software, Y.C.; validation, Y.C. and Y.T.; formal analysis, Y.C.; investigation, Y.C. and Y.T.; resources, Y.T. and H.H.; data curation, H.Y., Y.Z. (Yu Zhang) and Y.Z. (Yuanyuan Zhao); writing—original draft preparation, Y.C.; writing—review and editing, H.H. and J.Z.; visualization, Y.C.; supervision, H.H.; project administration, Y.C. and Y.T.; funding acquisition, H.H. All authors have read and agreed to the published version of the manuscript.
Funding
This research was funded by Shandong Provincial Natural Science Foundation, China (grant number ZR2022MF279), Key R&D project of Shandong Province of China (grant number 2019JZZY020113), 2020 Industrial Internet Innovation and Development Project (grant number TC200802C), Science and Technology SMEs Innovation Capacity Enhancement Project in Shandong Province (grant number 2021TSGC1089), and “20 New Colleges and Universities” Funding Project in Jinan (grant number 2021GXRC074).
Data Availability Statement
The dataset can be accessed upon request. These datasets are derived from the following public domain resources: https://github.com/zdfcvsn/MCnet, https://robotics.pkusz.edu.cn/resources/dataset/, http://faculty.neu.edu.cn/songkechen/zh_CN/zdylm/263270/list/. We make available the following re-labeled dataset resources: https://github.com/chairc/NRSD-MN-relabel (accessed on 1 March 2023).
Conflicts of Interest
The authors declare that there are no conflict of interest regarding the publication of this paper.
References
- Deng, J.; Dong, W.; Socher, R.; Li, L.J.; Li, K.; Fei-Fei, L. Imagenet: A large-scale hierarchical image database. In Proceedings of the 2009 IEEE Conference on Computer Vision and Pattern Recognition, Miami, FL, USA, 20–25 June 2009; pp. 248–255. [Google Scholar]
- Everingham, M.; Van Gool, L.; Williams, C.K.; Winn, J.; Zisserman, A. The pascal visual object classes (voc) challenge. Int. J. Comp. Vis. 2009, 88, 303–308. [Google Scholar] [CrossRef]
- Lin, T.Y.; Maire, M.; Belongie, S.; Hays, J.; Perona, P.; Ramanan, D.; Dollár, P.; Zitnick, C.L. Microsoft coco: Common objects in context. In Proceedings of the Computer Vision–ECCV 2014: 13th European Conference, Zurich, Switzerland, 6–12 September 2014; In Proceedings Part V13. Springer: Cham, Switzerland, 2014; pp. 740–755. [Google Scholar]
- Redmon, J.; Divvala, S.; Girshick, R.; Farhadi, A. You only look once: Unified, real-time object detection. In Proceedings of the IEEE Conference on Computer Vision and Pattern Recognition, Las Vegas, NV, USA, 27–30 June 2016; pp. 779–788. [Google Scholar]
- Kou, X.; Liu, S.; Cheng, K.; Qian, Y. Development of a YOLO-V3-based model for detecting defects on steel strip surface. Measurement 2021, 182, 109454. [Google Scholar] [CrossRef]
- Redmon, J.; Farhadi, A. Yolov3: An incremental improvement. arXiv 2018, arXiv:1804.02767. [Google Scholar]
- Guo, Z.; Wang, C.; Yang, G.; Huang, Z.; Li, G. Msft-yolo: Improved yolov5 based on transformer for detecting defects of steel surface. Sensors 2022, 22, 3467. [Google Scholar] [CrossRef]
- Tian, R.; Jia, M. DCC-CenterNet: A rapid detection method for steel surface defects. Measurement 2022, 187, 110211. [Google Scholar] [CrossRef]
- Ge, Z.; Liu, S.; Wang, F.; Li, Z.; Sun, J. Yolox: Exceeding yolo series in 2021. arXiv 2021, arXiv:2107.08430. [Google Scholar]
- Liu, S.; Huang, D.; Wang, Y. Learning spatial fusion for single-shot object detection. arXiv 2019, arXiv:1911.09516. [Google Scholar]
- Zhang, D.; Song, K.; Xu, J.; He, Y.; Niu, M.; Yan, Y. MCnet: Multiple context information segmentation network of no-service rail surface defects. IEEE Trans. Instrum. Meas. 2020, 70, 1–9. [Google Scholar] [CrossRef]
- Huang, W.; Wei, P. A PCB dataset for defects detection and classification. arXiv 2019, arXiv:1901.08204. [Google Scholar]
- Song, K.; Yan, Y. A noise robust method based on completed local binary patterns for hot-rolled steel strip surface defects. Appl. Surf. Sci. 2013, 285, 858–864. [Google Scholar] [CrossRef]
- Krizhevsky, A.; Sutskever, I.; Hinton, G.E. Imagenet classification with deep convolutional neural networks. Commun. ACM 2017, 60, 84–90. [Google Scholar] [CrossRef]
- Szegedy, C.; Liu, W.; Jia, Y.; Sermanet, P.; Reed, S.; Anguelov, D.; Erhan, D.; Vanhoucke, V.; Rabinovich, A. Going deeper with convolutions. In Proceedings of the IEEE Conference on Computer Vision and Pattern Recognition, Boston, MA, USA, 7–12 June 2015; pp. 1–9. [Google Scholar]
- Simonyan, K.; Zisserman, A. Very deep convolutional networks for large-scale image recognition. arXiv 2014, arXiv:1409.1556. [Google Scholar]
- He, K.; Zhang, X.; Ren, S.; Sun, J. Deep residual learning for image recognition. In Proceedings of the IEEE Conference on Computer Vision and Pattern Recognition, Las Vegas, NV, USA, 27–30 June 2016; pp. 770–778. [Google Scholar]
- Wang, C.Y.; Liao, H.Y.M.; Wu, Y.H.; Chen, P.Y.; Hsieh, J.W.; Yeh, I.H. CSPNet: A new backbone that can enhance learning capability of CNN. In Proceedings of the IEEE/CVF Conference on Computer Vision and Pattern Recognition Workshops, Seattle, WA, USA, 14–19 June 2020; pp. 390–391. [Google Scholar]
- Liu, W.; Anguelov, D.; Erhan, D.; Szegedy, C.; Reed, S.; Fu, C.Y.; Berg, A.C. Ssd: Single shot multibox detector. In Proceedings of the Computer Vision–ECCV 2016: 14th European Conference, Amsterdam, The Netherlands, 11–14 October 2016; In Proceedings Part I–14. Springer: Cham, Switzerland, 2016; pp. 21–37. [Google Scholar]
- Redmon, J.; Farhadi, A. YOLO9000: Better, faster, stronger. In Proceedings of the IEEE Conference on Computer Vision and Pattern Recognition, Honolulu, HI, USA, 21–26 July 2017; pp. 7263–7271. [Google Scholar]
- Bochkovskiy, A.; Wang, C.Y.; Liao, H.Y.M. Yolov4: Optimal speed and accuracy of object detection. arXiv 2020, arXiv:2004.10934. [Google Scholar]
- Wang, C.Y.; Bochkovskiy, A.; Liao, H.Y.M. YOLOv7: Trainable bag-of-freebies sets new state-of-the-art for real-time object detectors. arXiv 2022, arXiv:2207.02696. [Google Scholar]
- Tulbure, A.A.; Tulbure, A.A.; Dulf, E.H. A review on modern defect detection models using DCNNs–Deep convolutional neural networks. J. Adv. Res. 2022, 35, 33–48. [Google Scholar] [CrossRef]
- Tabernik, D.; Šela, S.; Skvarč, J.; Skočaj, D. Segmentation-based deep-learning approach for surface-defect detection. J. Intell. Manuf. 2020, 31, 759–776. [Google Scholar] [CrossRef]
- Han, H.; Gao, C.; Zhao, Y.; Liao, S.; Tang, L.; Li, X. Polycrystalline silicon wafer defect segmentation based on deep convolutional neural networks. Pattern Recogn. Lett. 2020, 130, 234–241. [Google Scholar] [CrossRef]
- Dai, W.; Mujeeb, A.; Erdt, M.; Sourin, A. Soldering defect detection in automatic optical inspection. Adv. Eng. Inform. 2020, 43, 101004. [Google Scholar] [CrossRef]
- He, Y.; Song, K.; Meng, Q.; Yan, Y. An end-to-end steel surface defect detection approach via fusing multiple hierarchical features. IEEE Trans. Instrum. Meas. 2019, 69, 1493–1504. [Google Scholar] [CrossRef]
- Ren, S.; He, K.; Girshick, R.; Sun, J. Faster r-cnn: Towards real-time object detection with region proposal networks. Adv. Neur. Inform. Process. Syst. 2015, 28. [Google Scholar] [CrossRef] [PubMed]
- Bao, Y.; Song, K.; Liu, J.; Wang, Y.; Yan, Y.; Yu, H.; Li, X. Triplet-graph reasoning network for few-shot metal generic surface defect segmentation. IEEE Trans. Instrum. Meas. 2021, 70, 1–11. [Google Scholar] [CrossRef]
- Schlagenhauf, T.; Landwehr, M. Industrial machine tool component surface defect dataset. Data Brief 2021, 39, 107643. [Google Scholar] [CrossRef] [PubMed]
- Chen, M.; Yu, L.; Zhi, C.; Sun, R.; Zhu, S.; Gao, Z.; Ke, Z.; Zhu, M.; Zhang, Y. Improved faster R-CNN for fabric defect detection based on Gabor filter with Genetic Algorithm optimization. Comput. Ind. 2022, 134, 103551. [Google Scholar] [CrossRef]
- Xiong, C.; Hu, S.; Fang, Z. Application of improved YOLOV5 in plate defect detection. Int. J. Adv. Manuf. Technol. 2022, 1–13. [Google Scholar] [CrossRef]
- Li, G.; Shao, R.; Wan, H.; Zhou, M.; Li, M. A model for surface defect detection of industrial products based on attention augmentation. Comput. Intell. Neurosci. 2022, 2022, 9577096. [Google Scholar] [CrossRef] [PubMed]
- Zheng, J.; Zhuang, Z.; Liao, T.; Chen, L. Improved Yolo V3 for Steel Surface Defect Detection. In Proceedings of the 12th International Conference on Computer Engineering and Networks, Haikou, China, 4–7 November 2022; Springer: Cham, Switzerland, 2022; pp. 729–739. [Google Scholar]
- Howard, A.G.; Zhu, M.; Chen, B.; Kalenichenko, D.; Wang, W.; Weyand, T.; Andreetto, M.; Adam, H. Mobilenets: Efficient convolutional neural networks for mobile vision applications. arXiv 2017, arXiv:1704.04861. [Google Scholar]
- Vaswani, A.; Ramachandran, P.; Srinivas, A.; Parmar, N.; Hechtman, B.; Shlens, J. Scaling local self-attention for parameter efficient visual backbones. In Proceedings of the IEEE/CVF Conference on Computer Vision and Pattern Recognition, Nashville, TN, USA, 19–25 June 2021; pp. 12894–12904. [Google Scholar]
- Hu, J.; Shen, L.; Sun, G. Squeeze-and-excitation networks. In Proceedings of the IEEE Conference on Computer Vision and Pattern Recognition, Salt Lake City, UT, USA, 18–23 June 2018; pp. 7132–7141. [Google Scholar]
- Wang, X.; Zhang, Z.; Xu, Y.; Zhang, L.; Yan, R.; Chen, X. Real-Time Terahertz Characterization of Minor Defects by the YOLOX-MSA Network. IEEE Trans. Instrum. Meas. 2022, 71, 1–10. [Google Scholar] [CrossRef]
- Liu, Z.; Lin, Y.; Cao, Y.; Hu, H.; Wei, Y.; Zhang, Z.; Lin, S.; Guo, B. Swin transformer: Hierarchical vision transformer using shifted windows. In Proceedings of the IEEE/CVF Conference on Computer Vision and Pattern Recognition, Nashville, TN, USA, 19–25 June 2021; pp. 10012–10022. [Google Scholar]
- Gao, L.; Zhang, J.; Yang, C.; Zhou, Y. Cas-VSwin transformer: A variant swin transformer for surface-defect detection. Comput. Ind. 2022, 140, 103689. [Google Scholar] [CrossRef]
- Yang, L.; Fan, J.; Huo, B.; Li, E.; Liu, Y. A nondestructive automatic defect detection method with pixelwise segmentation. Knowl.-Based Syst. 2022, 242, 108338. [Google Scholar] [CrossRef]
- He, K.; Zhang, X.; Ren, S.; Sun, J. Spatial pyramid pooling in deep convolutional networks for visual recognition. IEEE Trans. Pattern Anal. Mach. Intell. 2015, 37, 1904–1916. [Google Scholar] [CrossRef]
- Liu, S.; Qi, L.; Qin, H.; Shi, J.; Jia, J. Path aggregation network for instance segmentation. In Proceedings of the IEEE Conference on Computer Vision and Pattern Recognition, Salt Lake City, UT, USA, 18–23 June 2018; pp. 8759–8768. [Google Scholar]
- Lin, T.Y.; Dollár, P.; Girshick, R.; He, K.; Hariharan, B.; Belongie, S. Feature pyramid networks for object detection. In Proceedings of the IEEE Conference on Computer Vision and Pattern Recognition, Honolulu, HI, USA, 21–26 July 2017; pp. 2117–2125. [Google Scholar]
- Wang, Q.; Wu, B.; Zhu, P.; Li, P.; Zuo, W.; Hu, Q. ECA-Net: Efficient channel attention for deep convolutional neural networks. In Proceedings of the IEEE/CVF Conference on Computer Vision and Pattern Recognition, Seattle, WA, USA, 13–19 June 2020; pp. 11534–11542. [Google Scholar]
- Liu, Z.; Mao, H.; Wu, C.Y.; Feichtenhofer, C.; Darrell, T.; Xie, S. A convnet for the 2020s. In Proceedings of the IEEE/CVF Conference on Computer Vision and Pattern Recognition, New Orleans, LA, USA, 18–24 June 2022; pp. 11976–11986. [Google Scholar]
- Yu, J.; Jiang, Y.; Wang, Z.; Cao, Z.; Huang, T. Unitbox: An advanced object detection network. In Proceedings of the 24th ACM International Conference on Multimedia, Amsterdam, The Netherlands, 15–19 October 2016; pp. 516–520. [Google Scholar]
- Zhang, H.; Cisse, M.; Dauphin, Y.N.; Lopez-Paz, D. mixup: Beyond empirical risk minimization. arXiv 2017, arXiv:1710.09412. [Google Scholar]
Disclaimer/Publisher’s Note: The statements, opinions and data contained in all publications are solely those of the individual author(s) and contributor(s) and not of MDPI and/or the editor(s). MDPI and/or the editor(s) disclaim responsibility for any injury to people or property resulting from any ideas, methods, instructions or products referred to in the content. |
© 2023 by the authors. Licensee MDPI, Basel, Switzerland. This article is an open access article distributed under the terms and conditions of the Creative Commons Attribution (CC BY) license (https://creativecommons.org/licenses/by/4.0/).