Abstract
The real environment impacts the fuel and energy consumption of any vehicle: technology, physical and social phenomena, traffic, drivers’ behaviour, and so on; many of them are difficult to quantify. The authors’ methodology was used to test the real impact of vehicles in “standard” urban conditions, and many generations of hybrid powertrains are compared. One of the latest performance indexes is the percentage of time the vehicle runs with zero emissions (ZEV). For example, the hybrid vehicle tested ran up to 80% with no emissions and fuel consumption below 3 L per 100 km. A few energy performance indicators were compared between five vehicles: one battery electric vehicle (BEV), two hybrid gasoline–electric vehicles (HEVs), and two traditional vehicles (one diesel and one gasoline). Their potential to use only renewable energy is unrivalled, but today’s vehicles’ performances favour hybrid power trains. This paper summarises the most sustainable powertrain for urban use by comparing experimental data from on-road testing. It also evaluates the benefits of reducing emissions by forecasting the Italian car fleet of 2025 and three use cases of the evolution of car fleets, with a focus on Rome.
1. Introduction
The European Green Deal commits the 27 EU member states to reducing their emissions by at least 55% by 2030 compared to 1990 levels. The European Commission’s targets for reducing CO2 emissions from new cars and vans include, by 2030, a 55% reduction for cars and 50% for non-passenger vehicles (NPVs). The Commission promotes the market’s growth for zero-emission and low-emission vehicles [1]. The EU has set 2050 as the date for carbon neutrality, that is, for an economy with net greenhouse gas emissions equal to zero. This goal is the core of the European Green Deal and aligns with the EU’s commitment to global climate action under the Paris Agreement [2].
Road transport was responsible for 31% of fuel consumption in 2016 (passenger cars and motorcycles represent about 50% of the transport sector) [3]. In 2020, this sector contributed about one-fifth of the EU’s total emissions of carbon dioxide (CO2), the leading greenhouse gas (GHG), 75% of which originates from passenger cars [4]. Therefore, in line with the EU Green Deal objectives (2030–2050), this work analyses possible solutions for reducing greenhouse gas (GHG) emissions due to road transportation, with particular attention to cars. From a long-term perspective (2030–2050), the EU Green Deal objectives foresee the development of an adequate charging infrastructure network. Therefore, it may increase the advantages for BEVs, significantly reducing the consumption of non-renewable primary energies and GHG emissions linked to the “new” car fleet.
The proposed analysis evaluates the effects of the proposed intervention in terms of the following:
- Global effects of assessing the consumption of non-renewable primary energy (NRPE) and GHG emissions;
- local polluting emissions such as CO, NOx, NO2, NH4, volatile organic compounds (VOCs), CH4, and PM.
The proposed study is based on the results of the performance analysis of the latest generation of vehicles under actual conditions of use, like other works conducted by the research group [5,6,7]. The vehicle choice is limited to availability for tests.
This analysis is based on data acquired in several experimental on-road testing campaigns; the vehicles compared are
- Toyota Prius Hybrid 2016;
- Toyota Yaris Gasoline 2017;
- Toyota Auris Diesel 2017;
- Nissan Leaf 2018;
- Toyota Yaris Hybrid 2020.
The NRPE and WTW calculated for these vehicles have been used to evaluate the impacts of vehicle replacement in a few future scenarios, by applying the average value to the relative vehicle category (size and fuel type); the one without any experimental data used average values from the literature.
This study comments on the possible reduction in emissions obtainable through converting a part of the circulating car fleet. As for the global effects, the well-to-wheel (WTW) analysis shows that for the present electric mix in the EU, the performance of hybrid vehicles is substantially similar to that of battery electric vehicles (BEV) [8].
The energy transition towards producing electricity mainly from renewable sources is a process that has already begun but will require a longer time. In the short term, replacing older vehicles with BEVs is unrealistic due to the actual electricity production amount and mix. It would not bring advantages in reducing NRPE and GHG emissions; moreover, it would require an affordable and well-dimensioned infrastructure with many charging stations (in terms of numbers and charging types).
The evolution of the Italian car fleet can be applied to the case study of the province of Rome. A few hypotheses of older vehicle replacement allow for assessing the impact on NRPE and GHG emissions without any need for additional infrastructure, and it considers which solution will better tackle the challenge of climate change. The first and second replacement hypotheses follow the scrappage schemes used to promote car turnover, similar to past initiatives made by the Italian government; the third one is the market evolution without any push measure or national program.
The paper is divided into five sections: this introduction, the WTW analysis, the car fleet analysis, the results, and the conclusions.
2. WTW Analysis
The WTW analysis concerns the well to tank (WTT) and the tank to wheel (TTW). Both take care of the global effects (consumption NRPE and GHG emissions) of full hybrid (HEV) and electric (BEV) vehicles [9].
The WTW analysis is divided into two sub-parts: WTT and TTW.
2.1. Well To Tank (WTT)
The well-to-tank analysis of the electricity considers the GHG emissions of the electric production Italian mix and the electricity conversion in the electric charging stations, which depends on the average efficiency of the charging system [10], as reported in Figure 1.
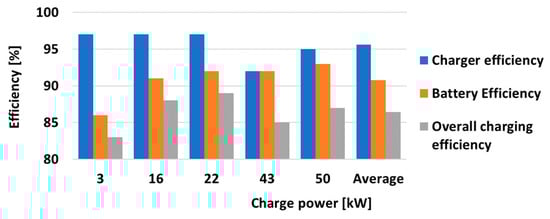
Figure 1.
Charger efficiency, battery efficiency, and overall charging efficiency by the power of the charging system (with average values).
As reported in [11], Figure 2 shows the energy conversion of electricity, the conversion of 3.165 MJ as input (kinetic, potential, or chemical) to electric energy results in 1.287 MJ. Then, after the transport, transformation, and distribution, it remains at 1.149 MJ, and the energy stored in the vehicle battery is 1.000 MJ.
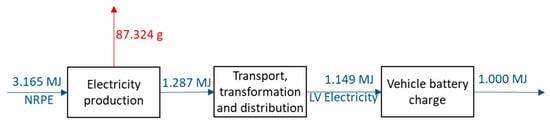
Figure 2.
Well-to-tank analysis of electricity considering the charging device [12].
Similarly, Figure 3 shows the WTT analysis for the NRPE (fuels): gasoline and diesel; both pass through crude oil extraction and transport and then oil refining and distribution. Therefore, to produce 1.000 MJ of energy usable from a vehicle, as is known, gasoline requires 1.155 MJ of NRPE and 1.176 MJ of diesel. Furthermore, electricity production is more impactful, requiring more NRPE than fuels to reach the target of 1.000 MJ (available for direct consumption in vehicle storage).
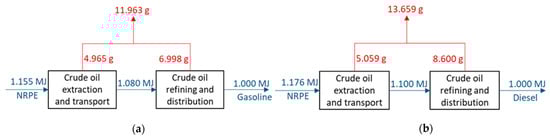
Figure 3.
WTT analysis for gasoline (a) and diesel (b) [12].
So, Table 1 reports the GHG WTT emission factor (EF) for each fuel type, including electricity ([12,13,14]). It varies yearly due to the growth of renewable energy production facilities (solar panels and wind generators), which reduce the weight of non-renewable and more polluting production in the energy-production mix.

Table 1.
WTT Emission Factor (kgCO2/kWh).
2.2. Tank To Well (TTW)
The on-road testing campaigns allow data to be acquired to measure the performance of vehicles through the on-board diagnostic (OBD) plug [15,16]. Table 2 shows the average energy consumption values of the vehicles considered in this paper.
Table 2.
Energy consumption in real drive conditions for HEV and BEV.
Table 2 values came from [8] for the BEV, [5] for the HEVs, and [6,7] for traditional ones (gasoline and diesel). Many literature sources study vehicle consumption in real conditions; [17,18,19,20,21] are only a few of them, and all evaluations deliver comparable values to those reported. Therefore, those values can be applied to the relative vehicle types in the replacement scenarios, while the types without any experimental data use the literature EFs.
Each vehicle has evaluated the local emission at the tailpipe with a simplified TIER3 (COPERT, [22]); the cold start and milage deterioration have been considered negligible.
Equation (1) allows the evaluation of each pollutant’s emission factor (EF, measured in g/km); depending on the road arc’s average speed, it allows the evaluation of a kinematic sequence (KS) emission [22]. Each category has its range of validity and its coefficients, with a constant EF when the average speed of the arc (or KS) is below a minimum value.
The method prescribes all coefficients α, β, γ, δ, ε, ζ, η, and a reduction factor (RF) for all categories of vehicles. Equation (1) aims to calculate the specific EF of all KSs.
A KS is a sequence of road arcs, a portion of the driving cycle (DC) that starts and ends when the vehicle is steady. Each sequence has a similar driving style and driver behaviour; the route has the same characteristics (in orography and road regulation) [23]. The paper [24] describes how to divide the DC into KSs, which is partly introduced in [25,26,27,28]. The on-road testing campaign characterises each sequence regarding driver attitude, vehicle performance, and non-renewable primary energy (NRPE).
Table 3 reports the EF for each vehicle tested in previous works, the fuel type, EURO standard, distance travelled (km), and the tank-to-wheel (TTW) emission factors for primary pollutants (CO, NOx, VOC, CH4, PM, and GHG). The measuring units of all pollutants and GHG emissions are g/km. The electric vehicle (Nissan Leaf) has no TTW emissions.
Table 3.
TTW Emission factors of the vehicle models (electric vehicle excluded) tested by the authors.
The vehicle number forecasting of the next section also considers methane-powered vehicles, so those powertrains that have not been tested with the same used the EF from the literature. GHG emissions include many pollutants, and the World Meteorological Organization (WMO) measures the concentrations of a few of those that are rising: carbon dioxide (CO2), methane CH4), nitrous oxide (NOx), hydrochlorofluorocarbons (HCFCs), hydrofluorocarbons (HFCs), and ozone in the lower atmosphere.
2.3. WTW Analysis Results
Figure 4 reports the whole WTW analysis by summing both contributions of WTT and TTW emissions. It includes two graphs: the specific consumption of NRPE (a) and the GHG emissions (b).
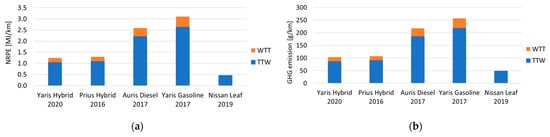
Figure 4.
Specific NRPE (a) and specific GHG emission (b) of the vehicles analysed.
The NRPE, evaluated from the OBD plug, of BEV vehicles exceeds 39% of the HEV ones. In comparison, GHG emissions are substantially the same, and the BEV emits 53% less than HEV.
3. Car Fleet Analysis
This paper proposes a study of today’s Italian circulating car fleet and a near-future forecast (up to 2025). The EU does not yet define the EURO 7 pollutant limits, which will be required by 2025, so further forecasting (from 2026 onwards) could be unreal. Then, we evaluate the case study of Rome province by applying the market evolution of the Italian fleet. This evaluation aims to understand the benefits of hybrid and electric vehicles when they replace the oldest technologies and older EURO standards in five years.
This chapter concerns the Italian car fleet forecasting, the circulating car fleet of Rome province, and the Rome car fleet of 2025.
3.1. Italian Car Fleet Forecasting
The average replacement time of Italian vehicles is 7.5 years (1.5 million cars scrapped per year, 3.8% of the Italian fleet), which can be increased with national incentives up to 2.1 million as happened in 2021 (5.3%) [29]. This study is based on Automobile Club d’Italia (ACI) data [30]. The Rome province fleet ranges from 100 to 145 thousand vehicles scrapped annually.
Table 4 shows the distribution of scrapped vehicles for 2021 in Italy, divided by vehicle size and EURO standard.
Table 4.
Distribution of the scraped vehicles for 2021 in Italy by size and EURO standard.
Table 5 reports the circulating Italian car fleet from 2015 to 2021, divided by fuel (methane-powered vehicles and gasoline–methane are counted in the same category). Assumptions in the event of more drastic political choices may considerably differ from these projections. Figure 5 shows the vehicle trends; each curve fits with a polynomial function (Equation (2)).
Table 5.
Circulating car fleet in Italy of 2021.
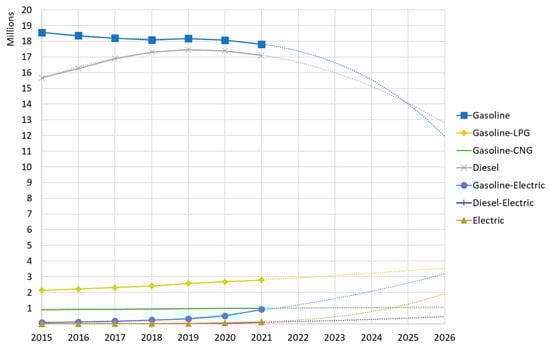
Figure 5.
Trends of vehicles divided by fuel.
Table 6 describes the coefficients of Equation (2) and their correlation factor R2, while Table 7 compares vehicles between 2021 values and the 2025 forecasting. It shows a remarkable rise in gasoline CNG, HEV, and BEV numbers (almost 180% and more), with a slight increase in gasoline LPG ones (22%) and a steady or moderate decrease in gasoline and diesel ones (respectively 1% and 22% reduction).
Table 6.
Fit line coefficients by fuel.
Table 7.
Italian vehicle numbers prediction for 2025 against 2021.
Table 8 provides the average distance travelled divided by fuel [31] with forecasting in the following decades. The annual average distance for electric and hybrid vehicles is assumed to equal to that of gasoline vehicles. In contrast, the LPG vehicles do not have a reference value, so the average value between diesel and gasoline annual distances has been hypothesised (10,650 km per year).
Table 8.
Average distance travelled for gasoline and diesel vehicles, km per year.
3.2. Circulating Car Fleet of Rome Province
The ACI provides vehicle numbers divided by EURO standard and fuel [30]. Table 9 reports vehicle numbers of Rome province in 2021; a few thousand vehicles are non-classified in the EURO standard and do not have one of the main standard fuel/powertrains cited in Table 9, so they are neglected.
Table 9.
Vehicle number divided by EURO standard and fuel for Rome province (2021).
Figure 6 shows the principal distributions with percentage values divided by fuel (a) and the EURO standard (b). The source provides for each category the vehicle size as requested by the COPERT model (small, medium, and large).
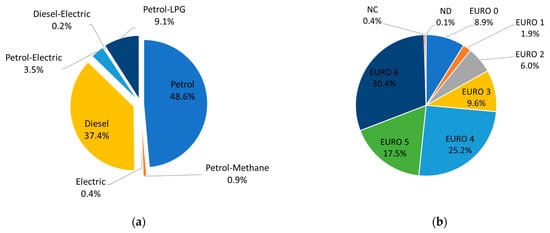
Figure 6.
Vehicle distribution by fuel (a) and by EURO (b).
3.3. The Rome Car Fleet of 2025
The forecasting of 2025 emissions is hypothesised in three scenarios:
- Scrapping of EURO 0 to EURO 2 vehicles (affecting 17% of the circulating fleet);
- Scrapping of EURO 0 to EURO 3 vehicles (affecting 27% of the circulating fleet);
- Market evolution accordingly to the Italian trend.
Table 10 shows the forward-looking car fleet of 2025 divided by EURO, fuel, and vehicle size in the case of actual market evolution without any further push measures for the scrappage.
Table 10.
Rome car fleet adopted with the third scenario until 2025.
- The scenarios mentioned above are only a few of the possible ones. The first and second involve more pollutant vehicles with scrappage schemes used to promote car turnover similar to past initiatives made by the Italian government; they assume the replacement of vehicles by maintaining the same power supply, using the hybrid version (if available). Thus, gasoline will become a gasoline–electric hybrid, and diesel will be a EURO 6 diesel. Hybrid diesel still does not have the same market appeal as hybrid gasoline (HEV), and there is not enough vehicle availability to be a suitable substitution in most cases. The third scenario aims to compare previous schemes with no other national policies. It follows the market evolution, for example, the same proportion of the national car fleet trend and the same scrapping rate.
The peculiarities of these projections are as follows:
- Each year there are many scrapped vehicles in all EURO categories (even in EURO 6), following the proportion shown in Table 4;
- The new vehicles have the latest EURO standard;
- Each fuel category has a defined proportion by size; it is assumed to be the same as the 2021 car fleet.
4. Results
The results compare the emissions of Rome’s car fleet in 2021 with the forecasting of 2025 within the three scenarios proposed.
4.1. Actual Rome Car Fleet Emissions
Figure 7 shows emissions evaluation in tons with a logarithmic scale for the circulating car fleet in Rome province (2.7 Mln vehicles) in 2021. The main fuel types are gasoline, LPG, CNG (methane), and diesel. The figure shows the impact of fuel on pollutants and fuel consumption (FC or NPRE). The emissions are calculated by multiplying the car fleet in Table 10 by the average annual distance as in Table 8 and by the relative EFs in Table 3.
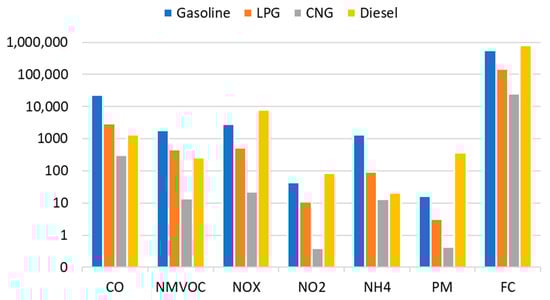
Figure 7.
Emissions and FC divided by fuel type in 2021.
4.2. Emissions of the 2025 Car Fleet
Table 11 shows the pollutant emissions, fuel consumption (FC or NRPE), and CO2 (WTW) for each scenario hypothesised (values in tons; if the fuel is electricity, the unit is MWh).
Table 11.
Three scenarios emissions and fuel consumption evaluation up to 2025; values in tons (kWh if the fuel is electricity).
The table above reports the emissions of the new car fleet in 2025, the emissions avoided, and the percentage avoided compared with the total emissions of 2021 (Av./tot %). Negative values of this percentage mean bad results with rising relative pollutants.
The new fleet values came from the vehicle replacement results, so the second scenario involves more vehicles than the first one (the first involves EURO 0 to EURO 2, while the second is up to EURO 3). The new fleet of the third scenario means the whole circulating fleet.
The first and second scenarios show the highest reduction for almost all pollutants, and the third scenario has fewer impacts on fuel consumption and GHG. Those three scenarios involve the same number of vehicles, but each has a different fuel and EURO standard proportion.
The first two scenarios hypothesised a more significant replacement of the oldest vehicles (EURO 0 and 1) with the same numbers as the others. The first involves 19% and the second 31% of total circulating vehicles. The third scenario maintains many of the oldest technologies with many replacements in the middle ones (from EURO 0 to EURO 3), which are greater in number and still polluting. Indeed, they avoid 6.9%, 9.1%, and 2.6% of NRPE, respectively. At the same time, CO2 decreased by 6.9%, 9.2%, and 5.8% in the whole WTW cycle.
The third scenario avoids only 2% of NH4 and 6.6% of VOC, and 7% of CO, while significantly reducing PM (54%).
5. Conclusions and Future Developments
The present paper analyses possible solutions for reducing greenhouse gas (GHG) emissions due to road transportation, with particular attention to cars. It bases the evaluation on experimental data acquired in previous projects; thus, few innovative vehicles are evaluated in terms of emissions and fuel or energy consumption.
A WTW analysis allows the evaluation of GHG emissions from these recent powertrains: hybrid, electric, diesel, and gasoline. All of them had been tested in real on-road driving (some in previous works). Therefore, it allows for comparing the impacts of different scenarios for fleet replacement.
The manuscript compares the Italian circulating car fleet and forecasts for the next five years; this evaluation is obtained through interpolation with polynomial curves fitted in the last five years’ open data. This projection foresees the following:
- A sharp increase in HEVg (gasoline–electric), HEVd (diesel–electric), and BEV sectors by 180%, 251%, and 238%, respectively;
- A moderate rise in bi-fuel gasoline–LPG by 22% and gasoline–CNG by 265%;
- A slight decrease in gasoline (1%) and diesel vehicles (18%).
Then, the obtained forecasting was applied to the case study of Rome province with three replacement scenarios:
- First, scrapping of EURO 0 to 2 vehicles involving 19% of the whole circulating car fleet;
- Second, scrapping of EURO 0 to 3 vehicles involving 31% of the whole circulating car fleet;
- Third, actual market growth equal to the Italian trend.
- The manuscript has hypothesized only a few scenarios of the possible ones to exemplify a comparison method. The first and second involve more pollutant vehicles with scrappage schemes similar to past initiatives made by the Italian government; they assume the replacement of vehicles by maintaining the same power supply, using the hybrid version (if available). The third scenario represents no specific national policy that follows the Italian market evolution of 2021.
The case study results are:
- The GHG and the NRPE reductions are between 7% and 3%;
- The scrapping of EURO 0 to EURO 2 vehicles guarantees a significant reduction in CO, VOC, NOx, and PM;
- The third scenario (market growth) has less benefit in pollution reduction, but it has a more significant impact on reducing the FC (with respect to the first and second scenarios).
In the long-term perspective of decarbonising the energy mix (see Figure 8, [29]), BEV vehicles’ performance in terms of WTW analysis will significantly improve (Figure 9). As shown in Figure 9, the long-term replacement of the vehicle fleet with BEV vehicles (2030–2050) could have considerable advantages regarding NRPE consumption and GHG emissions.
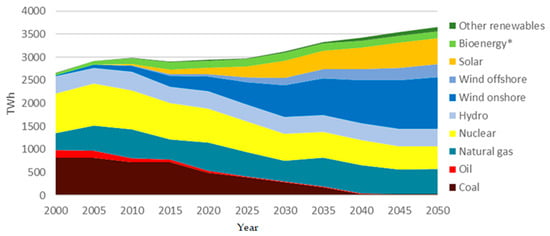
Figure 8.
Gross electricity generation by year and power plants, the * represents renewable energy generated through biomass fuel burning.
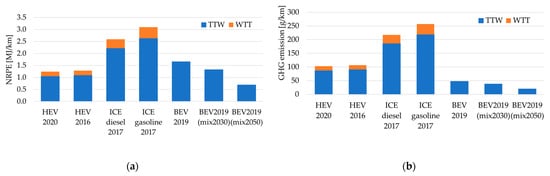
Figure 9.
Specific non-renewable energy consumption (a) and specific GHG emission (b) for HEV, BEV (current mix), BEV (mix 2030), and BEV (mix 2050).
In the 2030 EU electricity production scenario [32], the non-renewable primary energy consumption of BEV vehicles compared to the (current) HEVs would go from +54% to +3%; in the 2050 scenario, it would reach −30%. As for GHG emissions, the variation goes from −4% to −42% in 2030 to −67% in 2050.
Further development of this study can come from the updating of
- Simulations with the next EURO 7 standard;
- Experimental data of biogenic fuels and other powertrains (hybrid or not);
- Emissions relative to the production mix of 2021 and 2022 (the recent rise in energy prices pushes the installation of renewable production plants and reduces the GHG emissions of energy usage);
- User acceptance of new technologies and market analysis will allow understanding of people’s choices for vehicle replacement (e.g., someone could replace an obsolete diesel vehicle with a BEV or a methane one);
- Analysis of transport behaviour with the distance travelled annually divided by the fuel and vehicle category.
Those developments address a new evaluation of NRPE and GHG reduction so that they might produce results and approaches with more adherence to reality.
Author Contributions
Conceptualisation and methodology, A.A. and F.C.; data analysis, F.C. and F.O. (Fernando Ortenzi); WTW analysis, A.S. and F.Z.; writing, F.C.; coordination and supervision, A.A. and F.O. (Fabio Orecchini). All authors have read and agreed to the published version of the manuscript.
Funding
This research received no external funding.
Data Availability Statement
Not applicable.
Acknowledgments
The authors thank TMI (Toyota Motor Italia) and TME (Toyota Motor Europe). They have collaborated in the realisation of the study underlying this work by providing vehicles for the tests, software, and hardware for data acquisition.
Conflicts of Interest
The authors declare no conflict of interest. The funders had no role in the design of the study; in the collection, analyses, or interpretation of data; in the writing of the manuscript; or in the decision to publish the results.
Abbreviations
| Abbreviation | Description |
| ACI | Automobile Club d’Italia |
| BEV | Battery Electric Vehicle |
| CH4 | Methane |
| CNG | Compressed Natural Gas |
| CO | Carbon Oxide |
| CO2 | Carbon Dioxide |
| COPERT | The EU standard vehicle emissions calculator |
| DC | Driving Cycle |
| EF | Emission Factor |
| GHG | Greenhouse Gas |
| HCFC | Hydrochlorofluorocarbons |
| HEV | Hybrid-electric Vehicle |
| HFC | Hydrofluorocarbons |
| KS | Kinematic Sequence |
| LPG | Liquid Petroleum Gas |
| NH4 | Ammonia |
| NO2 | Nitrogen Dioxide |
| NOx | Nitrogen Oxide |
| NPV | Non-Passenger Vehicle |
| NRPE | Non-Renewable Primary Energy |
| OBD | On-Board Diagnostic |
| PM | Particulate Matter |
| TTW | Tank To Wheel |
| VOC | Volatile Organic Compound |
| WMO | World Meteorological Organization |
| WTT | Well To Tank |
| WTW | Well To Wheel |
| ZEV | Zero Emission Vehicle |
References
- European Commission. Delivering the European Green Deal. 2021. Available online: https://ec.europa.eu/info/strategy/priorities-2019-2024/european-green-deal/delivering-european-green-deal_en (accessed on 13 December 2021).
- European Commission. 2050 Long-Term Strategy. 2021. Available online: https://ec.europa.eu/clima/eu-action/climate-strategies-targets/2050-long-term-strategy_it (accessed on 29 December 2021).
- Capros, P.P. EU Energy, Transport and GHG Emissions—Trends to 2050. 2016. Available online: http://pure.iiasa.ac.at/id/eprint/13656/1/REF2016_report_FINAL-web.pdf (accessed on 13 January 2022).
- European Environment Agency (EEA). Greenhouse Gas Emissions by Aggregated Sector. 2019. Available online: www.eea.europa.eu/data-and-maps/daviz/ghg-emissions-by-aggregated-sector-5#tab-dashboard-02 (accessed on 10 January 2022).
- Orecchini, F.; Santiangeli, A.; Zuccari, F.; Alessandrini, A.; Cignini, F.; Ortenzi, F. Real Drive Truth Test of the Toyota Yaris Hybrid 2020 and energy analysis comparison with the 2017 model. Energy 2021, 14, 8032. [Google Scholar] [CrossRef]
- Orecchini, F.; Santiangeli, A.; Zuccari, F. Hybrid-electric system truth test: Energy analysis of Toyota Prius IV in real urban drive conditions. Sustain. Energy Technol. Assess. 2020, 37, 100573. [Google Scholar] [CrossRef]
- Orecchini, F.; Santiangeli, A.; Zuccari, F.; Ortenzi, F.; Genovese, A.; Spazzafumo, G. Nardone. Energy consumption of a last generation full hybrid vehicle compared with a conventional vehicle in real drive conditions. Energy Procedia 2018, 148, 289–296. [Google Scholar] [CrossRef]
- Gustafsson, M.; Svensson, N.; Eklund, M.; Möller, B. Well-to-wheel climate performance of gas and electric vehicles in Europe. Transp. Res. Part D Transp. Environ. 2021, 97, 102911. [Google Scholar] [CrossRef]
- Elgowainy, A.; Han, J.; Poch, L.; Wang, M.; Vyas, A.; Mahalik, M.; Rousseau, A. Well-to-Wheels Analysis of Energy Use and Greenhouse Gas Emissions of Plug-In Hybrid Electric Vehicles; Argonne National Lab. (ANL): Argonne, IL, USA, 2010. [Google Scholar] [CrossRef]
- Genovese, A.; Ortenzi, F.; Villante, C. On the energy efficiency of quick DC vehicle battery charging. World Electr. Veh. J. 2015, 7, 570–576. [Google Scholar] [CrossRef]
- Edwards, R.; Rose, K.; Nelson, R.; Hamje, H.; Godwin, S.; Reid, A.; Maas, H.; Lonza, L.; Hass, H.; Krasenbrink, A.; et al. Well-To-Wheels Analysis of Future Automotive Fuels and Powertrains in the European Context; Publications Office of the European Union: Luxembourg, 2014. [Google Scholar] [CrossRef]
- Cirillo, M. Parametri Standard Nazionali. 2018. Available online: https://www.mite.gov.it/sites/default/files/archivio/allegati/emission_trading/tabella_coefficienti_standard_nazionali_11022019.pdf (accessed on 22 December 2021).
- Caputo, A. Fattore di Emissione Atmosterica di a Effetto gas Serra nel Settore Elettrico Nazionale e nei Principali Paesi Europei. 2020; ISBN 978-88-448-0992-8. Available online: https://www.isprambiente.gov.it/files2020/pubblicazioni/rapporti/Rapporto317_2020.pdf (accessed on 20 December 2021).
- De Gennaro, M.; Paffumi, E.; Martini, G.; Manfredi, U.; Vianelli, S.; Ortenzi, F.; Genovese, A. Experimental Test Campaign on a Battery Electric Vehicle: On-Road Test Results (Part 2). In Proceedings of the SAE 2015 World Congress & Exhibition, Detroit, MI, USA, 21–23 April 2015. [Google Scholar] [CrossRef]
- Alessandrini, A.; Filippi, F.; Ortenzi, F. Consumption calculation of vehicles using OBD data. In Proceedings of the International Emission Inventory Conference, Tampa, FL, USA, 13–16 August 2012. [Google Scholar]
- Lee, C.; Öberg, P. Classification of Road Type and Driving Style Using OBD Data; SAE Technical Papers; SAE: Warrendale, PA, USA, 2015. [Google Scholar] [CrossRef]
- ISFORT. 17° Rapporto Sulla Mobilità Degli Italiani. 25 November 2020. Available online: https://www.isfort.it/wp-content/uploads/2020/12/RapportoMobilita2020.pdf (accessed on 15 January 2022).
- Audimob. 2019. Available online: https://www.isfort.it/ricerca/audimob/ (accessed on 15 January 2022).
- Fontaras, G.; Zacharo, N.-G.; Ciuffo, B. Fuel consumption and CO2 emissions from passenger cars in Europe—Laboratory versus real-world emissions. Prog. Energy Combust. Sci. 2017, 60, 91–131. [Google Scholar] [CrossRef]
- Tsokolis, D.; Tsiakmakis, S.; Dimaratosa, A.; Fontaras, G.; Pistikopoulosa, P.; Ciuffo, B.; Samaras, Z. Fuel consumption and CO2 emissions of passenger cars over the New Worldwide Harmonized Test Protocol. Appl. Energy 2016, 179, 1152–1165. [Google Scholar] [CrossRef]
- Galvin, R. Energy consumption effects of speed and acceleration in electric vehicles: Laboratory case studies and implications for drivers and policymakers. Transp. Res. Part D Transp. Environ. 2017, 53, 234–248. [Google Scholar] [CrossRef]
- Ntziachristos, L.; Samaras, Z.; European Environment Agency (EEA). EMEP/EEA Air Pollutant Emission Inventory Guidebook 2016—Update July 2018; Publications Office of the European Union: Luxembourg, 2018; Available online: https://www.eea.europa.eu/themes/air/air-pollution-sources-1/emep-eea-air-pollutant-emission-inventory-guidebook (accessed on 27 November 2021).
- Crauser, J.-P.; Maurin, M.; Joumard, R. Representative Kinematic Sequences for the Road Traffic in France. J. Passeng. Cars 1989, 98, 1011–1018. [Google Scholar]
- Cignini, F.; Alessandrini, A.; Orecchini, F.; Santiangeli, A.; Zuccari, F.; Ortenzi, F. A statistical analysis to compare results of different on-road vehicle performance testing. Transp. Res. Part D 2022, 107, 103281. [Google Scholar] [CrossRef]
- Tartaglia, M. L’inquinamento Dell’aria da Traffico Stradale. Analisi, Calcolo, Valutazione; Bios: Cosenza, Italia, 1999; ISBN 9788877402707. [Google Scholar]
- Kenworthy, J.R. Driving Cycles, Urban Form and Transport Energy. Ph.D. Thesis, Murdoch University, Singapore, 1986. Available online: https://researchrepository.murdoch.edu.au/id/eprint/125/ (accessed on 19 January 2022).
- Ganji, B.; Kouzani, A.Z.; Trinh, H. Drive Cycle Analysis of the Performance of Hybrid Electric Vehicles. In Proceedings of the ICSEE 2010, Wuxi, China, 17–20 September 2010. [Google Scholar] [CrossRef]
- Kent, J.H.; Allen, G.H.; Rule, G. A driving cycle for Sydney. Transp. Res. 1978, 12, 147–152. [Google Scholar] [CrossRef]
- Castelli, M. Quanto Tempo Servirà per Rinnovare il Parco Auto Circolante Italiano? Fleet Magazine, 25 October 2021. Available online: https://www.fleetmagazine.com/parco-auto-circolante-italiano-tempi-rinnovamento/ (accessed on 10 January 2022).
- ACI. Open Parco Veicoli. 2022. Available online: http://www.opv.aci.it/WEBDMCircolante/ (accessed on 22 January 2022).
- Unione petrolifera. Roadmap della Mobilità Sostenibile fino al 2030. 2016. Available online: http://www.unem.it/wp-content/uploads/2017/02/Allegato-3_Posizione-UP-su-Tavolo-mobilit%C3%A0-sostenibile.pdf (accessed on 19 January 2022).
- European Commission. Stepping Up Europe’s 2030 Climate Ambition Investing in a Climate-Neutral Future for the Benefit of Our People. 17 September 2020. Available online: https://ec.europa.eu/transparency/documents-register/detail?ref=SWD(2020)176&lang=en (accessed on 15 December 2021).
Disclaimer/Publisher’s Note: The statements, opinions and data contained in all publications are solely those of the individual author(s) and contributor(s) and not of MDPI and/or the editor(s). MDPI and/or the editor(s) disclaim responsibility for any injury to people or property resulting from any ideas, methods, instructions or products referred to in the content. |
© 2023 by the authors. Licensee MDPI, Basel, Switzerland. This article is an open access article distributed under the terms and conditions of the Creative Commons Attribution (CC BY) license (https://creativecommons.org/licenses/by/4.0/).