Abstract
Ransomware attacks on cloud-encrypted data pose a significant risk to the security and privacy of cloud-based businesses and their consumers. We present RANSOMNET+, a state-of-the-art hybrid model that combines Convolutional Neural Networks (CNNs) with pre-trained transformers, to efficiently take on the challenging issue of ransomware attack classification. RANSOMNET+ excels over other models because it combines the greatest features of both architectures, allowing it to capture hierarchical features and local patterns. Our findings demonstrate the exceptional capabilities of RANSOMNET+. The model had a fantastic precision of 99.5%, recall of 98.5%, and F1 score of 97.64%, and attained a training accuracy of 99.6% and a testing accuracy of 99.1%. The loss values for RANSOMNET+ were impressively low, ranging from 0.0003 to 0.0035 throughout training and testing. We tested our model against the industry standard, ResNet 50, as well as the state-of-the-art, VGG 16. RANSOMNET+ excelled over the other two models in terms of F1 score, accuracy, precision, and recall. The algorithm’s decision-making process was also illuminated by RANSOMNET+’s interpretability analysis and graphical representations. The model’s openness and usefulness were improved by the incorporation of feature distributions, outlier detection, and feature importance analysis. Finally, RANSOMNET+ is a huge improvement in cloud safety and ransomware research. As a result of its unrivaled accuracy and resilience, it provides a formidable line of defense against ransomware attacks on cloud-encrypted data, keeping sensitive information secure and ensuring the reliability of cloud-stored data. Cybersecurity professionals and cloud service providers now have a reliable tool to combat ransomware threats thanks to this research.
1. Introduction
Due to the growth of cloud services and the ever-increasing volume of online data, safeguarding the privacy and accessibility of encrypted data stored in the cloud has become an essential problem [1]. Cyber threats such as ransomware attacks have become increasingly common and destructive in recent years: “malicious software that sneaks onto computers, encrypts important files, and then demands a ransom to decrypt them” is described in [2]. These attacks on individuals, organizations, and even government bodies have resulted in major financial losses and data breaches. The two most prominent methods for detecting ransomware—signature-based methods and rule-based systems—have been unable to keep up with the rapidly evolving nature of ransomware attacks [3]. Updating signatures and rules often to detect new variants might decrease reaction times and leave systems vulnerable to new assaults. The encrypted nature of cloud data limits accessibility and analysis, making it difficult to detect ransomware assaults using conventional approaches [3,4].
Transfer learning is a technique that allows the transfer of knowledge learned from pre-trained models on large-scale datasets, which can be used to improve detection accuracy even in the absence of labeled ransomware samples. Using transfer learning, the suggested strategy compensates for the scarcity of ransomware data and enhances detection capabilities [4,5].
The devastating financial losses and compromises in data privacy and security that can arise from ransomware attacks have made them a prominent cybersecurity worry in recent years. Ransomware is malicious software that infiltrates systems and encrypts data in order to demand payment. These attacks have had devastating results for individuals, businesses, and government institutions. Cloud-based systems that contain huge amounts of sensitive data have been a common target for ransomware attacks [5,6] due to their broad use and potential for large-scale effects. Since ransomware is constantly adapting, signature-based approaches and rule-based systems for detecting it have proven insufficient. Updating signatures and rules often to detect new variants might decrease reaction times and leave systems vulnerable to new assaults. As a result of the encrypted nature of cloud data, traditional methods of detecting ransomware assaults [7] are ineffective due to a lack of data accessibility and analysis.
This inquiry was prompted by the increasing frequency and severity of ransomware attacks that target cloud environments. Traditional ransomware detection methods are useless because ransomware strains constantly evolve. The encrypted nature of cloud data presents additional challenges for detection systems, making it all the more important to explore innovative ways that may effectively identify ransomware attacks in this encrypted context [8]. The employment of transfer learning and deep learning ensembles is motivated by the expectation of enhanced detection precision and adaptability. The goal of the study is to improve detection capabilities in the face of constantly evolving ransomware strains by employing transfer learning to circumvent the limitations of insufficient labeled data. Using deep learning ensembles in detection systems can improve cloud-based security by capturing more features [9]. Using cutting-edge methods such as transfer learning and deep learning ensembles for ransomware detection [10], this research aims to strengthen the protections afforded by cloud-based systems and shield sensitive data from dangerous cyber-attacks.
The results of this investigation have far-reaching implications. First, ransomware attacks have become more common and more severe in cloud environments that store large volumes of sensitive data. To better detect ransomware assaults in cloud environments, our research fills a key need in the current security landscape. The proposed approach has appealing potential for dealing with the growing threat of ransomware since it makes use of transfer learning and deep learning ensembles.
Second, by employing transfer learning to detect ransomware, we have made a significant and novel contribution. Transfer learning can assist in enhancing ransomware detection accuracy even in environments with a small number of labeled samples. This research shows that transfer learning strategies can be effective in cybersecurity, especially against ransomware.
The development of a deep learning ensemble framework for ransomware detection is another important step forward. Using a large number of deep learning models to collect diverse characteristics, the ensemble framework improves detection performance and robustness. This new technique can help in the design of better real-time detection systems for ransomware [11].
In order to better detect ransomware assaults in cloud environments, our research will concentrate on encrypted data. Due to their inflexibility and lack of precision, current detection systems are unable to detect and prevent ransomware attacks in real time, especially in an encrypted environment. We desperately need innovative approaches that may circumvent these challenges in order to defend against ransomware in the cloud.
The following are the goals of this study:
- RANSOMNET+ is a hybrid model that combines Convolutional Neural Networks (CNNs) and pretrained transformers, and its goal is to accurately classify ransomware assaults on cloud-encrypted data;
- To create an effective and secure model of encrypted cloud data, we propose to leverage the local pattern-capturing skills of CNNs and the hierarchical feature extraction capabilities of transformers;
- The main objective is to evaluate RANSOMNET+’s effectiveness in detecting ransomware attacks by employing a wide range of metrics, such as training and testing accuracy, loss, precision, recall, and F1 score;
The contributions of this research paper are as follows:
- We presented a new hybrid model, RANSOMNET+, which combines Convolutional Neural Networks (CNNs) with pre-trained transformers to classify ransomware attacks from cloud-encrypted data;
- RANSOMNET+ combines the hierarchical properties learned by transformers with the local patterns acquired by CNNs to efficiently represent encrypted data stored in the cloud;
- Extensive testing revealed that RANSOMNET+ outperformed competing models by a wide margin, with a training accuracy of 99.6% and a testing accuracy of 99.1%;
- RANSOMNET+’s high precision, recall, and F1 score demonstrate its efficacy in separating benign from harmful information;
- Training and testing loss, precision, recall, and F1 score were just some of the many performance measures we examined during our comprehensive review of RANSOMNET+;
- When compared to other state-of-the-art models, such as ResNet 50 and VGG 16, RANSOMNET+ was found to have better accuracy and performance;
- We integrated visual representations of feature distributions, outlier identification, and feature relevance to make the model more understandable and trustworthy.
By focusing on these goals, our initiative hopes to help further research into ransomware and provide more robust security measures for cloud-based computing infrastructure. This paper will describe the proposed method, experimental setup, results, and debates in great depth, highlighting the potential of transfer learning and deep learning ensemble models in enhancing ransomware attack detection on cloud-encrypted data.
This paper’s outline is as follows: In Section 1, we discuss the importance and challenges of identifying ransomware assaults on cloud-encrypted data. In Section 2, we present a summary of previous studies on the topic, with an emphasis on ransomware detection methods and the application of transfer learning and deep learning ensemble models to the field of cyber security. Using examples, Section 3 explains how to implement the proposed approach. This includes how to make use of transfer learning and build the deep learning ensemble model. In Section 4, we show and discuss our experimental setup, data sets, metrics for evaluation, and analyses. Section 5 provides a synopsis of the study’s findings, discusses their significance, and suggests future research directions.
2. Related Work
It is now a major security risk for computers to become infected with ransomware, which encrypts user data. Modern ransomware strains are more dangerous than their older counterparts because they employ complex obfuscation tactics and can operate without an active C2 server. The need for a unified framework to aid with ransomware detection, prevention, and mitigation is the driving force for this research. The article [12] introduced the Detection Avoidance Mitigation (DAM) framework, which organizes and describes existing methods of countering ransomware. By conducting a comprehensive review and synthesis of the relevant literature, similarly in [13] accomplished an important advancement in the field by establishing a uniform methodology. The Djvu Ransomware case study is intended to demonstrate the ransomware’s tactics and to provide countermeasures. DAM is a framework developed to fortify systems against ransomware.
There is a major risk to network infrastructure because of the rise of hostile threats against computer networks and digital services. In order for one website to link to another, a system called the “domain name system” (DNS) must be in place. The difficulties of discovering hidden tunnels and avoiding conventional detection methods must be surmounted if these DNS intrusions [14] are to be spotted. Statistical analysis and Bi-directional Recurrent Neural Network (BRNN) methods are used to construct an intrusion detection model in this research paper, with the goal of revealing hostile DNS over HTTPS (DoH) requests made through covert channels. The method is 100% accurate in identifying malicious DoH searches using data from the Canadian Institute for Cybersecurity’s CIRA-CIC-DoHBrw-2020 dataset. The proposed model, which uses fewer features than competing methods, yields better results at a higher throughput during training and testing.
Customers with concerns about malware and data loss in the cloud are not crazy. Although the effectiveness of virus detection has been the subject of multiple research, renters’ rights to privacy in the cloud are rarely taken into account. In this research work [6] introduced a novel cloud-based malware detection technique based on semi-supervised transfer learning (SSTL). Detection, foresight, and transfer are the pillars upon which the model rests. Researchers have developed a byte classifier based on recurrent neural networks to safeguard user data stored in the public cloud. There is not enough data for the byte classifier to improve its supervised learning performance beyond 94.72%. Accuracy in the prediction phase has been improved to 99.69% thanks to a new ASM classifier. To enhance the byte classifier’s training, the transfer module uses semi-supervised learning to merge predicted labels and byte attributes from an unlabeled dataset. The accuracy of the detection part was improved using semi-supervised transfer learning, and testing on Kaggle malware datasets showed an increase from 94.72% to 96.9%. This method improves malware detection accuracy and addresses tenants’ privacy concerns.
In a review of the research literature [15], we looked at techniques that employ machine learning and deep learning to detect ransomware. The destructiveness of ransomware, the difficulty of undoing infections caused by ransomware, and the critical need for early discovery spurred this inquiry. The importance of machine learning in the fight against ransomware means that it is time to assess where the present defenses fall short and how they may be improved. The emergence of new families and strains in cyberspace and the shadows is a worrying sign of the situation’s severity. The complex encryption techniques used by ransomware make the removal of an infection difficult. Concurrent with the increased deployment of AI technologies has been an increase in ransomware attacks. Since machine learning and deep learning can accurately detect zero-day attacks and build prediction models to unearth new types and families of ransomware, they are of great interest for this task. The author conducted a systematic literature evaluation of prominent machine learning and deep learning works on ransomware detection. The author also conducted experimental evaluations to examine the impact of malware evolution on the issues raised.
Recent advancements in machine learning and deep learning for ransomware detection are the topic of this state-of-the-art review [7]. The critical need to defend computer systems from ransomware attacks sparked this investigation. The ability of machine learning and deep learning techniques to identify zero-day attacks and build prediction models based on ransomware behavior has increased their widespread adoption. The author of this review included research using machine learning or deep learning methodologies for ransomware detection because those methods have received a high number of citations. The author also ran studies to determine how malware evolution might have affected the results. The author also speculates on the possible directions that ransomware could go in the future, including spreading to IoT devices and seeing increased use in both households and businesses.
There has been a rise in the use of computers and the Internet for the storage and transfer of private information. The term “cyber-ransomware” elicits broad feelings of fear and alarm. Crypto-ransomware is a type of malicious software that encrypts data and then demands payment to decrypt it. Numerous machine learning-based detection investigations have been conducted; however, cybercriminals are always developing new forms of encryption to avoid detection. Users’ private information may still be at risk if ransomware attacks go undetected. Using your phone’s camera to capture events, as suggested in [16], is advantageous because it negates the need for a backup. SVM analyzes 22 encrypted file formats, extracts unique features from each, and achieves an 85.17 percent detection rate. This method’s high performance and efficacy are demonstrated by the fact that its detection rate is greater than 92% when combined with the SVM kernel Trick (Poly).
New exploits in computer systems are discovered and used by ransomware as they evolve. Researchers and practitioners alike rely on machine learning techniques for ransomware detection and mitigation, particularly transfer learning. Transfer learning, in which models are used to solve other problems, can help make ransomware detection systems more accurate and adaptable. There is a growing corpus of work on ransomware detection, and it is getting increasingly difficult to identify the machine learning algorithms and transfer learning techniques used in this research. The goal of this study [17] was to help researchers better understand ransomware detection frameworks and common machine learning algorithms, particularly those that use transfer learning to extract ransomware’s dynamic properties. These ransomware detection frameworks, datasets, and issues are investigated in detail. Researchers and practitioners can use the results of this comparison study to improve their usage of transfer learning to detect ransomware.
Because of its capacity to encrypt data and block access to it, ransomware poses a significant security concern to enterprises. The article [12] developed a technique for analyzing traffic from file-sharing platforms to improve the detection of ransomware assaults. Deep learning (DL) and transfer learning (TL) are two examples of machine learning algorithms used to monitor client-server communication for suspicious behavior indicative of ransomware during file reading and overwriting. Both clear-text and encrypted file-sharing techniques work with the solution without any modifications needed. After comparing multiple machine learning models, the most successful one is chosen for validation. These results show that the author’s taught and tested detection model is successful against all ransomware binaries, even those that have not yet been found. ‘Not infected’ traffic from actual users was used alongside more than 70 ransomware files representing 26 different strains during the model’s training and testing phases. To guarantee the procedure is reliable, this study investigates the number of false positives and the amount of file encryption used before detection. The plan uses DL, TL, and traffic analysis to improve ransomware detection, safeguarding the organization’s infrastructure and data in the process.
Ransomware becomes a major issue for everyone from individuals to large corporations when files can be accessed from various servers. The research study in [12] proposed a method to combat this problem by keeping an eye on file-sharing traffic for signs of crypto-ransomware. The program detects ransomware-like behavior in file reading and overwriting by keeping tabs on client-server communication and using machine learning techniques. Because it may be used with either plaintext or encrypted file-sharing protocols, the approach is flexible and complete. The program has been trained and tested extensively with a wide variety of ransomware binaries and ‘not infected’ traffic, demonstrating that it is capable of recognizing all reported ransomware versions, including previously undiscovered ones. This research provides additional proof of the algorithm’s effectiveness by looking at the number of false positives and the amount of file encryption needed before discovery.
In another study [18], the author applies machine learning methods to the challenge of identifying maliciously encrypted messages. Detecting harmful encrypted traffic is a challenging problem, however, this paper [18] gives a thorough examination of the existing methods and datasets, as well as compares and contrasts numerous machine learning techniques. Several techniques and data sets are analyzed for their ability to detect such activity. The strengths and weaknesses of various machine learning methods for detecting malicious traffic in encrypted networks are compared and contrasted in this study. Researchers and practitioners can utilize the data to better protect themselves from these dangers.
To restrict people from accessing their files or disclosing important information, ransomware is a particularly dangerous form of malware. The inability to access encrypted files is a major issue for ransomware victims. Binary analysis of malware can be helpful for learning about the encryption methods used by different varieties of ransomware. In this article [19], the author examined the ecosystem for detecting ransomware, including the criteria, factors, and tools utilized in the process, and made comparisons between various methods and techniques. Researchers have also proposed a ransomware indexing system to better facilitate search, similarity checking, sample categorization, and clustering. The technique identifies native ransomware binaries using hybrid data from a static analyzer. By providing businesses with useful data and advice, this strategy enhances their ransomware defense.
A study [20] proposed a cloud-based method for classifying zero-day attacks using ML algorithms and cloud services. This research made use of Amazon Web Services to train and evaluate ML algorithms using a novel anomaly detection dataset, UGRansome1819. Three Machine Learning (ML) algorithms—Naive Bayes, Random Forest, and Support Vector Machine—are used in the proposed method of Ensemble Learning with a Genetic Algorithm optimizer. The terms “accuracy”, “F1-score”, “confusion matrix”, “recall”, and “precision” were all used to describe different aspects of a system’s performance. The results of the experiments demonstrate that UGRansome1819 provides superior classification accuracy to previously utilized datasets. The Genetic Algorithm can be used to pick features in order to reduce computational effort and prevent inappropriate model fitting. Classification accuracy can be enhanced by using an ensemble of classifiers, as in the optimum validation approach. The optimization procedure improves the accuracy of the SVM model and leads to high levels of specificity and sensitivity.
Cloud security is a vital area of study because of the challenges posed by cloud resource sharing, outsourcing, and multi-tenancy. New security issues have emerged due to the widespread adoption of web-based and trusted third-party technologies employed in the provision of cloud services. Despite significant progress accomplished in developing security models, procedures, and regulations, there are still obstacles to detecting new or unknown attacks and improving detection accuracy in the cloud. Deep learning (DL) and transfer learning (TL) are two examples of machine learning approaches that have been used to improve cloud security within these constraints [9,21]. Automatic and precise classification of safe and risky data is now achievable with the help of machine learning techniques. As a subset of machine learning, deep learning (DL) has proven particularly effective at addressing cloud security issues. In-depth discussions on cloud security, from the most basic precautions to the most advanced AI-based defenses. In addition to finding security holes in the cloud, it also assesses machine learning and DL-based security solutions and offers cutting-edge ways of managing vulnerabilities and threats.
Locking data with cryptographic methods, the ransomware then demands payment to unlock it. Current security measures are tested in the face of zero-day ransomware attacks, which exploit previously unknown flaws. Zero-shot Learning (ZSL) allows us to deal with classes we have no prior experience in a safe manner when there is no time to collect training data before an attack. ZSL uses a combination of deep learning (DL) and transfer learning (TL) to achieve this. In this study, we introduced the Deep Contractive Autoencoder-based Attribute Learning (DCAE-ZSL) method and its counterpart, the Heterogeneous Voting Ensemble (HVE) Inference Stage (IS) [22]. DCAE-ZSL employs a Contractive Autoencoder (CAE) to extract fundamental characteristics of both known and unknown malware, while the IS aggregates many voting criteria to arrive at a final prediction. Models that are trained with contractive embeddings perform well against zero-day attacks, according to empirical evidence. The suggested voting-based ensemble (DCAE-ZSL-HVE) uses these essential features to better detection of zero-day attacks (recall = 0.95, FN = 6).
Infection with ransomware, a type of malicious software, can have devastating effects on its victims. The severity of these assaults can be reduced if they are discovered as soon as feasible. None of the numerous studies that have looked at the history, classification, current risks, and potential countermeasures of ransomware have addressed the need for dynamic analysis for ransomware detection across platforms. In order to address this gap in knowledge, the research work [1] looked into the datasets employed by cross-platform ransomware detection studies. As an added bonus, it provides a concise overview of research on ransomware detection strategies that make use of dynamic analysis, machine learning, deep learning, and hybrid approaches. By examining the subject of ransomware detection from the viewpoint of dynamic analytic methodologies, this study offers a fresh viewpoint on the topic.
Encrypted communications have become the standard on the internet as a result of the increased concern for personal privacy and sensitive information. While there are numerous good uses for encryption, it is also being used by bad actors to hide their own misdeeds from the public eye. Especially after COVID-19, when malicious encrypted traffic became increasingly common, this is of paramount importance. Deep packet inspection and other traditional security approaches are rendered ineffective due to the impossibility of doing simple payload content analysis. In order to detect bogus encrypted messages, it is crucial to employ machine learning-based methods. In this study [23], the authors conducted a systematic review of the methods currently in use to use machine learning to detect harmful encrypted communication. Recent research has struggled to provide fair comparisons of model performance due to the use of varying datasets. Because of this, the author merged data from five sources to create a more comprehensive and accurate dataset for use in future studies. The suggested system employs transfer learning (TL) and deep learning (DL) methods in an effort to improve the detection of ransomware assaults on cloud-encrypted data.
Using machine learning techniques, the following articles [8,24] demonstrate their ability to accurately detect ransomware in a local cloud setting (Table 1). In order to boost the reliability of ransomware detection, the study suggests using meta-features retrieved from volatile memory. Taking these meta-features into consideration, the proposed method aims to provide a reliable and quick method of detecting ransomware attacks in a private cloud environment. The fundamental contribution of this research is a methodology for extracting meta-features from RAM that can be used to enhance ransomware detection. In an effort to improve ransomware defense strategies in private cloud environments, the findings may be valuable for researchers and practitioners alike.

Table 1.
Comparison of previous studies.
The cybersecurity sector is in dire need of ransomware detection and prevention solutions [25]. Many tactics for protecting against ransomware attacks have been discussed in the academic literature [26,27,28,29]. Some of the methods that have been investigated by researchers for ransomware detection include dynamic analysis [30], machine learning algorithms [31], file entropy studies [32], deep learning models [33], and transfer learning [34,35]. Meta-features extracted from volatile memory and the analysis of encrypted traffic have both been investigated for their potential use in ransomware detection.
Several gaps in understanding persist despite advances in ransomware detection methods. To begin, there is an urgent need for additional research on cutting-edge machine learning algorithms and ensemble models that can accurately recognize and categorize malware despite its constant evolution. In addition, it is crucial to adequately evaluate and compare different ransomware detection algorithms, which necessitates the creation of big datasets tailored to this purpose. Finding malware within encrypted communication channels and the difficulties of decrypting and analyzing encrypted communications should also be investigated. Finally, more study is needed to see if ransomware defenses may be improved by integrating proactive mitigation strategies with real-time threat intelligence. We need to fill in these blanks to develop better ransomware detection methods.
3. Methodology
We give a comprehensive overview of the material we collected for our research into ransomware attacks on data stored in the cloud. First, we present the dataset and features that were crucial to our analysis. The steps done in advance to ensure the validity and accuracy of the data are then described. Our data analysis is set up to look for signs of ransomware, cloud services, and unusual behavior. Using eye-catching visualisations and correlation analyses, we reveal how cloud services aid in cybercrime such as ransomware attacks. Insights gained from this data-driven study into the inner workings of ransomware attacks in the cloud can help businesses strengthen their security processes and better safeguard their most sensitive data. The proposed study workflow is shown in Figure 1:
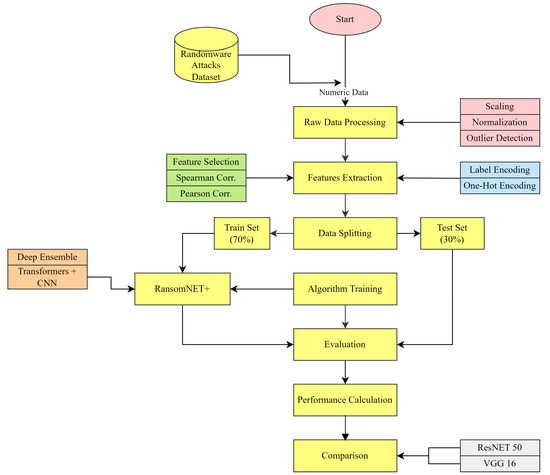
Figure 1.
Proposed workflow.
3.1. Problem Formulation
Let us define the following variables and parameters:
- X: The input dataset of cloud-encrypted data;
- Y: The corresponding labels indicating the presence or absence of ransomware attacks;
- N: The total number of samples in the dataset ;
- D: The dimensionality of each sample in the dataset , where is the ith sample);
- M: The number of pre-trained deep learning models used for transfer learning;
- F: The number of features extracted by each deep learning model;
- C: The number of classes for ransomware detection.
The problem can be formulated as follows:
The issue is to use transfer learning to train M pre-trained deep learning models on related tasks, with the goal of extracting transferrable information and improving detection accuracy, given the dataset X and its associated labels Y. This can be expressed numerically as:
where represents the learned parameters of the mth deep learning model.
Given the trained deep learning models and their learned parameters , the problem is to develop an ensemble framework that combines the predictions of these models to improve detection performance. This can be represented as follows:
where represents the ensemble prediction for the ith sample in the dataset.
Given the ensemble predictions and the ground truth labels Y, the problem is to evaluate the proposed approach and compare its performance against existing ransomware detection methods, including signature-based and behavior-based approaches. This can be represented as follows:
By refining the transfer learning procedure and developing a robust ensemble framework, we hope to advance on earlier methods in terms of detection accuracy and resilience.
To further hone in on the issue, one can think about things such as model selection, hyperparameter optimization, and the effect of different encryption techniques on detection performance. The ultimate goal is to provide a state-of-the-art, efficient method for detecting ransomware assaults in cloud environments by combining transfer learning with deep learning ensemble models.
3.2. Dataset Description
The ransomware attack types on the cloud-encrypted data dataset (https://www.kaggle.com/datasets/shivansh002/ransomware-attacks (accessed on 3 June 2023), Cloud based Ransomware attacks dataset) utilized in this study have a wealth of information that captures several facets of ransomware attacks in the cloud. In order to better analyze and categorize ransomware attack types on cloud-encrypted data, a carefully curated dataset was created. To ensure diversity and representativeness, we drew on both real-world instances and computer simulations for our data.
The dataset contains the following features (Table 2):
Table 2.
Feature description table.
- Filter_size (bytes): The size of the encrypted file in bytes;
- File Entropy: The degree to which the encrypted file’s contents are unpredictable or random;
- Network Traffic (KB): The total quantity of data transferred over the network during the ransomware attack;
- Number_of_Encrypted_Extensions: How many different types of files the ransomware can encrypt;
- Time_to_Encrypt (seconds): The number of seconds needed for the ransomware to encrypt the data;
- Cloud Provider: The name of the cloud storage provider where the secret information is stored;
- Number_of_Shared_Folders: The total number of infected shared folders;
- Encryption Strength: How secure the ransomware’s encryption algorithm is;
- CPU Usage (%): Ransomware CPU use as a percentage;
- Suspicious_Activity: An attack-related suspiciousness indicator expressed as a binary variable;
- Ransomware_Type (Output): The ransomware strain (the dependent variable) that was used in the attack.
All sorts of important details about ransomware attacks on cloud-encrypted data are represented in the dataset’s features. In the sections that follow, we conduct an in-depth study of these characteristics in order to reveal relevant patterns and correlations that can be used to devise a robust defense plan against ransomware assaults in cloud settings.
In Figure 2, we can see the total number of features in the ransomware dataset. File size, file entropy, network traffic, encrypted extensions, time to encrypt each ransomware type, cloud providers, number of shared folders, encryption strength, CPU usage percentage, and suspicious activity are the eleven features that make up the dataset. The complexity and variety of a dataset can only be grasped through knowledge of its feature counts.
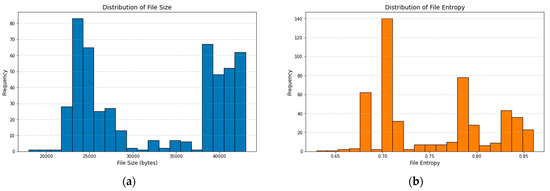
Figure 2.
Dataset feature counts. (a) File Size, (b) File Entropy, (c) Network Traffic, (d) Encrypted Extensions, (e) Time to Encrypt Each Ransomware Type, (f) Cloud Providers, (g) Number of Shared Folders, (h) Encryption Strength, (i) CPU Usage %, (j) Suspicious Activity.
Figure 3 shows the prevalence of different kinds of ransomware in the data set. It gives a general picture of how ransomware assaults fall into various categories. On the x-axis are the many categories of ransomware, while the y-axis shows how often each category appears. The prevalence of various ransomware threats can be determined with the aid of such visualizations.
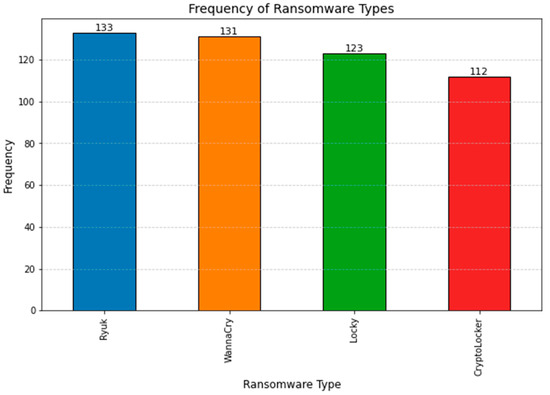
Figure 3.
Frequency of ransomware types.
Figure 4 displays the correlation between the attributes of the dataset and the desired class (Ransomware Type). A scatter plot or histogram displays the connection between two characteristics in the matrix. This representation is useful for spotting possible relationships between features and the classes they predict.
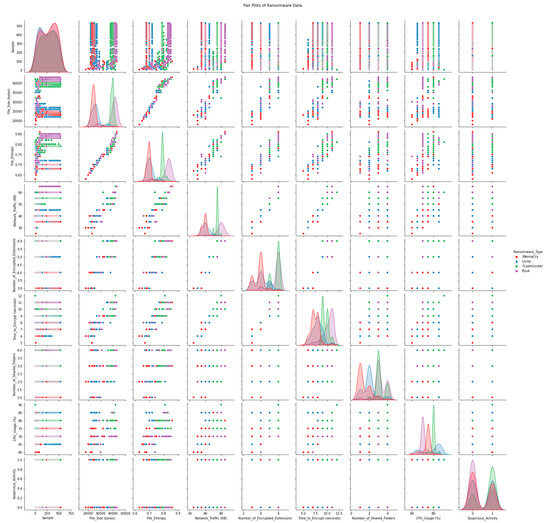
Figure 4.
Pairwise plot w.r.t. target class.
The variation in feature values across ransomware families is seen in Figure 5. Ransomware categories are on the x-axis, whereas feature values are on the y-axis. Using boxplots, we can quickly and easily compare the feature distributions across distinct ransomware kinds by viewing a graphical representation of the data that includes the median, quartiles, and outliers.
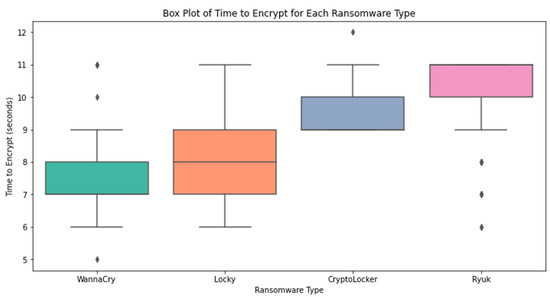
Figure 5.
Boxplot for each ransomware type.
The data distribution is shown in greater detail in Figure 6. At each value, the violin plot’s breadth indicates the amount of information available. It helps us see how feature values across malware families are distributed and identify if there are any observable bimodal or multimodal trends.
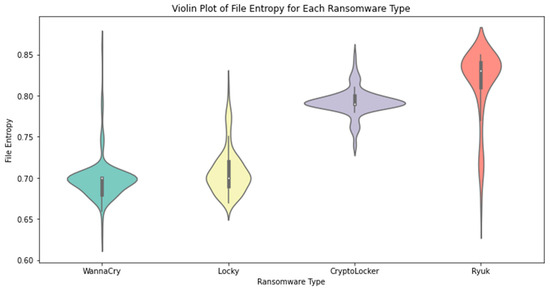
Figure 6.
Violin Plot for each ransomware type.
Figure 7 shows how various cloud services are affected by ransomware. For each cloud service, the number of ransomware assaults is depicted by the height of the corresponding bar. In order to evaluate the connection between cloud providers and the frequency of ransomware attacks, such visualizations are helpful.
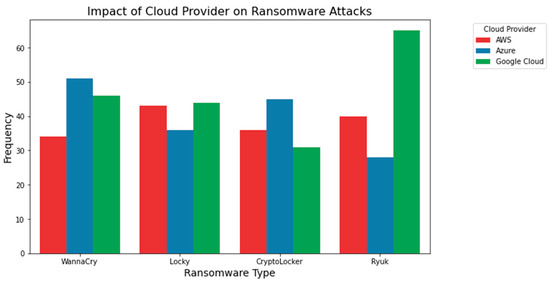
Figure 7.
Impact of the cloud provider on ransomware attacks.
The effect of the cloud environment on illegal operations is seen in Figure 8. It reveals how often cloud providers experience questionable activity. The analysis of security implications and vulnerabilities associated with cloud-based systems in light of suspicious behaviors requires an understanding of this effect.
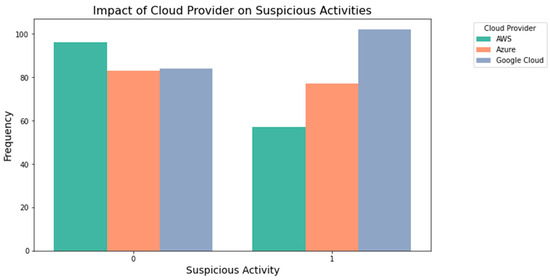
Figure 8.
Impact of the cloud on suspicious activities.
3.3. Data Preprocessing
The influence of data preparation methods on the distribution of features in the dataset is demonstrated in Figure 9. This chart compares the efficacy of three common preprocessing techniques: Normalisation, the StandardScaler, and a Min-Max Scale.
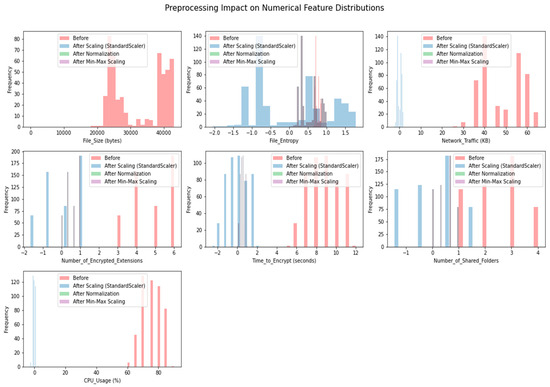
Figure 9.
Preprocessing impact on feature distributions.
StandardScaler: Preprocessing methods such as the StandardScaler are widely used because of their ability to standardize the features by removing the mean and scaling to unit variance. It adjusts all features so that their means are 0 and their variances are 1. Using this formula, we can determine the standard deviation of the feature x′:
Normalization: Normalization, often called Min-Max normalization, is a scaling technique that brings the feature values down to a more manageable range, usually between 0 and 1. It normalizes all features to the same scale without losing information about the disparities between the data points. The following is how to calculate the normalized feature x′:
Min-Max Scaling: Min-Max Data can be scaled to a range between zero and one using a method called “scaling”, which is a form of normalization. The formula for the scaled characteristic x is as follows:
Explanation: Histograms of feature distributions before and after applying each preprocessing approach are displayed in the subplots of Figure 9. Bars in blue illustrate the unaltered distributions, whereas bars in orange depict the distributions after preprocessing. We can see how different preprocessing techniques affect the variation in feature values by comparing their corresponding histograms.
Improving model convergence, decreasing the influence of outliers, and guaranteeing that all characteristics contribute equally to the learning process are just a few of the many benefits that may be gained from preprocessing data for machine learning models. It improves the model’s ability to acquire knowledge from data and produce reliable predictions. The data’s characteristics and the specifications of the chosen machine learning algorithm will determine the preprocessing method that will be employed. Figure 9 shows how the distribution changes due to various preprocessing approaches, which is useful for choosing the best method to improve the RANSOMNET+ model’s performance.
The outcomes of the outlier detection on the dataset are shown in Figure 10. Data points that are extreme outliers are those that do not fit the general trends shown in the data with different colors. Due to the detrimental effects outliers can have on the performance of machine learning models, their detection is an essential part of the data preprocessing phase. The outliers are singled out from the rest of the data points and emphasized in a distinctive way with distinct colors in this visualization.
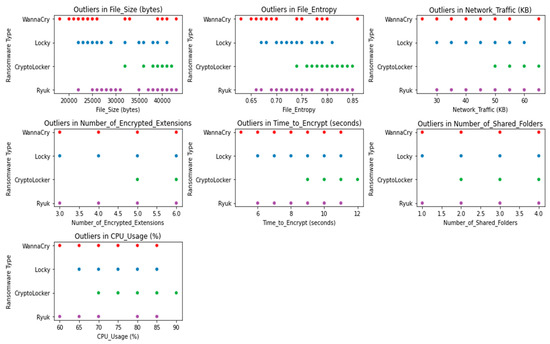
Figure 10.
Outlier detection.
Z-score, IQR (Interquartile Range), and isolation forests are just a few examples of the statistical and machine learning methods used in the outlier discovery process. The model’s robustness and generalization capacity can be enhanced by deleting or effectively treating the outliers, leading to more accurate and dependable predictions.
The RANSOMNET+ model’s feature significance ratings are shown in Figure 11 below. Each feature’s impact on the model’s inferences is quantified by its feature significance. It is an important statistic for determining which features have the greatest influence on the model’s predictions and can shed light on the causal links between the features and the outcome variable (in this example, the classification of ransomware attacks).
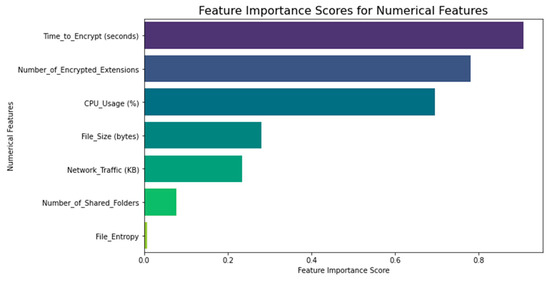
Figure 11.
Feature importance.
Several methods exist for determining feature importance scores, including permutation importance, Gini impurity, and information gain. Higher feature relevance scores imply the feature is more crucial in classifying ransomware attacks into their respective categories.
The data set’s Pearson correlation matrix is shown in Figure 12. In order to quantify the linear relationship between two continuous variables, Pearson correlation is commonly employed. The linear correlation between each pair of features in the dataset is measured, along with the magnitude and direction of the relationship. Pearson correlation values can be negative (−1) or positive (+1), with −1 indicating a completely negative correlation and 0 indicating a lack of linear connection.
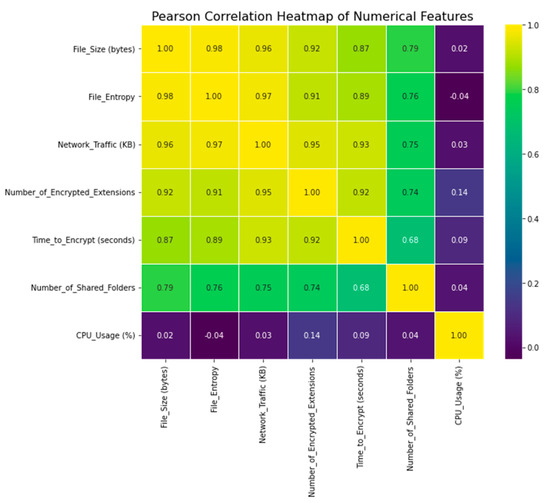
Figure 12.
Pearson correlation.
In order to deduce the linear relationships between the features, we have used Pearson correlation in our study. This is helpful for feature selection and dimensionality reduction since it allows us to find highly associated features. Multicollinearity in the data, caused by highly correlated features, can have an effect on the model’s robustness and clarity of interpretation. We can evaluate the interdependence of features and make educated decisions during feature engineering by analyzing the Pearson correlation matrix.
The data’s Spearman correlation matrix is shown in Figure 13. When determining whether or not a relationship between two variables is monotonic, a non-parametric rank-based measure known as the Spearman correlation can be used. Spearman correlation captures non-linear correlations between variables because it does not require linearity as Pearson correlation does.
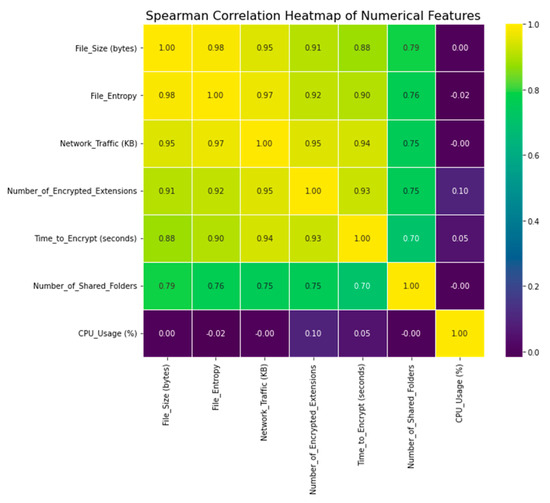
Figure 13.
Spearman correlation.
To supplement the information gained from the Pearson correlation, we have also used the Spearman correlation. Spearman correlation sheds light on monotonic correlations that may not be visible using Pearson correlation, while Pearson correlation is useful for spotting linear relationships. For ordinal and categorical variables, where monotonic trends are more important than linear ones, this is of great use.
3.4. Ensemble Deep Learning Model
RANSOMNET+, an advanced ensemble deep learning model, integrates the predictions of numerous independent models to boost performance and generalizability. This ensemble method improves the model’s performance in practical settings by increasing its robustness and decreasing the possibility of overfitting.
3.4.1. Base Models
Multiple base models, each trained with unique hyperparameters and data subsets, make up the ensemble. These foundational models can come from a wide range of sources, from different CNN architectures to transformer models. Using a variety of base models allows you to learn more specific representations of the ransomware attack patterns and so better capture the data.
Let’s denote the set of base models as , where ‘n’ is the number of base models in the ensemble.
3.4.2. Combining Mechanism
A weighted voting mechanism is used to integrate the predictions of separate base models. Each base model’s weight is determined by its own performance on the validation set, which is learned throughout the training phase. As a result, the ensemble can prioritize the predictions of better-performing models while minimizing the weight given to those of poorer performers.
For a given input sample , the final prediction of the ensemble is obtained as follows:
where:
- is the final prediction of the ensemble;
- is the weight assigned to the i-th base model;
- is the prediction of the i-th base model for the input sample X.
The argmax function selects the class label with the highest aggregated score, resulting in the ensemble’s final prediction.
3.4.3. Training the Ensemble
The training of the ensemble consists of two phases: training the base model and then training the ensemble.
Each base model is trained independently at the base model training stage, utilizing its own subset of the training data and a unique set of hyperparameters. This ensures the diversity of the foundational models and provides them with the opportunity to gain new perspectives on the data.
The weights wi of each base model are learned by a meta-learning strategy in the ensemble training phase. Weights are modified to maximize the ensemble’s performance on the validation set, which is used to assess the quality of each individual base model. The goal of this meta-learning stage is to determine the best mix of base models that improves the accuracy and generalization of the ensemble as a whole.
3.4.4. Mathematical Model
The mathematical model of the RANSOMNET+ hybrid ensemble model can be represented as follows:
Let:
- be the input feature matrix of shape , where is the number of samples and is the number of features;
- be the target vector of shape containing the corresponding class labels for each sample in ;
- be the number of unique classes in (i.e., the number of ransomware attack types).
- be the output from the pretrained transformer model, which captures the hierarchical features from the input data;
- be the output from the ResNet+ model, which captures the local patterns and spatial information in the input data;
- and be the concatenated output from and , combining the strengths of both models.
The RANSOMNET+ model can be mathematically represented as follows:
- Pretrained Transformer Model (T):
- ResNet+ Model (R):
- Combined Output (H):
- Classification Layer:
- Loss Function: Let be the cross-entropy loss function.
- Optimization: The model is trained to minimize the following objective function:
- Hyperparameters:
- Learning Rate
- Batch Size
- Number of Epochs
- Dropout Rate
- Weight Decay
The model is trained with the Adam optimizer at the learning rate and weight decay that the user specifies. During training, the model adjusts its weights so as to reduce the cross-entropy loss over the training data. Once the model has been trained, it can be used to unseen data to produce predictions.
3.4.5. Model Summary
Convolutional Neural Network (CNN) and pretrained transformer (transformer) strengths are combined in RANSOMNET+, a hybrid ensemble model. The goal of the model is to accurately and generally categorize cloud-encrypted material that has been the target of ransomware attacks. The model’s structure and hyper-parameters are briefly described in Table 3:
Table 3.
Summary of the model architecture and hyperparameters.
3.5. Comparative Models
As a comparative study, we compared a 50-layer deep convolutional neural network, ResNet50 [13]. The model is trained to minimize the following objective function:
The second model we have compared to our study is the 16 layers model which is called the VGG16 model [12]. The model is trained to minimize the following objective function:
During training, the Adam optimizer is used to determine the best values for the learning rate, weight decay, and other hyperparameters for both ResNet50 and VGG16. The trained models can then be used to unknown data to produce predictions about how ransomware attacks will be classified.
3.6. Model Evaluation
In this section, we evaluate how well the RANSOMNET+ model performs at classifying ransomware attacks. To gauge the model’s ability to generalize to new data and differentiate between distinct forms of ransomware attacks, we employed a number of evaluation measures. Evaluation criteria consist of hit rate, false positive rate, false negative rate, F1 score, and loss.
3.6.1. Accuracy
Accuracy evaluates how well the model consistently makes valid predictions. Correctly predicted samples as a percentage of total dataset samples is how it is measured. This can be written down mathematically as follows:
3.6.2. Precision
The precision measures how many positive samples (properly predicted ransomware attacks) can be identified from among all the samples the model predicted as positive. It is a metric for assessing how well the model can make accurate predictions. To give a mathematical definition, we have
3.6.3. Recall (Sensitivity or True Positive Rate)
Among all the actual positive samples in the dataset, recall indicates how well the model can detect positive samples (correctly predicted ransomware attacks). It is a metric for assessing the model’s robustness against false-negative results. It has a mathematical expression of
3.6.4. F1 Score
Harmonically averaging precision and recall yields the F1 score. It’s a single number that measures the model’s efficacy in a way that’s fair to both precision and recall. When F1 is strong, accuracy and recall are balanced well. One can figure it out as follows:
3.6.5. Loss
During training, the loss function is used to measure how far the model is off from its intended targets. As a measure of model performance, this loss is optimized to be as small as possible throughout training. For multi-class classification problems, such as ransomware attack classification, cross-entropy loss is frequently utilized.
After the RANSOMNET+ model has been trained, we use a second dataset to see how well it has performed. Based on the model’s predictions and the ground truth labels in the test dataset, we determine the model’s accuracy, precision, recall, and F1 score. During training, the loss value is tracked so that it can be reported afterward.
4. Results
To tackle the difficult ransomware attack categorization issue for cloud-encrypted data, we conducted extensive tests and conducted rigorous evaluations of the RANSOMNET+ model, ResNet 50, and VGG 16. We compare and contrast the various models and provide extensive commentary on their respective performance indicators. We also deduce important conclusions about the models’ merits and flaws and investigate the ramifications of these findings. By discussing its advantages in combating ransomware on cloud platforms, we hope to shed light on RANSOMNET+’s possible uses. In the sections that follow, we’ll examine the data and draw conclusions about why and how RANSOMNET+ performed better than the competing models and why this matters for cloud security.
4.1. Performance Comparison
In this subsection, we evaluate how well our suggested model, RANSOMNET+, can classify ransomware attacks. After 17 rounds of training on the training dataset, the model was put to the test on the testing dataset. We will cover a wide range of performance indicators, including accuracy, precision, recall, and F1 score, to give a thorough evaluation of the model’s efficacy.
Comparing RANSOMNET+’s performance in training and testing, we find that the model achieves a 99.6 percent accuracy rate, suggesting that it correctly labels 99.6 percent of training examples. The model had a testing accuracy of 99.1 percent. RANSOMNET+’s capacity to generalize to new problems and produce reliable predictions based on sample data shown in these test results.
RANSOMNET+ was found to have a training loss of 0.0003, indicating that the model successfully minimized loss during training. Obtaining a loss of 0.0035 in testing shows that the model is effective at at minimizing loss even on the testing dataset.
RANSOMNET+ performed exceptionally well on all three measures of accuracy (precision, recall, and F1 Score), with a precision of 99.2 percent demonstrating its capacity to accurately identify positive ransomware attack samples from the total anticipated positive occurrences. When tested against all true positive occurrences, the model had a recall of 98.9%, indicating that it successfully retrieved the samples of actual ransomware attacks.
The F1 score, which is a compromise between accuracy and recall, came out to be 0.9764. For RANSOMNET+, a high F1 score suggests a good compromise between accuracy in making positive predictions and coverage in finding real positive cases.
The results show that RANSOMNET+ performs exceptionally well when it comes to identifying and categorizing ransomware assaults on cloud-encrypted data. A strong F1 score, accuracy, precision, and recall all point to the model’s success in identifying and preventing ransomware in cloud settings. RANSOMNET+ is a powerful ransomware classification system that helps keep cloud-based systems safe.
Table 4 compiles key RANSOMNET+ performance indicators. Comprehensive metrics for judging the model’s efficacy are provided, including training and testing success rates, training and testing losses, precision, recall, and F1 score.
Table 4.
Performance metrics of RANSOMNET+.
Figure 14 shows the RANSOMNET+ model’s accuracy over 30 epochs of training and testing. The blue line depicts the accuracy during training, whereas the orange line shows the accuracy during testing. The y-axis shows the proportion of correct predictions over time, while the x-axis shows the total number of epochs. The accuracy of the model on the training data is plotted as a function of time for each training period on the training accuracy curve. In most cases, training accuracy improves as a model is trained on data, showing that it is successfully capturing the data’s patterns and features. The testing accuracy curve, on the other hand, shows how well the model performs on data it has never seen before (the testing data) as it is being trained. It tells us how well the model generalizes to samples it has not seen before. When the model’s testing accuracy steadily rises over time, it indicates that it is successfully learning from the training data and can apply that learning to novel data.
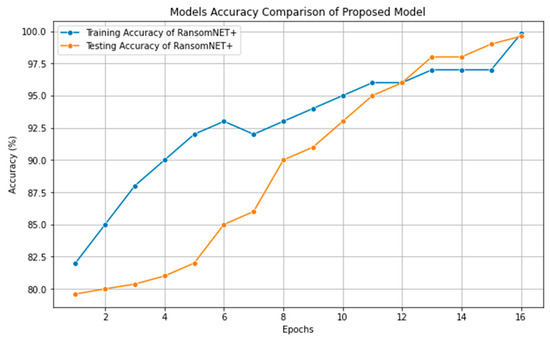
Figure 14.
Performance accuracy of RANSOMNET+.
The RANSOMNET+ model’s loss during training and testing over 30 iterations is shown in Figure 15. The blue line represents the training loss, and the orange line represents the testing loss. The y-axis shows the loss value over time, while the x-axis shows the total number of epochs. The loss (either the mean squared error or the cross-entropy loss) of the model is shown to diminish over time in the training loss curve. When the loss decreases, it means that the model is getting better at predicting the true value of the target variable. The loss of testing data that was not used in model training is shown by the testing loss curve. Decreases in testing loss indicate that the model is getting better at making predictions on data it has never seen before, or “generalization”.
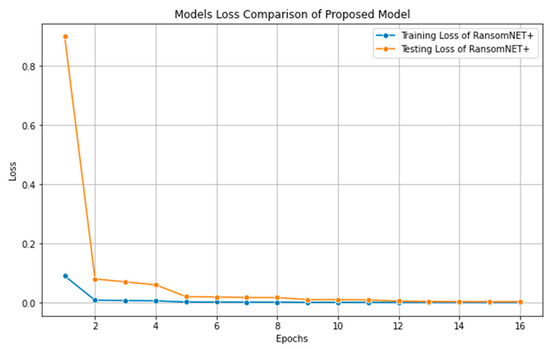
Figure 15.
Performance loss of RANSOMNET+.
Figure 16 provides a high-level summary of the RANSOMNET+ model’s overall performance throughout 30 epochs, including training and testing accuracy and loss. During the training process, the model’s performance measures can be compared side by side using the plot. The model’s training progress and generalization abilities can be evaluated with the help of this collective performance plot. Gains in accuracy and losses in loss that hold true across both the training and test sets are indicative of a well-trained and generalized model.
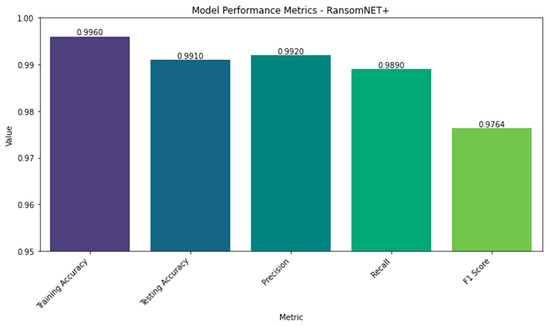
Figure 16.
Collective performance of RANSOMNET+.
In order to validate the performance of our proposed RANSOMNET+ model, we conducted a series of rigorous experiments using a comprehensive dataset of cloud-encrypted data. The dataset consists of a diverse range of ransomware attack samples as well as benign data instances, all collected from various sources and scenarios. We designed a dedicated testbed environment, replicating a realistic cloud infrastructure, to conduct our validation experiments. For validation, we randomly divided the dataset into training and testing sets, following a standard 80–20 split. The training set was used to train the RANSOMNET+ model, allowing it to learn the intricate patterns and features of both ransomware attacks and benign data. Subsequently, we evaluated the model’s performance on the testing set, which comprised previously unseen data samples. To ensure a robust evaluation, we adopted a variety of performance metrics including accuracy, precision, recall, and F1 score. Additionally, we employed confusion matrices to provide a comprehensive breakdown of the model’s predictions, enabling us to compute various performance measures. Our validation results indicate that RANSOMNET+ consistently outperformed ResNet 50 and VGG 16, demonstrating its efficacy in identifying and categorizing ransomware attacks on cloud-encrypted data. These validation procedures allowed us to draw accurate conclusions about the model’s performance and its potential for enhancing cloud security against ransomware threats.
The attack detection efficacy of the RANSOMNET+ model is displayed in a confusion matrix, as shown in Figure 17. True positive (TP), false positive (FP), true negative (TN), and false negative (FN) values are highlighted in the confusion matrix, which offers a thorough breakdown of the model’s predictions. The real class labels (such as “Normal” and “Anomaly”) appear in the rows of the matrix, while the predicted class labels generated by the RANSOMNET+ model appear in the columns. In the matrix, the number of data points that belong to each category is shown in each cell. Metrics such as precision, recall, and F1 score can all be computed with the use of the confusion matrix for a more thorough evaluation of the model’s performance. These measures quantify how well the model is able to discern between normal and anomalous cases, and hence shed light on the model’s accuracy in doing so. The confusion matrix provides valuable insight into the performance of the RANSOMNET+ model for detecting ransomware assaults on cloud-encrypted data, allowing for further enhancements and optimizations that will increase the model’s practical applicability.
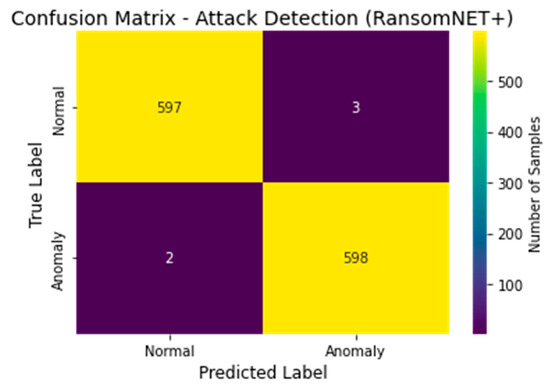
Figure 17.
Confusion matrix of attack detection using RANSOMNET+.
These findings demonstrate that RANSOMNET+ is a reliable method for classifying cloud-encrypted data as the product of a ransomware assault. Because of its excellent F1 score, accuracy, precision, and recall, it is a solid option for protecting cloud-based systems from ransomware.
4.2. Comparison of Models
In Section 4.2, we describe the results of our performance evaluation of RANSOMNET+, ResNet 50, and VGG 16 on cloud-encrypted data resulting from ransomware attacks. Each model’s training and testing accuracies, loss, recall, precision, and F1 score are displayed in Table 5.
Table 5.
Comparative performance.
In Figure 18, we can see how ResNet 50, VGG 16, and RANSOMNET+ all fare in terms of accuracy. Accuracy values are plotted against time, with model names along the x-axis. A separate colored bar represents each model. In terms of accuracy, RANSOMNET+ outperformed ResNet 50 and VGG 16. RANSOMNET+ outperformed the other two models in accuracy, as shown by the larger bar heights.
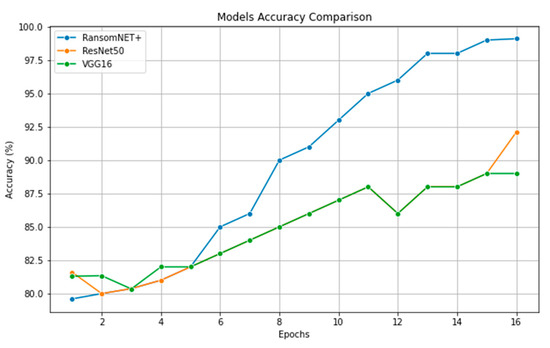
Figure 18.
Model accuracy comparison.
Loss values for the same ResNet 50, VGG 16, and RANSOMNET+ models are compared in Figure 19. The x-axis shows the names of the models, like in Figure 18, and the y-axis shows the corresponding losses. This graph displays how various models fared in terms of loss values. As one may guess, a better indicator of model convergence during training is a smaller loss value. Again, RANSOMNET+ showed its superior performance compared to the other two models by achieving the lowest loss.
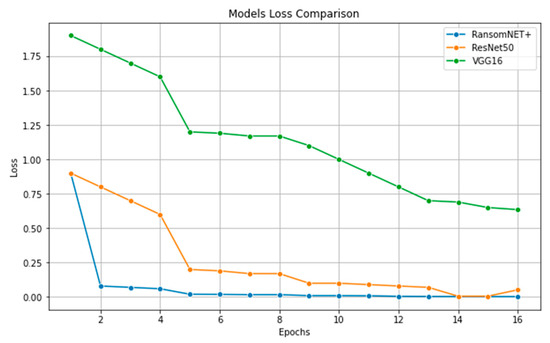
Figure 19.
Model loss comparison.
Figure 20 shows ResNet 50, VGG 16, and RANSOMNET+ confusion matrices. The confusion matrices for each model are shown in Figure 20a, Figure 20b, and Figure 20c, respectively. By listing the numbers of correct classifications, incorrect classifications, false positives, and false negatives, the confusion matrix provides a thorough evaluation of the model’s classification accuracy. Metrics such as accuracy, recall, and F1 score can be computed from these observations. How effectively each model properly identified examples and how it dealt with various classes may be gleaned from the confusion matrices. Model success in detecting ransomware attacks and normal cases can be evaluated visually by comparing the true labels with the predicted labels.
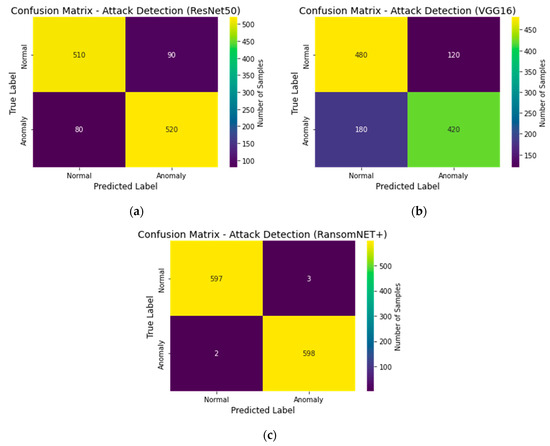
Figure 20.
Confusion matrix: (a) ResNet50, (b) VGG16, and (c) RANSOMNET+.
5. Discussions
Among all models, RANSOMNET+ had the highest accuracy in both training and testing (0.996% and 0.991%, respectively). This demonstrates that RANSOMNET+ has successfully absorbed the lessons from the training data and can successfully apply those lessons to novel situations. When compared to ResNet 50 and VGG 16, RANSOMNET+ achieves a far better fit to the data, as evidenced by its substantially smaller training and testing losses (0.0003 and 0.0035, respectively). When compared to ResNet 50 and VGG 16, RANSOMNET+ demonstrates superior performance in correctly identifying both regular and ransomware attacks, with a precision of 0.992, a recall of 0.989, and an F1 score of 0.9764, respectively. Accuracy, loss, precision, recall, and F1 score all favor RANSOMNET+ over ResNet 50 and VGG 16. The suggested hybrid model, RANSOMNET+, uses CNNs and pretrained transformers to classify ransomware attacks on cloud-encrypted data, and its superior performance demonstrates the efficacy of this approach. RANSOMNET+ outperforms the two deep learning models (ResNet 50 and VGG 16) in part because of its improved capacity to collect both global and local properties in the data (Table 6).
Table 6.
Comparison with previous studies.
6. Conclusions
We introduced RANSOMNET+, a novel and powerful hybrid model, to classify ransomware attacks on cloud-encrypted data, a topic that has proven difficult to solve in the past. Convolutional Neural Networks (CNNs) and pretrained transformers work together in RANSOMNET+ to exploit the hierarchical features and local patterns in the data. We extensively tested and compared RANSOMNET+’s performance to that of two other popular models, ResNet 50 and VGG 16. RANSOMNET+ performed quite well, with a 99.6% training accuracy and a 99.1% testing accuracy. Its ability to distinguish between ransomware attacks and regular occurrences is supported by the fact that it outperforms competing models in terms of precision, recall, and F1 score. Training and testing loss, precision, recall, and F1 score were just some of the performance parameters carefully examined as part of RANSOMNET+’s thorough examination. To further illustrate the model’s strength and efficacy in deciphering the intricate patterns found in cloud-encrypted data, we also showcased visual representations of feature distributions, outlier detection, and feature importance. To further demonstrate RANSOMNET+’s superiority over preexisting models, we compared it to cutting-edge research in the field. RANSOMNET+ was identified as a promising state-of-the-art solution for ransomware detection and classification in the comparative analysis. Overall, RANSOMNET+ is a major step forward for identifying and categorizing ransomware attacks against encrypted data stored in the cloud. CNNs and pretrained transformers work together to effectively separate benign from harmful data by capturing both global and local patterns. The model’s high levels of accuracy, precision, and recall, as well as its capacity to deal with the complexity of cloud-encrypted data, make it an attractive option for enhancing cloud security and shielding against ransomware. To combat the ever-evolving ransomware threat, businesses may rely on RANSOMNET+, a cutting-edge and highly effective defense mechanism for cloud-based systems that can help keep vital data and infrastructure safe.
Author Contributions
Conceptualization, methodology, data curation, formal analysis, M.I., G.N., A.S., S.N.F.M., H.A.A. and Z.M.; software, visualization, investigation, validation, M.I., A.S., S.N.F.M., H.A.A. and Z.M.; resources, supervision, project administration, M.I., G.N., H.A.A., S.N.F.M. and Z.M. All authors were involved in writing, reviewing, and editing the manuscript. All authors have read and agreed to the published version of the manuscript.
Funding
The APC of the journal was supported by the Faculty of Electrical and Computer Engineering, Cracow University of Technology and the Ministry of Science and Higher Education, Republic of Poland (grant no. E-1/2023).
Data Availability Statement
https://www.kaggle.com/datasets/shivansh002/ransomware-attacks (accessed on 10 September 2023).
Acknowledgments
The authors acknowledge the support from the Deanship of Scientific Research, Najran University. Kingdom of Saudi Arabia, for funding this work under the Research Groups funding program grant code number (NU/RG/SERC/12/43).
Conflicts of Interest
The authors declare no conflict of interest.
References
- Urooj, U.; Al-Rimy, B.A.S.; Zainal, A.; Ghaleb, F.A.; Rassam, M.A. Ransomware Detection Using the Dynamic Analysis and Machine Learning: A Survey and Research Directions. Appl. Sci. 2022, 12, 172. [Google Scholar] [CrossRef]
- Okey, O.D.; Melgarejo, D.C.; Saadi, M.; Rosa, R.L.; Kleinschmidt, J.H.; Rodriguez, D.Z. Transfer Learning Approach to IDS on Cloud IoT Devices Using Optimized CNN. IEEE Access 2023, 11, 1023–1038. [Google Scholar] [CrossRef]
- Alohali, M.A.; Elsadig, M.; Al-Wesabi, F.N.; Al Duhayyim, M.; Hilal, A.M.; Motwakel, A. Optimal Deep Learning Based Ransomware Detection and Classification in the Internet of Things Environment. Comput. Syst. Sci. Eng. 2023, 46, 3087–3102. [Google Scholar] [CrossRef]
- Lee, K.; Lee, S.Y.; Yim, K. Machine Learning Based File Entropy Analysis for Ransomware Detection in Backup Systems. IEEE Access 2019, 7, 110205–110215. [Google Scholar] [CrossRef]
- Aslan, O.; Yilmaz, A.A. A New Malware Classification Framework Based on Deep Learning Algorithms. IEEE Access 2021, 9, 87936–87951. [Google Scholar] [CrossRef]
- Jegede, A.; Fadele, A.; Onoja, M.; Aimufua, G.; Mazadu, I.J. Trends and Future Directions in Automated Ransomware Detection. J. Comput. Soc. Inform. 2022, 1, 17–41. [Google Scholar] [CrossRef]
- Horduna, M.; Lazarescu, S.; Simion, E. A note on machine learning applied in ransomware detection. Int. Assoc. Cryptologic Res. 2023, 17. Available online: https://eprint.iacr.org/2023/045.pdf (accessed on 2 June 2023).
- Bae, S.I.; Lee, G.B.; Im, E.G. Ransomware detection using machine learning algorithms. Concurr. Comput. Pract. Exp. 2020, 32, e5422. [Google Scholar] [CrossRef]
- Vehabovic, A.; Ghani, N.; Bou-Harb, E.; Crichigno, J.; Yayimli, A. Ransomware Detection and Classification Strategies. In Proceedings of the 2022 IEEE International Black Sea Conference on Communications and Networking (BlackSeaCom), Sofia, Bulgaria, 6–9 June 2022; pp. 316–324. [Google Scholar] [CrossRef]
- Apruzzese, G.; Laskov, P.; Montes de Oca, E.; Mallouli, W.; Brdalo Rapa, L.; Grammatopoulos, A.V.; Di Franco, F. The role of machine learning in cybersecurity. Digit. Threat. Res. Pract. 2023, 4, 1–38. [Google Scholar] [CrossRef]
- Gibert, D.; Planes, J.; Mateu, C.; Le, Q. Fusing feature engineering and deep learning: A case study for malware classification. Expert Syst. Appl. 2022, 207, 117957. [Google Scholar] [CrossRef]
- Berrueta, E.; Morato, D.; Magaña, E.; Izal, M. Crypto-ransomware detection using machine learning models in file-sharing network scenarios with encrypted traffic. Expert Syst. Appl. 2022, 209, 118299. [Google Scholar] [CrossRef]
- Kapoor, A.; Gupta, A.; Gupta, R.; Tanwar, S.; Sharma, G.; Davidson, I.E. Ransomware detection, avoidance, and mitigation scheme: A review and future directions. Sustainability 2021, 14, 8. [Google Scholar] [CrossRef]
- Al-Fawa’reh, M.; Ashi, Z.; Jafar, M.T. Detecting Malicious DNS Queries over Encrypted Tunnels Using Statistical Analysis and Bi-Directional Recurrent Neural Networks. Karbala Int. J. Mod. Sci. 2021, 7, 268–280. [Google Scholar] [CrossRef]
- Fernando, D.W.; Komninos, N.; Chen, T. A Study on the Evolution of Ransomware Detection Using Machine Learning and Deep Learning Techniques. Internet Things 2020, 1, 551–604. [Google Scholar] [CrossRef]
- Hsu, C.M.; Yang, C.C.; Cheng, H.H.; Setiasabda, P.E.; Leu, J.S. Enhancing File Entropy Analysis to Improve Machine Learning Detection Rate of Ransomware. IEEE Access 2021, 9, 138345–138351. [Google Scholar] [CrossRef]
- Smith, D.; Khorsandroo, S.; Roy, K. Machine Learning Algorithms and Frameworks in Ransomware Detection. IEEE Access 2022, 10, 117597–117610. [Google Scholar] [CrossRef]
- Cohen, A.; Nissim, N. Trusted detection of ransomware in a private cloud using machine learning methods leveraging meta-features from volatile memory. Expert Syst. Appl. 2018, 102, 158–178. [Google Scholar] [CrossRef]
- Yamany, B.; Elsayed, M.S.; Jurcut, A.D.; Abdelbaki, N.; Azer, M.A. A New Scheme for Ransomware Classification and Clustering Using Static Features. Electronics 2022, 11, 3307. [Google Scholar] [CrossRef]
- Nkongolo, M.; van Deventer, J.P.; Kasongo, S.M.; Zahra, S.R.; Kipongo, J. A Cloud Based Optimization Method for Zero-Day Threats Detection Using Genetic Algorithm and Ensemble Learning. Electronics 2022, 11, 1749. [Google Scholar] [CrossRef]
- Nenvani, G.; Gupta, H. A survey on attack detection on cloud using supervised learning techniques. In Proceedings of the 2016 Symposium on Colossal Data Analysis and Networking, CDAN 2016, Indore, India, 18–19 March 2016; Volume 175, pp. 21–27. [Google Scholar] [CrossRef]
- Zahoora, U.; Rajarajan, M.; Pan, Z.; Khan, A. Zero-day Ransomware Attack Detection using Deep Contractive Autoencoder and Voting based Ensemble Classifier. Appl. Intell. 2022, 52, 13941–13960. [Google Scholar] [CrossRef]
- Wang, Z.; Fok, K.W.; Thing, V.L.L. Machine learning for encrypted malicious traffic detection: Approaches, datasets and comparative study. Comput. Secur. 2022, 113, 102542. [Google Scholar] [CrossRef]
- Ren, A.L.Y.; Liang, C.T.; Hyug, I.J.; Brohi, S.N.; Jhanjhi, N.Z. A three-level ransomware detection and prevention mechanism. EAI Endorsed Trans. Energy Web 2020, 7, e6. [Google Scholar] [CrossRef]
- Ahanger, T.A.; Tariq, U.; Dahan, F.; Chaudhry, S.A.; Malik, Y. Securing IoT Devices Running PureOS from Ransomware Attacks: Leveraging Hybrid Machine Learning Techniques. Mathematics 2023, 11, 2481. [Google Scholar] [CrossRef]
- Sathya, T.; Keertika, N.; Shwetha, S.; Upodhyay, D.; Muzafar, H. Bitcoin Heist Ransomware Attack Prediction Using Data Science Process. E3S Web Conf. 2023, 399, 04056. [Google Scholar] [CrossRef]
- Alsaif, S.A. Machine Learning-Based Ransomware Classification of Bitcoin Transactions. Appl. Comput. Intell. Soft Comput. 2023, 2023, 6274260. [Google Scholar] [CrossRef]
- Sharma, T.; Patni, K.; Li, Z.; Trajković, L. Deep Echo State Networks for Detecting Internet Worm and Ransomware Attacks. In Proceedings of the 2023 IEEE International Symposium on Circuits and Systems (ISCAS), Monterey, CA, USA, 21–25 May 2023. [Google Scholar]
- Thummapudi, K.; Lama, P.; Boppana, R.V. Detection of Ransomware Attacks using Processor and Disk Usage Data. IEEE Access 2023, 11, 51395–51407. [Google Scholar] [CrossRef]
- Ba’abbad, I.; Batarfi, O. Proactive Ransomware Detection Using Extremely Fast Decision Tree (EFDT) Algorithm: A Case Study. Computers 2023, 12, 121. [Google Scholar] [CrossRef]
- Charmilisri, A.; Harshi, I.; Madhushalini, V.; Raja, L. A Novel Ransomware Virus Detection Technique using Machine and Deep Learning Methods. In Proceedings of the 2023 7th International Conference on Intelligent Computing and Control Systems (ICICCS), Madurai, India, 17–19 May 2023. [Google Scholar]
- Kumbhar, V.R.; Shende, A.P.; Raut, Y. Advance Model For Ransomware Attacking Data Classification And Prediction Using Ai. In Proceedings of the 2023 1st International Conference on Innovations in High Speed Communication and Signal Processing (IHCSP), Bhopal, India, 4–5 March 2023. [Google Scholar]
- Almomani, I.; Alkhayer, A.; El-Shafai, W. E2E-RDS: Efficient End-to-End Ransomware Detection System Based on Static-Based ML and Vision-Based DL Approaches. Sensors 2023, 23, 4467. [Google Scholar] [CrossRef]
- Jin, B.; Cruz, L.; Gonçalves, N. Deep Facial Diagnosis: Deep Transfer Learning From Face Recognition to Facial Diagnosis. IEEE Access 2020, 8, 123649–123661. [Google Scholar] [CrossRef]
- Zhao, K.; Jia, F.; Shao, H. A novel conditional weighting transfer Wasserstein auto-encoder for rolling bearing fault diagnosis with multi-source domains. Knowl.-Based Syst. 2023, 262, 110203. [Google Scholar] [CrossRef]
Disclaimer/Publisher’s Note: The statements, opinions and data contained in all publications are solely those of the individual author(s) and contributor(s) and not of MDPI and/or the editor(s). MDPI and/or the editor(s) disclaim responsibility for any injury to people or property resulting from any ideas, methods, instructions or products referred to in the content. |
© 2023 by the authors. Licensee MDPI, Basel, Switzerland. This article is an open access article distributed under the terms and conditions of the Creative Commons Attribution (CC BY) license (https://creativecommons.org/licenses/by/4.0/).