
A Multi-Antenna Spectrum Sensing Method Based on CEEMDAN Decomposition Combined with Wavelet Packet Analysis


Abstract
:1. Introduction
2. Multi-Antenna Spectrum Sensing in the Complex Communication Environment
2.1. Spectrum Sensing Problem Model
2.2. Feature Extraction Based on CEEMDAN
2.2.1. CEEMDAN Decomposition Principle
- Adding the IMF component with auxiliary noise after EMD decomposition, rather than adding Gaussian white noise directly to the original signal;
- Both EEMD and CEEMD methods employ a strategy of averaging the acquired mode components following empirical mode decomposition to tackle the mode mixing problem. However, CEEMDAN introduces a unique approach. It performs global averaging on the first-order IMF to obtain the final first-order IMF and then iterates this process on the residual component. This innovative approach effectively addresses the issue of noise transfer from high frequencies to low frequencies.
2.2.2. Wavelet Packet Analysis of Noise Reduction Principle
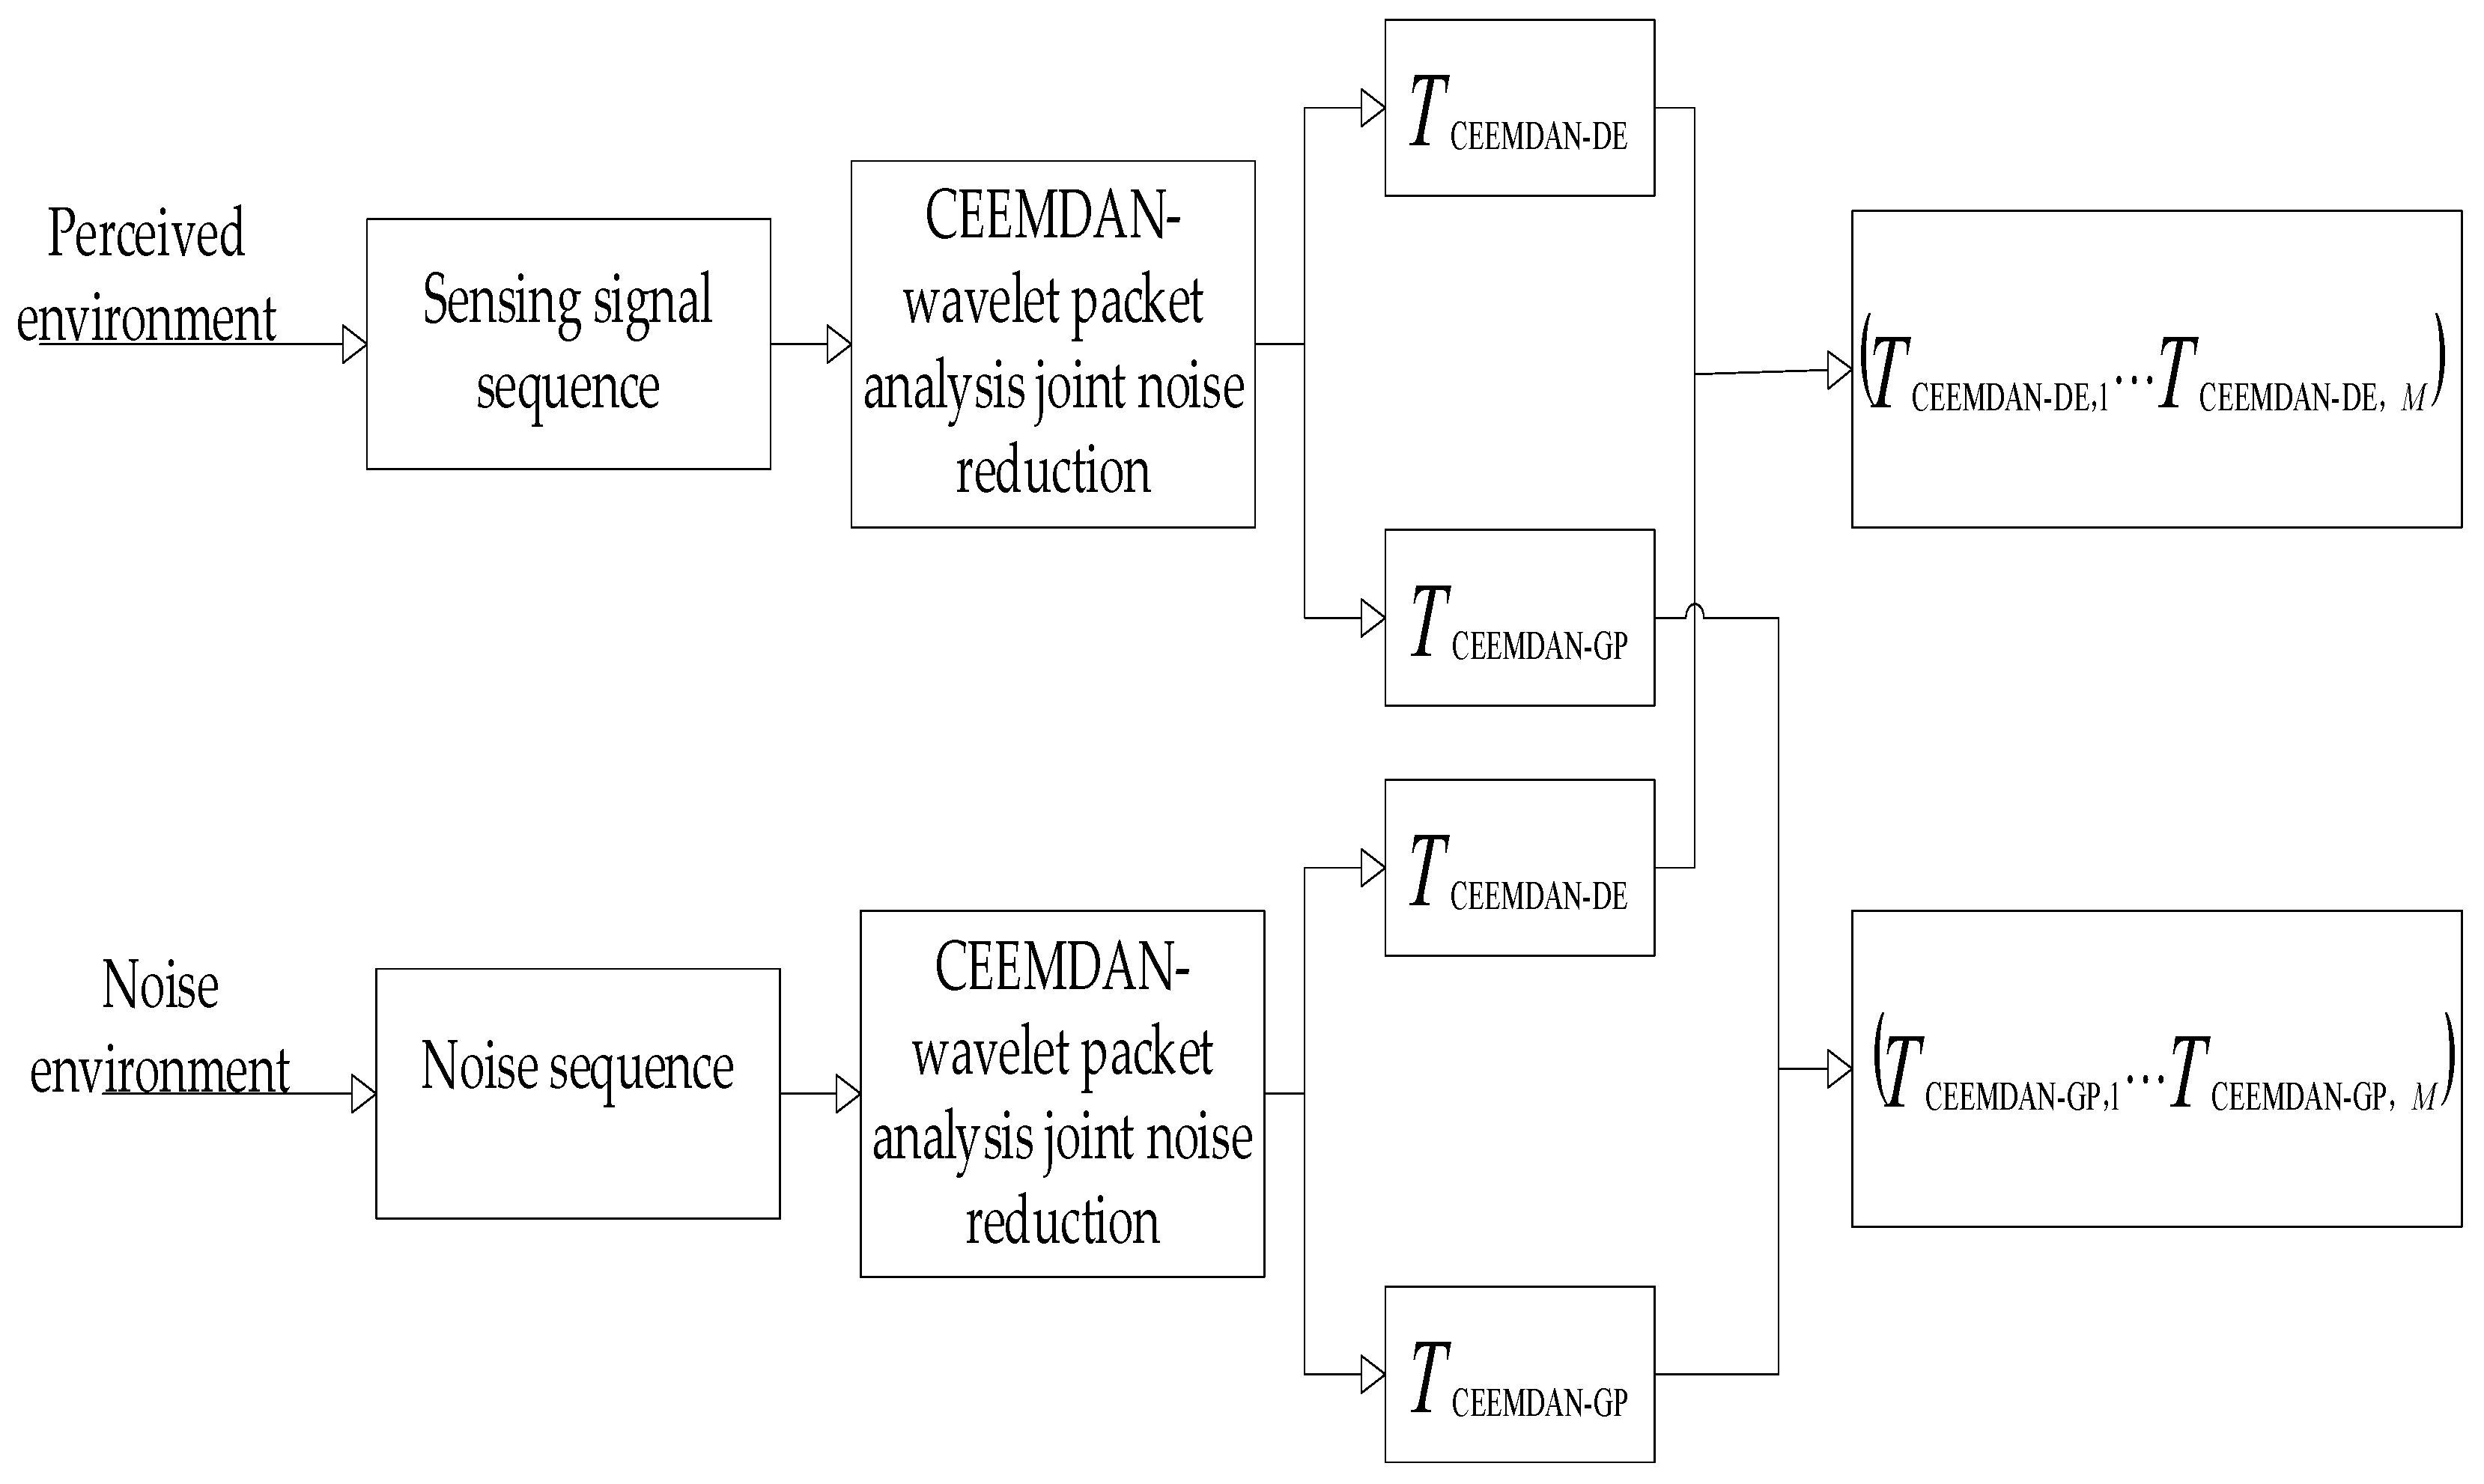
2.2.3. CEEMDAN Decomposes Joint Wavelet Packet Analysis
2.2.4. Feature Extraction Method Based on GGD Distribution
3. Multi-Antenna Spectrum Sensing Based on ISSA-SVM
3.1. Improvement Sparrow Search Algorithm
| Algorithm 1: ISSA pseudo-code. |
| Input: sparrow population , the number of producers PD, proportion of scaredy birds SD, warning value ST, the maximum iterations , Output: sweet spot, optimal value 1: Initialize the population using the elite opposition-based learning strategy 2: Calculate the fitness value to find the current best individual and the worst individual 3: While 4: 5: for 6: Update the discoverer position 7: end for 8: for 9: Update the follower position according to Equation (22) 10: end for 11: for 12: Update scout position 13: end for 14: Calculate the mutation probability , generate a random number 15: if 16: Mutation is performed according to obtain the new sparrow position 17: else 18: Keep the previous sparrow position 19: end if 20: Calculate the fitness value of the new position and the original position, and compare it 21: if f f 22: Preserve current position 23: end if 24: 25: end while |
3.2. Spectrum Sensing Based on ISSA-SVM
| Algorithm 2: Spectrum sensing algorithm based on CEEMDAN-DE. |
| Input: Signal sequence , number of observed samples , number of data sets Output: and // CEEMDAN decomposition 1: , its ceemdan () 2: for 3: Calculate the correlation coefficient of the and the original signal 4: end for // wavelet denoise and reconstruct 5: for // the component is selected for wavelet packet decomposition 6: 7: // perform wavelet packet decomposition for each , using Daubechies wavelet ‘db8’ and decompose 3 layers 8: 9: 10: 11: // soft threshold processing 12: end for 13: 14: end for 15: //acquired reconstruction signal // feature extraction 16: for 17: A sample of observations is randomly selected in each time 18: For , is obtained is obtained from Equation (17) 19: end 20: Divide into training sets and test sets 21: The training set is used for the SVM model parameter training, and ISSA is used to determine kernel function parameters 22: The decision function (26) is obtained after successful training 23: Input the test set according to the decision function 24: and are calculated according to Equations (3) and (4) |
4. Simulation Results and Performance Analysis
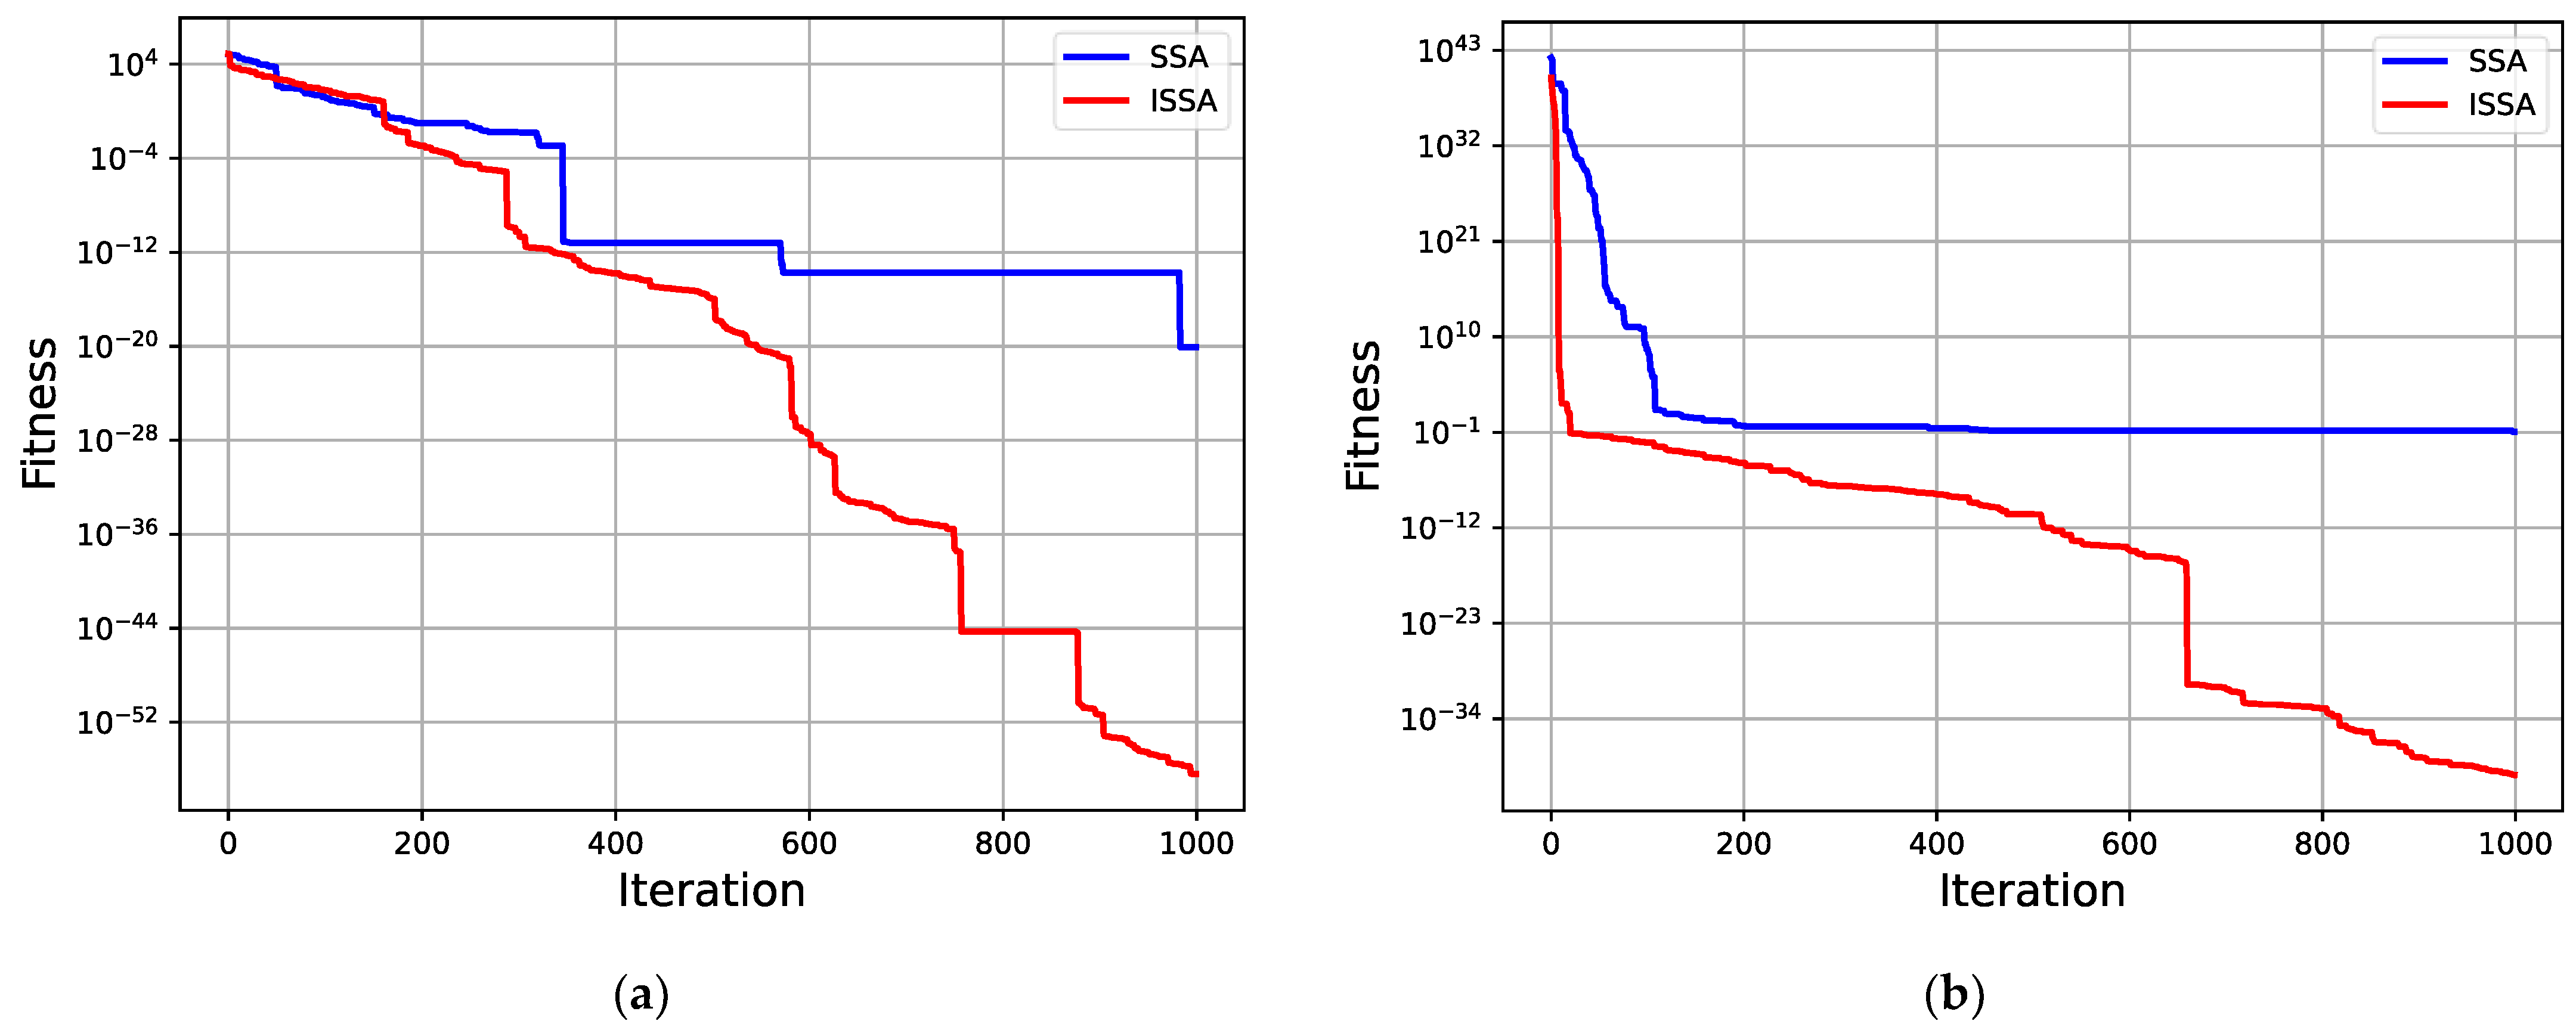
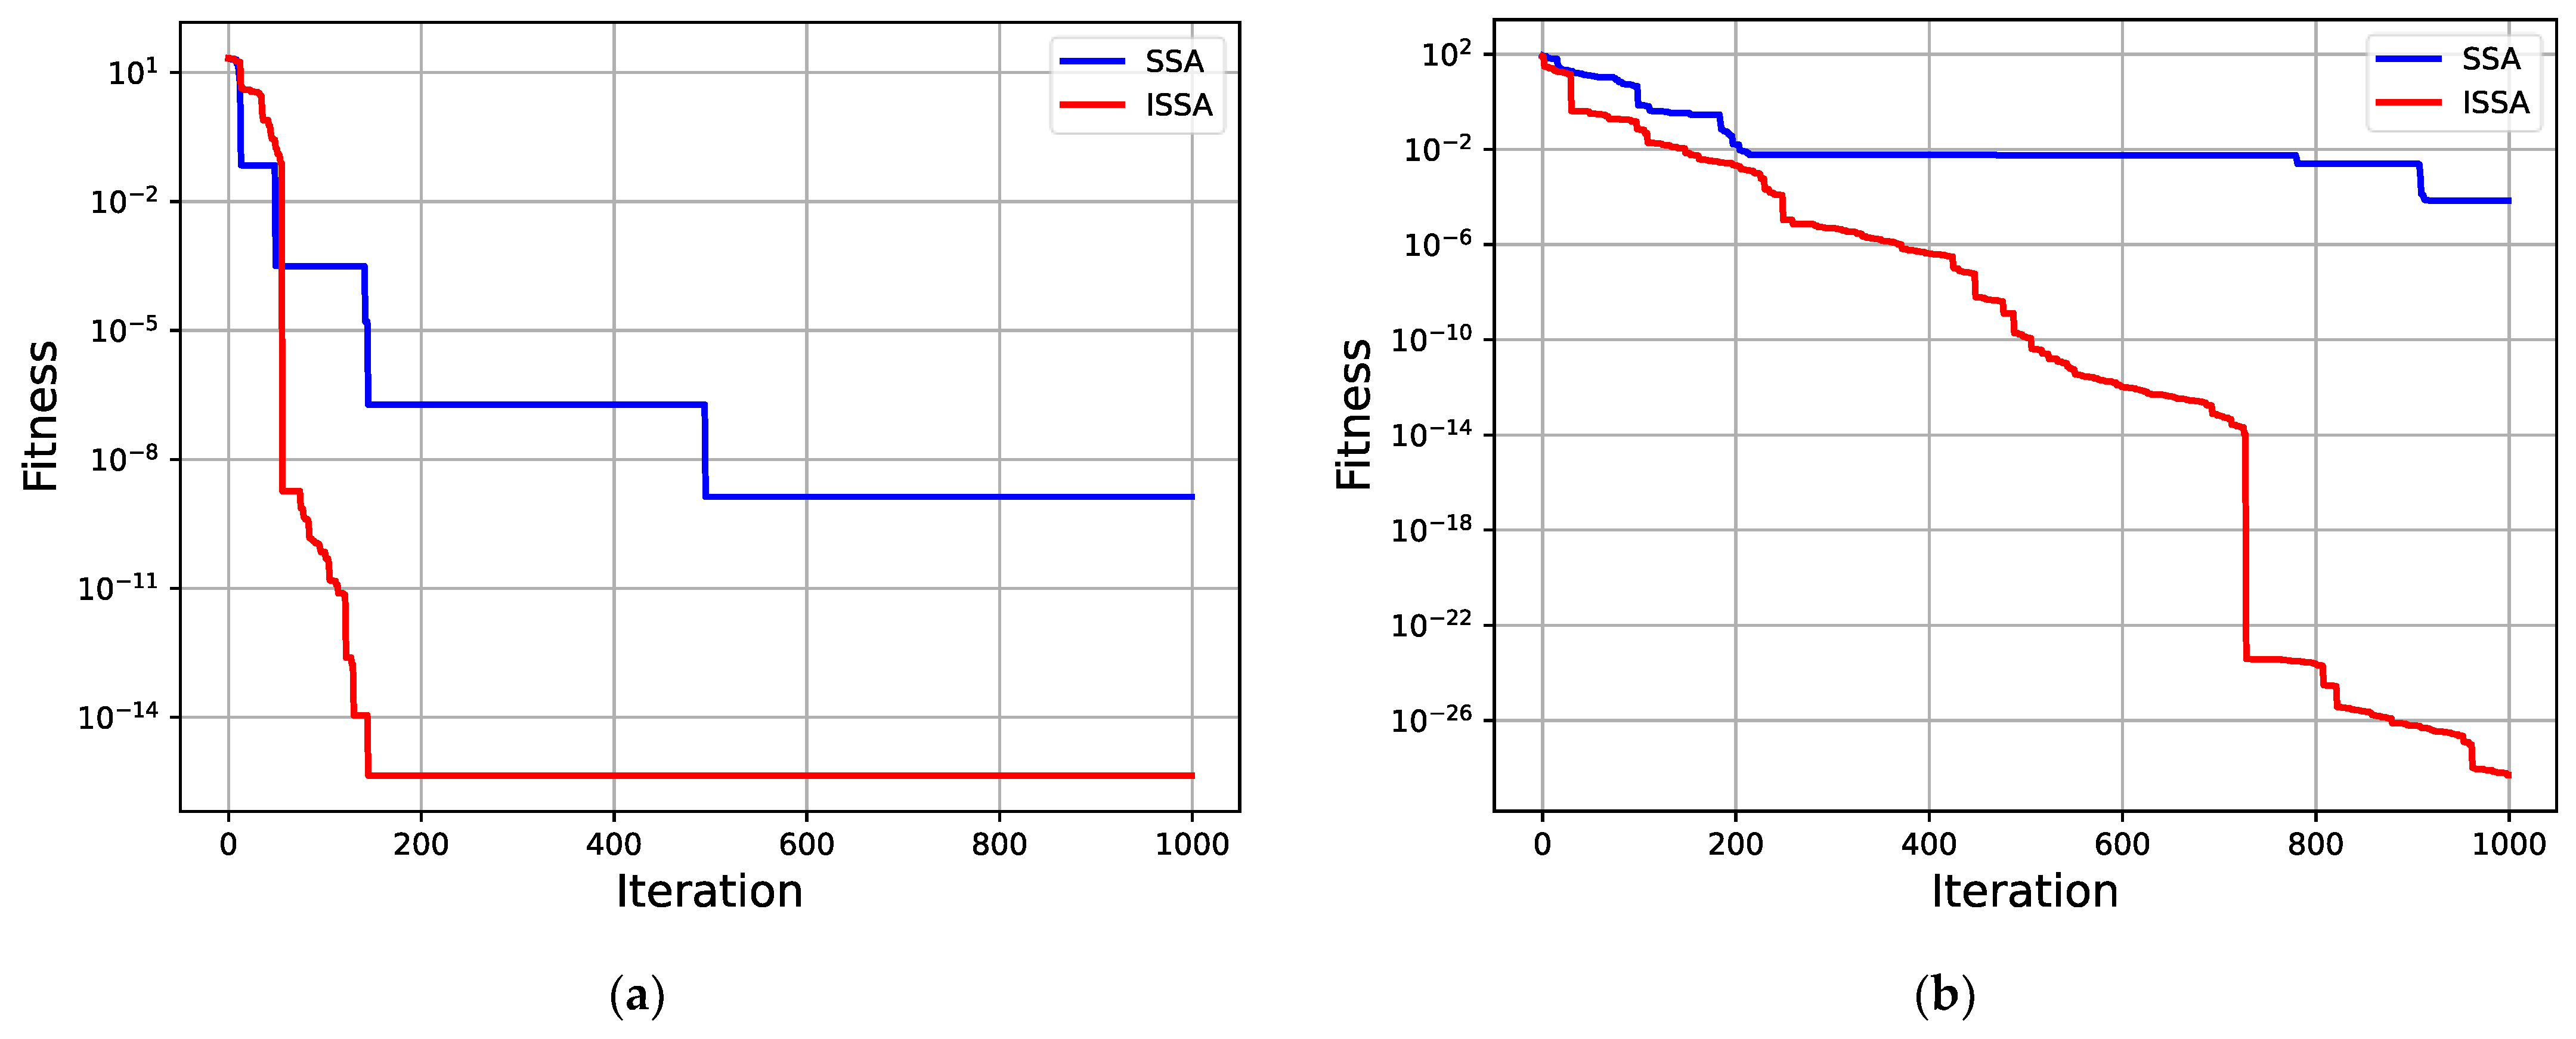
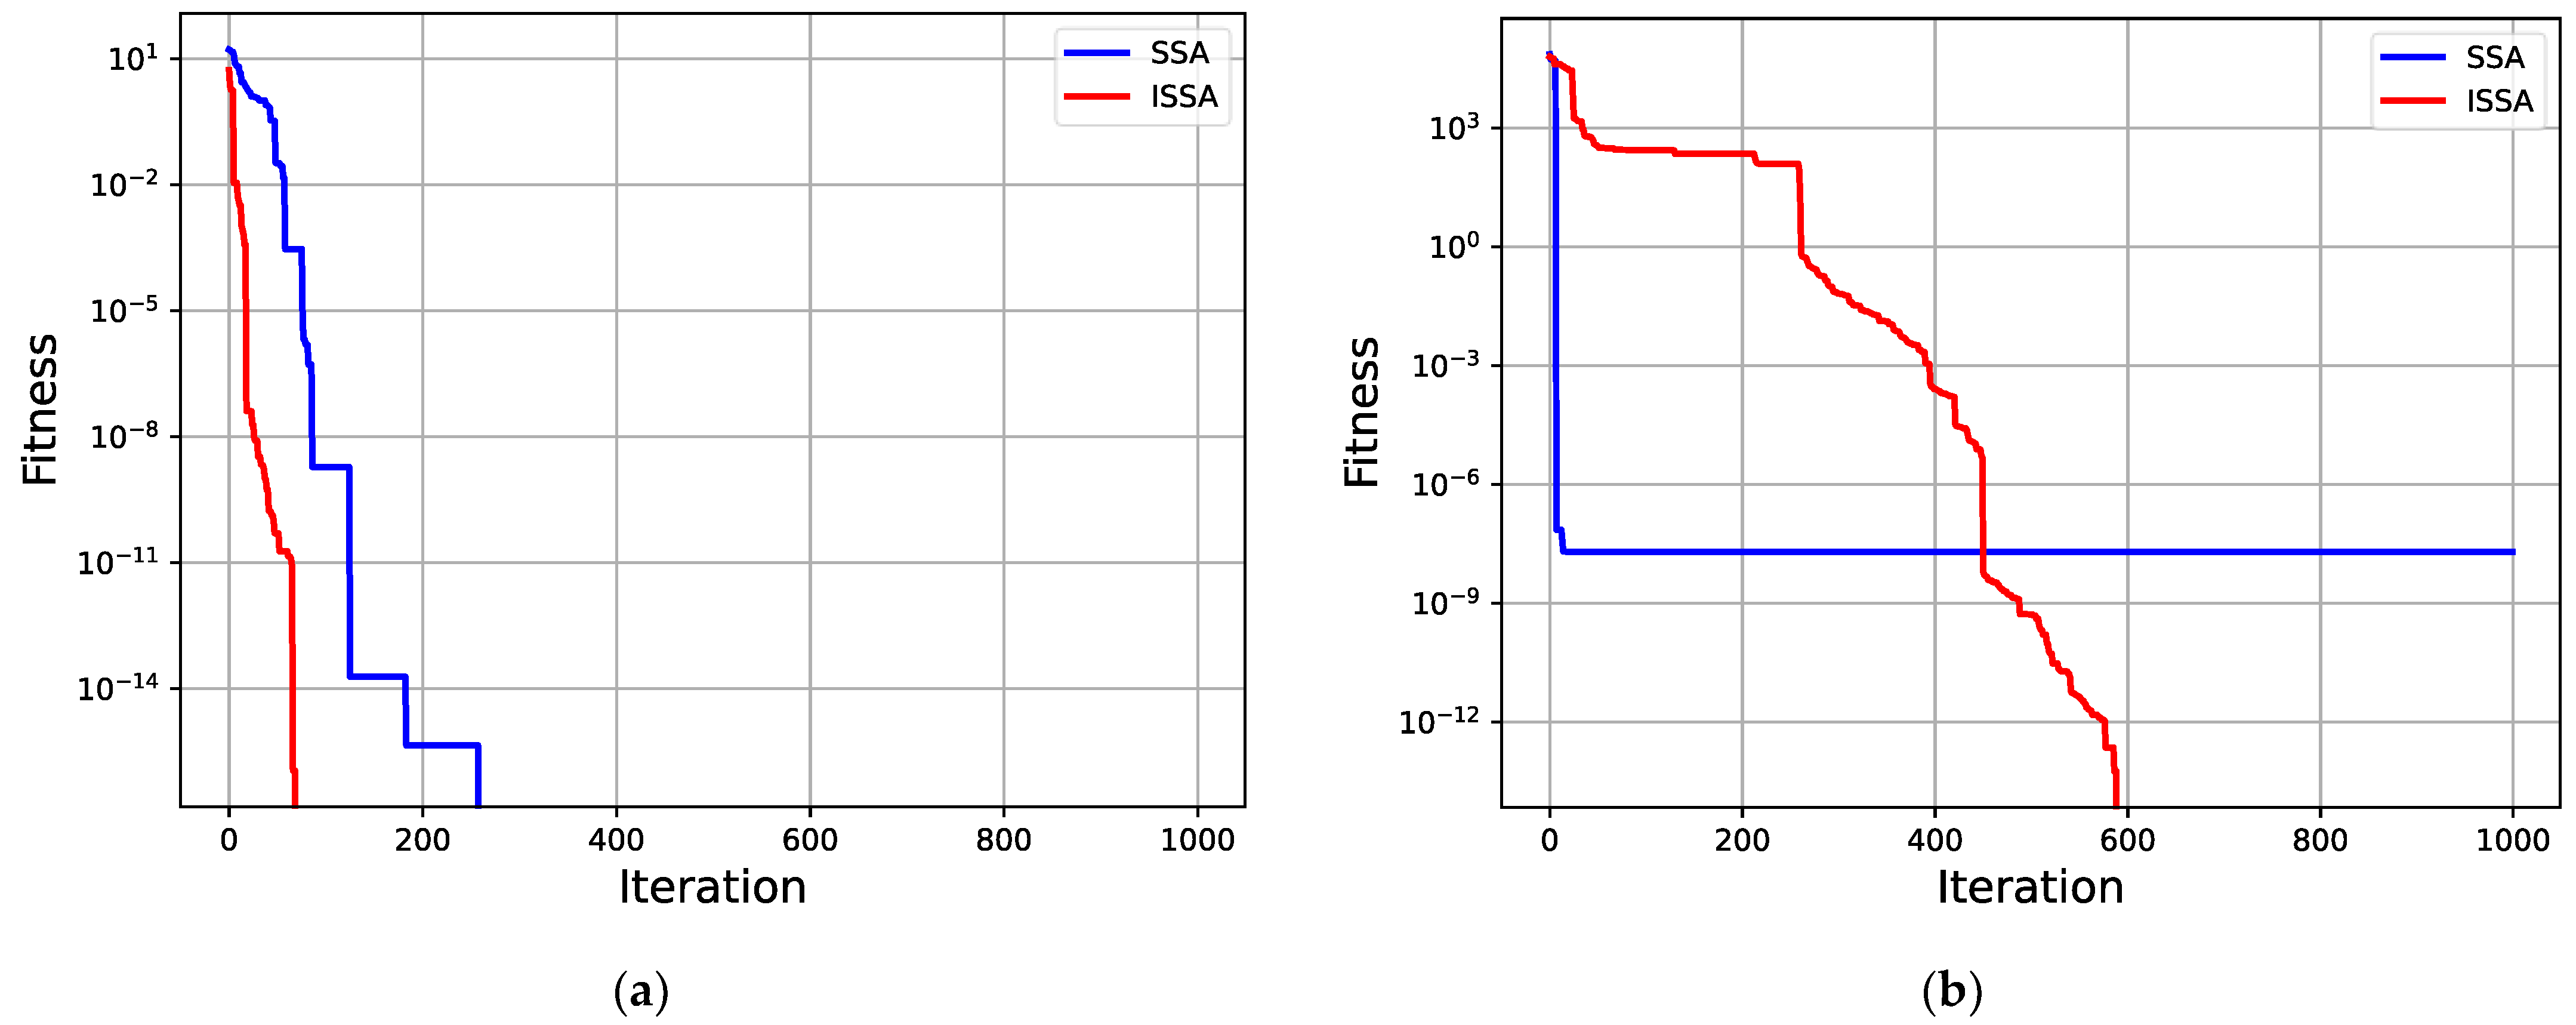
4.1. ISSA Algorithm Optimization Ability Test
4.2. Experimental Verification of Spectrum Sensing Method
- Root mean squared error (RMSE): in the signal noise reduction metric, the root mean square error is defined as the expected value of the squared difference between the un-denoised signal and the denoised signal recalculated as shown in Equation (29).
- SNR: The signal-to-noise ratio is defined as shown in Equation (30).where is the denoised signal and is the signal length.
5. Conclusions
Author Contributions
Funding
Data Availability Statement
Conflicts of Interest
References
- Joykutty, A.M.; Baranidharan, B. Cognitive Radio Networks: Recent Advances in Spectrum Sensing Techniques and Security. In Proceedings of the 2020 International Conference on Smart Electronics and Communication, Trichy, India, 10–12 September 2020. [Google Scholar] [CrossRef]
- Mitola, J. The Software Radio Architecture. IEEE Commun. Mag. 1995, 33, 26–38. [Google Scholar] [CrossRef]
- Bhavana, B.; Sabat, S.L.; Namburu, S.; Panigrahi, T. Energy Detector for Spectrum Sensing Using Robust Statistics in Non-Gaussian Noise Environment. In Proceedings of the 2023 15th International Conference on Communication Systems & Networks, Bangalore, India, 3–8 January 2023. [Google Scholar] [CrossRef]
- Kumar, R.V.R. Performance Analysis of a Novel Matched Filter Detector with Reduced out-of-Band Response for Narrowband Signals. IEEE Trans. Signal Process. 2006, 54, 2691–2703. [Google Scholar] [CrossRef]
- Sepidband, P.; Entesari, K. A CMOS Spectrum Sensor Based on Quasi-Cyclostationary Feature Detection for Cognitive Radios. IEEE Trans. Microw. Theory Tech. 2015, 63, 4098–4109. [Google Scholar] [CrossRef]
- Ahmed, Q.Z.; Park, K.H.; Alouini, M.S. Ultrawide Bandwidth Receiver Based on a Multivariate Generalized Gaussian Distribution. IEEE Trans. Wirel. Commun. 2014, 14, 1800–1810. [Google Scholar] [CrossRef]
- Habibi, Z.; Zayyani, H. Markovian Adaptive Filtering Algorithm for Block-Sparse System Identification. IEEE Trans. Circuits Syst. II Express Briefs 2021, 68, 3032–3036. [Google Scholar] [CrossRef]
- Wang, Y.H.; Cheng, S.H. Boundary Effects for EMD-Based Algorithms. IEEE Signal Process. Lett. 2022, 29, 1032–1036. [Google Scholar] [CrossRef]
- Xue, W.; Dai, X.; Zhu, J.; Luo, Y.; Yang, Y. A Noise Suppression Method of Ground Penetrating Radar Based on EEMD and Permutation Entropy. IEEE Geosci. Remote Sens. Lett. 2019, 16, 1625–1629. [Google Scholar] [CrossRef]
- Torres, M.E.; Colominas, M.A.; Schlotthauer, G.; Flandrin, P. A Complete Ensemble Empirical Mode Decomposition with Adaptive Noise. In Proceedings of the 2011 IEEE International Conference on Acoustics, Speech and Signal Processing, Prague, Czech Republic, 22–27 May 2011. [Google Scholar] [CrossRef]
- He, C.; Niu, P.; Yang, R.; Wang, C.; Li, Z.; Li, H. Incipient Rolling Element Bearing Weak Fault Feature Extraction Based on Adaptive Second-order Stochastic Resonance Incorporated by Mode Decomposition. Measurement 2019, 145, 687–701. [Google Scholar] [CrossRef]
- Sarikhani, R.; Keynia, F. Cooperative Spectrum Sensing Meets Machine Learning: Deep Reinforcement Learning Approach. IEEE Commun. Lett. 2020, 24, 1459–1462. [Google Scholar] [CrossRef]
- Thilina, K.M.; Choi, K.W.; Saquib, N.; Hossain, E. Machine Learning Techniques for Cooperative Spectrum Sensing in Cognitive Radio Networks. IEEE J. Sel. Areas Commun. 2013, 32, 2209–2221. [Google Scholar] [CrossRef]
- Tan, C.; Chen, J.; Chen, S.; Li, C.; Liu, H.; Zheng, M. Combination Spectrum Sensing Algorithm for Wireless Sensor Network Based on Random Forest. In Proceedings of the 2022 10th International Conference on Intelligent Computing and Wireless Optical Communications, Chongqing, China, 10–12 June 2022. [Google Scholar] [CrossRef]
- Wang, Y.; Zhang, S.; Zhang, Y.; Wan, P.; Li, J.; Li, N. A Cooperative Spectrum Sensing Method Based on Empirical Mode Decomposition and Information Geometry in Complex Electromagnetic Environment. Complexity 2019, 2019, 15. [Google Scholar] [CrossRef]
- Saravanan, P.; Chandra, S.S.; Upadhye, A.; Gurugopinath, S. A Supervised Learning Approach for Differential Entropy Feature-based Spectrum Sensing. In Proceedings of the 2021 Sixth International Conference on Wireless Communications, Signal Processing and Networking, Chennai, India, 25–27 March 2021. [Google Scholar] [CrossRef]
- Sheng, J.; Liu, F.; Zhang, Z.; Huang, C. TCVQ-SVM Algorithm for Narrowband Spectrum Sensing. Phys. Commun. 2022, 50, 101502. [Google Scholar] [CrossRef]
- Xue, J.; Shen, B. A Novel Swarm Intelligence Optimization Approach: Sparrow Search Algorithm. Syst. Sci. Control Eng. 2020, 8, 22–34. [Google Scholar] [CrossRef]
- Gao, X.; Guo, W.; Mei, C.; Sha, J.; Guo, Y.; Sun, H. Short-term Wind Power Forecasting Based on SSA-VMD-LSTM. Energy Rep. 2023, 9, 335–344. [Google Scholar] [CrossRef]
- Li, X.; Yang, C.; Zhang, X.; Li, G. Prediction of Matte Grade in The Oxygen-rich Top Blown Smelting Based on WD-SSA-SVM Algorithm. In Proceedings of the 2023 IEEE 12th Data Driven Control and Learning Systems Conference, Xiangtan, China, 12–14 May 2023. [Google Scholar] [CrossRef]
- Qu, J.; Ma, B.; Ma, X.; Wang, M. Hybrid Fault Diagnosis Method based on Wavelet Packet Energy Spectrum and SSA-SVM. Int. J. Adv. Comput. Sci. Appl. 2022, 13, 52–60. [Google Scholar] [CrossRef]
- Li, L.; Wang, F.; Shang, F.; Jia, Y.; Zhao, C.; Kong, D. Energy Spectrum Analysis of Blast Waves Based on an Improved Hilbert–Huang Transform. Shock Waves 2017, 27, 487–494. [Google Scholar] [CrossRef]
- Liu, M.; Zhang, X.; Chen, Y.; Tan, H. Multi-antenna Intelligent Spectrum Sensing in The Presence of Non-Gaussian Interference. Digit. Signal Process. 2023, 140, 104135. [Google Scholar] [CrossRef]
- Yeh, J.R.; Shieh, J.S.; Huang, N.E. Complementary Ensemble Empirical Mode Decomposition: A Novel Noise Enhanced Data Analysis Method. Adv. Adapt. Data Anal. 2010, 2, 135–156. [Google Scholar] [CrossRef]
- Gurugopinath, S.; Muralishankar, R.; Shankar, H.N. Differential Entropy-Driven Spectrum Sensing Under Generalized Gaussian Noise. IEEE Commun. Lett. 2016, 20, 1321–1324. [Google Scholar] [CrossRef]
- Gonzalez, J.G.; Paredes, J.L.; Arce, G.R. Zero-Order Statistics: A Mathematical Framework for the Processing and Characterization of Very Impulsive Signals. IEEE Trans. Signal Process. 2006, 54, 3839–3851. [Google Scholar] [CrossRef]
- Chai, Y.; Sun, X.; Ren, S. Chaotic Sparrow Search Algorithm Based on Multi-Directional Learning. Comput. Eng. Appl. 2023, 59, 81–91. [Google Scholar] [CrossRef]
- Akram, Z.; Fernández, M.; Cernadas, E.; Barro, S. Fast Support Vector Classification for Large-Scale Problems. IEEE Trans. Pattern Anal. Mach. Intell. 2021, 44, 6184–6195. [Google Scholar] [CrossRef] [PubMed]
- Li, Z.; Guo, J.; Gao, X.; Yang, X.; He, Y.L. A Multi-strategy Improved Sparrow Search Algorithm of Large-scale Refrigeration System: Optimal Loading Distribution of Chillers. Appl. Energy 2023, 349, 121623. [Google Scholar] [CrossRef]


| Functions | Function Name | Dimension | Domain | Optimal Value |
|---|---|---|---|---|
| Sphere | 30 | 0 | ||
| Schwefel’s Problem 2.22 | 30 | 0 | ||
| Ackley | 30 | 0 | ||
| Schwefel’s Problem 2.21 | 30 | 0 | ||
| Griewank | 30 | 0 | ||
| Rastrigin | 30 | 0 |
| Algorithm | G | PD | SD | ST |
|---|---|---|---|---|
| SSA | 30 | 0.2 | 0.1 | 0.8 |
| ISSA | 30 | 0.2 | 0.1 | 0.8 |
| SNR = −9 dB | SNR = −12 dB | |
|---|---|---|
| IMF1 | 0.6094 | 0.6271 |
| IMF2 | 0.4271 | 0.4541 |
| IMF3 | 0.3465 | 0.3659 |
| IMF4 | 0.2766 | 0.2907 |
| IMF5 | 0.2753 | 0.2271 |
| IMF6 | 0.2501 | 0.2023 |
| IMF7 | 0.2203 | 0.1886 |
| IMF8 | 0.2291 | 0.1881 |
| IMF9 | 0.1599 | 0.1121 |
| IMF10 | 0.0194 | 0.0375 |
| IMF11 | 0.0366 | 0.0146 |
| IMF12 | 0.0342 | 0.0161 |
| IMF13 | 0.0198 | 0.0143 |
| IMF14 | 0.0164 | 0.0151 |
| Initial SNR | Evaluation Index | EMD-Wavelet Packet Analysis-Combined Denoising | EEMD | CEEMDAN-Wavelet Packet Analysis-Combined Denoising |
|---|---|---|---|---|
| SNR = −9 dB | RMSE | 0.2383 | 0.2807 | 0.1968 |
| SNR/dB | 3.532 | 2.1095 | 4.9743 | |
| SNR = −12 dB | RMSE | 0.3154 | 0.3039 | 0.2644 |
| SNR/dB | 1.0987 | 1.4289 | 2.6297 |
| Kernel Function Model Category | Experimental Data Set Size | Training Time (s) | ||
|---|---|---|---|---|
| CEEMDAN-DE-linear-SVM | 2000 | 0.562337 | 0.934 | 0.90 |
| 3000 | 0.499887 | 0.952 | 0.91 | |
| CEEMDAN-DE-poly-SVM | 2000 | 3.821829 | 0.936 | 0.931 |
| 3000 | 3.401949 | 0.955 | 0.937 | |
| CEEMDAN-DE-ISSA-SVM | 2000 | 0.859216 | 0.94 | 0.93225 |
| 3000 | 0.796324 | 0.96 | 0.9405 | |
| DE-linear-SVM | 2000 | 1.031003 | 0.09 | 0.7545 |
| 3000 | 1.327854 | 0.125 | 0.68925 | |
| DE -poly-SVM | 2000 | 17.339349 | 0.006 | 0.7545 |
| 3000 | 15.206200 | 0.02 | 0.68925 | |
| DE-ISSA-SVM | 2000 | 1.577460 | 0.79 | 0.83575 |
| 3000 | 2.152244 | 0.696 | 0.769 |
| Warning Value | PD | SD | ||
|---|---|---|---|---|
| 30 | 30 | 0.6 | 0.7 | 0.2 |
| Model Category | ||||
|---|---|---|---|---|
| ISSA-SVM | 0.8 | 0.963 | 5.20779748 | 4.23560914 |
| 1 | 0.969 | 0.01 | 4.08559084 | |
| 1.5 | 0.939 | 0.87150995 | 0.08230669 | |
| 2 | 0.893 | 0.10625931 | 0.90453521 | |
| RBF-SVM | 0.8 | 0.961 | 11.0 | 10.5030644 |
| 1 | 0.871 | 11.0 | 10.5069423 | |
| 1.5 | 0.869 | 11.0 | 10.4894858 | |
| 2 | 0.734 | 11.0 | 10.4988999 |
| Algorithms | AUC | |||
|---|---|---|---|---|
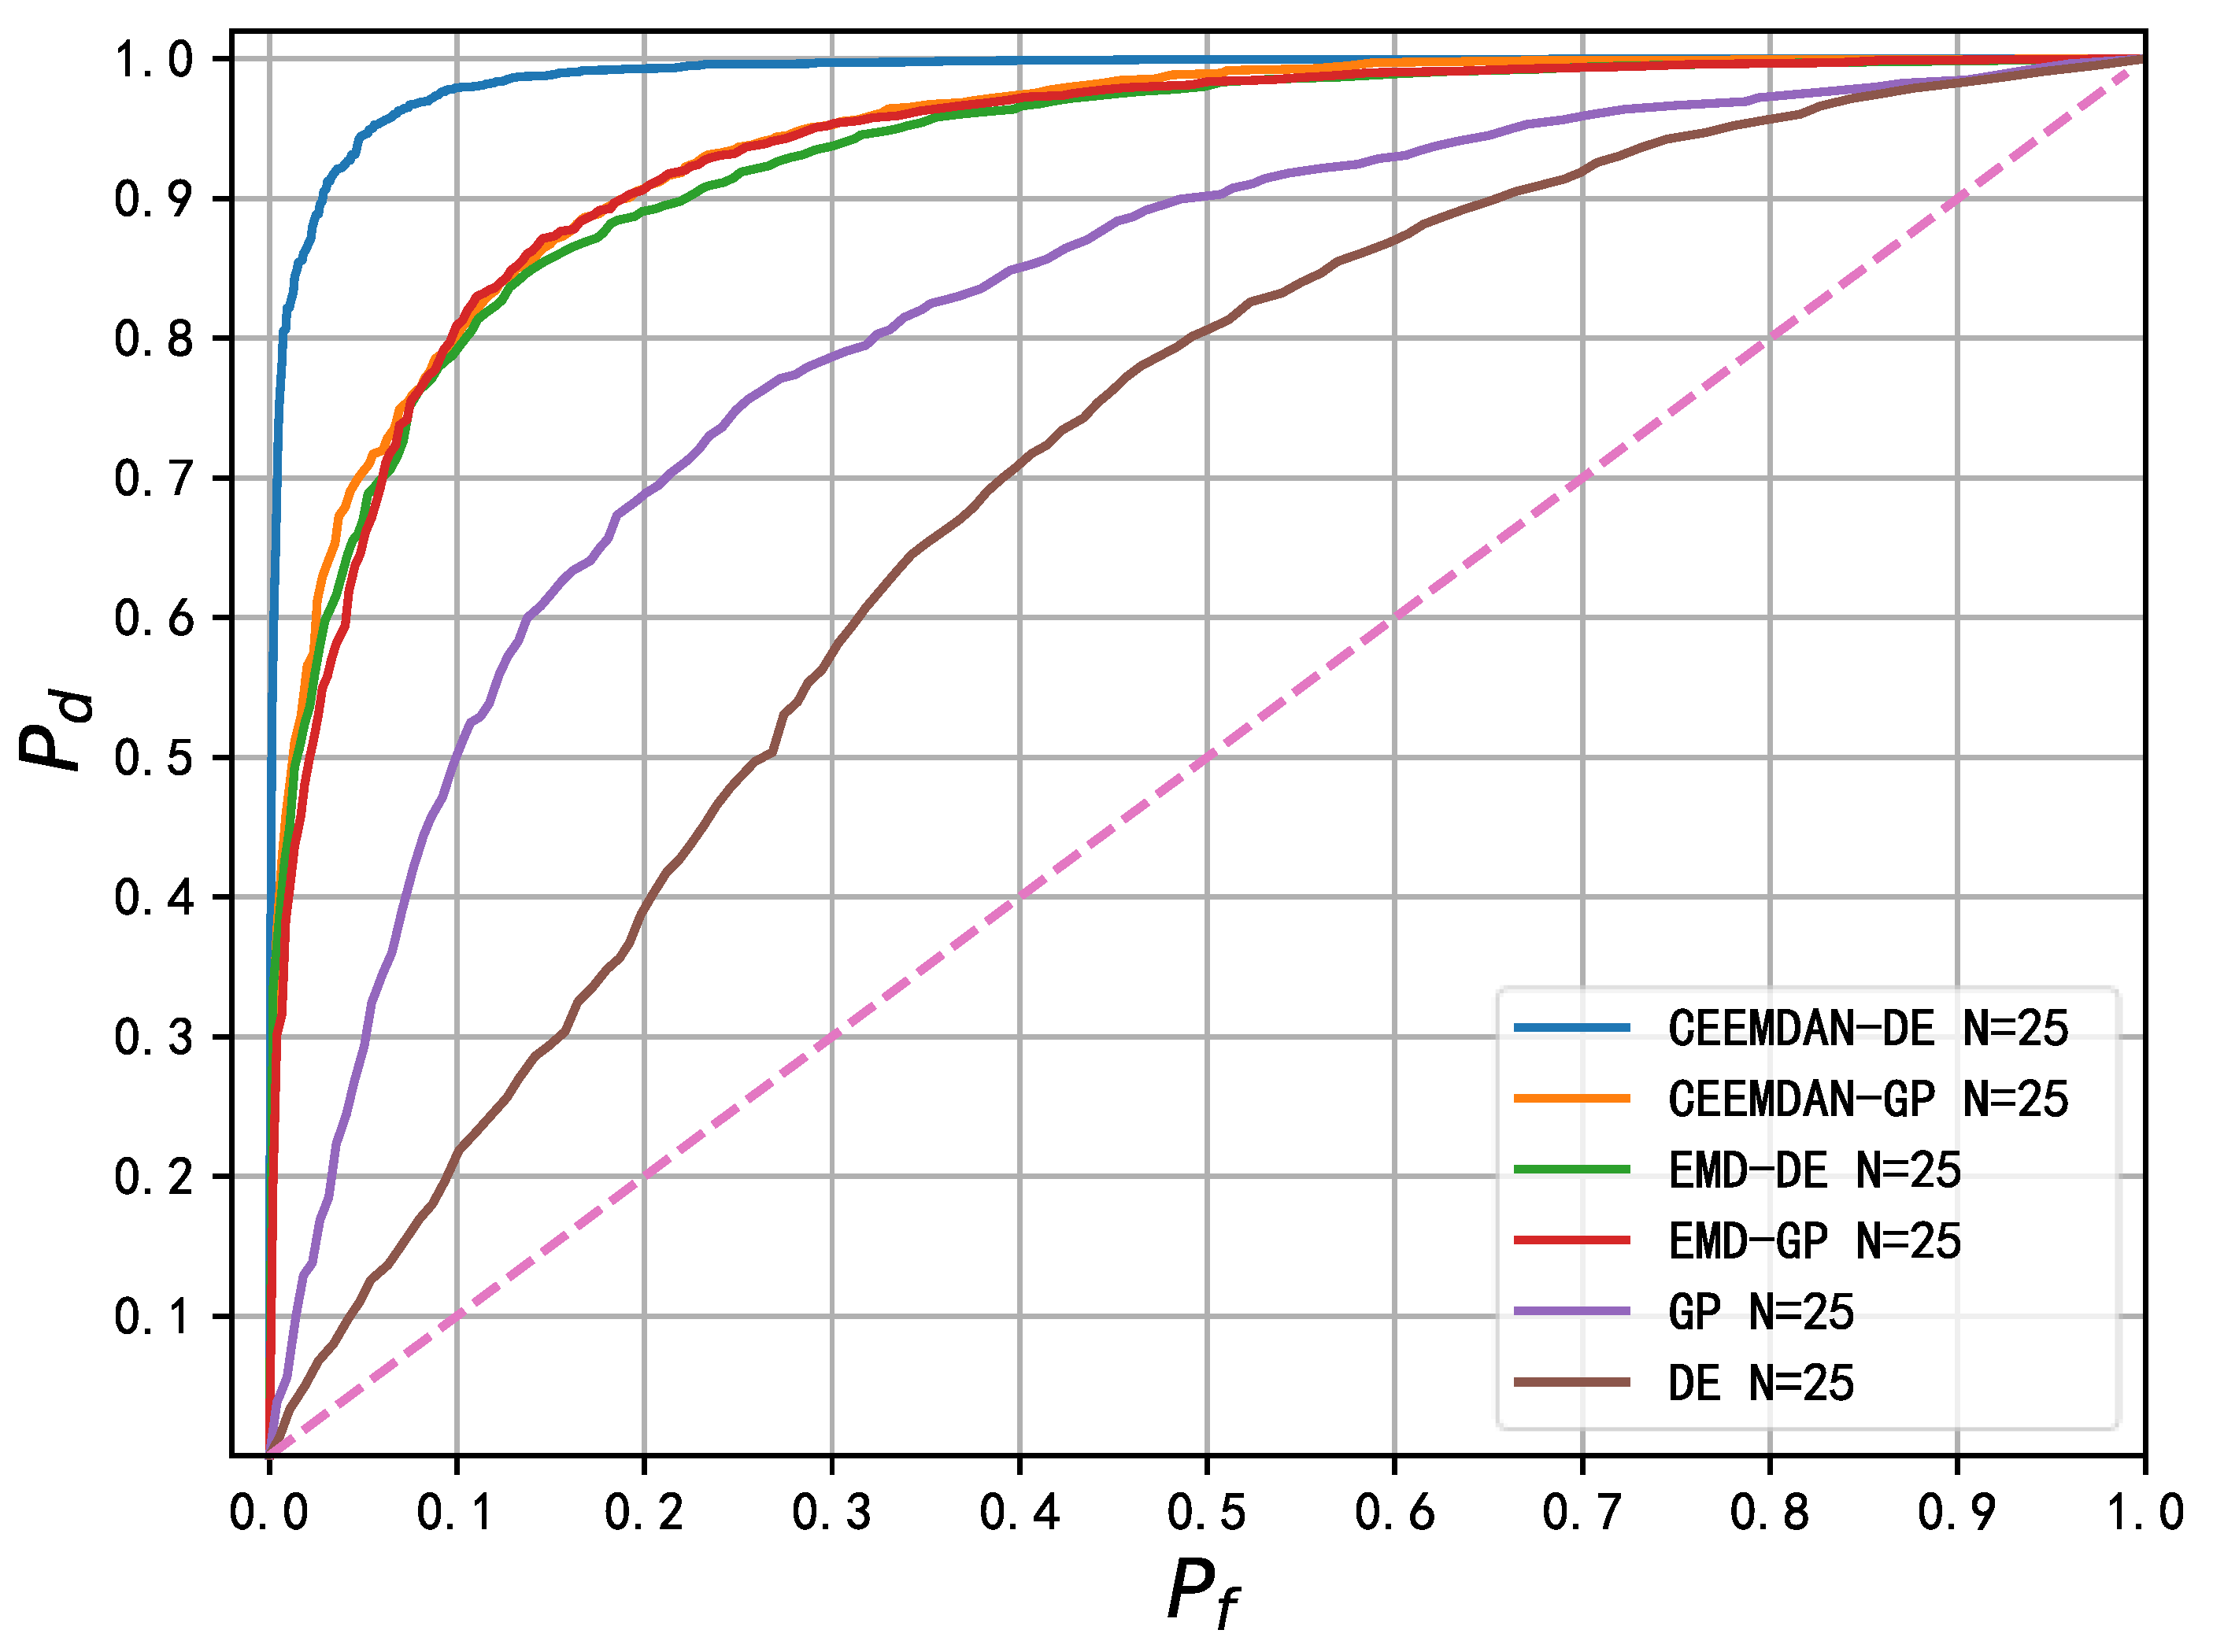
| CEEMDAN-DE | 0.947461 | 0.979 | 0.05019098 | 0.35761508 |
| CEEMDAN-GP | 0.830064 | 0.801 | 0.28540171 | 0.88132311 |
| EMD-DE | 0.834399 | 0.791 | 0.94971281 | 1.63474901 |
| EMD-GP | 0.862792 | 0.809 | 6.96336871 | 0.67814947 |
| DE | 0.666286 | 0.215 | 6.94563624 | 6.78160817 |
| GP | 0.773780 | 0.501 | 4.98229443 | 5.49424544 |
| Algorithms | AUC | |||
|---|---|---|---|---|
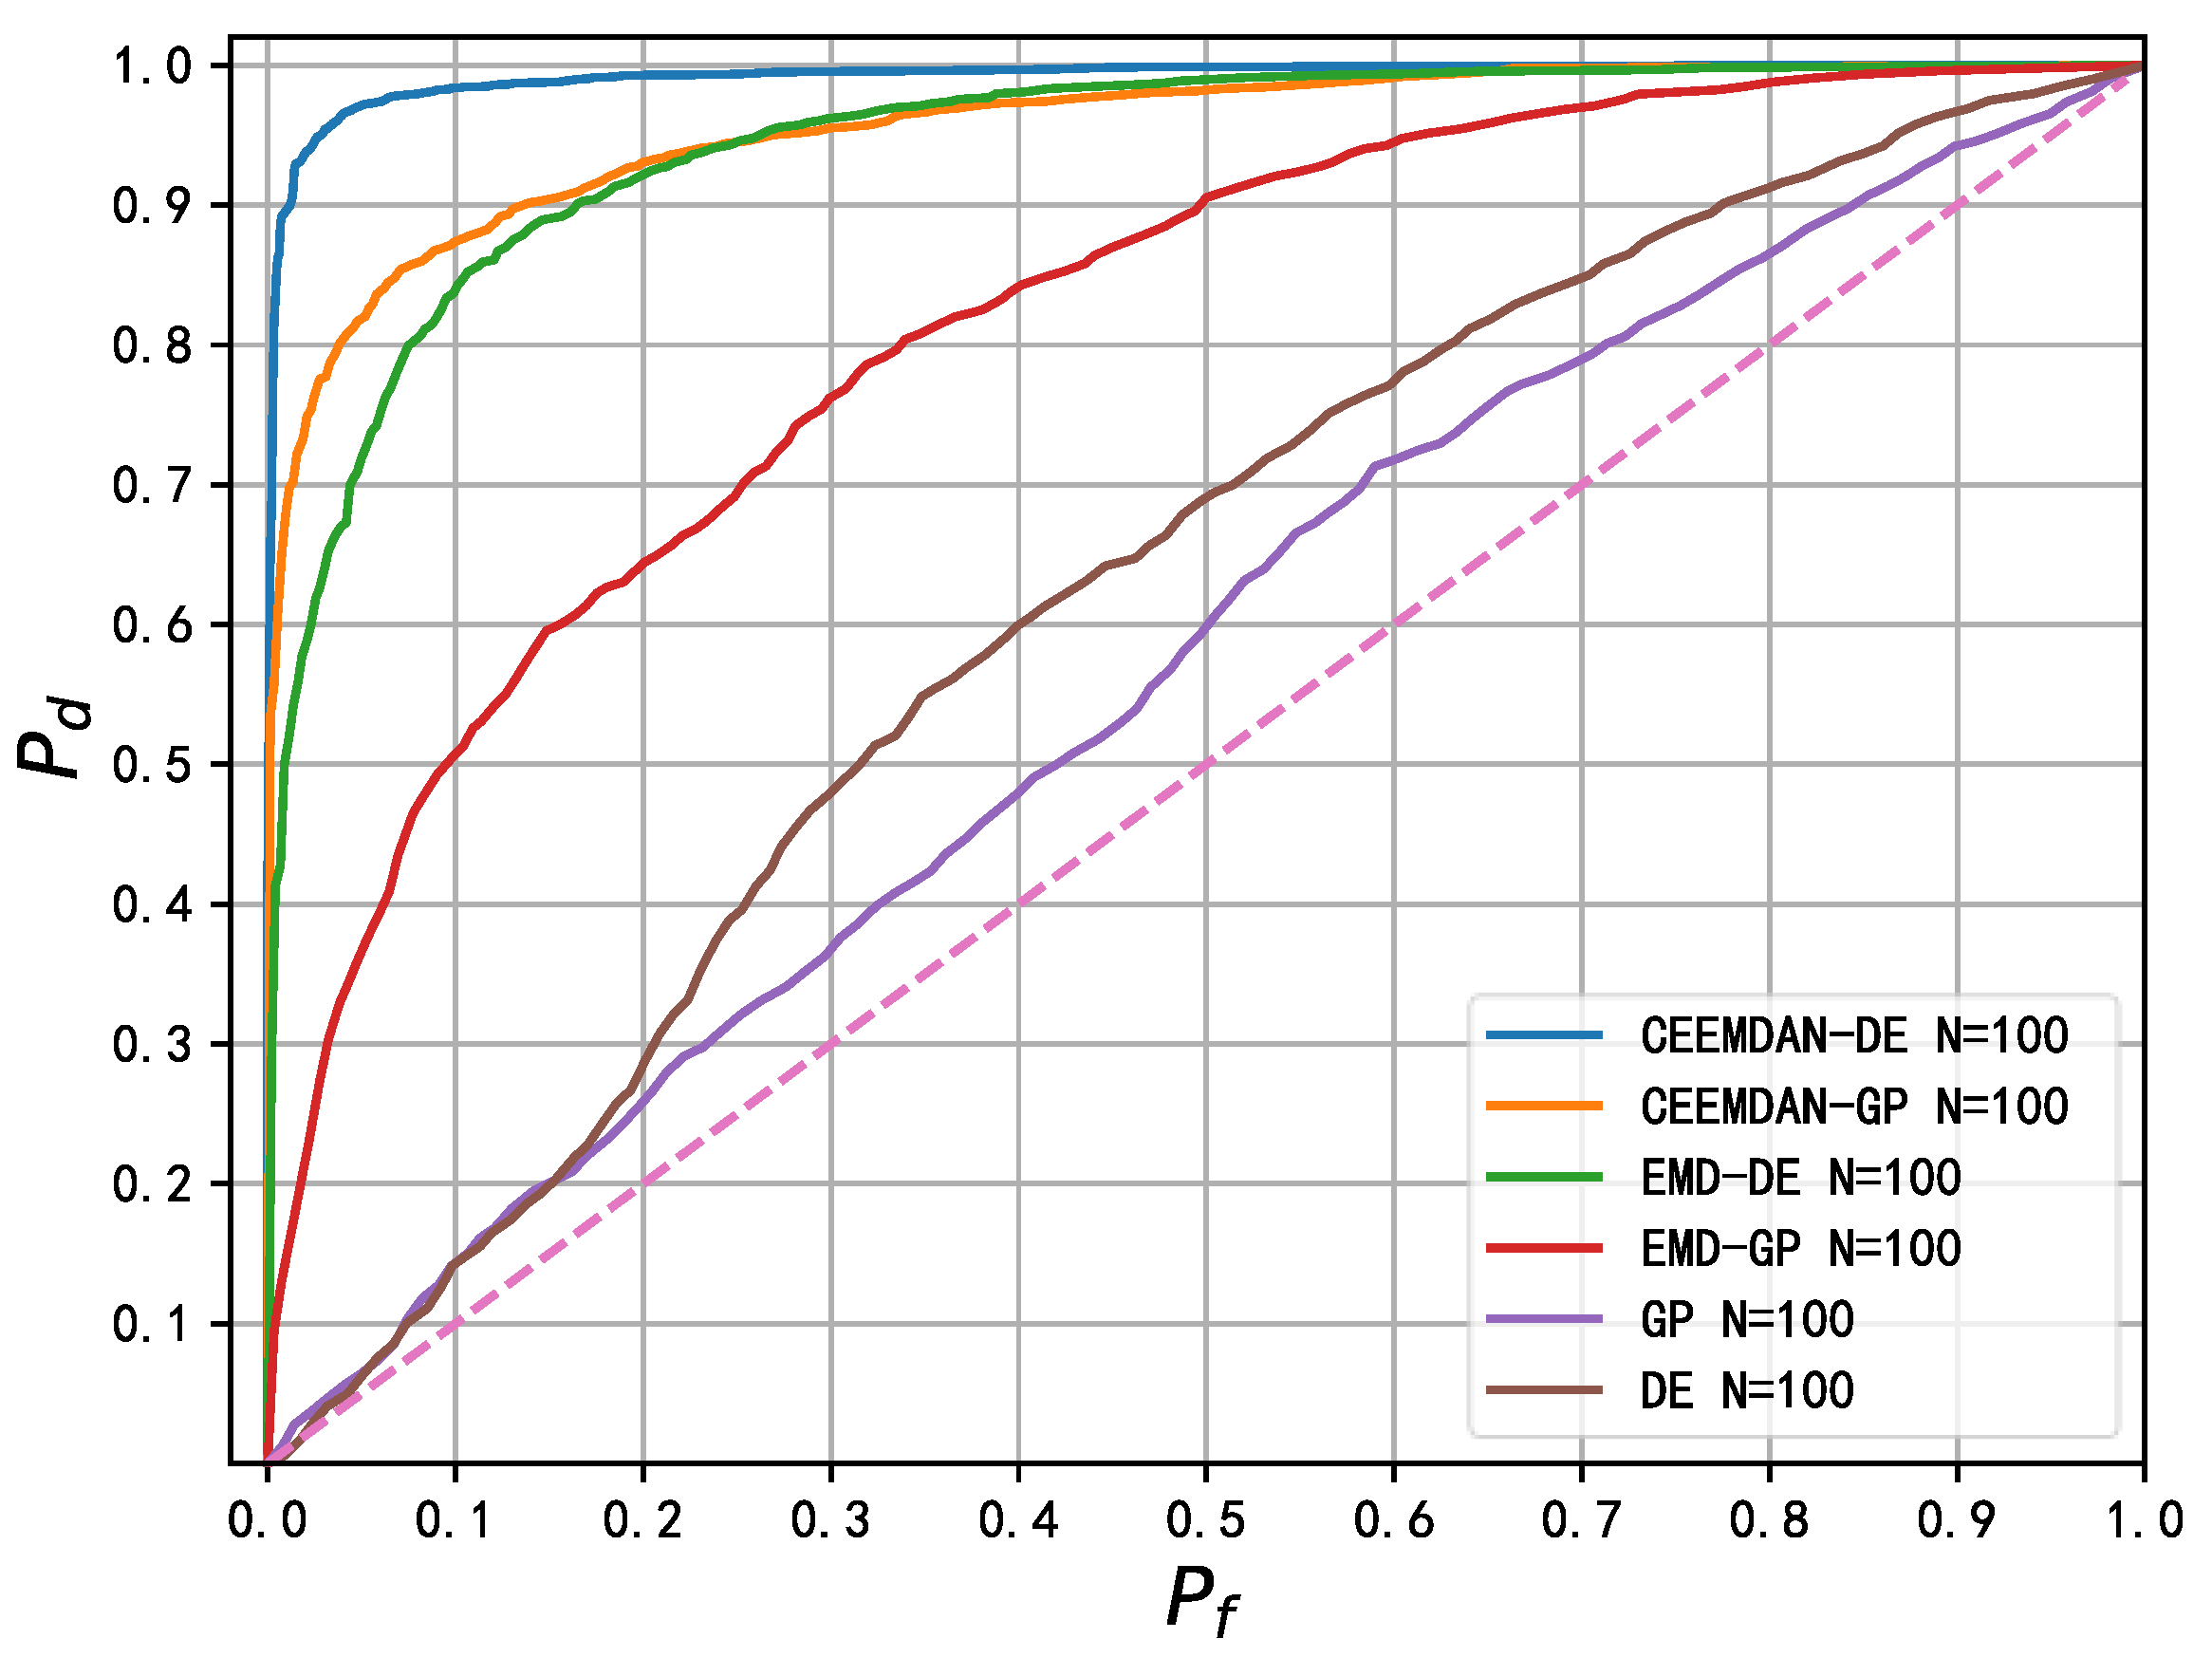
| CEEMDAN-DE | 0.962633 | 0.9839 | 5.00939943 | 10 |
| CEEMDAN-GP | 0.882664 | 0.874 | 8.230381791 | 9.5211308 |
| EMD-DE | 0.871692 | 0.839 | 0.29243504 | 6.28011474 |
| EMD-GP | 0.679500 | 0.507 | 2.59337523 | 1.24635901 |
| DE | 0.540575 | 0.143 | 5.92915985 | 5.31179191 |
| GP | 0.507679 | 0.1435 | 9.83149123 | 9.78577177 |
| Spectrum Sensing Algorithm | AUC | Accuracy Rate | |
|---|---|---|---|
| ISSA-SVM | 0.8 | 0.911871 | 0.93225 |
| 1.5 | 0.918863 | 0.90075 | |
| Random forest | 0.8 | 0.907170 | 0.924 |
| 1.5 | 0.814999 | 0.789 | |
| K-means | 0.8 | 0.600418 | 0.495 |
| 1.5 | 0.677811 | 0.7595 | |
| Decision tree | 0.8 | 0.88972 | 0.907 |
| 1.5 | 0.799265 | 0.77025 |
Disclaimer/Publisher’s Note: The statements, opinions and data contained in all publications are solely those of the individual author(s) and contributor(s) and not of MDPI and/or the editor(s). MDPI and/or the editor(s) disclaim responsibility for any injury to people or property resulting from any ideas, methods, instructions or products referred to in the content. |
© 2023 by the authors. Licensee MDPI, Basel, Switzerland. This article is an open access article distributed under the terms and conditions of the Creative Commons Attribution (CC BY) license (https://creativecommons.org/licenses/by/4.0/).
Share and Cite
Li, S.; Han, Y.; Gaber, J.; Yang, S.; Yang, Q. A Multi-Antenna Spectrum Sensing Method Based on CEEMDAN Decomposition Combined with Wavelet Packet Analysis. Electronics 2023, 12, 3823. https://doi.org/10.3390/electronics12183823
Li S, Han Y, Gaber J, Yang S, Yang Q. A Multi-Antenna Spectrum Sensing Method Based on CEEMDAN Decomposition Combined with Wavelet Packet Analysis. Electronics. 2023; 12(18):3823. https://doi.org/10.3390/electronics12183823
Chicago/Turabian StyleLi, Suoping, Yuzhou Han, Jaafar Gaber, Sa Yang, and Qian Yang. 2023. "A Multi-Antenna Spectrum Sensing Method Based on CEEMDAN Decomposition Combined with Wavelet Packet Analysis" Electronics 12, no. 18: 3823. https://doi.org/10.3390/electronics12183823
APA StyleLi, S., Han, Y., Gaber, J., Yang, S., & Yang, Q. (2023). A Multi-Antenna Spectrum Sensing Method Based on CEEMDAN Decomposition Combined with Wavelet Packet Analysis. Electronics, 12(18), 3823. https://doi.org/10.3390/electronics12183823