1. Introduction
The coronavirus epidemic has recently attracted significant focus to the medical industry and altered the way we perceive safety in all facets of our life. The coronavirus can be effectively controlled by social isolation. Currently, it is imperative to practice safety protocols including using masks, routinely rinsing hands, and exercising caution while exchanging personal goods. These can only partially halt the rise in COVID-19; they cannot completely stop it [
1]. In addition, vaccination emerged as the sole method that could possibly effectively eliminate COVID-19 and control it most adequately. The first mRNA vaccines were thoroughly tested, and over 40,000 participants took part in a Pfizer vaccine experiment and 30,000 in a Moderna vaccine trial. In both trials, the vaccinations had an average effective ratio of about 94%, and there were no fatalities [
2,
3]. Early research on Johnson & Johnson, a different viral vector vaccine that was demonstrated to be able to combat coronavirus and elicit an immune response in the recipient, revealed a score of successful achievement of >85% deprived of any adversative impacts [
4]. Although there might be some disagreements among regions due to disparities in urgency and financial constraints, we aimed to convey the facts concerning people’s immunization status objectively. Health specialists are extensively engaged in the production of various vaccine doses, but they are equally alarmed by the citizenry’s shocking absence of interest in and preparation for immunizations [
5]. Individuals have had divergent views on the vaccination process since it has been initiated; we have even witnessed similar arguments or questions from individuals in our own communities. In several studies, experts investigated the reasons behind this reluctance. Published research articles have discussed a lot of this, particularly the controversy around vaccinations. Scientific papers have recently covered a lot of this, including the reason why people are debating taking vaccines. Some of the causes include the fact that vaccines were developed so quickly that there may not be enough investigation on them, the possibility that they could result in tumors [
3] or fertility problems, doubts related to the effectiveness of receiving a second dose, allergies [
4], blood clotting, the reliability of the production units, ideological and spiritual views, trends circulating on social platforms [
5], and conspiracies [
6,
7,
8].
Numerous methods have been proposed to examine the feelings of people about COVID-19 vaccination, and some studies are area specific. These studies gave us different conclusions about the people’s opinions related to COVID vaccination. Moreover, related work has some limitations, i.e., overfitting problem, real-time data gathering, low accuracy, lacks the generalization ability, etc. To tackle the existing problems and to provide the sentiment investigation about COVID-19 vaccination, we have presented the DL-based model named “TSM-CV”. After data collection, a series of data preprocessing steps are performed to refine and clean the data samples. Then, we applied the FastText approach to computing a more nominative representation of tweets data showing both the syntactic and semantic information. After this, we applied the VADER approach to assigning the labels to processed samples by performing sentiment analysis. To make the model more efficient and reduce the computational burden, next, we have accomplished the data reduction step by using the NMF model. Finally, the RMDL classifier combing several DL approaches in parallel is applied over the reduced sample set to perform the classification task. The distinctive outcomes of the proposed framework are as:
A novel DL method namely the “TSM-CV” is presented for sentiment analysis that is capable of processing the sentiments of people related to several types of vaccines like Sinovac, Sinopharm, Oxford/AstraZeneca, etc. due to its high recall ability.
Effective sentiment analysis results of the framework because of the reliable feature extraction ability of the FastText approach which presents the complex text patterns in a viable manner.
We present an efficient approach for the sentiment analysis of the COVID-19 vaccines due to the employment of the feature reduction approach which assists to remove unnecessary details and prohibits the model from over-fitting issues.
Robust performance in processing the sentiment of people related to the vaccination process because of the inclusion of both textual and emotion-based data.
Reliable classification results due to the utilization of the NMF model which employs several DL classifiers to compute the final result.
Extensive experimentation has been conducted in comparison to several latest methods by using both real and historic data to confirm the effectiveness of the introduced approach.
The rest of the paper structure is given as:
Section 2 consists of related studies; our proposed methodology is defined in
Section 3. The experimental evaluations of our proposed method are elaborated in
Section 4, while we conclude our work in
Section 5.
2. Related Work
Here, we have investigated the studies from history performed for the sentiment analysis of the COVID-19 vaccine by employing data posted on social sites.
Liu et al. [
6] proposed an approach to analyzing the sentiments of people around the globe related to the COVID-19 vaccine to examine differences in the thoughts of humans at the world and state levels. Initially, tweets related to the coronavirus vaccine were collected from the Twitter platform for a defined period. After this, the Valence Aware Dictionary along with the Sentiment Reasoner software was used to compute a score related to all posted tweets to declare them as positive, negative, or neutral. Then in the next step, the latent Dirichlet allocation examination was conducted to get major topics associated with positive and negative tweets. Finally, the temporal analysis was used to perform a geographical investigation to discover emotional dissimilarities in tweets tweeted in diverse areas. The work [
6] concluded that there is a need to design more operative vaccine awareness programs based on region-based sentiment analysis of the COVID-19 vaccine. Rahmanti et al. [
7] proposed an approach to investigate the efficacy of social platforms like Twitter sentiment investigation to recognize the association between online audience sentiments on the coronavirus vaccine and vaccination analysis in Indonesia. In the first step, data related to the coronavirus vaccine from Indonesia was collected from the Twitter social site for a defined time. Then after preprocessing the collected samples, sentiment analysis of tweets was performed by employing the posted comments and emotional signs and phrases to identify the people’s behavior towards the vaccination procedure. It was concluded in [
7] that the employment of social websites sentiment studies can assist in the real-time investigation of the issues related to the coronavirus vaccination procedure. Such measures can help the administration in taking active steps to tackle the rumors spread over social sites to hinder the vaccination process. However, the approach elaborated in [
7] is only evaluated for Indonesia and lacks generalization ability. Another approach was discussed in [
8] where people’s judgment about the coronavirus vaccine was analyzed via performing sentiment analysis of tweets posted by the people on the Twitter platform. After collecting the tweets related to vaccination experiences from the Twitter social website, the work performed a sentiment analysis on the collected samples via employing several factors like positive and negative tweets distribution over time, location, and by following tweets engagement measures. The work found that performing the sentiment examination of people’s behavior about the coronavirus vaccine can assist health organizations to increase awareness among people by better answering the misconceptions. However, the approach disused in [
8] requires the evaluation of a large sample set. Nezhad et al. [
9] proposed a deep learning framework to analyze people’s sentiments related to coronavirus vaccination by using the tweets posted on the social platform. Initially, data was gathered from Twitter on which the CNN-LSTM model was applied for feature computation and predicting people’s behavior toward the COVID-19 vaccine. The approach [
9] shows better audience sentiment prediction results; however, performance is evaluated only for people from Iran and lacks the generalization ability.
Another work was discussed in [
10] where data from the Reddit platform was collected by taking the posted samples from twelve different communities. After taking input data from the social platform the lexical-based sentiment investigation approach was applied to predict the audience’s emotions towards different COVID-19 vaccines. The work [
10] shows better sentiment analysis performance for the coronavirus vaccine; however, they are unable to provide the location-based analysis which is required for health organizations to detect the audience with misinformation to provide them guidance. Chinnasamy et al. [
11] proposed an approach to predict people’s behavior for the COVID-19 vaccine using sentimental analysis of tweets. In the first phase, the model extracted the latest posted tweets along with used hashtags for numerous categories of coronavirus vaccines via employing Twitter’s API. The collected data was passed to train the Naïve Bayes classifier to perform the prediction task. The work [
11] is proficient to estimate the people’s reaction to the COVID-19 vaccines; however, it requires the evaluation of a large data sample. Marcec et al. [
12] discussed a framework to investigate the sentiments of humans about the coronavirus vaccine. The work employed a Twitter API to extract coronavirus vaccine-related posts from the Twitter platform. After this, the collected data was passed to the AFINN lexicon to accomplish the sentiment examination of retrieved samples. Another approach was discussed in [
13] where the sentiment study related to thoughts of people for the coronavirus vaccine was investigated for the people of Indonesia. Initially, the tweets containing sentiment information about the COVID-19 vaccine were collected from the Twitter social website. Then, the extracted data was preprocessed which were then passed to the word embeddings approaches to produce a reliable vector representation. Once the feature vector was generated, it was passed to a bi-LSTM model to perform the tweet’s sentiment investigation. The work elaborated in [
13] shows better performance; however, suffering from high computational complexity and is performed only for the Indonesian population. A study was reported in [
14] performing the sentiment investigation of people to determine their intentions for the coronavirus vaccination procedures. The work collected both the English and Arabic tweets from the Twitter platform which were preprocessed to collect a nominative feature vector. Lastly, the spatiotemporal examination was used on the collected data to predict people’s responses to the COVID-19 vaccine. The model [
14] is effective to perform the sentiment analysis of coronavirus vaccine-related tweets; however, it suffers from the model-overfitting problem [
15].
Sattar et al. [
16] presented a framework for performing the sentiment analysis of humans around the globe for the vaccination process during the COVID-19 pandemic. Initially, the tweets related to different vaccines were extracted from the Twitter platform. After this, several steps were performed in a preprocessing phase to clean the collected samples. After this, the bags of word technique were employed to extract a meaningful representation of process samples. In the next step, the textBlob and VADER approaches were used to perform the sentiment analysis of the features which were later classified by employing several machine learning (ML) classifiers. The work discussed in [
16] shows better sentiment analysis performance; however, the model needs evaluation on samples with a large time span. Another approach was discussed in [
17] where the sentiment of COVID-19 vaccine-related tweets was conducted by using natural language processing techniques. The work provided the behavioral investigation of people from the United States based on time and location. The technique [
17] better elaborates the sentiment analysis of people for the COVID-19 vaccine; however, the work is evaluated only for the united states and lacks generalization ability. Villavicencio et al. [
18] proposed a model to perform the coronavirus vaccine sentiment analysis of Twitter-based data. Initially, samples containing information about the COVID-19 vaccination experience were collected through tweets. In the next phase, the collected samples were preprocessed by using several phases like eliminating duplicate and noisy data. Then, the processed samples were divided into different groups which were later classified by employing the naïve Bayes (NB) algorithm. The approach [
18] works well to perform the sentiment investigation of people about the COVID-19 vaccine; however, the model requires evaluation over a large database. Another approach employing the NB method for classifying the tweets related to the coronavirus vaccine into different groups was investigated in [
19]. The work presents a lightweight framework for the behavioral analysis of people for the COVID-19 pandemic vaccine; however, the performance needs further improvements. Yin et al. [
20] introduced a framework to assess the judgment of people about the vaccination process of the COVID-19 pandemic by using tweets sentiment analysis. The collected data was initially preprocessed to remove unnecessary details like tweets with missing location information and redundant samples. Then, the LDA and VADER approaches were employed to perform the sentiment analysis over the collected feature set. Another framework was presented in [
21] to perform a sentiment investigation of the coronavirus vaccine by employing data posted on Twitter. The work focused to evaluate the audience’s opinions on the COVID-19 vaccination by merging sentiment examination and natural language processing (NLP) approaches to categorize tweets. The approach utilized a huge group of tweets having #COVID _Vaccine hashtags. Then, the nltk library analyses the tweets, while the tf-idf approach was employed for keyword generation. The work counted both n-gram keywords along with the hashtags used in the posted content and count them. The approach conducted the sentiment analysis by dividing the tweets into two groups, namely positive and negative. The method [
21] shows better performance results; however, it lacks generalization power.
The conducted analysis is clearly showing that several approaches have been presented for the accurate sentiment analysis of humans to assess their behavior toward the COVID-19 vaccine; however, still there is a gap that needs performance improvement [
22].
3. Materials and Methods
In this work, we have presented a model, namely TSM-CV, for the sentiment analysis of COVID-19 vaccine-related tweets data. After data collection, a series of data preprocessing steps are performed to refine and clean the data samples. Then, we applied the FastText approach to computing a more nominative representation of tweets data showing both the syntactic and semantic information [
23]. After this, we applied the VADER approach to assigning the labels to processed samples by performing sentiment analysis. To make the model more efficient and reduce the computational burden, next, we have accomplished the data reduction step by using the NMF model. Finally, the RMDL classifier combing several DL approaches in parallel is applied over the reduced sample set to perform the classification task. A detailed pictorial view of the proposed model is given in
Figure 1, while the performed steps are elaborated in Algorithm 1.
| Algorithm 1: Steps followed by the proposed approach |
START
INPUT: TweetsData
OUTPUT: Sentiment score (PositiveScore, NegativeScore, NeutralScore)
TweetsData: Kagglewebsite, Tweets From Twitter platform
Sentiment score: 1 (Positive), 0 (Neutral), -1 (Negative)
Start
- 1.
Preprocessing ()
INPUT: TweetsData
OUTPUT: ProcessedTweetData
- i.
Perform Tokenization - ii.
Lower case conversion - iii.
Remove URLs, Hashtag symbols, and usernames - iv.
Remove Slang and Abbreviation - v.
Noise Removal - vi.
Spelling Correction - vii.
Part-of-Speech tagging - viii.
Lemmatization - ix.
Stemming - x.
Emoticons and Emojis
Finish
//Compute features
Start
- 2.
WordEmbeddings()
INPUT: ProcessedTweetData
OUTPUT: Features
foreach Tweet in ProcessedTweetData do
Apply FastText and calculate
End
Finish
//Compute labels
Start
- 3.
SentimentAnalysis()
INPUT: Features
OUTPUT: LabelledFeatures
foreach sample in Features do
Apply VADER and compute polarity score
If (sample is found positive)
Assign label=1;
Else if(sample is found Negative)
Assign label=-1;
Else
Assign label=0;
End
End
Finish
//Reduce Features
Start
- 4.
DimensionalityReduction ()
INPUT: LabelledFeatures
OUTPUT: ReducedFeatures
foreach sample in LabelledFeatures do
Apply NMF and compute
End
Finish
// Dataset Preparation
Start
INPUT: ReducedFeatures
OUTPUT: TrainSet, TestSet
Assign TrainSet= 70% of data
Assign TestSet=30% of data
Finish
// Model Training
Start
INPUT: TrainSet
OUTPUT: TrainModel
foreach classifier in RMDL do
END
Compute training accuracy
Compute training loss
Finish
// Model Testing
Start
INPUT: TrainModel, TestSet
OUTPUT: Sentiment score
foreach sample in TestSet do
PositiveScoret=0;
NegativeScoret=0;
NeutralScoret=0;
foreach classifier Ci in TrainModel do
if Ci predict Positive then
PositiveScoret= positiveScoret + (weightCi * Probability(Positivei);
Else if Ci predict Negative then
NegativeScoret= NegativeScoret + (weightCi * Probability(Negativei);
Else
NeutralScoret= NeutralScoret + (weightCi * Probability(Neutral);
END
Return PositiveScore, NegativeScore, NeutralScore
END
Finish
FINISH. |
3.1. Data Collection
In the proposed work, we have used both historic and real-time data to train and test the performance of the proposed approach. For historic data, we have employed a dataset namely “All COVID-19 Vaccines Tweets” which is publicly accessible on the Kaggle website [
24]. This dataset comprises samples containing information on all famous vaccines like Sinovac, Sinopharm, Oxford/AstraZeneca, etc. The dataset comprises a total of 125,906 tweet data posted along with information about the account holder’s name, tweet date, location, tweet, number of followers, total retweets and sources, etc. The employed dataset contains tweets from different parts of the world 1% of tweets are from India, 22% are null, while the remaining tweets are from different parts of the globe like America, Pakistan, Turkey, and England, etc. While for real-time data, we employed the snscrape tool [
25] to extract tweets posted on the Twitter platform containing information about the coronavirus vaccination process and people’s experiences. We used several keywords in combination to collect the tweets posted on Twitter between 5 January 2020 and 3 June 2021. These keywords include terms like “COVID-19”, “coronavirus”, “corona pandemic”, “SARS-CoV-2”, and “COVID-19 vaccine” to collect the related data from Twitter. The collected samples contain information about the userID, tweet date, URL, account holder name, tweet, retweeted post count, etc. The presented work used a user lookup Twitter API to gain information about the locality and account holder’s engagement data as the snscrape tool is unable to get the location information. The geographic data is located from user-defined profile information on Twitter with an availability ratio of 70%. We collected a total of 4,554,258 tweets posted on Twitter by 1,571,600 accounts. The data from both the employed dataset and Twitter posts are passed to a preprocessing phase to remove unnecessary details and noise.
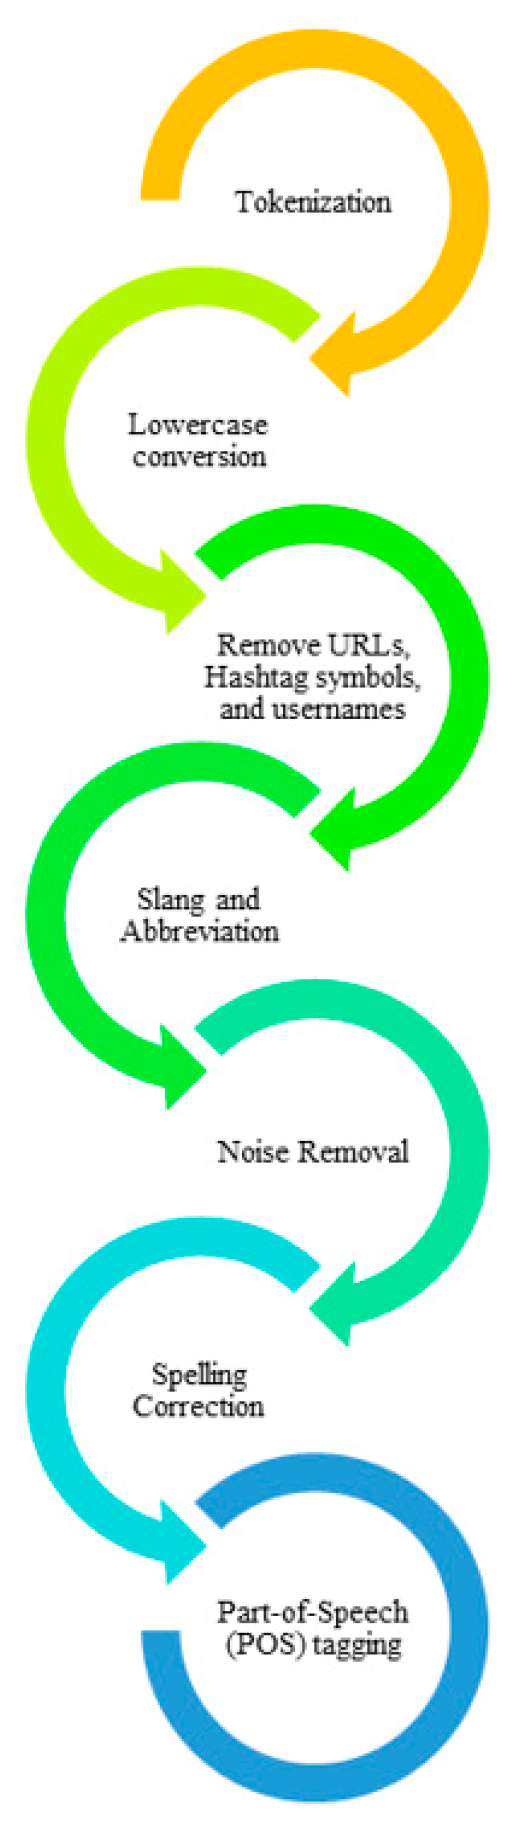
3.2. Preprocessing
Here, we have performed a sequence of steps to eliminate the noisy, redundant, and unnecessary details from the data. Mostly, posted tweets comprise several unrequired details like misspelled words, slang, stop words, etc. The presence of such details can affect the model performance; therefore, some steps are selected to eliminate such data to get a more reliable representation of samples. A visual representation of all steps involved in the preprocessing is given in
Figure 2, while details can be found in the subsequent sections.
3.2.1. Tokenization
Tokenization is a procedure of dividing tweets into consecutive words, symbols, keywords, and meaningful phrases known as tokens. The basic purpose of this step is to analyze the used words in a sentence. So, we have initially performed the tokenization phase on the tweets.
3.2.2. Lowercase Conversion
Initially, the extracted tweets are processed to convert them into lowercase. Because of this step, the same words are combined and assisted to reduce the feature space. For this reason, we have used customized code to convert all strings to lowercase.
3.2.3. Remove URLs, Hashtag Symbols, and Usernames
The acquired tweet samples contain URLs and usernames, and hashtag symbols that do not affect the sentiment analysis of the text. Therefore, we have eliminated these terms from the tweets by using the method given in [
26]. This step also assists to remove unnecessary details from the content.
3.2.4. Slang and Abbreviation
People posting tweets on Twitter usually use an informal way of writing to express their emotions which comprises different slang and abbreviations. Slang contains such keywords and phrases that are used in informal talk and may be prohibited in a specific perspective, whereas abbreviation defines a reduced form of a word. For the correct interpretation of slang and abbreviations, it is mandatory to convert them into a formal form. For this reason, we have manually replaced such terms by creating a lookup table of such kinds of 290 terms. A few examples include “ty”, “omg”, which implies “thank you” and “oh my God”.
3.2.5. Noise Removal
The extracted data is subject to several unrequired pieces of information like punctuation marks and special characters. Such signs are mandatory for humans to understand the meaning of a sentence, however, in the text analysis, these terms harm the model learning process. Therefore, such marks are removed from the tweets. In our presented work, we have used the Lucene tool to remove such details [
27].
3.2.6. Spelling Correction
The posted tweets on the Twitter platform are subject to several spelling mistakes which can mislead the learning ability of a model. Therefore, we performed this step to correct the spelling mistakes. For this reason, we have used Norvig’s spelling corrector tool [
28] as it has shown remarkable performance for correcting spelling mistakes in text phrases.
3.2.7. Part-of-Speech (POS) Tagging
This phase is concerned to assign each word a POS label like a verb, noun, adverb, third-person verb, etc. The basic reason to use this step is to identify and removed those words which are free from sentiments. The proposed approach only kept nouns, verbs, and adverbs for performing the sentiment analysis of the COVID-19 vaccination process. In our work, we have used the POS tagging facility of the Natural Language Toolkit, NLTK4 [
29].
3.2.8. Lemmatization
Another approach to combining several words into one is named lemmatization. The lemmatization phase examines a word morphologically and eliminates the pronunciation ending, generating its basic terminology or lemma as designated in a dictionary. For the presented work we have employed the Wordnet lemmatizer tool [
30].
3.2.9. Stemming
In tweets, there can be multiple representations of a word like it can be appeared as a single or plural form whereas the morphological meaning remains the same. Therefore, the stemming phase is applied to convert such words into a single word which assists to reduce the feature space. We have used the PorterStemmer tool for this purpose [
31].
3.2.10. Emoticons and Emojis
In this phase, we calculate the tweet’s polarity from the used emoji in the text. We have shown the most commonly employed emoticons symbols in
Table 1. We also consider the cases where multiple emoji symbols are employed and assigned the polarity rate based on the first symbol used in tweets as elaborated in [
32].
3.3. Feature Extraction Using Word Embeddings
Once the data is passed from the preprocessed stage, next is it is forwarded to a word embeddings stage for feature extraction and representation. Although the preprocessing stage converted the data into a well-syntactic form; however, still the classification models are unable to capture the semantic information of the data. Therefore, a more reliable representation of tweets covering both syntactic and morphological information is required to perform a reliable sentiment analysis of the people regarding the COVID-19 vaccine.
Usually, existing works employed the bag-of-word (BOW) frameworks for this reason, however, the BOW approaches are unable to fully capture the morphological information of the text. Like terms “aircraft”, “aero-plane”, “plane”, and “jet” are employed as an alternative to each other; however, the BAG approaches draw different orthogonal vectors for them. Such limitations impose a serious issue for classifiers to understand the sentence structure. Secondly, the BOW models do not take into count the word’s order in a sentence like “This is good” and “Is this good” are considered the same in BOW. To solve the problems of BOW models, word embedding techniques are introduced that map every word or term to an N-dimension vector of real numbers. The word embedding techniques are proficient in understanding the morphological characteristics of a phrase.
For the presented work, we have employed the FastText word embeddings approach [
33] for feature computation. The FastText approach is presented by the Facebook AI Research lab. The basic reason to nominate the FastText approach over the Word2Vec and GloVe word embedding approaches is due to its ability to handle the out-of-vocabulary problem by showing every word as a bag of character (BOC) n-grams. The vector representation is linked to all character n-grams which in turn represents a word as the sum of these character n-gram demonstrations. Moreover, the FastText approach extracts word representation by giving focus to sub-word information employing n-grams with the skip-gram framework. Such capabilities of the FastText approach permit it to learn small words and recognize word suffixes and prefixes [
34].
The FastText model shows all words W as a BOC n-gram, like for the term “introduce” with N = 3, this approach will generate the following forms comprised of character tri-grams: <in, int, ntr, tro, rod, odu, duc, uce, ce>. The FastText model considers the given collection of text and generates a high-dimensional vector space, by producing as much meaning as possible which ultimately keeps the similar words close together. For a corpus of n-grams (
m) with size
S, and words
W linked with vector representation of the
vm to all m, the FastText uses the given equation to generate the required feature space as elaborated in [
34]:
where
C is showing the indices of words
W, while
is showing the vector representations of
W.
3.4. Sentiment Analysis with Valence Aware Dictionary and Sentiment Reasoner (VADER)
Once the tweets are represented as a feature vector, next these are passed to the VADER for sentiment analysis. VADER is a rule and lexicon-oriented sentiment investigation approach that processes the content and assigns a polarity score to it. In the presented approach, the extracted feature vector from the FastText model is passed to VADER, on which performs the sentiment analysis by considering both the used terms and the emotion polarity added score. Based on this, it assigns three labels to each sample as being positive (1), negative (−1), or neutral (0).
3.5. Dimensionality Reduction
We have introduced a module to reduce the feature space by removing unnecessary or redundant samples from the computed dataset. For this reason, we have used the Non-Negative Matrix Factorization (NMF) approach which minimizes the feature vector size by eliminating the negative samples [
35]. The non-negative matrix representation has shown remarkable results for text analysis by reducing the high dimensional space to a reduced shape without affecting the classifier learning behavior.
For a given feature matrix say X with the dimension of
, the NMF model tries to find two matrices say
K, and
L of sizes
, and
, respectively, as given in Equation (2):
The value of
r is chosen such that the following condition remains true:
, with the aim that
is considered as the reduced form of the tweets samples in
The column representation of Equation (2) can be written as:
Here, x and l are showing the corresponding columns of X and L, respectively. Each column in x is computed by employing a linear combination of the K weighted by the components of l. Hence, W is recognized as the base improved for the linear estimation of the tweets in X. As few vectors are employed to show several data vectors, so, better estimation is only possible if the basis vectors are capable of identifying the hidden pattern in the data.
Initially, the NMF defines the update rule as represented in Equation (4), and Equation (5), respectively:
While Equation (6) represents the mathematical description of the local minimum of the objective function.
While the maximization of the objective function is given in Equation (7):
Finally, the extracted matrix K and L are updated as:
A detailed description of NMF is discussed in Algorithm 2.
| Algorithm 2: Steps for the NMF approach for features reduction |
| X: Tweets feature set attained with the word embedding approach. |
,
relates to local weights of the ith term in tweet j,
are global weights for term i |
| Employ NMF to all words that appeared in tweets individually; |
| Plot the trained tweet vector to an r-dimensional space; |
| Employing a similar transformation, project the test data to a r-dimensional space; |
| Compute the resemblance among the transformed Tweets feature set and a query vector. |
3.6. Classification
Once the dataset is passed from the dimensionality reduction step, next it is passed to the classifier module to perform the classification. We have used a deep classifier namely the RMDL approach [
36,
37]. The RMDL classifier comprises three Deep Neural Networks (DNN), CNNs, and RNNs frameworks varying in layers and nodes. A mathematical formulation of the model is given in Equation (11):
Here,
N depicts the number of models, while
is determining the prediction score of a model for a tweet
k in model t mapping it to three classes namely positive, negative, and neutral, respectively. The final prediction denoted by
is defined by the majority voting process, mathematically given in Equation (12).
Here,
N defines the number of models while and
defines the predicted label by a model
t for tweets
k, and
is given by Equation (13):
The RMDL model employs the DNN, CNN, and RCNN models in parallel to accomplish the classification task. A comprehensive explanation of all models is provided in subsequent sections.
3.6.1. DNN
The DNN approach is focused to learn the hidden patterns in text classification by employing multi-links of model layers with the intention that each next layer receives output from the earlier layer and passed it to the succeeding layer [
38]. The output layer classifies the tweets samples into three groups namely the positive negative and neutral, respectively. We have employed three DNN classifiers for our approach that utilizes the standard back-propagation approach with sigmoid and ReLU functions as activation methods, while the classification layer uses the softmax function. The mathematical depiction of the sigmoid, ReLU, and softmax functions are given in Equations (14)–(16), respectively while the visual representation is given in
Figure 3.
3.6.2. CNN
The second module of the RMDL model is a CNN-based classifier (
Figure 4). The CNNs are originally designed to process the image data; however, due to their fast learning capabilities, these are heavily explored for textual data analysis as well [
39,
40]. In the presented work, we have employed three CNN classifiers for the tweets classification to assess the audience’s behavior toward the COVID-19 vaccine.
In the CNN classifier, the input vector is convolved by using filters of varying sizes s × s. The convolution filters generate the feature maps which are stacked to perform several filters on the tweets samples. This architecture of the CNN classifier results in a large feature space; therefore, the pooling layers are introduced to minimize the computational burden. Several pooling approaches can be employed in the CNNs for dimension reduction; however, we have used the max pooling method which nominates the highest value from the pooling filter. Moreover, the employment of the back-propagation approach assists the CNN framework to adjust its behavior with time to improve the categorization results of the network.
3.6.3. LSTM
The third module of the RMDL model is the LSTM classifier. In the presented work, we have used the LSTM model which is an extended form of the RNN approach. LSTM model is the same as the RNN with added memory cells to tackle the problem of vanishing gradient. Though the LSTM classifier comprises a chain-like architecture same as the RNN; LSTM employs several gates to wisely control the amount of data that will be passed to every node state. Such architectural description of the LSTM model is found very proficient in classifying the text information as this model is capable of storing the information for a long time and can understand the hidden patterns efficiently. A detailed mathematical explanation of the LSTM model is mentioned in Equations (17)–(22), respectively.
Equations from (17) to (22) are representing the input gate, candid memory cell value, forget gate activation, new memory cell score, and output gate scores, respectively where
, and
are the weights and bias values. Moreover,
is the input passed to the memory unit at time
t, and
I,
m,
f, and
y show the input, unit memory, forget, and output gates. A graphic demonstration of the LSTM model is given in
Figure 5.
4. Results
In this part of the paper, a detailed performance evaluation of the presented strategy is elaborated by conducting several experiments. We have also given the mathematical illustration of the utilized evaluation parameters. We have executed the experiments in Python programming language by employing an Nvidia GTX1070 GPU-based system. A visual depiction of the model train curve and loss graph is reported in
Figure 6 which is clearly showing that the presented framework has attained the minimum loss of 0.0021 with an accuracy value of 98.06% with an epoch value of 15 that is exhibiting an improved learning behavior of our approach.
4.1. Evaluation Parameters
To check the model performance in performing the sentiment analysis of the people about coronavirus vaccination using the Twitter data, we have chosen several metrics like accuracy, precision, recall, F1-Score, and AUC. The major reason to select the mentioned performance parameters is that these are considered standard performance analysis measures and are heavily explored by researchers in analyzing human sentiments. The visual demonstration of the precision and recall metrics are given in
Figure 7 and
Figure 8, respectively. While the mathematical elaboration of the F1-score and accuracy is given in Equations (23) and (24), respectively.
4.2. Assessment of the Proposed Approach
In this section, we have discussed the attained results of our approach to check the sentiment analysis results of the proposed work for evaluating the emotions of people about the COVID-19 vaccination. For the said purpose, we have taken the test tweets set and checked the trained model performance on it with the employment of numerous standard measures like F1-Score, accuracy, precision, recall, AUC, etc.
First, we measured the sentiment analysis performance of the presented solution by calculating the precision and recall metrics. The obtained results are given in
Figure 9 via showing the box plots as these maps effectively elaborate the model performance by reporting the highest, lowest, and average scores. The results given in
Figure 9 are evidently showing that our work has effectively measured human sentiments regarding the COVID-19 vaccine. More clearly, we have acquired the precision and recall scores of 97.63% and 97.28%.
Next, the F1-Score, error rate, and accuracy results are calculated for our approach, and the obtained score is shown in
Figure 10. The results in
Figure 10 are noticeably describing that our technique is quite proficient to analyze the behavior of people regarding coronavirus vaccines by using Twitter data. We obtain the F1-Score along with the smallest error value of 97.50% and 2.50%, respectively which are explaining the better learning behavior of our framework. Moreover, our work attains an accuracy score of 94.81%.
Moreover, the AUC–ROC curve is reported for the proposed approach in
Figure 11 as this measure helps to comprehend the recognition power of a technique by showing the results in the forms of true and false positive rates. For the presented work, this curve is showing that how much the model is capable of classifying the tweets related to the coronavirus vaccine into various categories based on their sentiment analysis. In the AUC–ROC plot, the ROC part exhibits the probability while the AUC shows the estimation of separability. The values in the curve proceeding towards 1 signify that a model is robust to perform the prediction task and it is fairly visible from the values in
Figure 11 that the presented strategy shows a higher recall rate and effectively classifies the tweets into related classes. More clearly, we have attained the AUC value of 92.59% which is depicting the better recognition power of our classifier.
Furthermore, we have drawn the confusion matrix to determine the in-depth analysis of the tweets classification results of our work (
Figure 12). Only reporting the accuracy results of a model can be unclear, especially for databases with class imbalance issues. A sentiment analysis network can report 90% of accuracy results, however, such an approach is not worth the majority of tweets belonging to a single class. So, there is a need for a better elaboration of the class-wise results of a model, for this reason, we experimented by reporting the confusion matrix. The confusion matrix plot is efficient for asses the class-wise behavior of a model and we have shown the attained results in
Figure 12. The proposed framework for the sentiment analysis of COVID-19-related vaccine data has acquired the TPR scores of 97.59%, 97.52%, and 97.03% for the positive, negative, and neutral classes, respectively which is showing the recognition ability of our work. The values in
Figure 12 are showing that we acquire the lowest error score of 1.14% among the positive and negative tweets classes which shows that the model is proficient in differentiating the positive tweets from the negative tweets related to the COVID-19 vaccines. However, we have witnessed that the model acquires a little high error rate for the neutral class with the positive and negative classes with the values of 1.50%, and 1.47%, respectively which signaled that the model associates the neutral tweets data with positive and negative tweets to some extent. This can be due to the fact that neutral content contains some words which can be mixed with positive or negative tweets. Based on the performed examination, it can be said that the proposed approach is effective for the multi-class problem and can correctly classify the tweets posted by people on the Twitter platform in respective classes to show their sentiments.
4.3. Comparative Analysis with ML
In this part, we experimented to compare the outcomes of our approach with the traditional ML predictors. To accomplish this, the well-known ML techniques called the SVM, KNN, and NB predictors are selected. For the comparison of the result, we have chosen various standard evaluation parameters called recall, accuracy, AUC, precision, and F1-measure, and attained performance evaluation is given in
Table 2. The comparison in
Table 2 is evidently describing that our work is more proficient than the ML-based classifiers in classifying the coronavirus vaccination-related tweets data. Descriptively, the introduced strategy acquires the precision, recall, F1-Score, accuracy, and AUC values of 97.63%, 97.38%, 97.50%, 94.81%, and 92.59%, respectively which is higher than all other classifiers. Descriptively, for the precision measure, the competitor approaches have obtained an average value of 83.94%, while our model shows a value of 97.63%. So, for the precision evaluation parameter, we have attained an average performance gain of 13.69%. Next, in the perspective of recall, the comparison classifiers have shown an average score of 72.03% which is 97.38% for the presented framework; hence, we have presented a performance gain of 25.35%. Moreover, in terms of F1-Score, the selected ML classifiers have represented a value of 77.52%, whereas the proposed approach has shown a value of 97.50%. So, from the perspective of the F1 measure, a performance gain of 19.98% is reported by the proposed solution. While in terms of accuracy, the peer models have reported an average value of 85.58%, which is 94.81% for our work, and exhibited a performance gain of 9.23%. Lastly, for the AUC parameter, the nominative techniques have shown an average score of 70.62% which is 92.59% for our method. Therefore, for the AUC parameter, we have shown a performance gain of 21.97% which is indicating the efficacy of our work. The main reason for the effective prediction results of our work is because of the better feature computation ability of the FastText word embeddings approach. Moreover, the employment of the RMDL classifier assists the proposed approach to gain better classification results by using multi-deep learning-based classifiers in parallel which enhances the learning capability of our work. Hence, we can say that our suggested strategy is more proficient to classify the COVID-19 vaccine-related Twitter data as compared to the conventional ML predictors.
4.4. Performance Analysis with the Latest Techniques
In this part of the paper, we have assessed the performance of our approach with the latest methods to compare our results with them. The conducted analysis with the utilization of several standard performance measures is elaborated in
Table 3. In [
43], a study was conducted that employed two deep learning-based approaches namely the bidirectional encoder representations from transformers (BERT), and Bi-LSTM were presented to classify the coronavirus-related tweets by performing sentiment analysis of the Twitter data. The approach in [
43] showed accuracy values of 92.50% and 88.40% for the BERT and Bi-LSTM models, respectively. While the approach discussed in [
24] employed the RNN-based method for accomplishing the sentiment investigation of user posts posted on Twitter to evaluate their emotions towards the COVID-19 vaccine. The work in [
24] attained the average value of 90.83%, while in comparison our work has acquired an accuracy score of 94.81% which is higher than both methods. More clearly, in the perspective of precision parameters, the comparative methods have shown an average value of 75.68% while our model attains 97.63%. Therefore, for the precision metric, we have gained a performance gain of 21.95%. Similarly, in the scenario of recall and F1-Score, the competitor approaches have gained average scores of 83.34%, and 78.73%, while our approach has shown average values of 97.38%, and 97.50%. So, we have reported performance gains of 14.04%, and 18.77% for the recall and F1-measure. Whereas for the accuracy and AUC measures, the peer methodologies have gained the average scores of 90.58%, and 89.35% which are 94.81%, and 92.59% for our work. Consequently, we have stated the performance gains of 4.23%, and 3.24% in the perspective of accuracy and AUC measures, respectively. The basic cause for the better sentiment analysis performance of the proposed work is because of the fact that the approaches discussed are facing network over-fitting issues. While in comparison, our model selects a more efficient feature by using the FastText approach which is capable of learning the underlying text patterns accurately by capturing the semantic information. Moreover, the usage of the RMDL classifier better learns the classification category of each tweet by using three deep learning classifiers in parallel and decides the associated class by better dealing with the over-fitted training data. Hence, we can say that our work is more reliable in comparison to the latest techniques in identifying the anti-COVID-19 vaccine tweets due to its higher recall ability. Our work can assist the health departments in better sharing awareness among people by diagnosing such areas where people shared offensive sentiments related to the vaccination procedure.
4.5. Discussion
The World Health Organization (WHO) declared the eruption of a new worldwide epidemiologic infection with substantial health fears on 30 January 2020, which was later given the name COVID-19 on 11 February 2020 [
44]. The new coronavirus spread at a fast speed and caused thousands of deaths around the globe. Such an epidemic has focused a huge consideration on the health departments and altered the idea of safety in all major aspects of human lives. Several safety measures including social distancing, using facial masks, cleaning hands, etc. are recommended; however, the most suggested remedy to completely eradicate COVID-19 is to vaccinate people around the globe. However, after the initiation of the coronavirus vaccination, people behave differently and express their feelings by posting data on social sites, especially on the Twitter platform. Until now, different variants of COVID-19 are emerging in different parts of the world which can cause huge damage in terms of human causalities. Therefore, understanding people’s emotions about COVID-19 vaccines is very essential to counter the anti-vaccination leagues and motivate people to put boosters for combatting this deadly disease.
In this work, we attempted to comprehend the emotions of the audience related to the COVID-19 vaccination process by using the tweets data. More clearly, we have introduced an approach named TSM-CV to perform the sentiment study of coronavirus vaccine-related information posted on the Twitter social site. Firstly, the samples are preprocessed on which the FastText method is applied for feature extraction. Then, the collected key points are labeled by using the VADER method, and a dimension reduction phase is followed by employing the NMF approach. Lastly, we have used the RMDL classifier joining three DL classification methods in parallel to categorize the tweets into three classes namely positive, negative, and neutral, respectively. We have executed huge experimentation on data collection containing both historic and real data to show the effectiveness of our approach. The presented work has attained an average accuracy result of 94.81% along with an AUC value of 92.59%.
Based on the experimentation and attained outcomes it can be concluded that our framework is effective to understand the people’s sentiments concerning the COVID-19 vaccination process and assist the health departments in diagnosing the areas with anti-vaccination sentiments. Such a framework can be used by the health organization to timely understand people’s emotions and to start an awareness campaign to motivate them for booster doses to combat the variants of this horrible virus.


