You are currently viewing a new version of our website. To view the old version click .
Electronics
  • Article
  • Open Access

6 August 2023

CAS-UNet: A Retinal Segmentation Method Based on Attention

,
,
,
and
1
School of Computer Science and Artificial Intelligence, Wuhan Textile University, Wuhan 430200, China
2
School of Information, Wuhan Vocational College of Software and Engineering, Wuhan 430205, China
3
School of Computer, Huanggang Normal University, Huanggang 430800, China
*
Author to whom correspondence should be addressed.
This article belongs to the Special Issue Application of Machine Learning in Graphics and Images

Abstract

Retinal vessel segmentation is an important task in medical image analysis that can aid doctors in diagnosing various eye diseases. However, due to the complexity and blurred boundaries of retinal vessel structures, existing methods face many challenges in practical applications. To overcome these challenges, this paper proposes a retina vessel segmentation algorithm based on an attention mechanism, called CAS-UNet. Firstly, the Cross-Fusion Channel Attention mechanism is introduced, and the Structured Convolutional Attention block is used to replace the original convolutional block of U-Net to achieve channel enhancement for retinal blood vessels. Secondly, an Additive Attention Gate is added to the skip-connection layer of the network to achieve spatial enhancement for retinal blood vessels. Finally, the SoftPool pooling method is used to reduce information loss. Experimental results using the CHASEDB1 and DRIVE datasets show that the proposed algorithm achieves an accuracy of 96.68% and 95.86%, and a sensitivity of 83.21% and 83.75%, respectively. The proposed CAS-UNet thus outperforms the existing U-Net-based classic algorithms.

1. Introduction

The retinal vasculature plays a crucial role in the body’s blood circulation. Its shape and distribution can reflect the health status of human organs and tissues. The observation of retinal vasculature can help doctors track and diagnose diseases of the fundus, such as diabetic retinopathy (DR) [1]. Therefore, being able to visually observe the distribution and detailed information of retinal vasculature is essential for doctors’ diagnoses. However, the structure of retinal vasculature is highly complex, with high curvature and diverse shapes, and the difference in vessel area and background is not obvious. In addition, fundus images are also easily affected by an uneven pipeline and noise. Due to these reasons, the retinal vessel segmentation task faces enormous challenges.
With the continuous development of computer technology, the intelligent segmentation of retinal vessels and assisted diagnosis and decision-making of ophthalmic diseases have become a research hotspot for scholars at home and abroad. Deep learning has gained great attention in the field of image processing due to its super high prediction accuracy in recognition applications. This paper proposes a CAS-UNet retinal vessel segmentation algorithm based on an attention mechanism (adding a cross-fusion attention module, an additive attention module, and a SoftPool module on the basis of U-Net), aiming to improve the segmentation ability of the model and strengthen the segmentation effect on detailed image areas.
The main contributions of the algorithm described in this paper are as follows:
  • A Structured Convolutional Attention module (DC-Conv) is used in the encoding and decoding stages of the network to enhance the channel features of retinal vessels.
  • An Additive Attention Gate (AG+) module is introduced at the skip connection of the network to enhance the spatial features of retinal vessels.
  • A SoftPool pooling method is added to reduce information loss during downsampling.
The experimental results show that, compared with other segmentation algorithms, the CAS-UNet model significantly improves the segmentation ability of small complex vessels and improves the segmentation effect on detailed areas. The proposed algorithm in this paper outperforms the existing classical algorithms in terms of comprehensive segmentation performance and training efficiency.
The structure of this paper is as follows: Firstly, the background and challenges of the retinal vessel segmentation are introduced, and traditional methods, machine learning algorithms, and deep learning algorithms are classified and reviewed. Based on a comprehensive analysis and comparison of existing algorithms, this paper proposes a CAS-UNet retinal vessel segmentation algorithm based on an attention mechanism. The Cross-Fusion Channel Attention module, the Additive Attention Gate module, and the SoftPool pooling module are respectively introduced. The experimental section of the article includes the dataset and preprocessing, experimental parameter settings, evaluation metrics, and analysis of the experimental results. Finally, the conclusion and future work are presented.

3. The Algorithm Principle

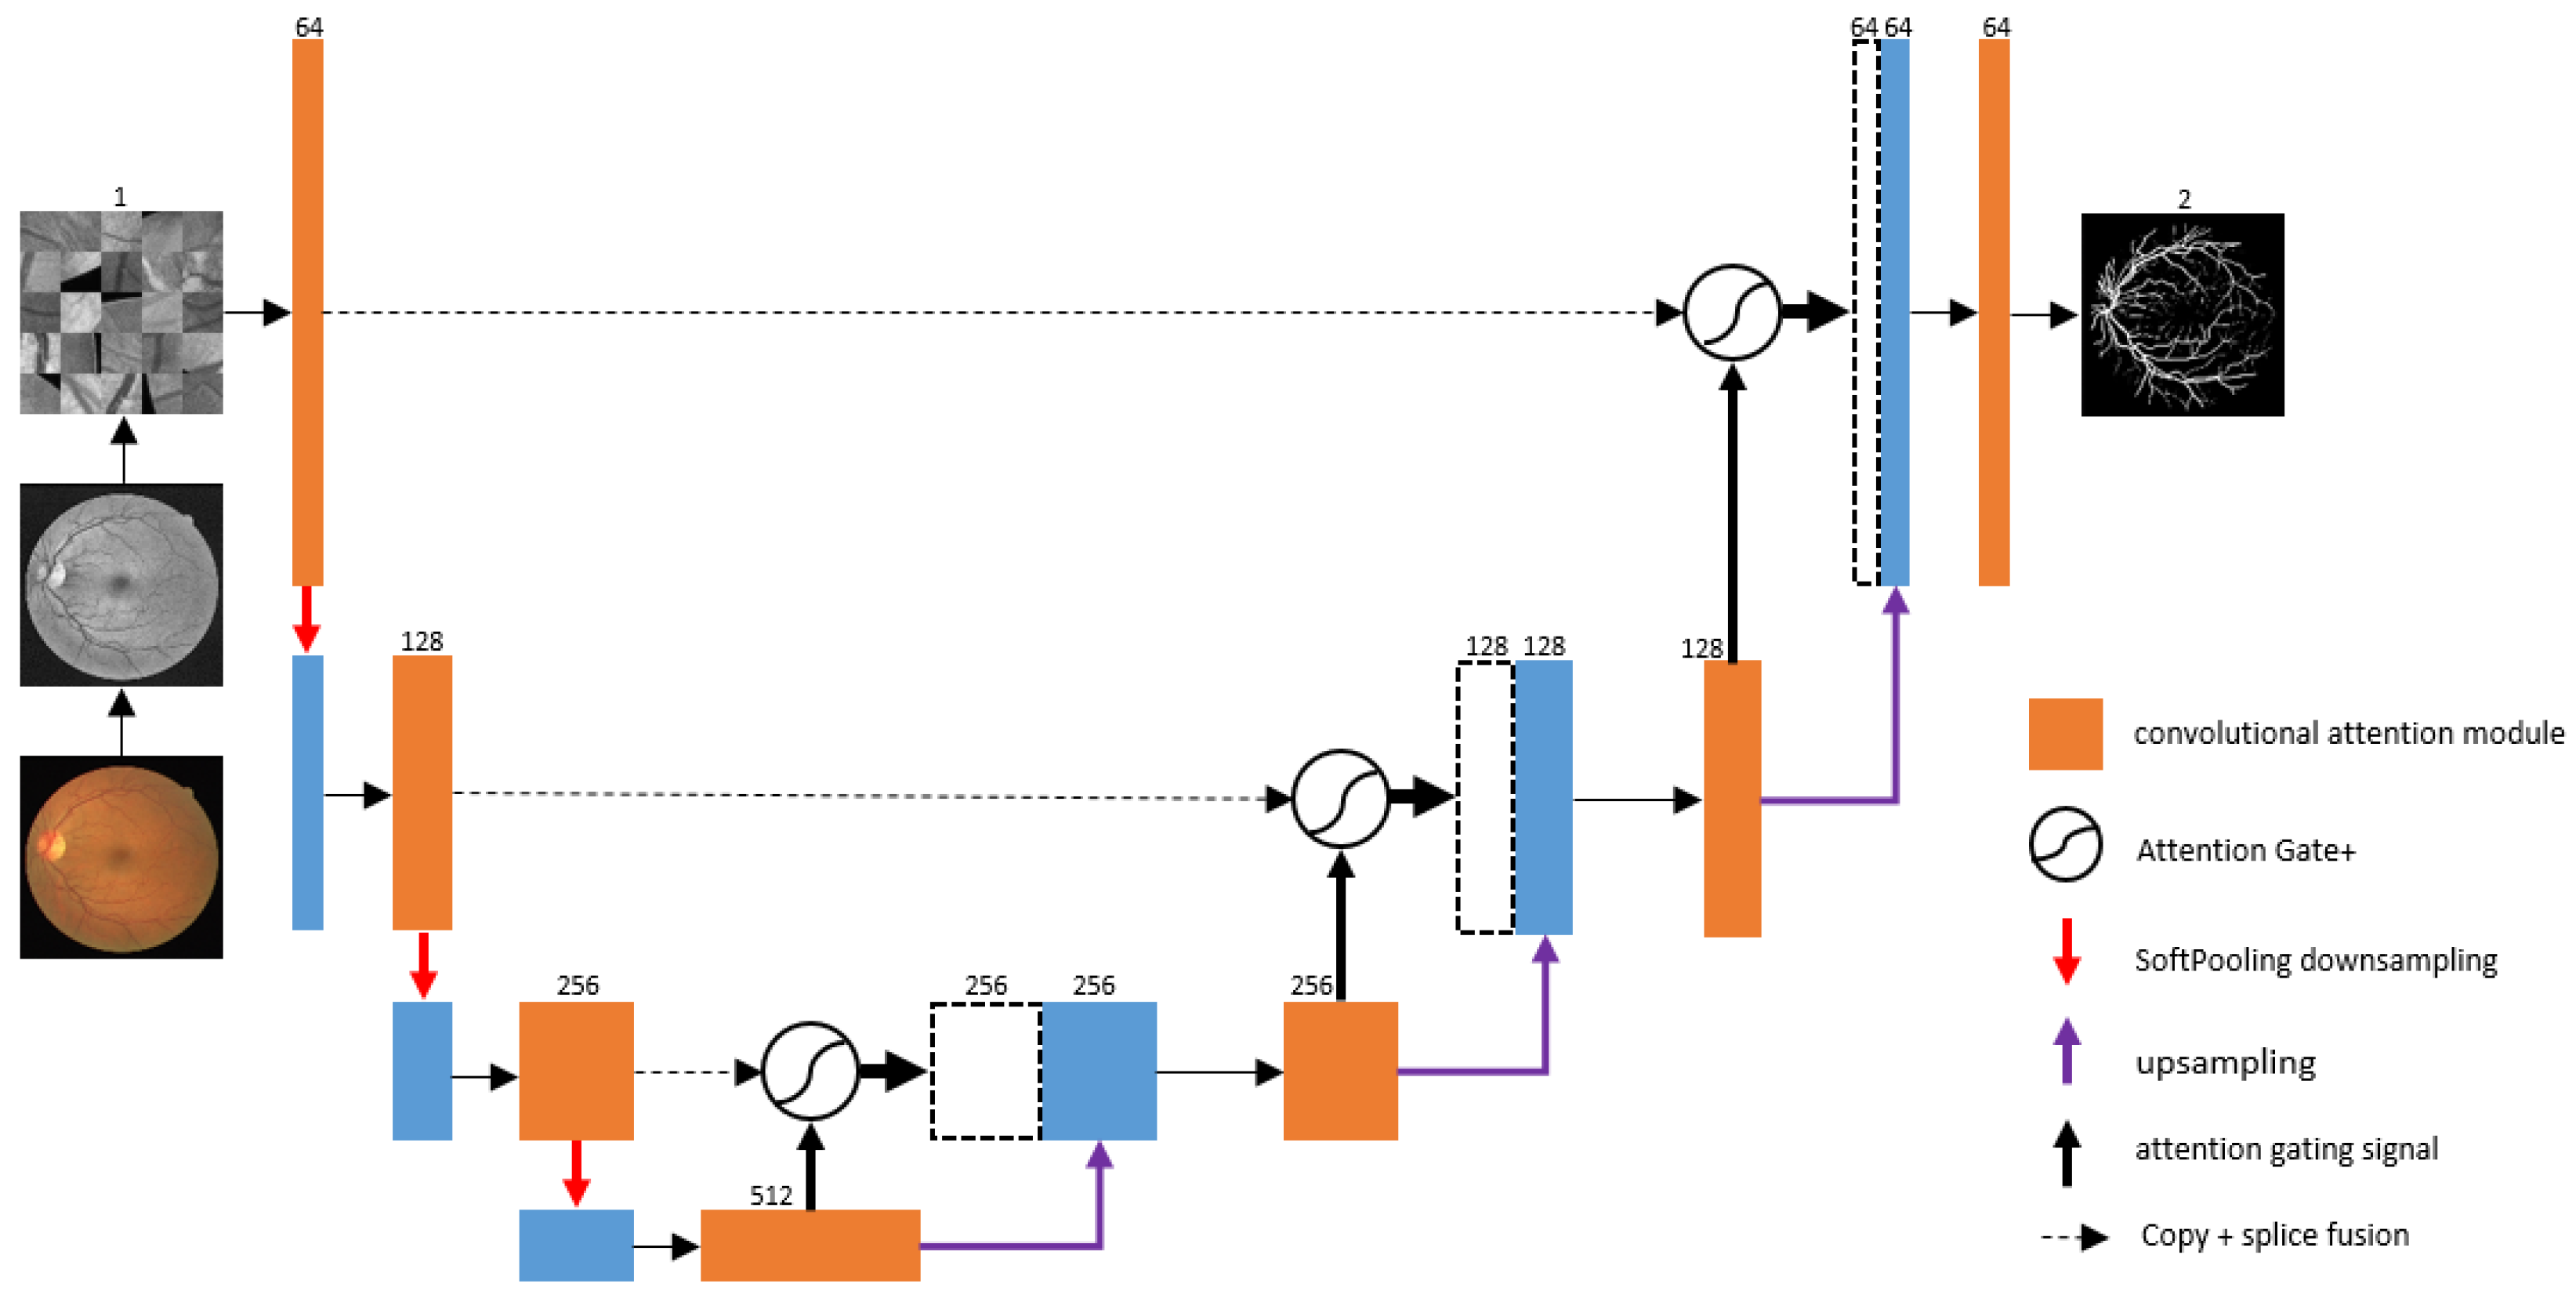
3.1. CAS-UNet Network Model

The proposed CAS-UNet network is built on the basis of U-Net. The network model of this algorithm is designed as a four-layer encoding and decoding structure, which mainly consists of three parts: the left encoding path, the right decoding path, and the middle skip-connection part. The CAS-UNet algorithm model is shown in Figure 1.
Figure 1. The CAS-UNet network model.
In this paper, we propose an encoder–decoder structured retinal image segmentation model. The specific implementation process is as follows: In the encoding stage, the retinal image is preprocessed and then input into the encoder of the network. The encoder includes three downsampling steps, each of which contains a Structured Convolution Attention module (DC-Conv) and a SoftPool pooling operation. After each convolutional block is a DropBlock, a Batch Normalization (BN) layer, and a ReLU activation function. The final module is the Cross-Fusion Channel Attention module. The number of feature channels doubles in each downsampling step, with feature channel numbers of 64, 128, 256, and 512. In the decoding stage, the decoder is symmetric to the encoder and includes three upsampling steps, each of which contains a DC-Conv and a deconvolution layer. Since upsampling can cause a loss of vessel information, the feature maps after upsampling and the corresponding encoder feature maps with the same resolution are skip-connected. The features from the encoding layers have a higher resolution, while the features from the decoding layers contain more semantic information. An Additive Attention Gate plus module (AG+) is used to enhance the feature map, spatially enhancing the feature map to improve the model’s segmentation ability in detailed areas and improve segmentation accuracy. In the classification stage, a fully connected layer and a Softmax activation function are used to classify the vessels and background in the retinal image, and the segmentation result of the retinal image is output. The experimental results demonstrate that the proposed retinal image segmentation model performs well in retinal image segmentation tasks, effectively segmenting the vessels and the background in retinal images.

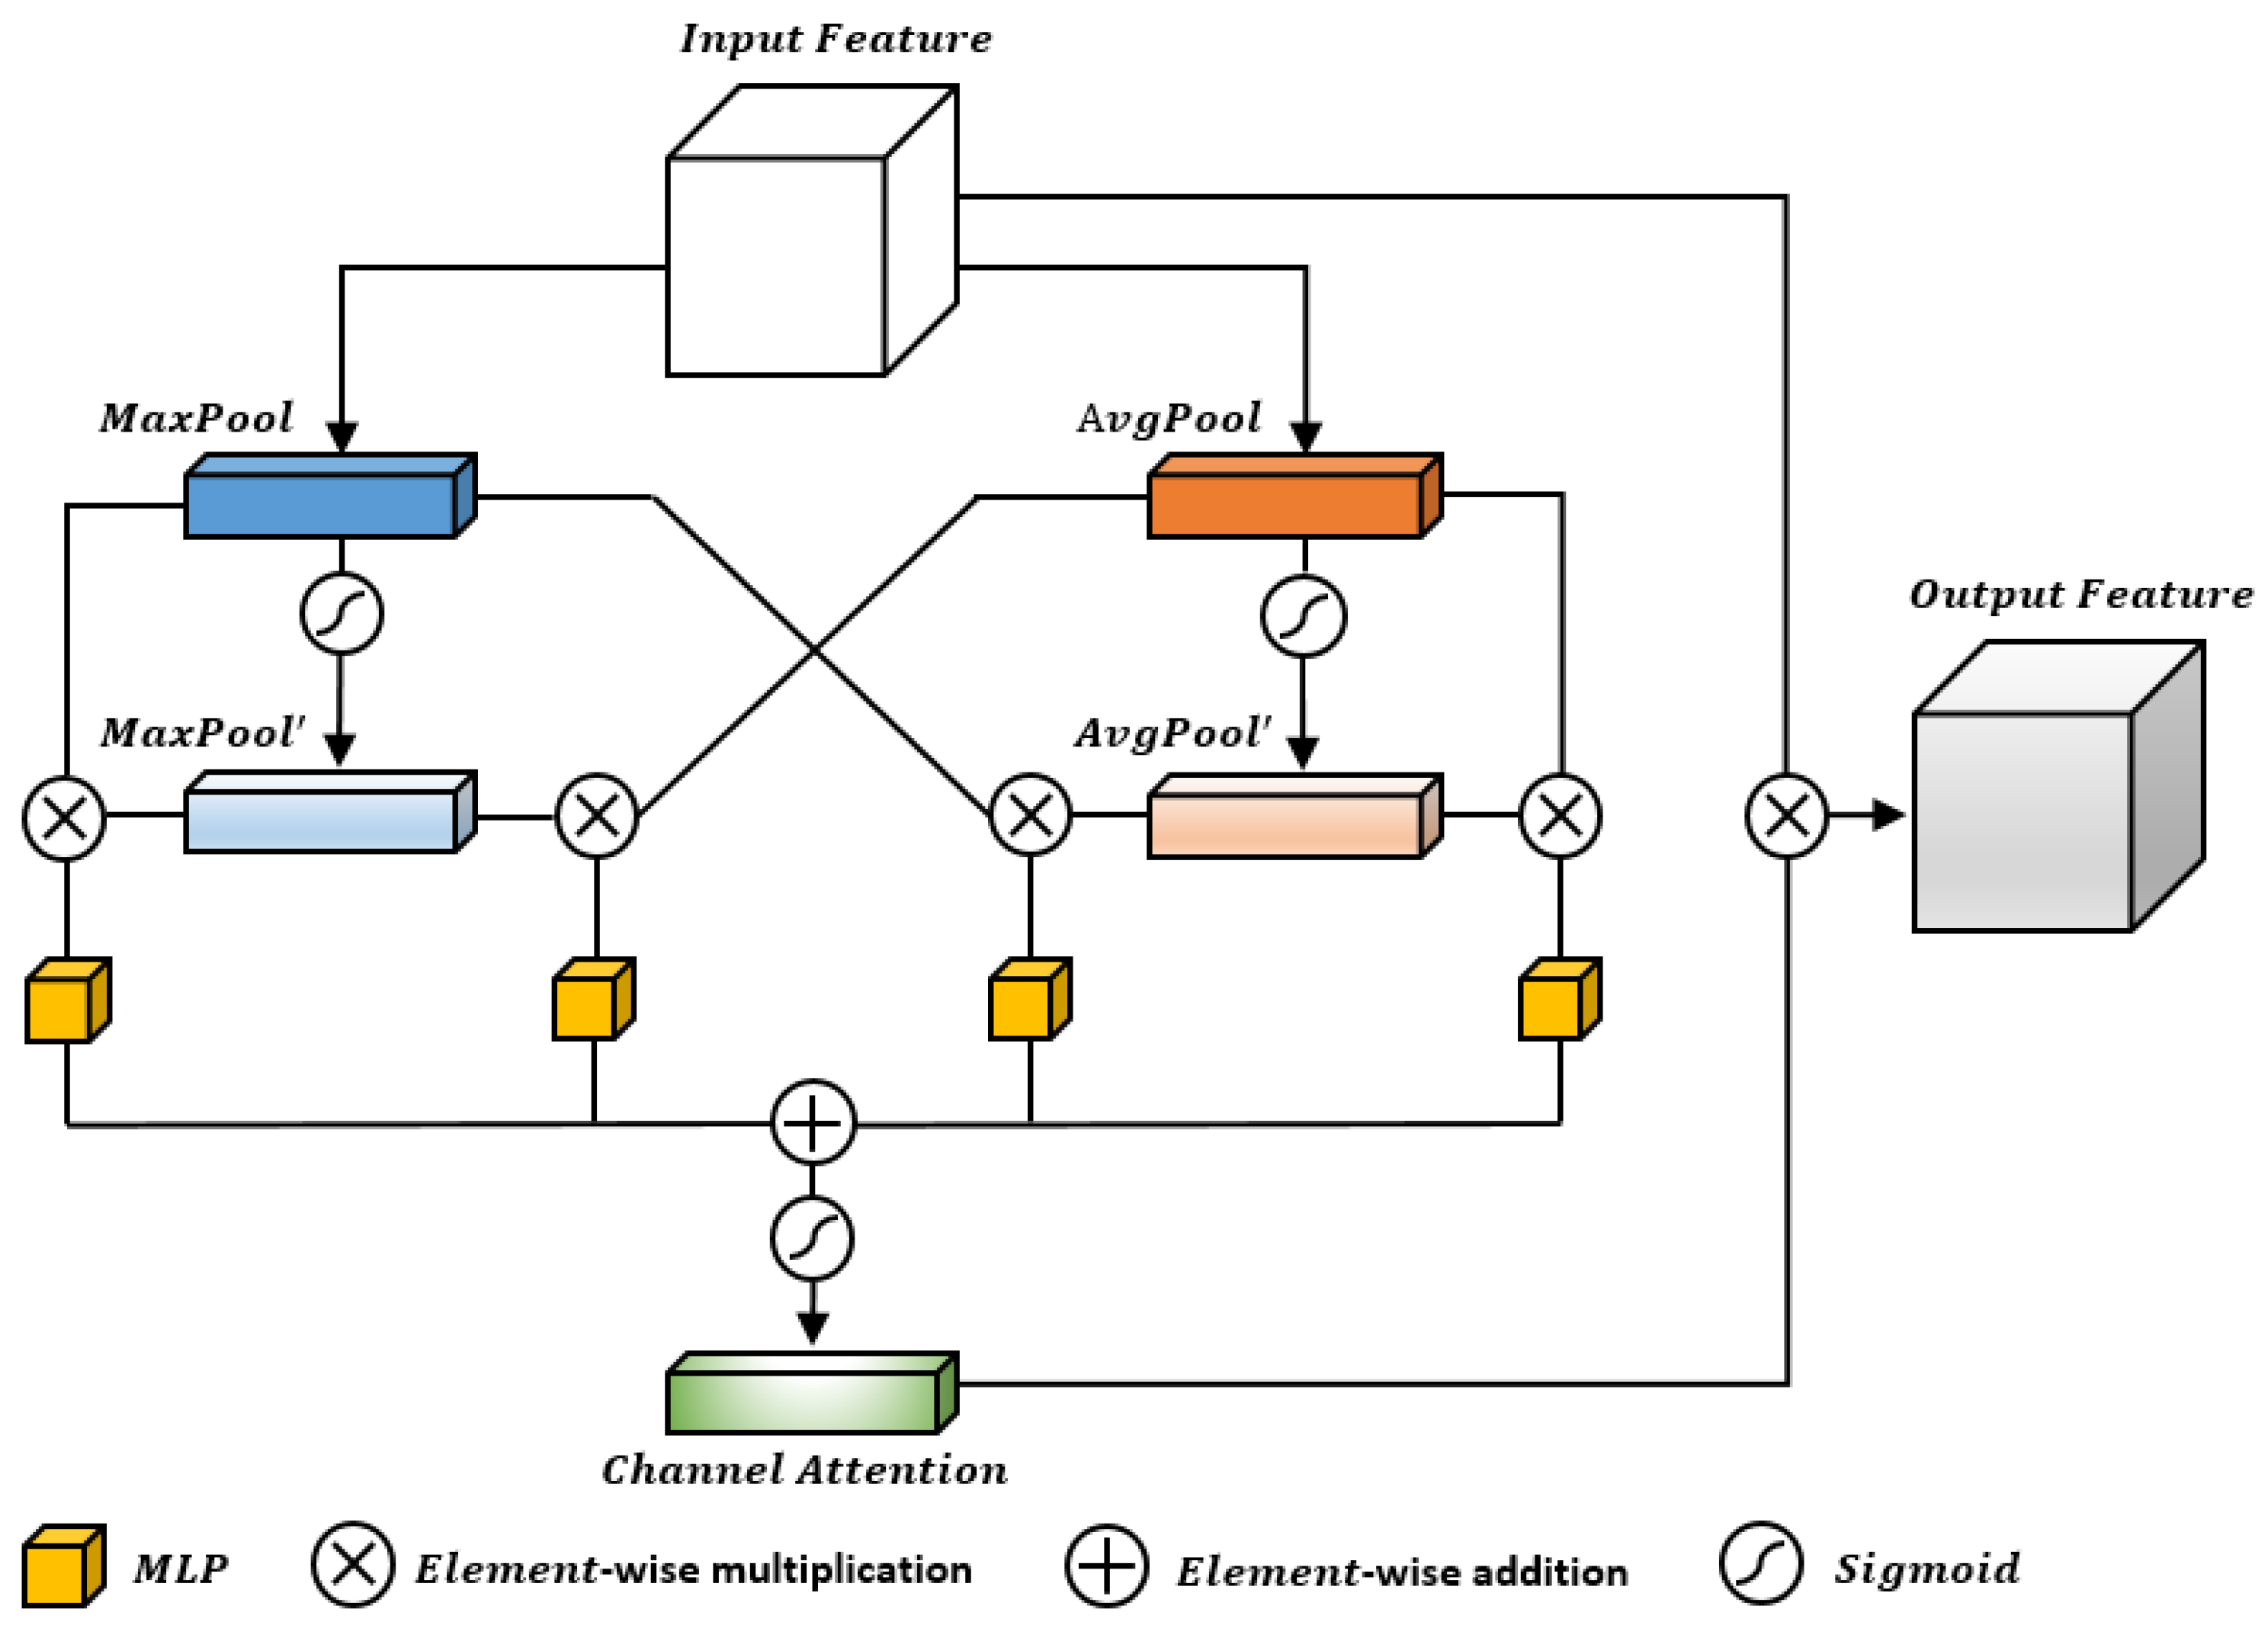
3.2. The Cross-Fusion Channel Attention Model
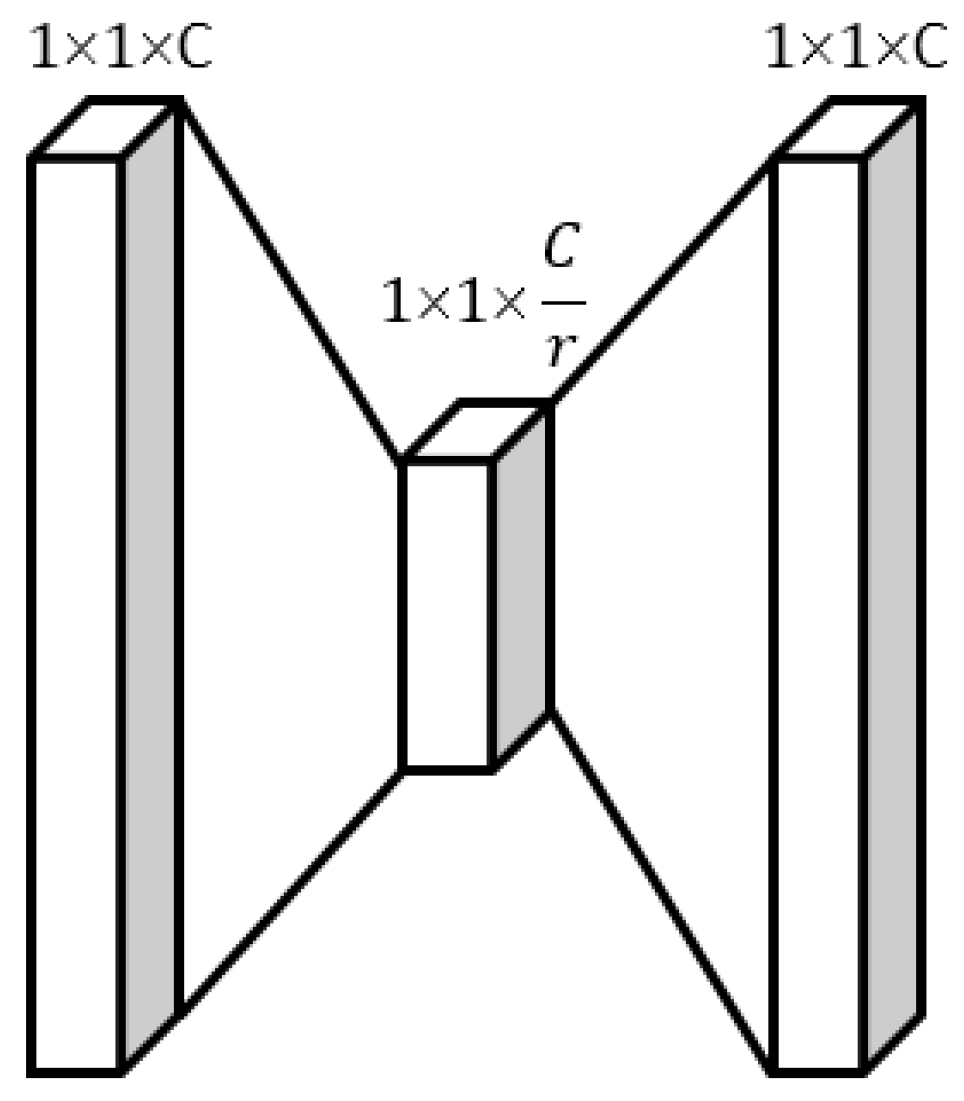
In the CAS-UNet network structure, the Cross-Fusion Channel Attention module plays a crucial role. In this module, the number of channels in the feature map is determined by the number of convolution kernels in the convolution operation. Past researchers believed that the importance of the information contained in each channel of the obtained multi-channel feature map was the same and did not distinguish the importance of the feature channels. However, in fact, the attention to the different areas of each image is also different. For example, in a retinal vessel image with two channels, if the segmentation target is a vessel, more attention should be paid to the vessel channel that needs to be segmented.
The channel attention mechanism can distinguish the importance of different feature channels in the feature map [21]. It usually compresses the feature map by global average pooling to establish the relationship between feature channels. However, in retinal image segmentation tasks, the retinal vessels vary in thickness, and there are many subtle vessels with low contrast. These details are important for segmentation tasks and cannot be ignored. Therefore, this paper proposes a new Cross-Fusion Channel Attention module, which considers the importance of both global and local features while having a certain degree of a local receptive field, as shown in Figure 2.
Figure 2. The Cross-Fusion Channel Attention module.
Specifically, the input feature map is first globally average-pooled and globally max-pooled to obtain two feature vectors. These two feature vectors represent the global average and global maximum values of the feature map, which are used to calculate the importance weight of each feature channel. The results of global average pooling and global max pooling are then fed into the feature cross layer (product layer) to fully cross the global and local features. The feature cross layer combines different feature vectors to obtain a new feature vector, where each element represents the cross-feature between different channels. The output of the MLP [22] is then subject to weighted summation with the feature map to obtain the final feature map. This step allows the attention coefficient values to incorporate both global features and local detail features. Finally, the feature map is recalibrated to obtain a new feature map. Recalibration is achieved by multiplying each element of the feature map by a learned scaling factor to further improve segmentation accuracy.
The execution process of the Cross-Fusion Channel Attention module can be generally divided into five steps: squeeze, cross, excitation, element-wise addition, and scale. The specific steps are as follows:
  • Step 1: Squeeze
First, we define the feature map F with C feature channels. We establish the dependencies between channels using global max pooling and global average pooling, respectively, to obtain two 1 × 1 × 1 × C tensors, denoted as F m a x and F a v g . Next, we use the Sigmoid activation function to establish the feature weight tensors for the channels obtained by global max pooling and global average pooling, denoted as A m a x and A a v g , respectively. We then apply the Sigmoid function to F m a x and A a v g to obtain two feature weight vectors, denoted as A m a x and A a v g , respectively.
A m a x = S i g m o i d F m a x
A a v g = S i g m o i d F a v g
Both of these feature weight vectors have C elements, representing the importance of different channels. Specifically, each element in A m a x and A a v g is a real number between 0 and 1, representing the importance weight of the corresponding channel.
  • Step 2: Cross
The four tensors obtained by global max pooling and global average pooling, namely F m a x , F a v g , A m a x , and A a v g , are fed into the feature cross layer (product layer) for four rounds of feature cross to fully fuse global and local features. In the feature cross layer, different feature vectors are combined to obtain a new feature vector, where each element represents the cross-feature between different channels. Through four rounds of feature cross, the global and local features are fully crossed to some extent, which enhances the network’s ability to perceive details and further improves segmentation accuracy.
The first feature cross operation involves multiplying F m a x and A m a x element-wise to fuse more detailed local features. This results in a 1 × 1 × C tensor denoted as A m a x .
A m a x = F m a x A m a x
The second feature cross operation involves multiplying F a v g and A a v g element-wise to fuse more comprehensive global features. This results in a 1 × 1 × C tensor denoted as A a v g .
A a v g = F a v g A a v g
The third feature cross operation involves multiplying F m a x and A a v g element-wise to fuse the global and local features, resulting in a 1 × 1 × C tensor denoted as A m a x .
A m a x = F m a x A a v g
The fourth feature cross operation involves multiplying F a v g and A m a x element-wise to also fuse the global and local features, resulting in a 1 × 1 × C tensor denoted as A a v g .
A a v g = F a v g A m a x
  • Step 3: Excitation
The four tensors obtained by the four rounds of feature cross, namely A m a x , A a v g , A m a x , and A a v g , are individually fed into the Multi-Layer Perceptron (MLP) module for feature learning, as shown in Figure 3.
Figure 3. The MLP module.
The first fully connected layer (FC layer) of the MLP module compresses the tensor with C channels into C/r channels to reduce the number of parameters and computation time required by the model. The second fully connected layer restores the feature map to C channels, making the model more nonlinear and better adapted to complex relationships. Details are as follows.
First, we concatenate the four tensors A m a x , A a v g , A m a x , and A a v g together to obtain a 1 × 1 × 1 × 4C tensor, denoted as x . We then compress x into a 1 × 1 × 1 × C/r tensor, denoted as y 1 , through the first FC layer for feature learning and dimension transformation:
y 1 = F C ( x )
Next, we compress y 1 into a 1 × 1 × 1 × C tensor, denoted as y 2 , through the second FC layer for feature learning and dimension transformation:
y 2 = F C ( y 1 )
Finally, we activate y 2 using the Sigmoid activation function to obtain the four attention coefficients, denoted as A 1 , A 2 , A 3 , and A 4 , respectively:
A 1 = S i g m o i d y 2 · A m a x
A 2 = S i g m o i d y 2 · A a v g
A 3 = S i g m o i d W 2 · A m a x
A 4 = S i g m o i d y 2 · A a v g
  • Step 4: Feature Weighted Summation
To consider the dependencies between global and local detail features simultaneously, we perform feature weighted summation on the four feature vectors A 1 , A 2 , A 3 , and A 4 , and apply Sigmoid activation to map the resulting channel feature weights Z to the interval [0, 1].
Z = S i g m o i d A 1 + A 2 + A 3 + A 4
  • Step 5: Re-calibration
After obtaining the new channel feature weights Z , we can re-calibrate the original feature map to obtain a new feature map. Specifically, we multiply each channel i in the original feature map F by its corresponding channel weight Z i to obtain a new channel feature map F i .
F i = Z i F i
We then concatenate all the new channel feature maps F 1 , F 2 , …, F C together to obtain the new feature map F . The new feature map F has the same spatial resolution as the original feature map F , but the feature responses of each channel are re-adjusted. Through the processing of feature weighting and re-calibration, we obtain a new feature map F that can be used for subsequent segmentation tasks.
Experimental results show that the fundus image segmentation model using the Cross-Fusion Channel Attention module performs well in segmentation tasks. Compared with the channel attention mechanism using global average pooling, the proposed Cross-Fusion Channel Attention module can better utilize both global and local features, improving segmentation accuracy.

3.3. The DC-Conv Module

The model proposed in this paper uses the DC-Conv module, as shown in Figure 4, to replace the double convolution structure of the traditional U-Net encoder–decoder.
Figure 4. The DC-Conv module.
The DC-Conv module consists of two sub-convolution blocks and Cross-Fusion Channel Attention. The structure of each sub-convolution block is shown in Figure 5, and each sub-convolution is composed of 3 × 3-Conv, DropBlock, BN, and ReLU in sequence.
Figure 5. Sub-convolution block.
Inspired by the recent use of DropBlock in computer vision models [23,24,25], we use DropBlock for regularization in our network, as shown in Figure 6.
Figure 6. Dropout (left) and DropBlock (right).
DropBlock is a structured form of Dropout that prevents overfitting of convolutional neural networks, especially for semantic segmentation problems. The main difference between DropBlock and Dropout is that DropBlock discards contiguous regions of the convolutional feature map of a layer, which is equivalent to discarding some semantic features, while Dropout discards randomly and relatively independent feature units. Models that use DropBlock are more adaptable to different semantic segmentation scenarios, have stronger robustness and sensitivity, and are better able to learn more complete vessel structures and branching characteristics of small vessels when dealing with situations such as insufficient brightness, poor clarity, and difficulty capturing small vessel branches that frequently occur in retinal vessel segmentation. The BN layer is used to maintain the stability of input and output data distribution and reduce the model’s dependence on initial input data. The Cross-Fusion Channel Attention module can balance global and local features, enhance the channels related to retinal vessels, and further improve segmentation accuracy.
In summary, the proposed model in this paper uses the DC-Conv module to replace the double convolution structure of the traditional U-Net encoder–decoder and incorporates DropBlock layers, batch normalization layers, and Cross-Fusion Channel Attention to improve retinal vessel image segmentation accuracy.

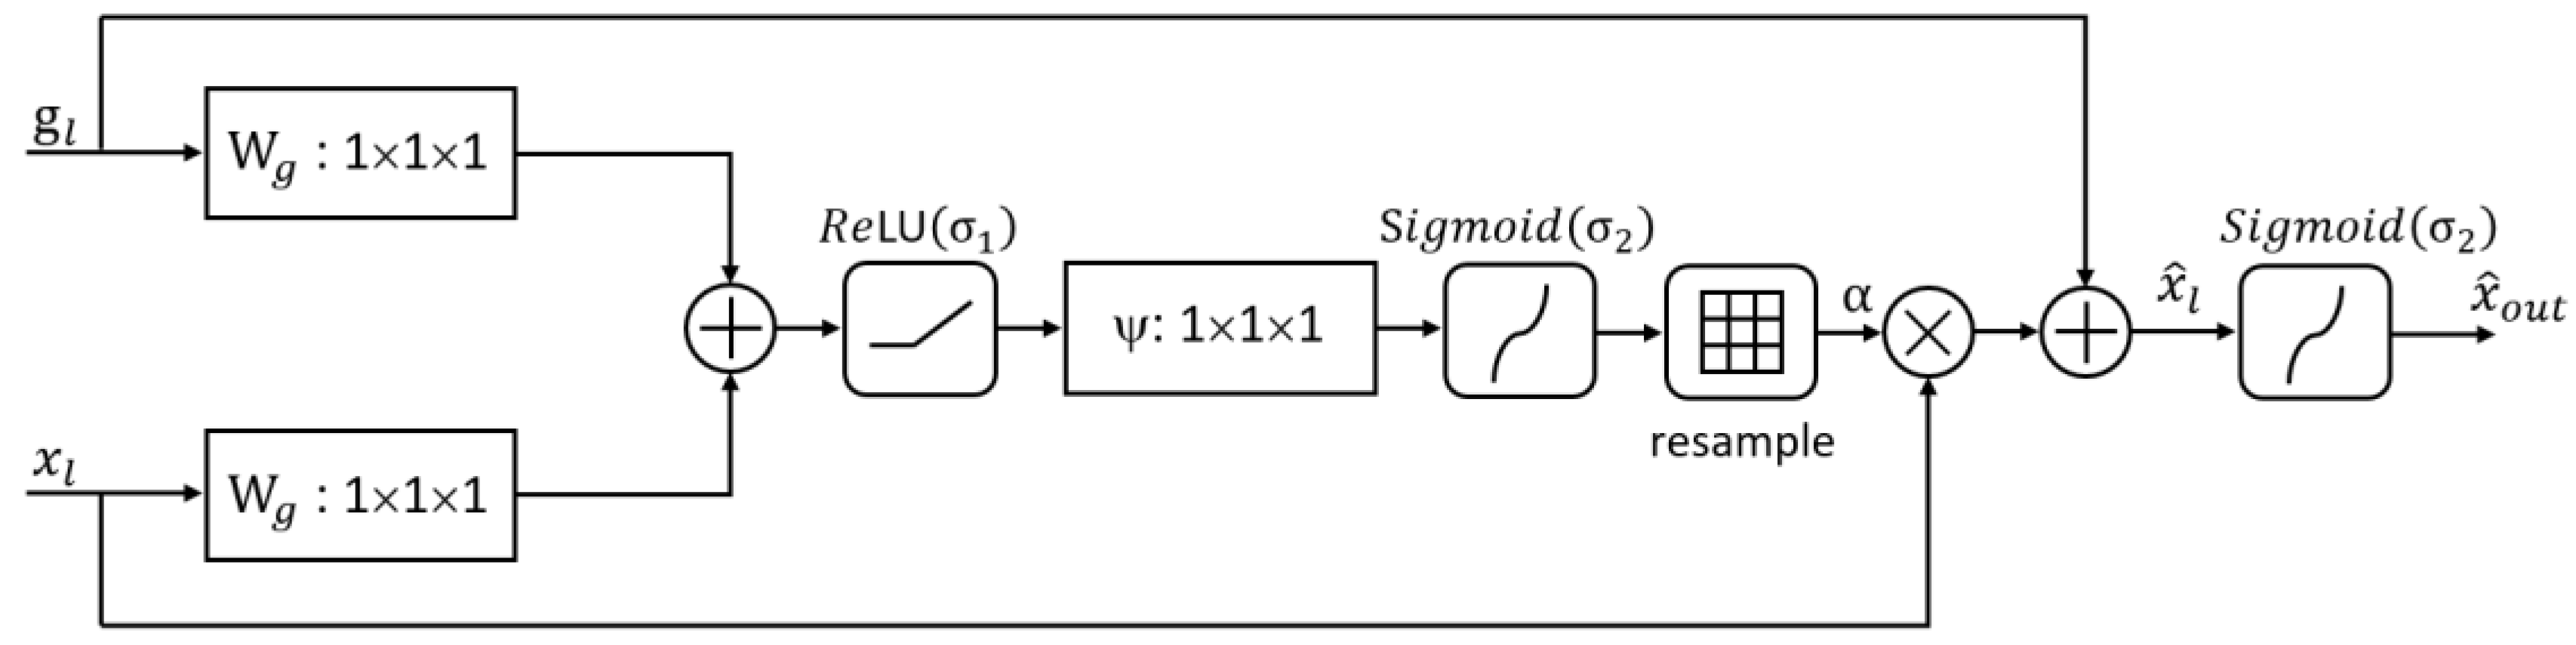
3.4. The Additive Attention Gate Module

In order to highlight the specific details of fine blood vessels, a spatial attention mechanism is introduced to enhance them. Inspired by Attention U-Net, we improve the original attention mechanism by introducing an attention gate that weights the upsampled features on the retina and the attention features in Attention U-Net. The resulting attention mechanism output is obtained through the ReLU function, and we name it the Additive Attention Gate (AG+) module. Its structure is shown in Figure 7.
Figure 7. The Additive Attention Gate.
This attention mechanism takes two feature maps as input: the first is the feature map g l obtained during the upsampling process, and the second is the feature map x l obtained from the skip connection. After both inputs undergo 1 × 1 × 1 convolution operations, resulting in feature maps of the same size and C channels, they are added together. Subsequently, the ReLU activation function is applied to obtain an intermediate feature map, which undergoes 1 × 1 × 1 convolution operations, a Sigmoid activation function, and resampling to obtain the attention coefficients α . The output feature map x ^ l is expressed as follows:
x ^ l = α · x l
In Equation (15), x l represents the input feature, and l represents the number of pixels for each feature. The attention coefficient α is expressed as follows:
α = σ 2 ψ σ 1 ω x x l + ω g g l + b g + b ψ
In Equation (16), ω x is the weight of the input feature x l , ω g is the weight of the input feature g l , ψ is the standard convolution function, b g is the bias value of g l , and b ψ is the bias value of ψ . The input features x l and g l provide contextual information to the attention mechanism, which can determine which input features are related to retinal vessels. α weights the low-level features to highlight the importance of retinal vessels.
In segmentation tasks, as there are multiple semantic categories, a method for learning multi-dimensional attention coefficients is introduced to better focus on the main situations during the segmentation process. Compared with the multiplication attention algorithm, the addition attention algorithm has better segmentation accuracy and performance. By comparing the performance of the multiplication attention algorithm and the addition attention algorithm, we can find that the addition attention algorithm has higher segmentation accuracy and better segmentation results. Therefore, we weight the features of g l and x ^ l , and then apply the Sigmoid function to obtain the final attention mechanism output x ^ o u t :
x ^ o u t = σ 2 x ^ l + g l
In the proposed Additive Attention Gate module in this paper, the input feature and the skip-connection feature provide contextual information that can determine which input features are related to retinal vessels. By weighting the input features, the importance of retinal vessels is highlighted, leading to further improvements in segmentation accuracy.

3.5. SoftPool Pooling

In this paper, SoftPool pooling [26] is chosen as the pooling method for feature extraction during the downsampling process. SoftPool is a fast and efficient pooling method that can retain more retinal vessel information in the downsampling activation map compared to the original MaxPool pooling in the U-Net network, thus improving segmentation accuracy.
Figure 8 shows the MaxPool pooling operation in the original U-Net, where the input feature map is denoted as α and the output feature map is denoted as α ˜ m a x . The mathematical formula for this operation is expressed as Equation (18):
α ˜ m a x = m a x i R α i
Figure 8. MaxPool pooling.
Figure 9 shows the SoftPool pooling operation used in this paper, which is mainly based on SoftMax weighted pooling. It defines a local region R of size C × H × W in the feature map α and calculates the weight ω i of region R nonlinearly based on the feature values. The output feature map α ˜ is obtained by weighting the feature values within the region R . The mathematical formulas for this operation are expressed as Equations (19) and (20):
ω i = e α i j R e α j
α ˜ = i R ω i · α i
Figure 9. SoftPool pooling.
SoftPool pooling is a probability-based pooling method that can generate a certain probability distribution by referencing the activation value distribution within the feature region. In practical implementation, SoftPool pooling replaces the MaxPool operation with a smoothing function whose shape can be adjusted according to a specific distribution. Through this method, SoftPool pooling can effectively preserve the subtle feature expressions of retinal vessels while maintaining computational and memory efficiency. Therefore, SoftPool pooling has become an important technique in retinal vessel image segmentation tasks.

4. Experiments

4.1. Datasets and Preprocessing

4.1.1. Datasets

Two publicly available datasets, CHASEDB1 and DRIVE, were used in our experiments.
The CHASEDB1 dataset consists of 28 retinal images in jpg format with a size of 999 × 960, taken of the eyes of 14 schoolchildren. Each image has manual segmentation labels from two experts, and the corresponding masks need to be set by code. Generally, the first 20 images were used for training, and the remaining 8 images were used for testing.
The DRIVE dataset was released in 2004, which includes 40 color fundus images in tif format with a size of 565 × 584. Each image contains a gold standard image manually labeled by two experts and a mask image of retinal vessels.
Information about these two retinal vessel image datasets is shown in Table 1.
Table 1. Examples of images from the retinal vessel image datasets.

4.1.2. Preprocessing

As retinal fundus images suffer from non-uniform illumination and low contrast between vessels and background, pre-processing of the input retinal fundus images is required before feeding into the network. The pre-processing methods are shown in Table 2 and include the following steps:
Table 2. Examples of original images and preprocessed images.
  • extract the green channel of the retinal vessel image and convert it to grayscale;
  • normalize the image;
  • apply Contrast Limited Adaptive Histogram Equalization (CLAHE);
  • apply Gamma correction.

4.1.3. Data Augmentation

The structure of a deep convolutional neural network is often very complex, and training a deep convolutional neural network for image segmentation usually requires a large number of labeled images. However, only a few dozen retinal vessel images have pixel-level labels, making it easy for the designed deep learning network model for retinal vessel segmentation to suffer from overfitting. In our experiments, we used random cropping to augment the data. For the DRIVE dataset, we directly used random cropping to augment the data. Each image in the training set was randomly cropped into 9000 48 × 48 local blocks, of which 7200 were used for training and 1800 were used for validation. The CHASEDB1 dataset has a total of 28 images, and we selected the first 20 images as the training set and the remaining 8 images as the test set. Each image in the CHASEDB1 dataset was randomly cropped into 15,000 48 × 48 local blocks, of which 13,500 were used for training and 1500 were used for validation. These image blocks were used together with the original images for model training and testing.
During training, we used 5-fold cross-validation to evaluate the performance of the model. Specifically, the training set was divided into 5 subsets, with each subset used as the validation set in turn, and the remaining subsets used as the training set to train the model. In each cross-validation iteration, we used a stochastic gradient descent optimization algorithm with a cross-entropy loss function. The learning rate was set to 0.01 and adjusted at the end of each epoch. We trained the model for 50 epochs and validated the model at the end of each epoch. In each epoch, we also performed data augmentation on the training data through random flipping, rotation, and scaling. An early stopping technique was used during training to prevent overfitting. Specifically, if the performance on the validation set did not improve for 10 consecutive epochs, we stopped the training. During testing, we input each image block in the test set into the trained model to obtain the corresponding segmentation mask image. We then stitched these segmentation mask images together to form the complete retinal image. Despite the relatively small size of our dataset, we augmented the training set to improve the model’s generalization ability. We also used cross-validation to evaluate the model’s performance and early stopping technique to prevent overfitting. Although performance bias is inevitable, we have made every effort to ensure the accuracy and reliability of the experiments.
Figure 10 shows the integrated image blocks and corresponding mask blocks.
Figure 10. Sub-image and corresponding mask sub-image.

4.2. Experimental Parameter Settings

The experiments were conducted on a Windows 10 operating system running on an Intel® Core™ i5 processor with 16 GB of memory and an NVidia GeForce RTX 3070 8.0 GB GPU. The Pytorch 1.6.0 deep learning framework was used to build the network models. During the model training process, the cross-entropy loss function was used as the model’s training loss function. The batch size was set to 32, and the model was trained for 50 epochs. The initial learning rate was set to 0.01, and the SGD stochastic gradient descent method was selected as the optimizer for updating the parameters.

4.3. Evaluation Metrics

The essence of a retinal vessel segmentation task is pixel-level classification, which determines whether a pixel belongs to the vessel class or the non-vessel class. Vessels are the target objects to be detected and segmented, called the positive class, while the remaining parts are called the negative class. By comparing the segmentation results with the ground truth, a confusion matrix can be obtained, which includes true positive T P , false positive F P , true negative T N , and false negative F N , as shown in Table 3. T P is the number of pixels that are correctly classified as belonging to the vessel class, F P is the number of pixels that are misclassified as belonging to the vessel class but actually belong to the non-vessel class, T N is the number of pixels that are correctly classified as belonging to the non-vessel class, and F N is the number of pixels that are misclassified as belonging to the non-vessel class but actually belong to the vessel class.
Table 3. Confusion matrix.
To evaluate the performance of the retinal vessel segmentation algorithm, four metrics, namely accuracy A c c , sensitivity S e n , specificity S p e , and F 1 -value ( F 1 s c o r e is an alias of the Dice index, i.e., the Sørensen–Dice coefficient), were selected as evaluation indicators. A c c represents the probability of correctly identifying vessel and background classes, S e n represents the probability of correctly identifying the vessel class, S p e represents the probability of correctly identifying the background class, and the F 1 score represents the overall performance of the algorithm in segmenting vessels. The formulas for each evaluation indicator are as follows:
A c c = T P + T N T P + T N + F P + F N
S e n = T P T P + F N
S p e = T N T N + F P
F 1 = 2 × T P 2 × T P + F P + F N

4.4. Analysis of Experimental Results

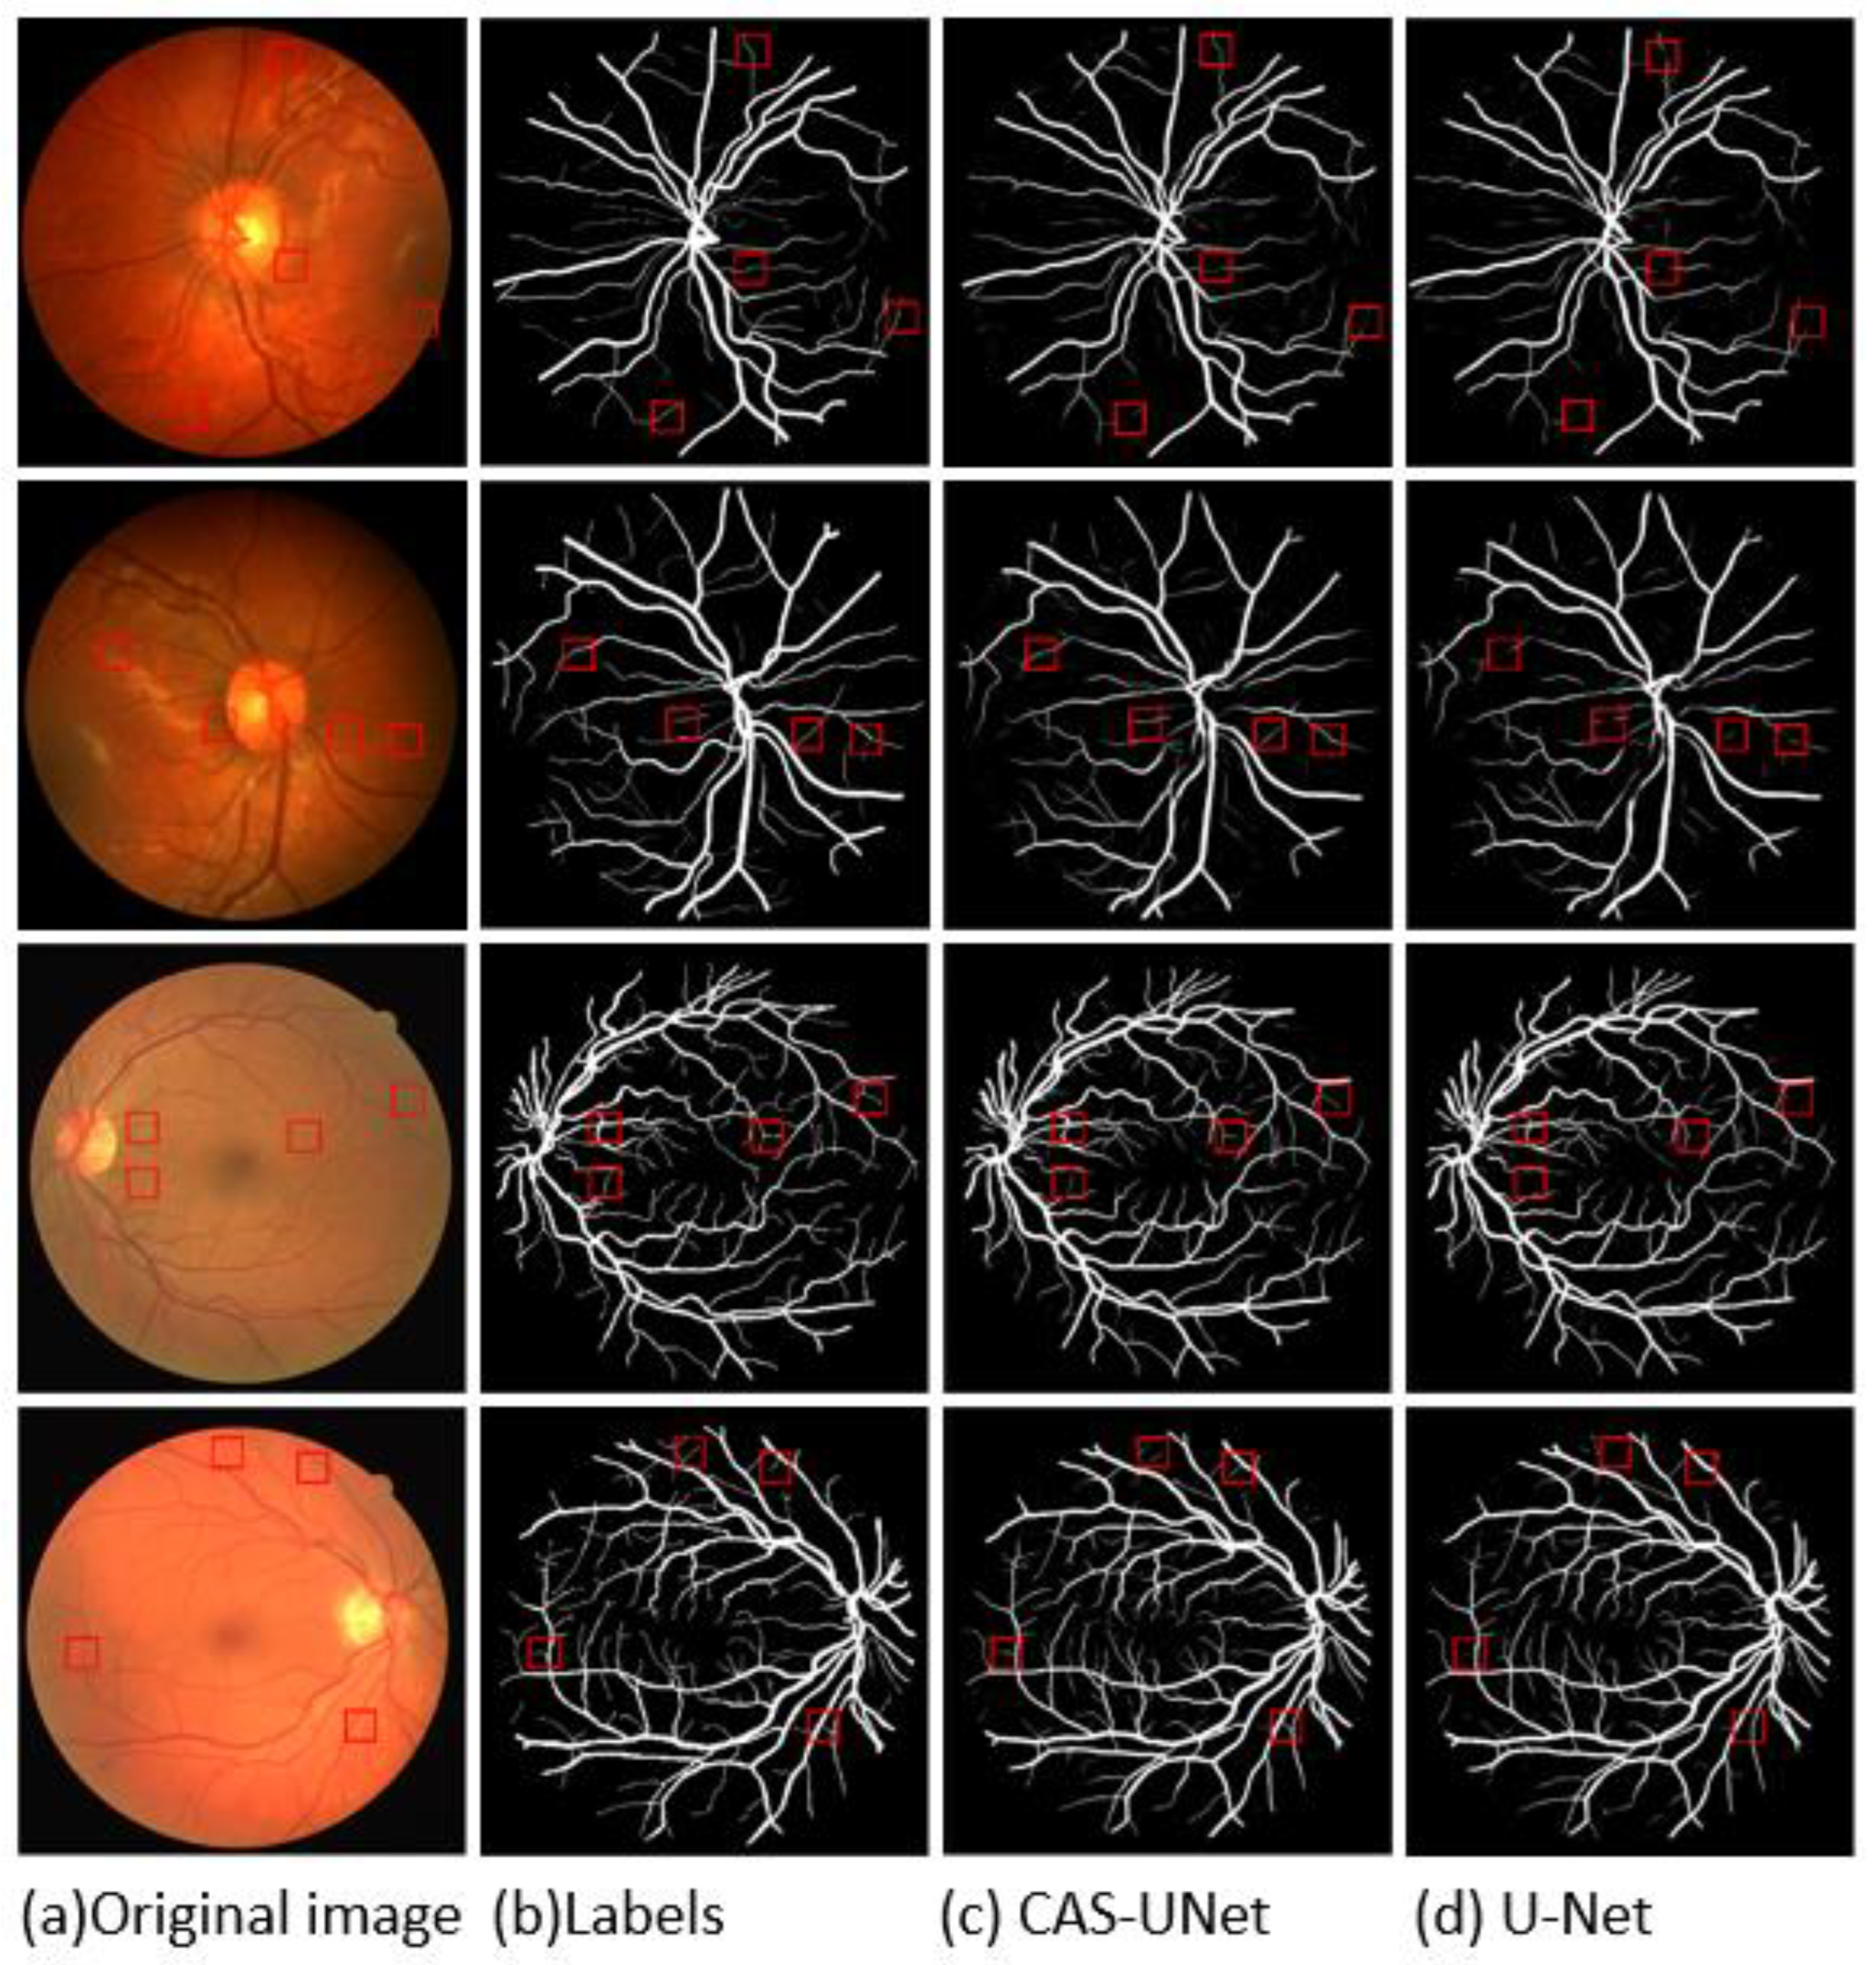
4.4.1. Comparison of the Overall Segmentation Results

To demonstrate the superiority of the proposed algorithm proposed in this paper, it was compared with other algorithms using the same datasets. All segmentation results were obtained under the same experimental environment, as shown in Figure 11, where Figure 11a is the original retinal image, Figure 11b is the segmentation ground truth, Figure 11c is the segmentation result of the algorithm proposed in this paper, and Figure 11d is the segmentation result of the U-Net network. The first and second rows show the retinal images and segmentation results of various networks for the CHASEDB1 dataset, while the third and fourth rows show the retinal images and segmentation results of various networks for the DRIVE dataset.
Figure 11. Segmentation results of retinal vascular images by different algorithms.
Figure 12 shows the enlarged details of the segmentation results of different algorithms on the CHASEDB1 and DRIVE datasets.
Figure 12. Detailed segmentation renderings of different algorithms.
Figure 11 and Figure 12 show that the U-Net algorithm produces vessel discontinuities at the crossing points and misses many fine vessel details. In contrast, the CAS-UNet algorithm can effectively segment the fine vessels that are missed by the U-Net algorithm and preserve more vessel details. Therefore, the results verify that the CAS-UNet can effectively solve the problem of insufficient feature extraction capability in the U-Net algorithm and ensure the integrity and continuity of vessel segmentation.

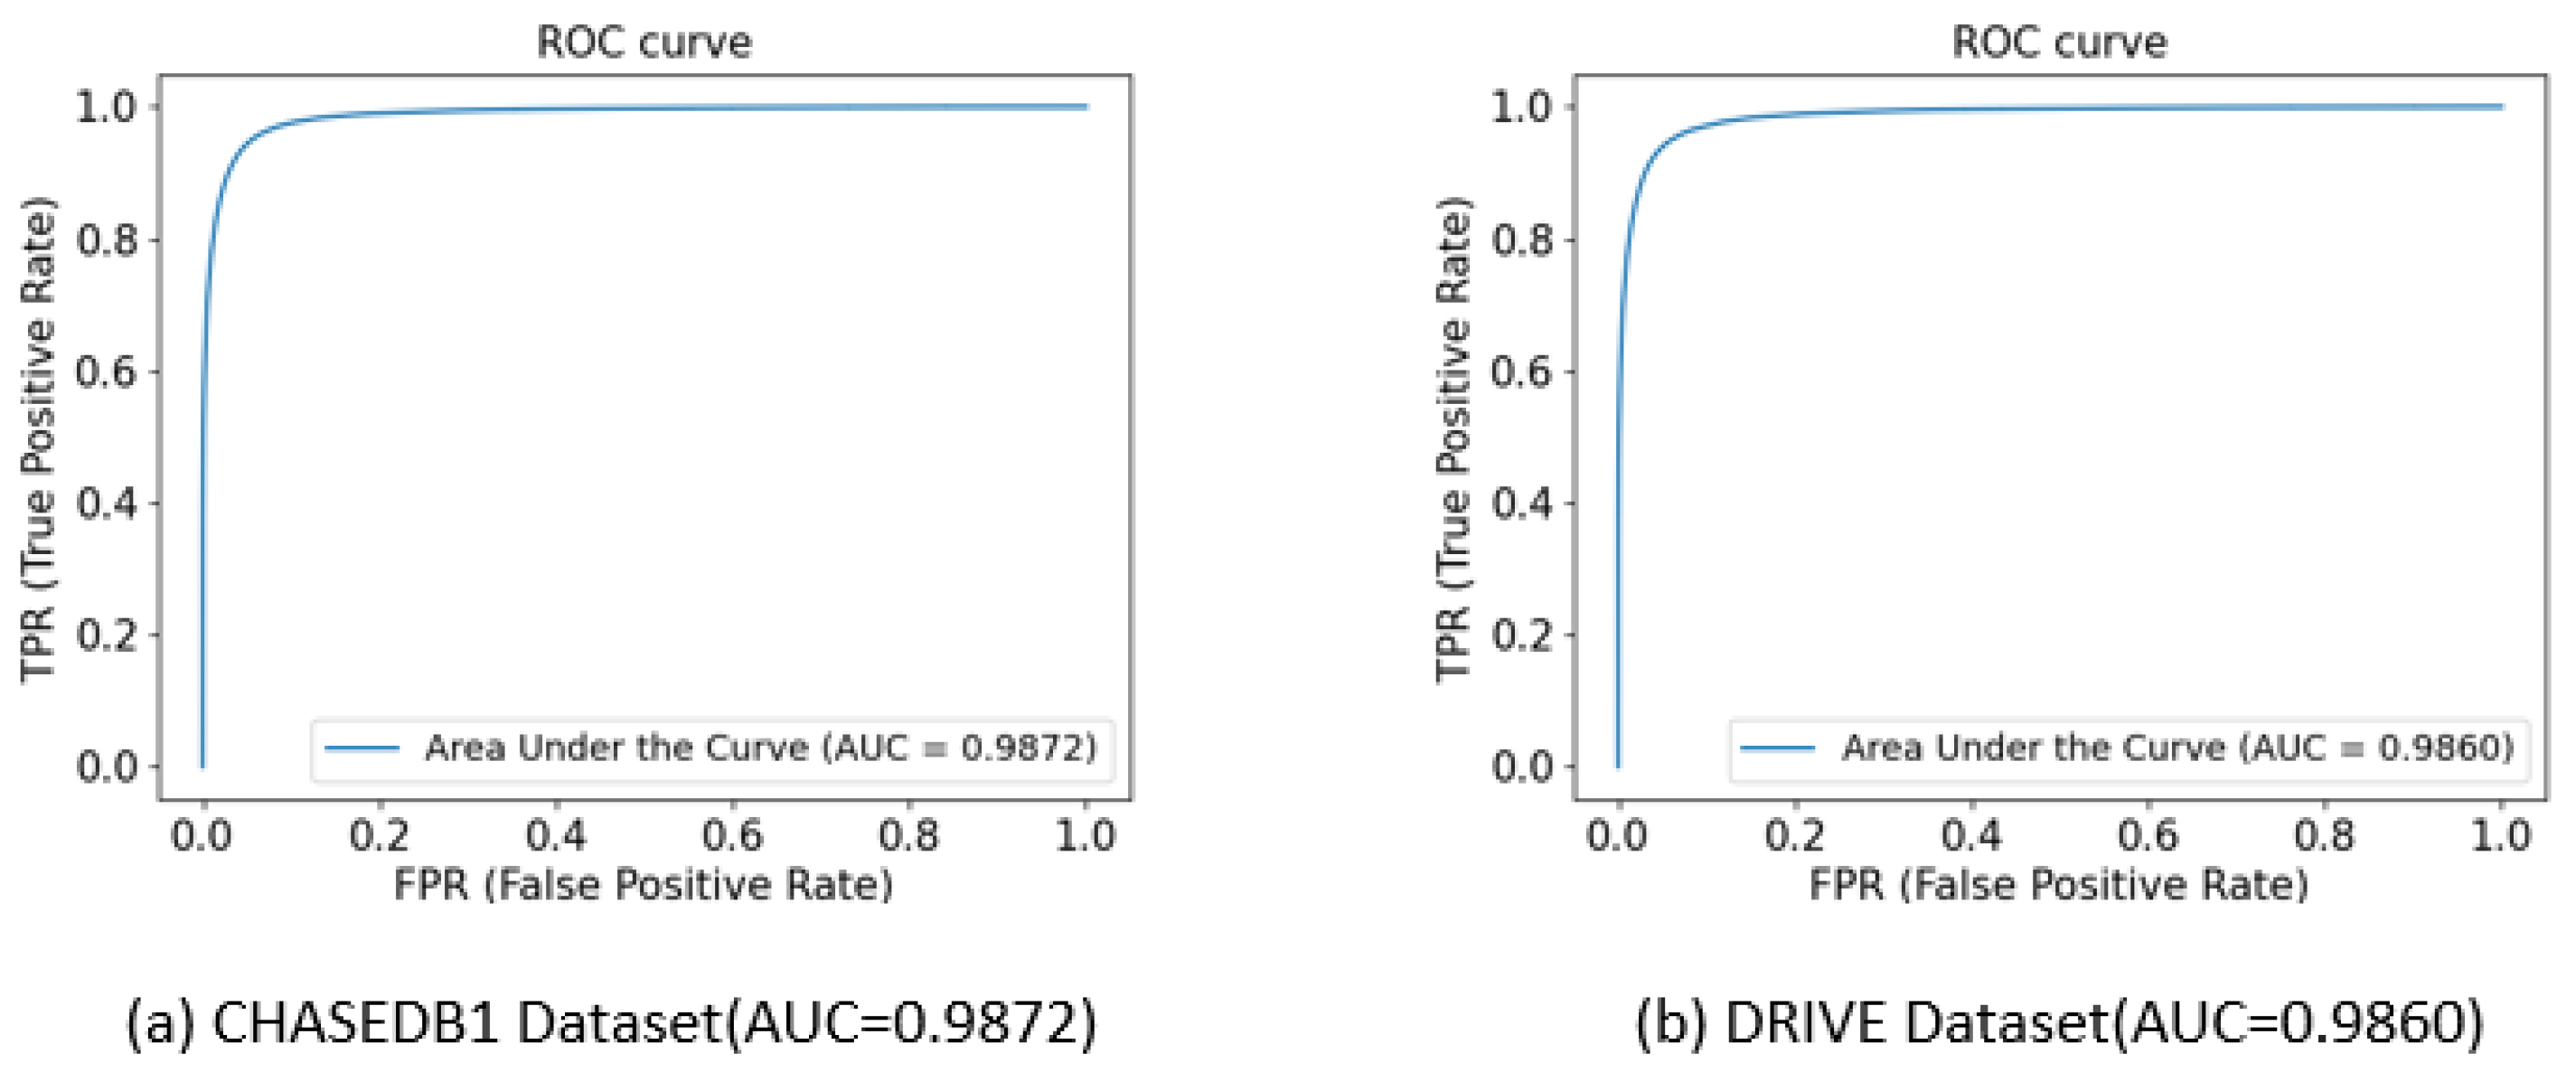
4.4.2. Objective Data Comparison

Figure 13 shows the ROC curves of the proposed algorithm on the CHASEDB1 and DRIVE datasets. The superiority of the segmentation results was evaluated by the area under the ROC curve (AUC). An AUC value of 0.9872 was achieved with the CHASEDB1 dataset and an AUC value of 0.9860 was achieved with the DRIVE dataset. This indicates that the proposed algorithm can achieve a low segmentation error rate in situations where the false positive rate is relatively high while maintaining a high true positive rate. These results fully demonstrate the excellent performance of the proposed algorithm in retinal vessel segmentation tasks.
Figure 13. ROC curves on different datasets.
Table 4 presents the objective evaluation results of U-Net, U-Net++, and our algorithm using the CHASEDB1 and DRIVE datasets. The optimal values for each metric are shown in bold. With the CHASEDB1 dataset, our algorithm achieved the best results on all evaluation metrics, outperforming both U-Net by 3.89% and 1.02% and U-Net++ by 2.20% and 0.76% in F 1 and A c c metrics, respectively. With the DRIVE dataset, our algorithm achieved the best results on all evaluation metrics, outperforming U-Net by 0.66% and 0.58% and U-Net++ by 0.51% and 0.50% in F 1 and A c c metrics, respectively. These results indicate that our algorithm has a high degree of similarity with expert manual segmentation results, stronger vessel recognition ability, and stronger robustness.
Table 4. Evaluation results of performance indicators on different datasets.

4.4.3. Comparison with Other Algorithms

To further validate the superiority and advancement of the proposed algorithm, this paper compared it with other algorithms in terms of accuracy ( A c c ), sensitivity ( S e n ), specificity ( S p e ), and F 1 -score with the CHASEDB1 and DRIVE datasets. The results are shown in Table 5 (the optimal values for each metric are highlighted in bold). With the CHASEDB1 dataset, the proposed algorithm achieved optimal values for all evaluation metrics except S e n . The method proposed in Reference [27], which is based on a residual mechanism and a scale-aware deformable attention M network, combined with an improved pulse-coupled neural network, has an attention mechanism that allows the network to focus more on the vessel region. Its S e n value is higher than that of the proposed algorithm, but it may result in segmentation errors in noisy areas, leading to a lower S p e value.
Table 5. Comparison results of objective data with other algorithms using CHASEDB1 and DRIVE.
With the DRIVE dataset, the proposed algorithm achieved optimal values for all evaluation metrics except S p e . The method proposed in Reference [31] utilized a small U-Net for generating corrected vessel segmentation maps after multiple iterations. Although its S p e value is higher than that of the proposed algorithm, if it failed to extract sufficient subtle vessel information in the early iterations, it may lose the features of subtle vessels in the later iteration process, resulting in a lower S e n value than the proposed algorithm.

4.4.4. Comparison of Ablation Experiments

The proposed algorithm in this paper is an improvement on the U-Net network model. The proposed model, i.e., the CAS-UNet, is based on the U-Net backbone and includes three additional modules: ① the DC-Conv module, ② the AG+ module, and ③ the SoftPool pooling module. Ablation experiments were conducted on each of the proposed modules to demonstrate their impact on U-Net. Table 6 shows the results of the ablation experiments on the CHASEDB1 dataset.
Table 6. Evaluation results of performance indicators on different datasets.
Table 6 shows that the proposed DC-Conv module, the AG+ module, and the SoftPool pooling module can all improve the segmentation performance of the original U-Net. In particular, adding the DC-Conv module to the network greatly improved the Sen value and accuracy, as the DC-Conv module can cross-fuse global and local features, effectively highlighting the vessel region, suppressing unnecessary background regions, and preserving more details as output, resulting in more accurate segmentation. This also demonstrates the superiority of the Cross-Fusion Channel Attention mechanism. The ablation experiments also combined the three modules in pairs, and the combined modules showed better performance in all evaluation metrics compared to the addition of a single module, indicating that all three proposed modules contribute to the segmentation performance of the network without redundancy. Overall, the proposed CAS-UNet significantly improves the comprehensive performance of the original U-Net network.

5. Conclusions and Future Work

In this paper, we proposed an attention-based retinal vessel segmentation algorithm to address the problems of small and complex retinal vessel structures and insufficient segmentation caused by lighting interference. Firstly, in the encoding and decoding stage, we proposed a Convolutional Attention block (DC-Conv) to replace the traditional consecutive convolution in U-Net, which cross-fuses global and local information, enabling the network to preserve more vessel details. An Additive Attention Gate (AG+) was then introduced in the skip-connection layer between the encoding and decoding stages to enhance the spatial features and highlight important regions while suppressing irrelevant areas. Finally, SoftPool pooling was used instead of the original MaxPool pooling in U-Net, which enhances the extraction of vessel details while increasing the receptive field. Experimental results have shown that, compared to other advanced algorithms, the proposed CAS-UNet algorithm has higher segmentation accuracy and superior performance. In future work, we will continue to optimize the developed algorithm, improve the segmentation performance through network improvement, expand the dataset for experiments, and apply the proposed algorithm model to practical medical image segmentation.

Author Contributions

Conceptualization: Z.Y.; methodology: Z.Y.; software: Z.Y.; validation: Z.Y., H.Y. and Z.X.; formal analysis: Z.Y.; investigation: Z.Y.; resources: Z.Y.; data curation: Z.Y.; writing—original draft preparation: Z.Y.; writing—review and editing: H.Y.; visualization: Z.Y. and Y.W.; supervision: H.Y. and T.P. All authors have read and agreed to the published version of the manuscript.

Funding

This work was supported by the National Social Science Fund of China General Program under Grant 21BTQ074 and the National Science Foundation of Hubei under Grant 2023AFB980 and Doctoral Fund project under Grant KYQDJF2023002.

Data Availability Statement

The DRIVE dataset used in the experiments can be publicly obtained from the Grand Challenge website at https://drive.grand-challenge.org/DRIVE (accessed on 20 April 2023). The CHASEDB1 dataset used in the experiments can be publicly obtained from the following website: https://blogs.kingston.ac.uk/retinal/chasedb1 (accessed on 20 April 2023).

Conflicts of Interest

The authors declare no conflict of interest.

References

  1. Saroj, S.K.; Kumar, R.; Singh, N.P. Frechet PDF based matched filter approach for retinal blood vessels segmentation. Comput. Methods Programs Biomed. 2020, 194, 105490. [Google Scholar] [CrossRef]
  2. Chaudhuri, S.; Chatterjee, S.; Katz, N.; Nelson, M.; Goldbaum, M. Detection of blood vessels in retinal images using two-dimensional matched filters. IEEE Trans. Med. Imaging 1989, 8, 263–269. [Google Scholar] [CrossRef]
  3. Yin, Y.; Adel, M.; Bourennane, S. Retinal vessel segmentation using a probabilistic tracking method. Pattern Recognit. 2012, 45, 1235–1244. [Google Scholar] [CrossRef]
  4. Zana, F.; Klein, J.C. Segmentation of vessel-like patterns using mathematical morphology and curvature evaluation. IEEE Trans. Image Process. 2001, 10, 1010–1019. [Google Scholar] [CrossRef]
  5. Kass, M.; Witkin, A.; Terzopoulos, D. Snakes: Active contour models. Int. J. Comput. Vis. 1988, 1, 321–331. [Google Scholar] [CrossRef]
  6. Ricci, E.; Perfetti, R. Retinal blood vessel segmentation using line operators and support vector classification. IEEE Trans. Med. Imaging 2007, 26, 1357–1365. [Google Scholar] [CrossRef]
  7. Marín, D.; Aquino, A.; Gegúndez-Arias, M.E.; Bravo, J.M. A new supervised method for blood vessel segmentation in retinal images by using gray-level and moment invariants-based features. IEEE Trans. Med. Imaging 2010, 30, 146–158. [Google Scholar] [CrossRef]
  8. Staal, J.; Abràmoff, M.D.; Niemeijer, M.; Viergever, M.A.; Van Ginneken, B. Ridge-based vessel segmentation in color images of the retina. IEEE Trans. Med. Imaging 2004, 23, 501–509. [Google Scholar] [CrossRef]
  9. Fraz, M.M.; Remagnino, P.; Hoppe, A.; Uyyanonvara, B.; Rudnicka, A.R.; Owen, C.G.; Barman, S.A. An ensemble classification-based approach applied to retinal blood vessel segmentation. IEEE Trans. Biomed. Eng. 2012, 59, 2538–2548. [Google Scholar] [CrossRef]
  10. Long, J.; Shelhamer, E.; Darrell, T. Fully convolutional networks for semantic segmentation. In Proceedings of the IEEE Conference on Computer Vision and Pattern Recognition, Boston, MA, USA, 7–12 June 2015; pp. 3431–3440. [Google Scholar]
  11. Ronneberger, O.; Fischer, P.; Brox, T. U-net: Convolutional networks for biomedical image segmentation. In Proceedings of the International Conference on Medical Image Computing and Computer-Assisted Intervention, Munich, Germany, 5–9 October 2015; Springer: Cham, Switzerland, 2015; pp. 234–241. [Google Scholar]
  12. Shankaranarayana, S.M.; Ram, K.; Mitra, K.; Sivaprakasam, M. Joint optic disc and cup segmentation using fully convolutional and adversarial networks. In Fetal, Infant and Ophthalmic Medical Image Analysis; Springer: Cham, Switzerland, 2017; pp. 168–176. [Google Scholar]
  13. Huang, G.; Liu, Z.; Van Der Maaten, L.; Weinberger, K.Q. Densely connected convolutional networks. In Proceedings of the IEEE Conference on Computer Vision and Pattern Recognition, Honolulu, HI, USA, 21–26 July 2017; pp. 4700–4708. [Google Scholar]
  14. Zhang, J.; Jin, Y.; Xu, J.; Xu, X.; Zhang, Y. Mdu-net: Multi-scale densely connected u-net for biomedical image segmentation. arXiv 2018, arXiv:1812.00352. [Google Scholar] [CrossRef]
  15. Oktay, O.; Schlemper, J.; Folgoc, L.L.; Lee, M.; Heinrich, M.; Misawa, K.; Mori, K.; McDonagh, S.; Hammerla, N.Y.; Kainz, B.; et al. Attention u-net: Learning where to look for the pancreas. arXiv 2018, arXiv:1804.03999. [Google Scholar]
  16. Gu, Z.; Cheng, J.; Fu, H.; Zhou, K.; Hao, H.; Zhao, Y.; Zhang, T.; Gao, S.; Liu, J. Ce-net: Context encoder network for 2d medical image segmentation. IEEE Trans. Med. Imaging 2019, 38, 2281–2292. [Google Scholar] [CrossRef]
  17. Zhou, Z.; Siddiquee, M.M.R.; Tajbakhsh, N.; Liang, J. Unet++: Redesigning skip connections to exploit multiscale features in image segmentation. IEEE Trans. Med. Imaging 2019, 39, 1856–1867. [Google Scholar] [CrossRef]
  18. Alom, M.Z.; Yakopcic, C.; Hasan, M.; Taha, T.M.; Asari, V.K. Recurrent residual U-Net for medical image segmentation. J. Med. Imaging 2019, 6, 014006. [Google Scholar] [CrossRef]
  19. He, K.; Zhang, X.; Ren, S.; Sun, J. Deep residual learning for image recognition. In Proceedings of the IEEE Conference on Computer Vision and Pattern Recognition, Las Vegas, NV, USA, 26 June–1 July 2016; pp. 770–778. [Google Scholar]
  20. Jafari, M.; Auer, D.; Francis, S.; Garibaldi, J.; Chen, X. DRU-Net: An efficient deep convolutional neural network for medical image segmentation. In Proceedings of the 2020 IEEE 17th International Symposium on Biomedical Imaging (ISBI), Iowa City, IA, USA, 3–7 April 2020; pp. 1144–1148. [Google Scholar]
  21. Ma, J.; Zhang, H.; Yi, P.; Wang, Z. SCSCN: A separated channel-spatial convolution net with attention for single-view reconstruction. IEEE Trans. Ind. Electron. 2019, 67, 8649–8658. [Google Scholar] [CrossRef]
  22. Shahreza, H.O.; Hahn, V.K.; Marcel, S. MLP-Hash: Protecting Face Templates via Hashing of Randomized Multi-Layer Perceptron. arXiv 2022, arXiv:2204.11054. [Google Scholar]
  23. Guo, C.; Szemenyei, M.; Pei, Y.; Yi, Y.; Zhou, W. SD-UNet: A structured dropout U-Net for retinal vessel segmentation. In Proceedings of the 2019 IEEE 19th International Conference on Bioinformatics and Bioengineering (BIBE), Athens, Greece, 28–30 October 2019; pp. 439–444. [Google Scholar]
  24. Ghiasi, G.; Lin, T.Y.; Le, Q.V. Dropblock: A regularization method for convolutional networks. In Proceedings of the 32nd Conference on Neural Information Processing Systems (NeurIPS 2018), Montreal, QC, Canada, 2–8 December 2018; pp. 10727–10737. [Google Scholar]
  25. Ghiasi, G.; Lin, T.Y.; Le, Q.V. Nas-fpn: Learning scalable feature pyramid architecture for object detection. In Proceedings of the IEEE/CVF Conference on Computer Vision and Pattern Recognition, Long Beach, CA, USA, 15–20 June 2019; pp. 7036–7045. [Google Scholar]
  26. Stergiou, A.; Poppe, R.; Kalliatakis, G. Refining activation downsampling with SoftPool. In Proceedings of the IEEE/CVF International Conference on Computer Vision, Montreal, QC, Canada, 11–17 October 2021; pp. 10357–10366. [Google Scholar]
  27. Deng, X.; Ye, J. A retinal blood vessel segmentation based on improved D-MNet and pulse-coupled neural network. Biomed. Signal Process. Control 2022, 73, 103467. [Google Scholar] [CrossRef]
  28. Mo, J.; Zhang, L. Multi-level deep supervised networks for retinal vessel segmentation. Int. J. Comput. Assist. Radiol. Surg. 2017, 12, 2181–2193. [Google Scholar] [CrossRef]
  29. Yan, Z.; Yang, X.; Cheng, K.T. Joint segment-level and pixel-wise losses for deep learning based retinal vessel segmentation. IEEE Trans. Biomed. Eng. 2018, 65, 1912–1923. [Google Scholar] [CrossRef]
  30. Guo, S.; Wang, K.; Kang, H.; Zhang, Y.; Gao, Y.; Li, T. BTS-DSN: Deeply supervised neural network with short connections for retinal vessel segmentation. Int. J. Med. Inform. 2019, 126, 105–113. [Google Scholar] [CrossRef] [PubMed]
  31. Li, L.; Verma, M.; Nakashima, Y.; Nagahara, H.; Kawasaki, R. Iternet: Retinal image segmentation utilizing structural redundancy in vessel networks. In Proceedings of the IEEE/CVF Winter Conference on Applications of Computer Vision, Snowmass Village, CO, USA, 1–5 March 2020; pp. 3656–3665. [Google Scholar]
  32. Gu, R.; Wang, G.; Song, T.; Huang, R.; Aertsen, M.; Deprest, J.; Ourselin, S.; Vercauteren, T.; Zhang, S. CA-Net: Comprehensive attention convolutional neural networks for explainable medical image segmentation. IEEE Trans. Med. Imaging 2020, 40, 699–711. [Google Scholar] [CrossRef] [PubMed]
  33. Zhou, Y.; Chen, Z.; Shen, H.; Zheng, X.; Zhao, R.; Duan, X. A refined equilibrium generative adversarial network for retinal vessel segmentation. Neurocomputing 2021, 437, 118–130. [Google Scholar] [CrossRef]
  34. Rahman, M.M.; Marculescu, R. Medical image segmentation via cascaded attention decoding. In Proceedings of the IEEE/CVF Winter Conference on Applications of Computer Vision, Waikoloa, HI, USA, 2–7 January 2023; pp. 6222–6231. [Google Scholar]
Disclaimer/Publisher’s Note: The statements, opinions and data contained in all publications are solely those of the individual author(s) and contributor(s) and not of MDPI and/or the editor(s). MDPI and/or the editor(s) disclaim responsibility for any injury to people or property resulting from any ideas, methods, instructions or products referred to in the content.

Article Metrics

Citations

Article Access Statistics

Multiple requests from the same IP address are counted as one view.