1. Introduction
In massive network data, due to different user preferences and service types, data distribution is often imbalanced. There are majority classes and minority classes, i.e., the number of samples in some categories is far less than those in other categories. For example, the KDD CUP 99 [
1] and Moore dataset [
2] are typically imbalanced network data sets. Traditional classification methods usually assume that data distribution is balanced and the misclassification cost is equal. When the traditional classification algorithms are used to deal with imbalanced data, taking overall accuracy as the goal will make the classification model tend to the majority classes and ignore the minority classes, resulting in low classification accuracy in the minority classes. From the perspective of data mining, the discovery and identification of minority classes is of higher analysis value, e.g., the attack data in network intrusion detection [
3]. Therefore, researching data imbalance has important theoretical value and practical significance.
Many methods have made significant progress in addressing data imbalance and improved classification performance, but there are still unresolved problems. The existing studies show merely a rough description of data imbalance without considerable exploration of the essence of data imbalance. The specific impact of data imbalance on classification performance is not clear enough. The factors affecting classification performance have not been further explored. Therefore, it is difficult to put forward precise and targeted guidance for follow-up solution strategies. Garcia et al. [
4] investigated the influence of both the imbalance ratio and the classifier on the performance of several resampling strategies. Experiments showed oversampling the minority class consistently outperforms undersampling the majority class when data sets are strongly imbalanced. Buda et al. [
5] proposed two indicators to describe data imbalance and set imbalanced image datasets to verify the impact of imbalanced datasets on CNN under different parameter settings. However, only majority classes and minority classes were considered, and only using ROC and AUC (area under receiver operating characteristic) as metrics to evaluate the classifier’s performance was not comprehensive. Fadi et al. [
6] studied the precise nature of the relationship between the degree of class imbalance and the corresponding classifier performance. By changing class imbalance ratios and using the probabilistic Nave Bayes as the base classifier, the experiments highlighted the effects of class imbalance. Ajay et al. [
7] resolved two essential statistical elements: the degree of class imbalance and the complexity of the concept, which helped in building the foundations of a data democracy. They focused on the main causes of imbalance, which were class overlap and small disjoints.
The actual datasets are complex, as there are not only majority and minority classes but also medium classes between them. Most oversampling methods aim to balance all categories by adding the sample size of minority classes [
8,
9,
10,
11]. However, in the face of extreme imbalance, it is still not possible to solve the fundamental problem. Therefore, concerning the improvement of classification performance of imbalanced data, further exploration of the factors affecting the classification performance of imbalanced data is a worthy research direction. Research on data imbalance can help us have a clearer understanding of the essence of the problem. When the optimization objectives required by different scenarios are different, we can put forward precise and targeted strategies.
The main contributions of this paper are as follows:
(1) Proposal of a parameterized model based on imbalanced network datasets and a solution to the problem of insufficient description of data imbalance.
(2) Clarification of the factors affecting the classification performance of imbalanced data, and finding and verifying the influence of partial balance.
(3) Proposal and proof of the basic strategies to solve the problem of network data imbalance.
The structure of this paper is organized as follows. The
Section 2 is about related work. The
Section 3 is the parameterized description of imbalanced datasets. In the
Section 4, we conduct experiments to explore the impact of different parameters on the classification performance of imbalanced datasets. The
Section 5 explores the differences in classification performance of imbalanced datasets with partial balance and the impact of partial balance. In addition, some feasible strategies are put forward and proved in several algorithms. The
Section 6 concludes this paper.
2. Related Work
In the past two decades, many representative research results have been achieved around data imbalance, mainly focusing on two aspects: data resampling and classifier design.
2.1. Data Resampling
Data resampling includes undersampling methods and oversampling methods.
Undersampling methods balance the dataset by reducing the samples of majority categories. Random Undersampling (RUS) is the basic method to balance the dataset by randomly reducing the sample size of majority classes. However, this method may result in losing some valuable information when deleting samples. To overcome this problem, EasyEnsemble and BalanceCascade were proposed [
12]. The EasyEnsemble algorithm extracts several subsets from majority classes independently and randomly, and mixes each subset with minority class data to train several base classifiers. Finally, these base classifiers are combined to form an integrated learning system. BalanceCascade algorithm uses the previously formed integrated classifier to select the majority class samples for the next training. In [
13], the ENN algorithm was proposed. Here, the idea is to delete the samples of two or more categories from the three nearest neighbor samples. Based on ENN, the NCR method was proposed [
14]. Here, the core idea is to find the three nearest neighbor samples for each sample in the training set. If the sample belongs to the majority class and more than two of its three nearest neighbors are minority class samples, it is deleted. On the contrary, when the sample belongs to the minority class and more than two of its three nearest neighbors are majority class samples, the majority class samples in the nearest neighbors are removed.
Oversampling methods balance the dataset by adding the samples of minority categories. Random Oversampling (ROS) is the basic method to balance the dataset by randomly copying the data or simply rotating the images in image recognition. However, repeated replication of minority classes may lead to overfitting. Therefore, the classical algorithm SMOTE was proposed [
15]. By randomly selecting samples of the same nearest neighbor for interpolation, a new sample of the minority class without repetition is generated, which can effectively solve the overfitting problem and significantly improve classification performance. However, this method may lead to overgeneralization, sample overlap, noise and other problems. To solve these problems, some improved SMOTE algorithms emerged. D-SMOTE generates minority class samples by finding the mean point of the nearest neighbor samples [
16]. Borderline-SMOTE only generates synthetic samples for minority class samples close to the boundary [
17]. In addition, some adaptive oversampling methods were proposed. ADASYN [
18] uses the density distribution as the standard to automatically determine the number of synthetic samples. By adaptively changing the weight of different minority classes, a corresponding number of synthetic samples are generated for each sample.
In addition, deep learning techniques have emerged to address data imbalance. Generative Adversarial Networks (GAN) are used to expand the minority data and Multi-Layer Perceptron (MLP) is used to evaluate the performance [
8]. The experimental results show that the recall and F1 of minority class samples increase by 17.0% and 15.6%, respectively, compared to the original imbalanced dataset. But GAN cannot control the pattern of generated data and is, thus, uncontrollable. A method called Auxiliary Classifier GAN(AC-GAN) was proposed [
10] to generate traffic samples on the traffic dataset NIMS. However, the training time was longer compared to other methods. In addition, Long Short-Term Memory (LSTM) can also be used for oversampling. A data augmentation method based on LSTM and Kernel Density Estimation (KDE) was proposed [
11]. A packet sequence in a stream is generated by LSTM, and then a random value is generated according to the distribution of features in the sequence. The feature of the sequence is estimated by KDE to generate samples of minority classes until the dataset is balanced.
2.2. Classifier Design
As for classifier design and improvement, common strategies include cost-sensitive learning, one-class learning and end-to-end learning.
Cost-sensitive learning focuses on samples with higher error costs in classification [
19]. In [
20], based on the decision tree algorithm, the idea of cost sensitivity was injected into the splitting and pruning stages to improve the weight of minority classes. Different cost factors were given to different categories by [
21], based on SVM, to obtain the best classification result with minimum cost. When the number of minority samples is too small, cost-sensitive learning is no longer applicable. By combining deep learning with cost-sensitive learning to solve the problem of data imbalance, the existing works mostly start with improvement of the loss function. In [
22], the loss function was improved based on the MLP. The average error and the average square error were proposed, which were more sensitive to the errors from minority classes and suitable for imbalanced data.
One-class learning intends only to train the majority class samples, form a model for majority classes, and identify the majority class samples from the test samples, rather than distinguish the minority classes and the majority classes. Representative methods include one-class SVM [
23], SVDD [
24], etc. One-class learning can effectively reduce time cost. It is suitable for the extreme situation of very few class samples or high imbalance between classes, but it focuses more on majority classes and easily overfits minority class samples in the training set.
End-to-end learning is the direct learning of the mapping from the original data to the expected out. It is completely handed over to the deep learning model, which is different from the divide and conquer method of machine learning. An end-to-end Tree-Shaped Deep Neural Network (TSDNN) was designed based on MLP in [
25], which classified the data hierarchically. To better learn minority classes, an algorithm named Quantity Dependent Backpropagation (QDBP) was proposed, which integrated the knowledge of differences between classes. A model named Parallel Cross Convolution Neural Network (PCCN) was designed in [
26], which was composed of two branch models in parallel: Convolutional Neural Networks (CNN) and Fully Convolutional Networks (FCN). Through feature fusion technology, the traffic features learned from the two branch convolutional neural networks were cross-fused, and could better learn the traffic features with fewer samples and improve the detection effect of imbalanced abnormal traffic.
3. Parameterized Model of Imbalanced Dataset
Network services are taken as an example to analyze the existing data imbalance.
Table 1 shows the proportion distribution statistics of the Moore dataset. The dataset contains 377,526 network flow samples, which are divided into 10 application types. The Moore dataset is a typical imbalanced dataset, and the sample size of various application types varies greatly.
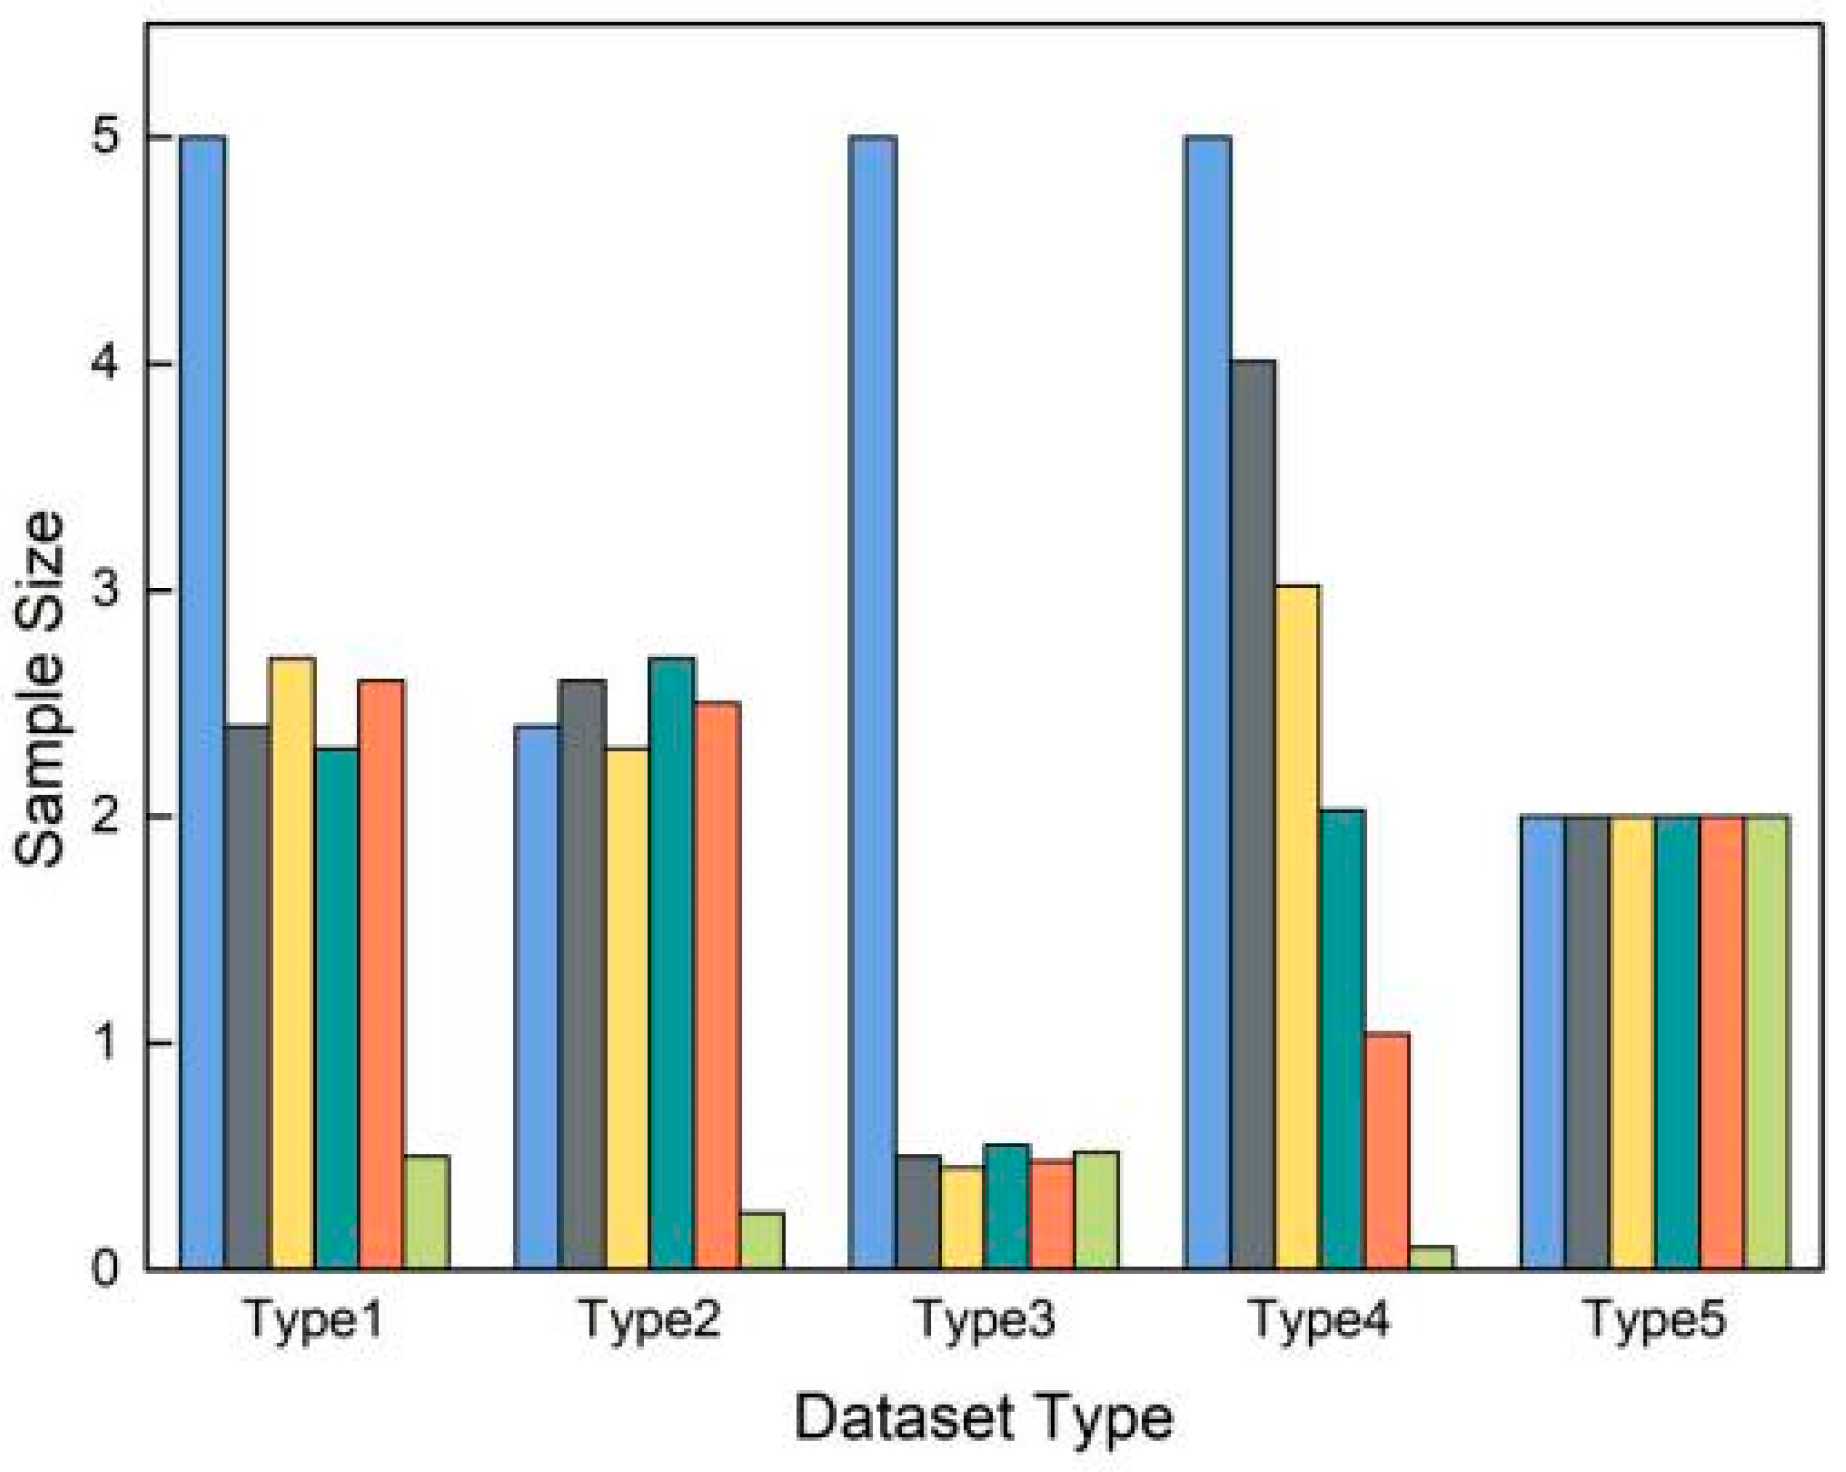
From the perspective of similar applications, the launch of new applications will lead to a big gap in network data scale between new applications and existing similar applications. Moreover, influenced by regional cultural differences and user preferences (such as Skype, used internationally, and WeChat, mainly used in China), there will also be great differences in data scale between mainstream applications and non-mainstream applications. In addition, different software data in similar applications with relatively stable user groups will produce a relative data balance (relatively concentrated area of Type 1–Type 3 in
Figure 1) or stable data scale gap (Type 4). From the perspective of different types of applications, data imbalance is mainly caused by different business attributes. For example, the number of business flows, such as web data, is huge compared to other data (majority classes in Type 1–Type 4).
Through the above analysis, the following four dataset types with data imbalance are further summarized.
As shown in
Figure 1, Type 1 includes a majority class, several medium classes and a minority class, and the distribution area of medium classes is relatively concentrated. We call this
partial balance. Type 2 includes medium classes and a minority class, and medium classes show partial balance. Type 3 includes a majority class and several minority classes, and minority classes show partial balance. Type 4 has the characteristics of a majority class and minority class, but the data scale of the medium classes has no relatively centralized attribute and has a linear characteristic. We consider that there is no partial balance in this case. Type 5 is a balanced dataset for comparative analysis.
Based on the above analysis, the characteristics of the actual dataset types include the sample size, the class number of majority, minority and medium categories. According to these characteristics, imbalanced datasets are modeled and several parameters are proposed to describe imbalanced datasets as follows:
Define a dataset as where and are the subclasses of , and is the number of categories in , .
Imbalanced Dataset : {Global Slope, Class Number of Partial Balance, Balance Degree of Partial Samples}.
Partial Balance: {Class Number of Partial Balance, Balance Degree of Partial Samples}. Multiple parameters are used to define the balanced part of the imbalanced dataset, which is a phenomenon in the imbalanced dataset.
Global Slope:
is the ratio of minority class samples to majority class samples in the dataset, which is defined as:
Class Number of Partial Balance: is the class number of partial balance. According to the dataset types in
Figure 1, there are
,
,
which represent the class number of partial balance of majority classes, medium classes, minority classes, respectively.
is an integer,
When
the dataset shows linear imbalance, i.e., Type 4. When
the dataset is balanced, i.e., Type 5. The larger
, the higher the degree of partial balance.
Balance Degree of Partial Samples: is the ratio of the partial average sample size to the average sample size of majority classes, depicting the degree of partial balance. The lower
, the lower the height of the partial sample size.
is expressed as:
where
The above parameters can describe the main characteristics of dataset types. To simulate the types of actual datasets, some random fluctuations are added to the sample quantity of each category. For example, means that all categories’ sample sizes in the dataset fluctuate by 20%.
4. Impact of Imbalanced Dataset Parameters on Classification Performance
When classifying the same type of imbalanced dataset, the average classification performance of majority classes, minority classes and the overall classes can be affected by the parameters. To explore the influence of parameters on classification performance, the following experiments are designed.
4.1. Experimental Details
4.1.1. Experimental Environment
Our experimental environment is shown in
Table 2.
4.1.2. Data Sets
The datasets used in this paper are the Moore dataset and CICIDS 2017 dataset [
27].
Moore Dataset: The Moore dataset is represented by 249 attribute features. To reduce redundant features and the amount of calculation, and improve the classification efficiency, only 10 features used in reference [
28] for each network flow are adopted by our experiments. In addition, only 6 application types are used, namely WWW, MAIL, BULK, DATABASE, SERVICES, P2P. The reason for choosing these categories is that the sample size of these categories is more than 2000, which is, conveniently, enough data for experiments.
CICIDS 2017 Dataset: The CICIDS 2017 dataset is a network traffic dataset close to the real world, including normal traffic and abnormal traffic. There are 79 features in the dataset, including a label feature and a duplicate feature. Our experiments use machine learning CSV data, and, to reduce redundant features, 15 features used in [
29] and 6 types are adopted, namely Benign, DOS Hulk, PortScan, DOS Slowhttptest, DOS Slowloris and Web Attack.
4.1.3. Basic Experiment Settings
The basic experiment settings are shown in
Table 3. In addition, the average sample quantity of majority classes is always 5000. The classifiers used in these experiments are Random Forest (RF), Decision Tree (DT) and Deep Neural Network (DNN) in Scikit-learn package. The parameter settings of the classifiers are set as the default parameters shown in
Table 4. Each category is arranged and combined in turn as the minority category and the majority category to reduce the impact of the category itself on the classification performance. Each experiment takes the statistical average results by repeating 100 times.
4.1.4. Evaluation Indicators
In machine learning, the commonly used performance metrics are recall rate
, precision rate
and F1-score
.
reflects the proportion of real positive samples in the positive samples determined by the classifier.
reflects the proportion of positive samples correctly judged in the total positive samples.
is the harmonic mean of
and
. Their definitions are given by Equations (4)–(6) for a given category
.
is the correctly labeled number. denotes the predicted label as , but the actual label is not . implies that the predicted label is not , but the actual label is . means that neither the predicted label nor the actual label is .
In addition, macro indicators are used and given by Equations (7)–(9) to measure the overall classification performance.
is the total number of categories.
is the average
,
is the average
, and
is the average
. For example, Macro Aver. Rec is the average
of the overall categories and Minor Aver. Rec is that of the minority categories.
4.2. Parameters’ Impact on Classification Performance of Type 1
Different types of datasets use different parameters. According to the characteristics of Type 1, three sets of experiments are set up to respectively explore the effects of parameters
, , on classification performance, as shown in
Table 5.
4.2.1. 1-A Impact of
To explore the effect of Global Slope on classification performance of Type 1, is changed and other parameters are fixed.
The lower
, the higher the degree of data imbalance. According to the experimental results shown in
Figure 2, with the decrease of
, (1) the average recall rate and F1-score of minority categories show a downward trend. When
, the recall rate of the Moore dataset by Random Forest is 56.96%, so the classifier is not reliable anymore. It shows that data imbalance has a large negative impact on the classification performance of minority classes. (2) The overall classification performance also shows a downward trend.
4.2.2. 1-B Impact of
Experiment 1-B explores the effect of Class Number of Partial Balance on the classification performance of Type 1, so is changed and others are fixed. In this case, means , that is, the class number of medium classes in the dataset. The larger , the higher the degree of partial balance.
According to
Figure 3, as
increases, the recall rate and F1-score in minority classes decrease. However, the recall rate and F1-score of the overall classification performance show an upward trend, which indicates that the increase of
is conducive to improvement of the overall performance.
4.2.3. 1-C Impact of
Experiment 1-C explores the effect of the Balance Degree of Partial Samples on the classification performance of Type 1. So is changed. The lower , the lower the height of the medium classes, and the closer the medium classes are to the minority classes.
As revealed by
Figure 4, with increase in
, all evaluation indicators of minority classes, and the whole, decrease. It shows that the lower
is, the better the classification performance is.
4.3. Parameters’ Impact on Classification Performance of Type 2
Although the practical significance of Type 2 and Type 3 are different, they can be both described by
and
. From the perspective of modeling, they can be regarded as the same case. Therefore, the discussion of Type 2 in this section is equivalent to Type 3. According to the characteristics of these types,
and
are explored and the experimental parameter settings can be seen from
Table 6.
4.3.1. 2-A Impact of
Experiment 2-A explores the effect of on the classification performance of Type 2.
According to
Figure 5, with the decrease in
, the imbalance degree intensifies, and the recall rate and F1-score of minority classes and the overall classes show a downward trend. It can be calculated that
is the main parameter on the classification performance of Type 2 and Type 3. The reduction of
is beneficial to the improvement of classification performance.
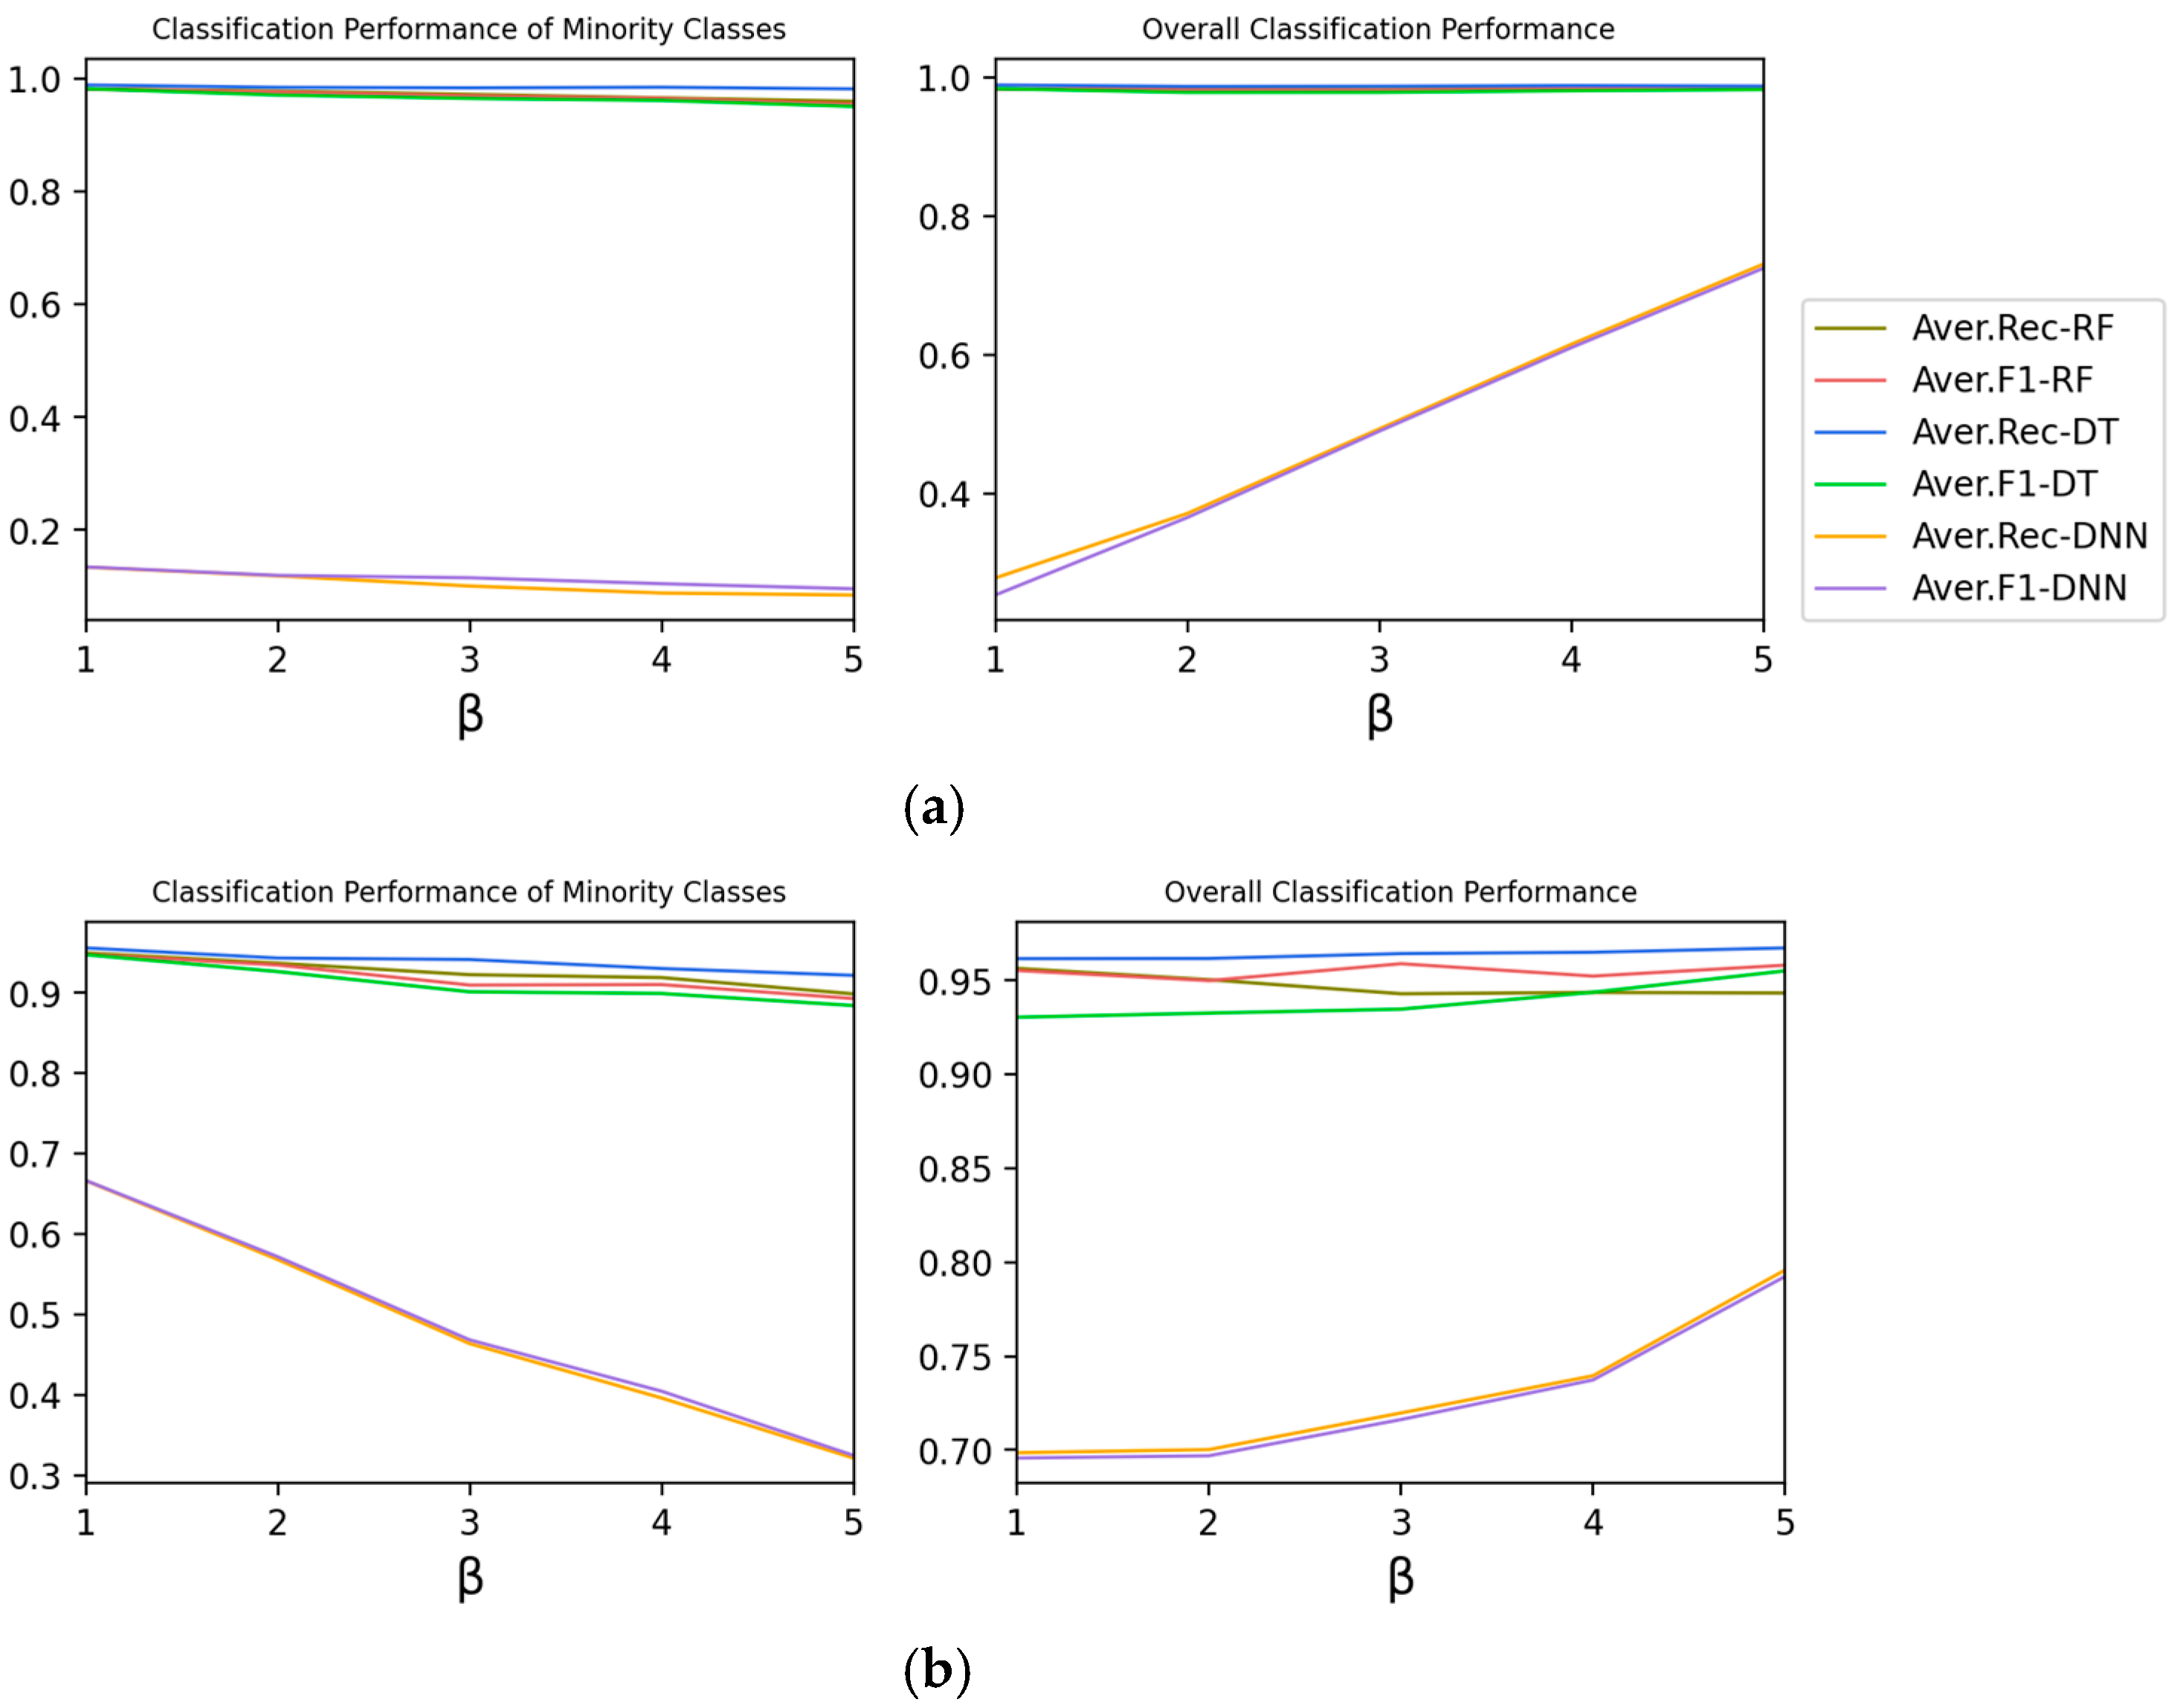
4.3.2. 2-B Impact of
Experiment 2-B explores the effect of on the classification performance of Type 2.
As shown in
Figure 6, with the increase in
, the average performance of minority categories shows a downward trend, but the overall performance is on the rise.
4.4. Parameters’ Impact on Classification Performance of Type 4
Since Type 4 describes a linear imbalanced dataset, the most obvious feature is the Global Slope. Therefore, only is used to describe this type. The experimental settings are .
The experimental results are shown in
Figure 7. With the decrease in
, the classification performance indicators of minority classes, and the whole, decrease.
4.5. Result Analysis
shows a negative impact on the average performance of minority and overall categories. As the results in
Table 7 show, due to the decrease in
, the sample proportion of minority classes in the overall dataset decreases and the average classification performance of minority and overall categories show a downward trend.
When of dominant categories increases, that of inferior classes decreases, which leads to the decrease in the average performance of minority classes. In Type1, , the more the class number of medium categories, the less that of minority classes, and the lower the average performance of minority classes. In Type 2, the more the class number of majority classes, the worse the average performance is. In either case, or is the class number of dominant categories in the dataset, which can lead to decline in the average performance of minority classes.
The lower is, the closer the medium classes are to the minority classes, and the better the average performance is. From the results, in Type 1, the decrease of represents the decrease in the sample size of the medium categories, and the classification performance of minority and overall classes increase.
5. Parameters’ Impact on Classification Performance for Imbalanced Data Sets with Partial Balance
Further analysis shows Type 1 and Type 2 are more complex. Partial balance exists in Type 1 and Type 2, in which Type 1 is affected by , and , and Type 2 is affected by and . To further study the impact of partial balance and the difference in classification performance of imbalanced datasets with partial balance, the coordinated change of multiple parameters is carried out in the following experiments.
5.1. Experimental Setup and Results
This section uses the same experimental environment and classifier as
Section 3.
and
are adjusted at the same time to observe the performance difference between Type 1 and Type 2, where
and
in Type 1. There are 12 groups of experiments.
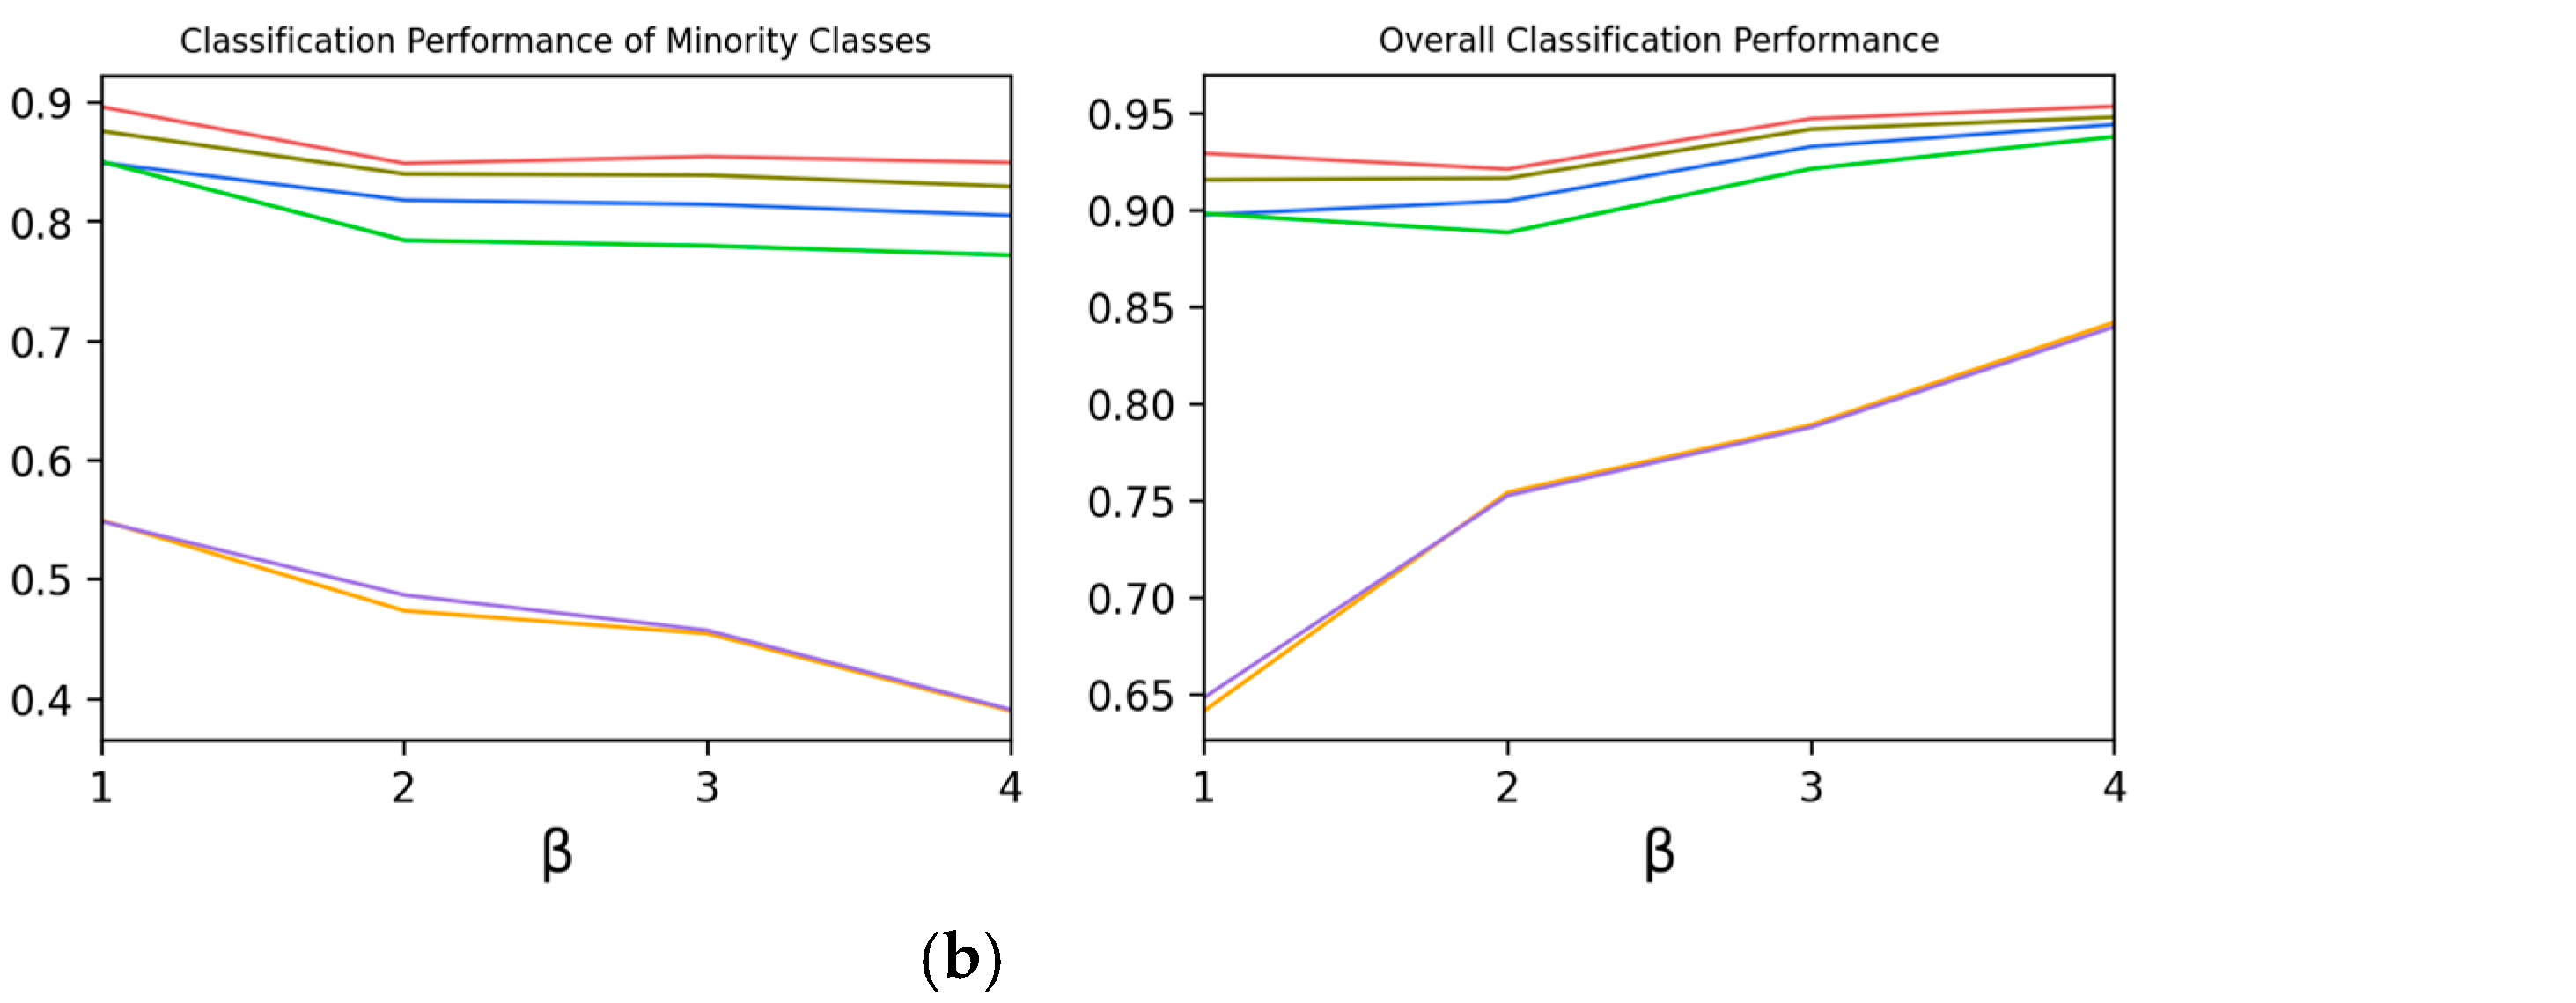
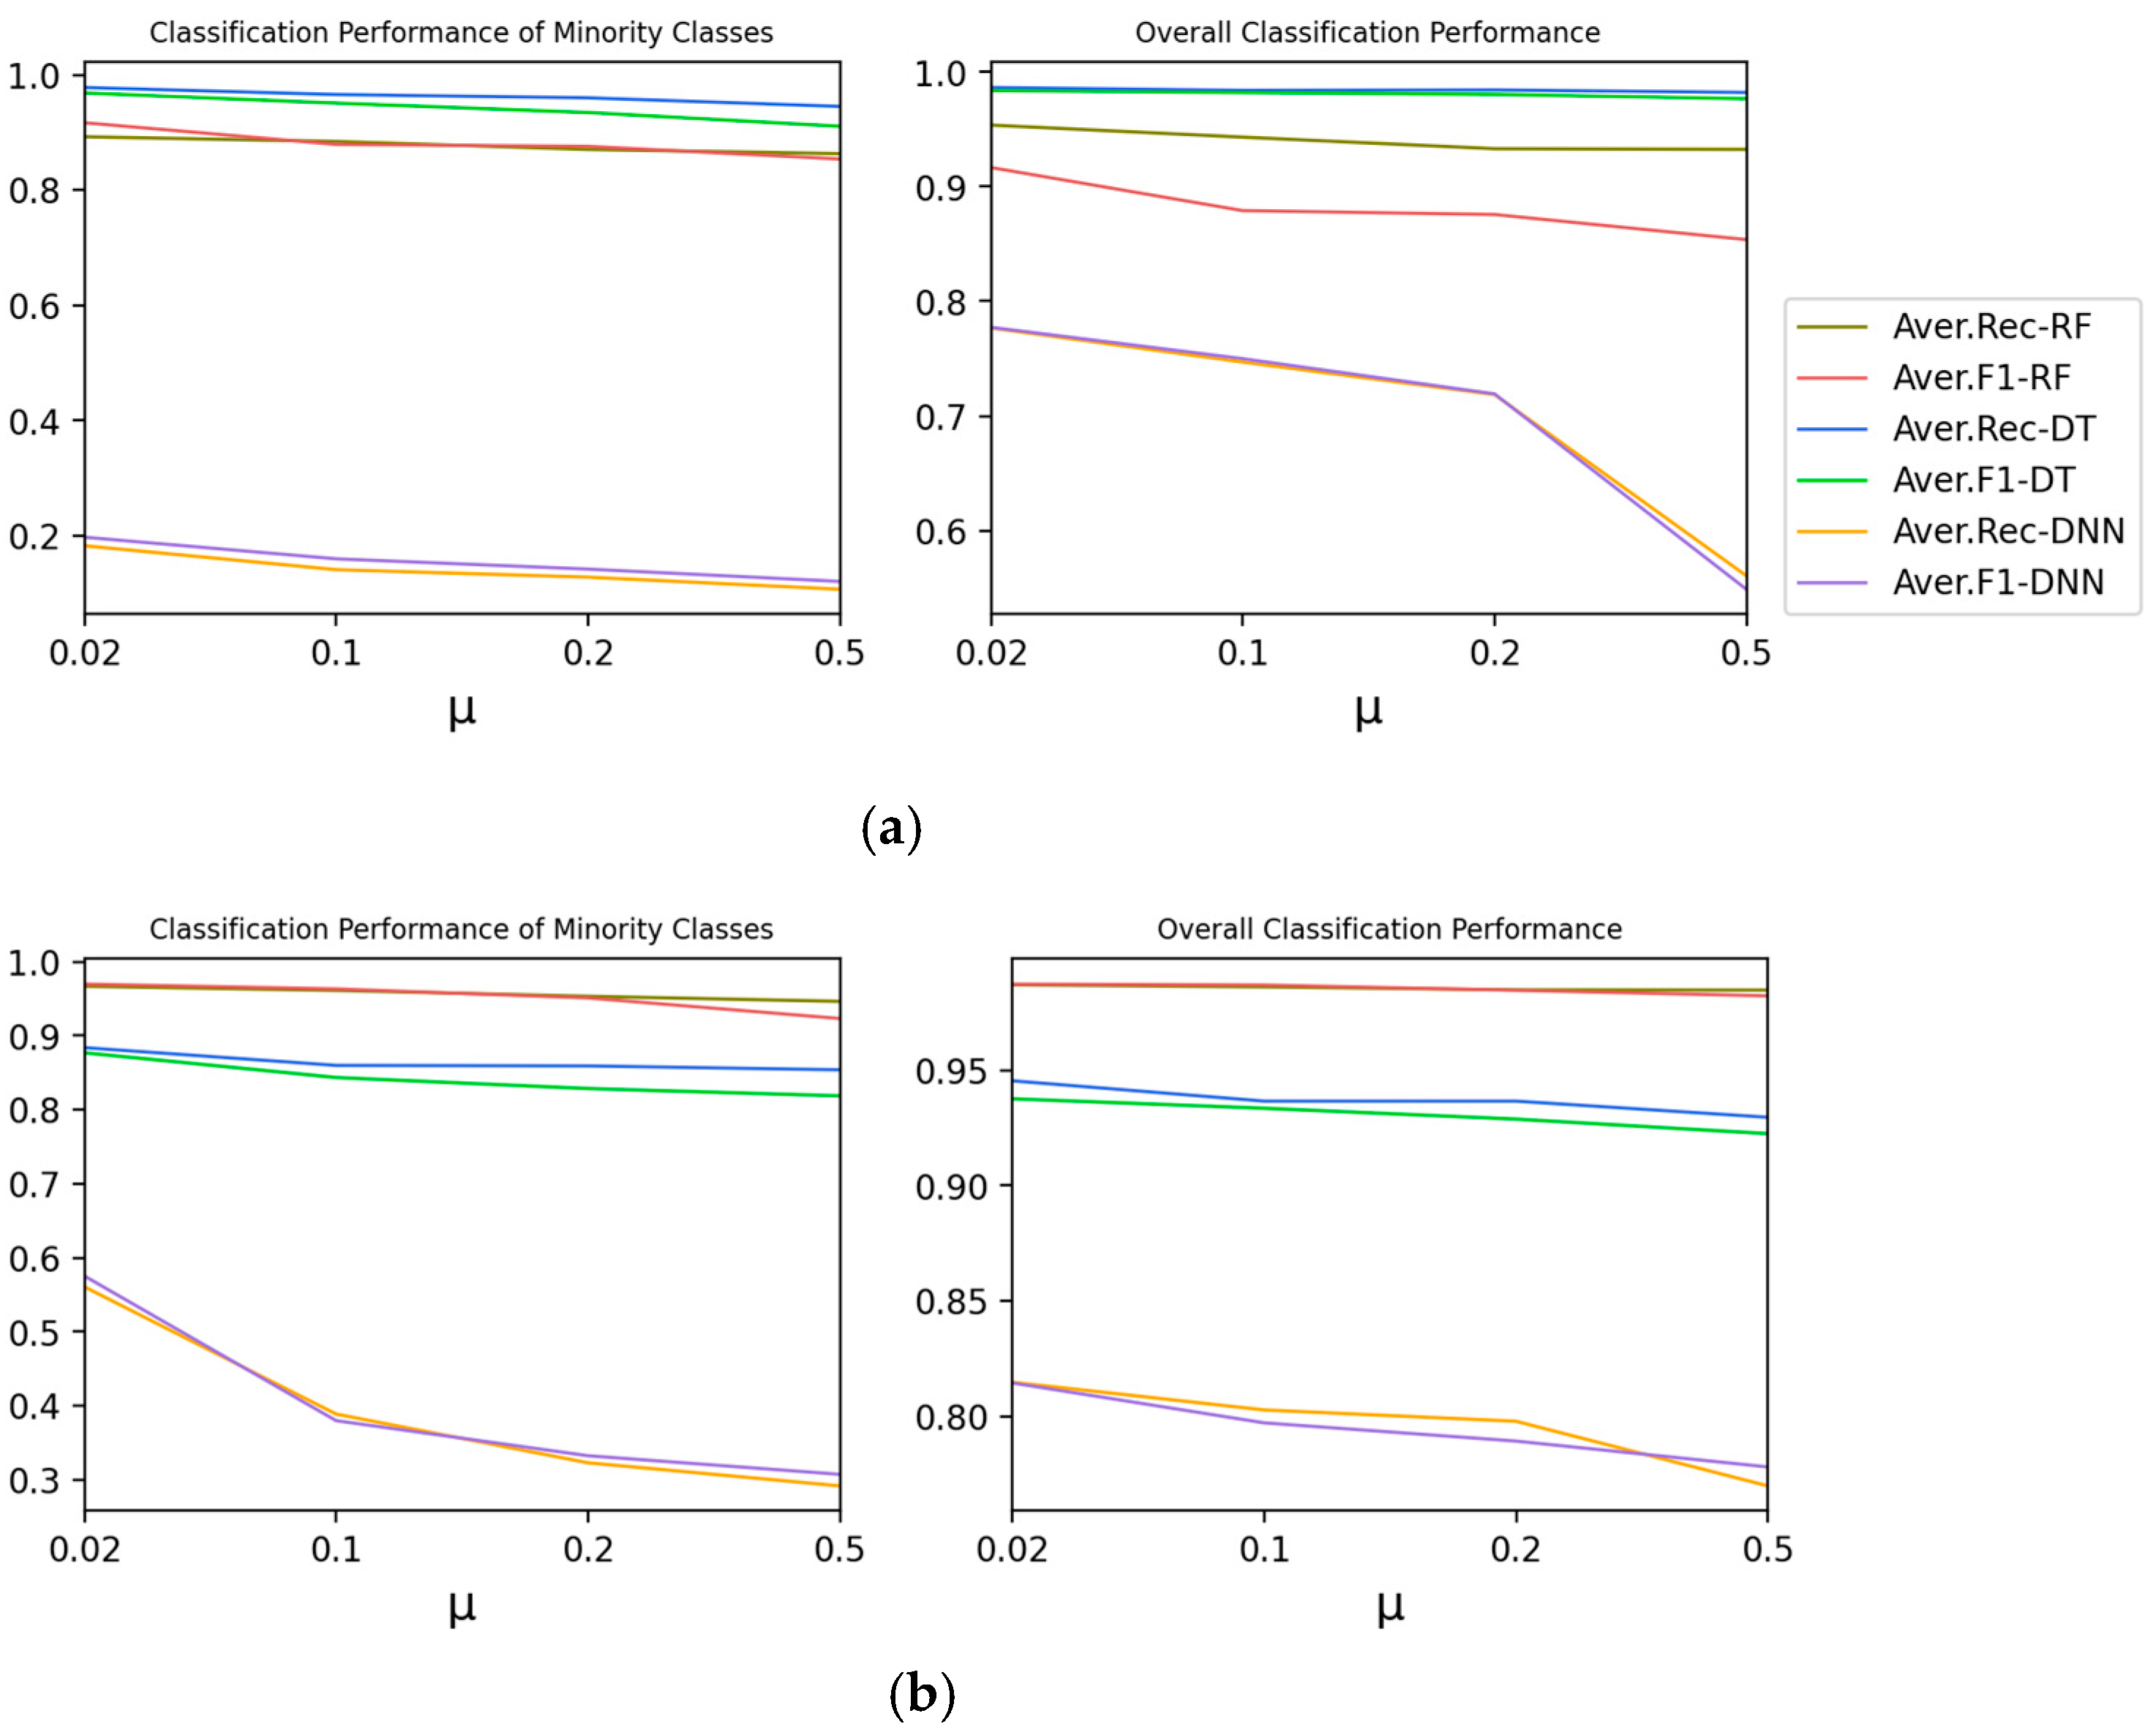
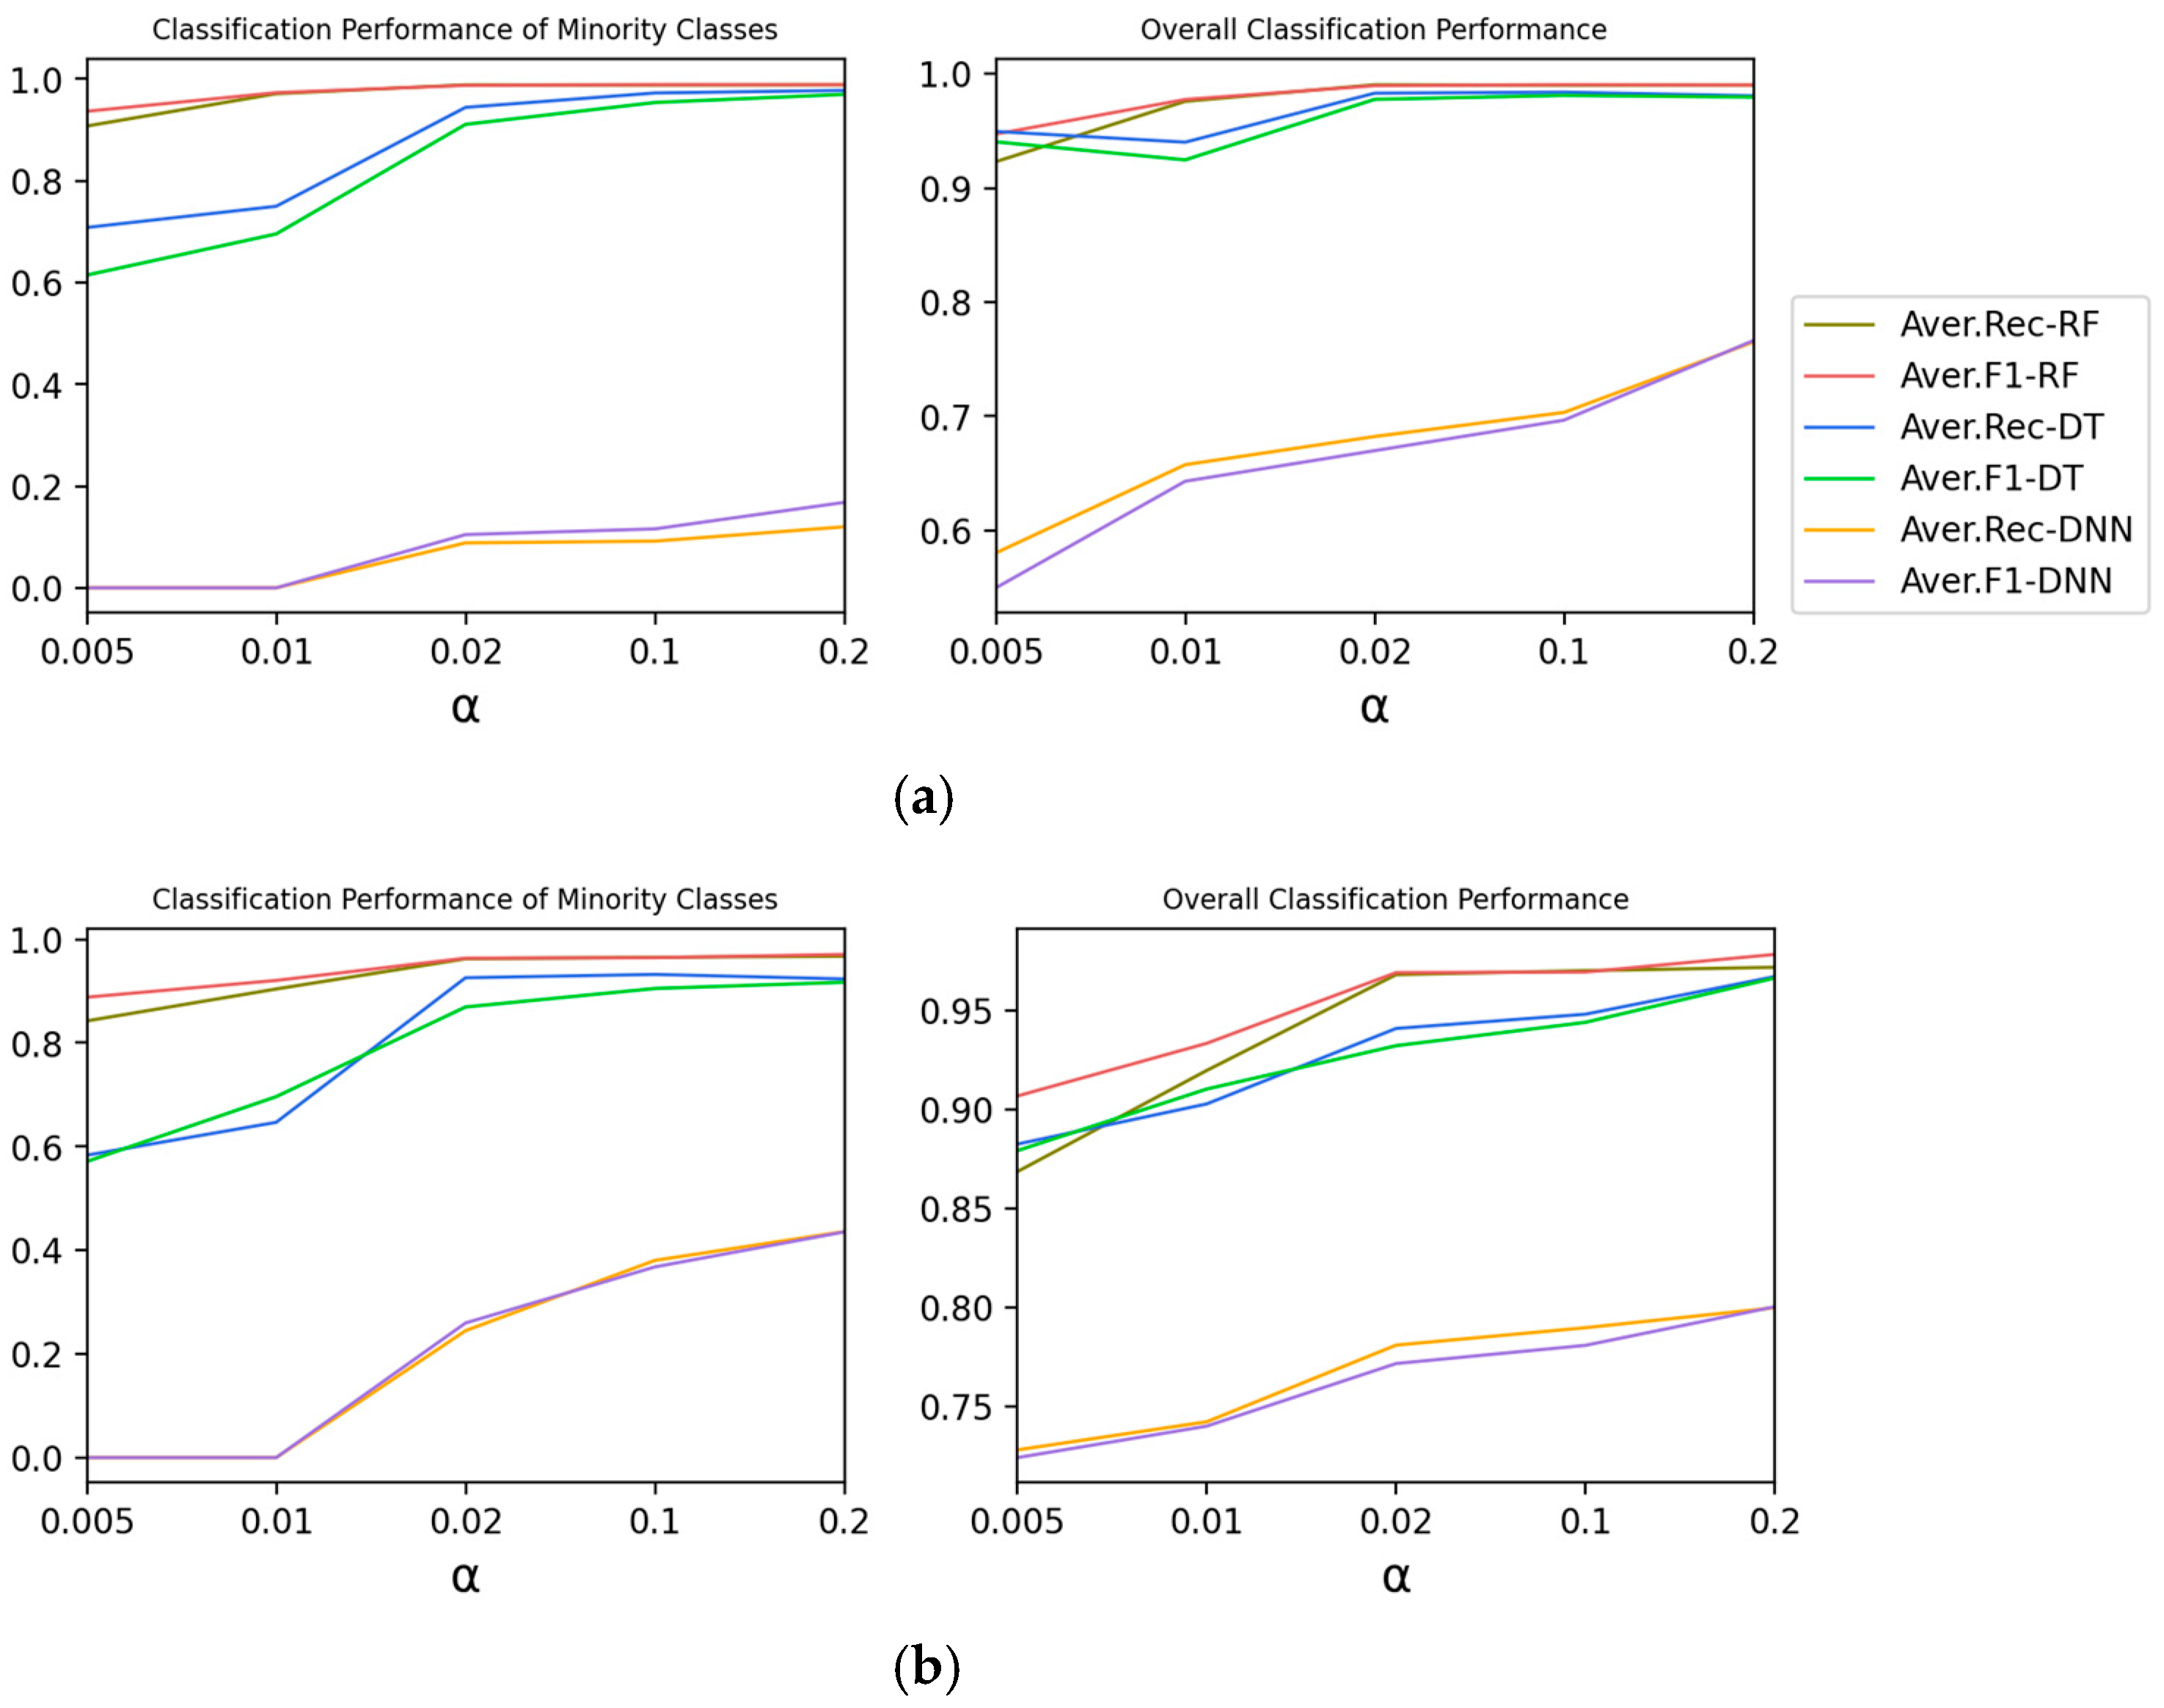
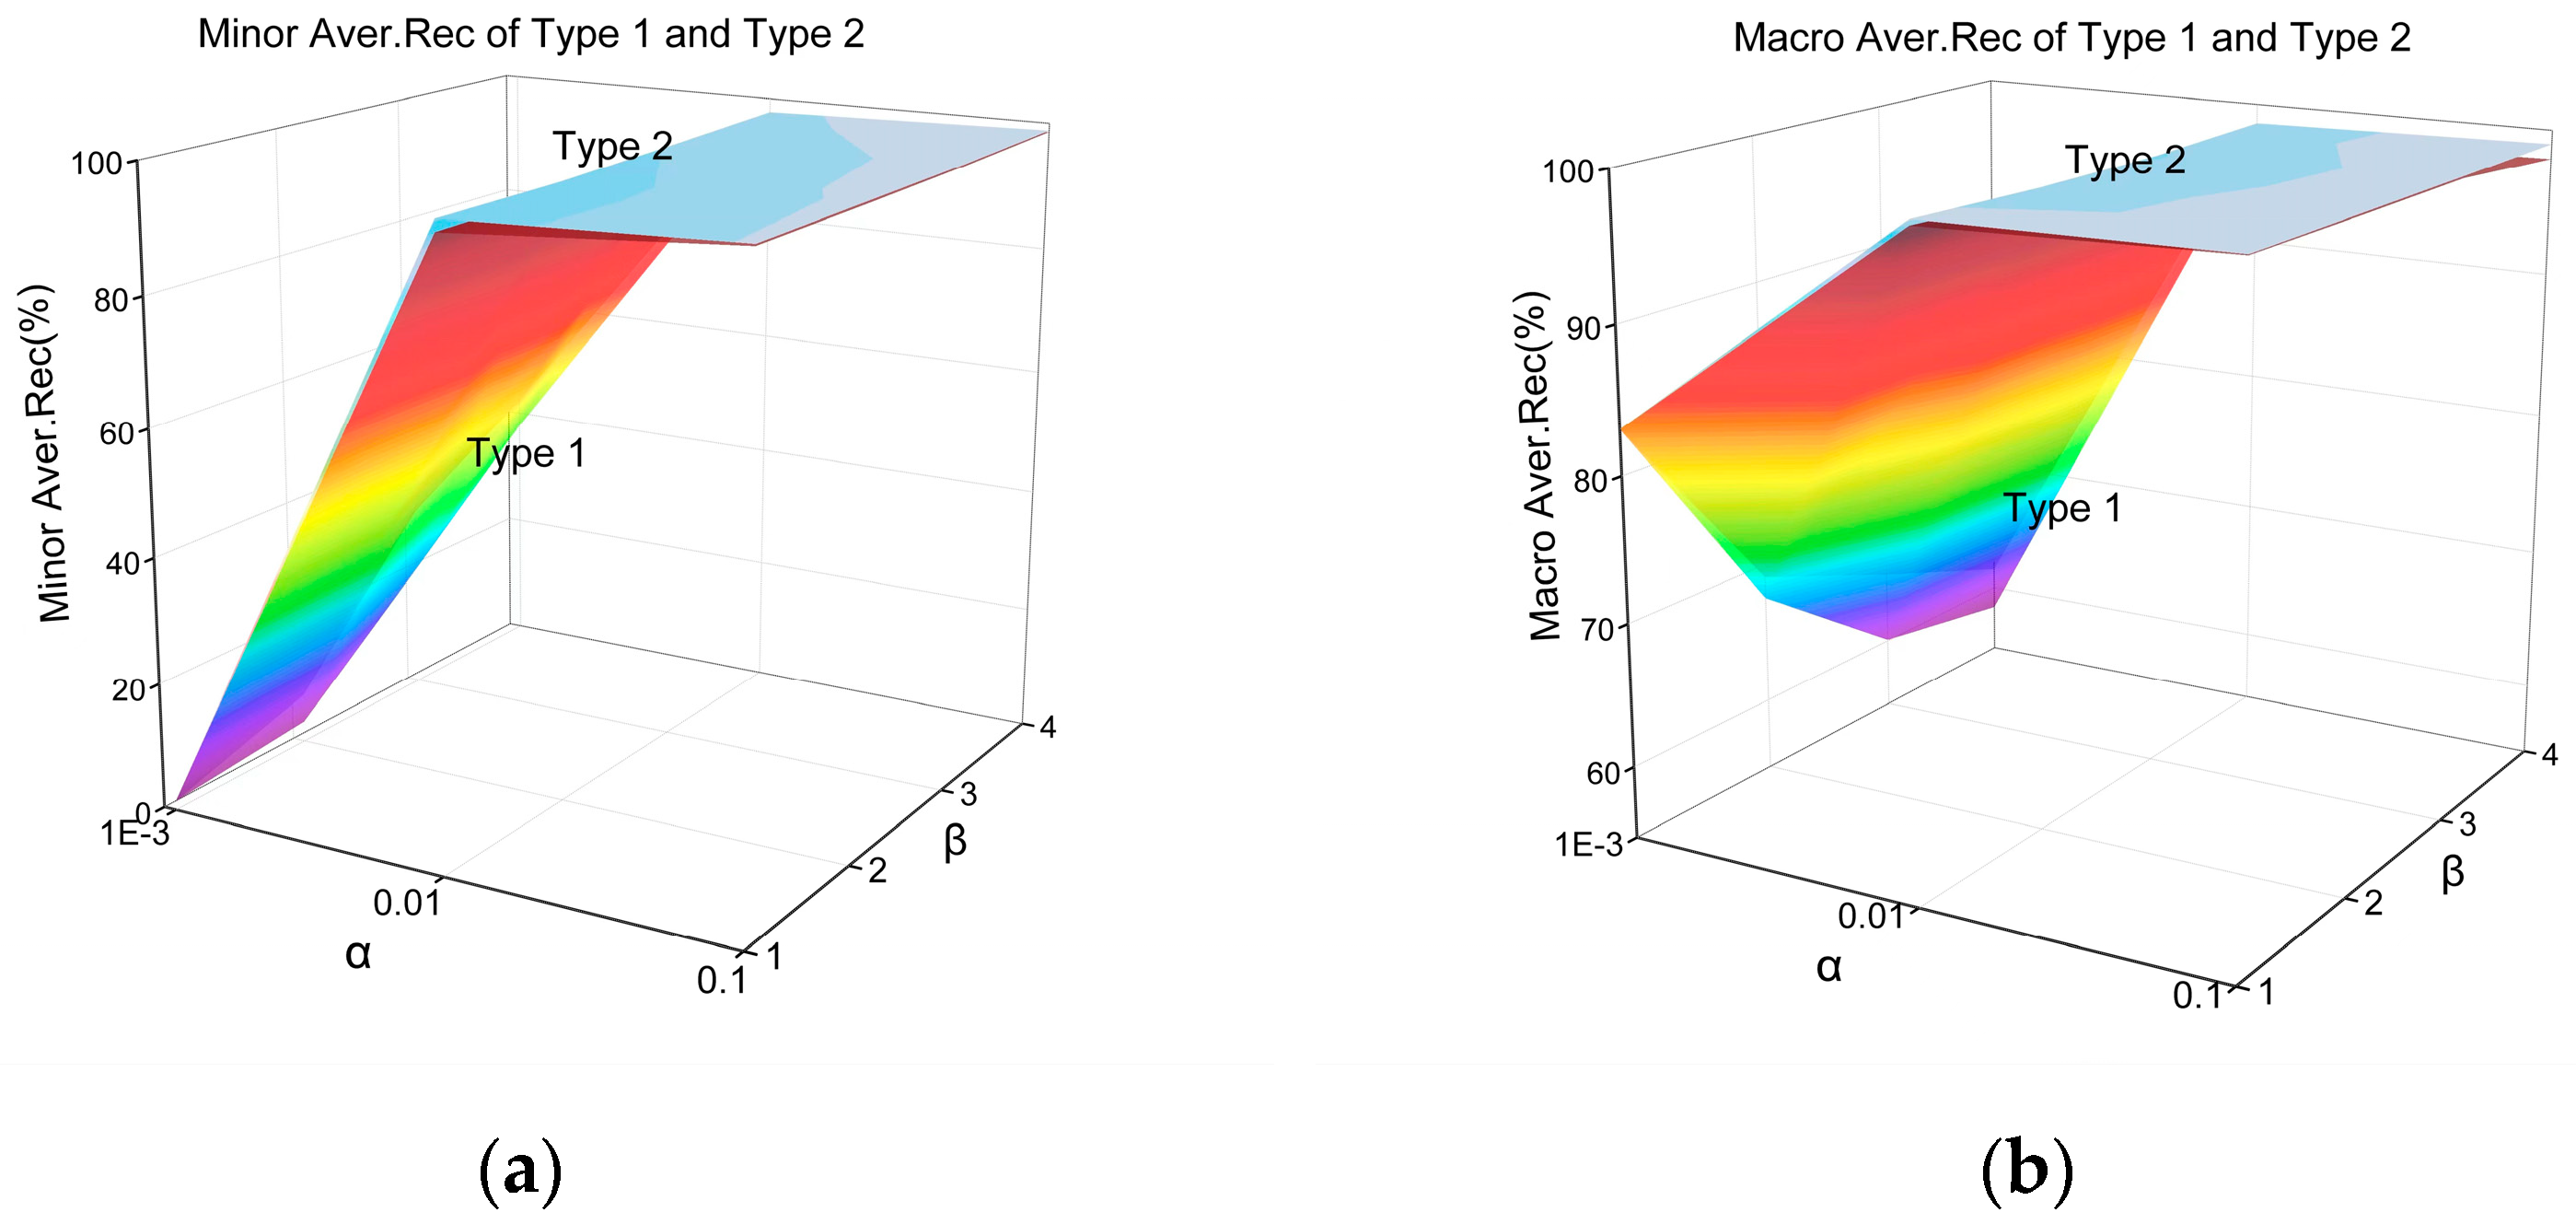
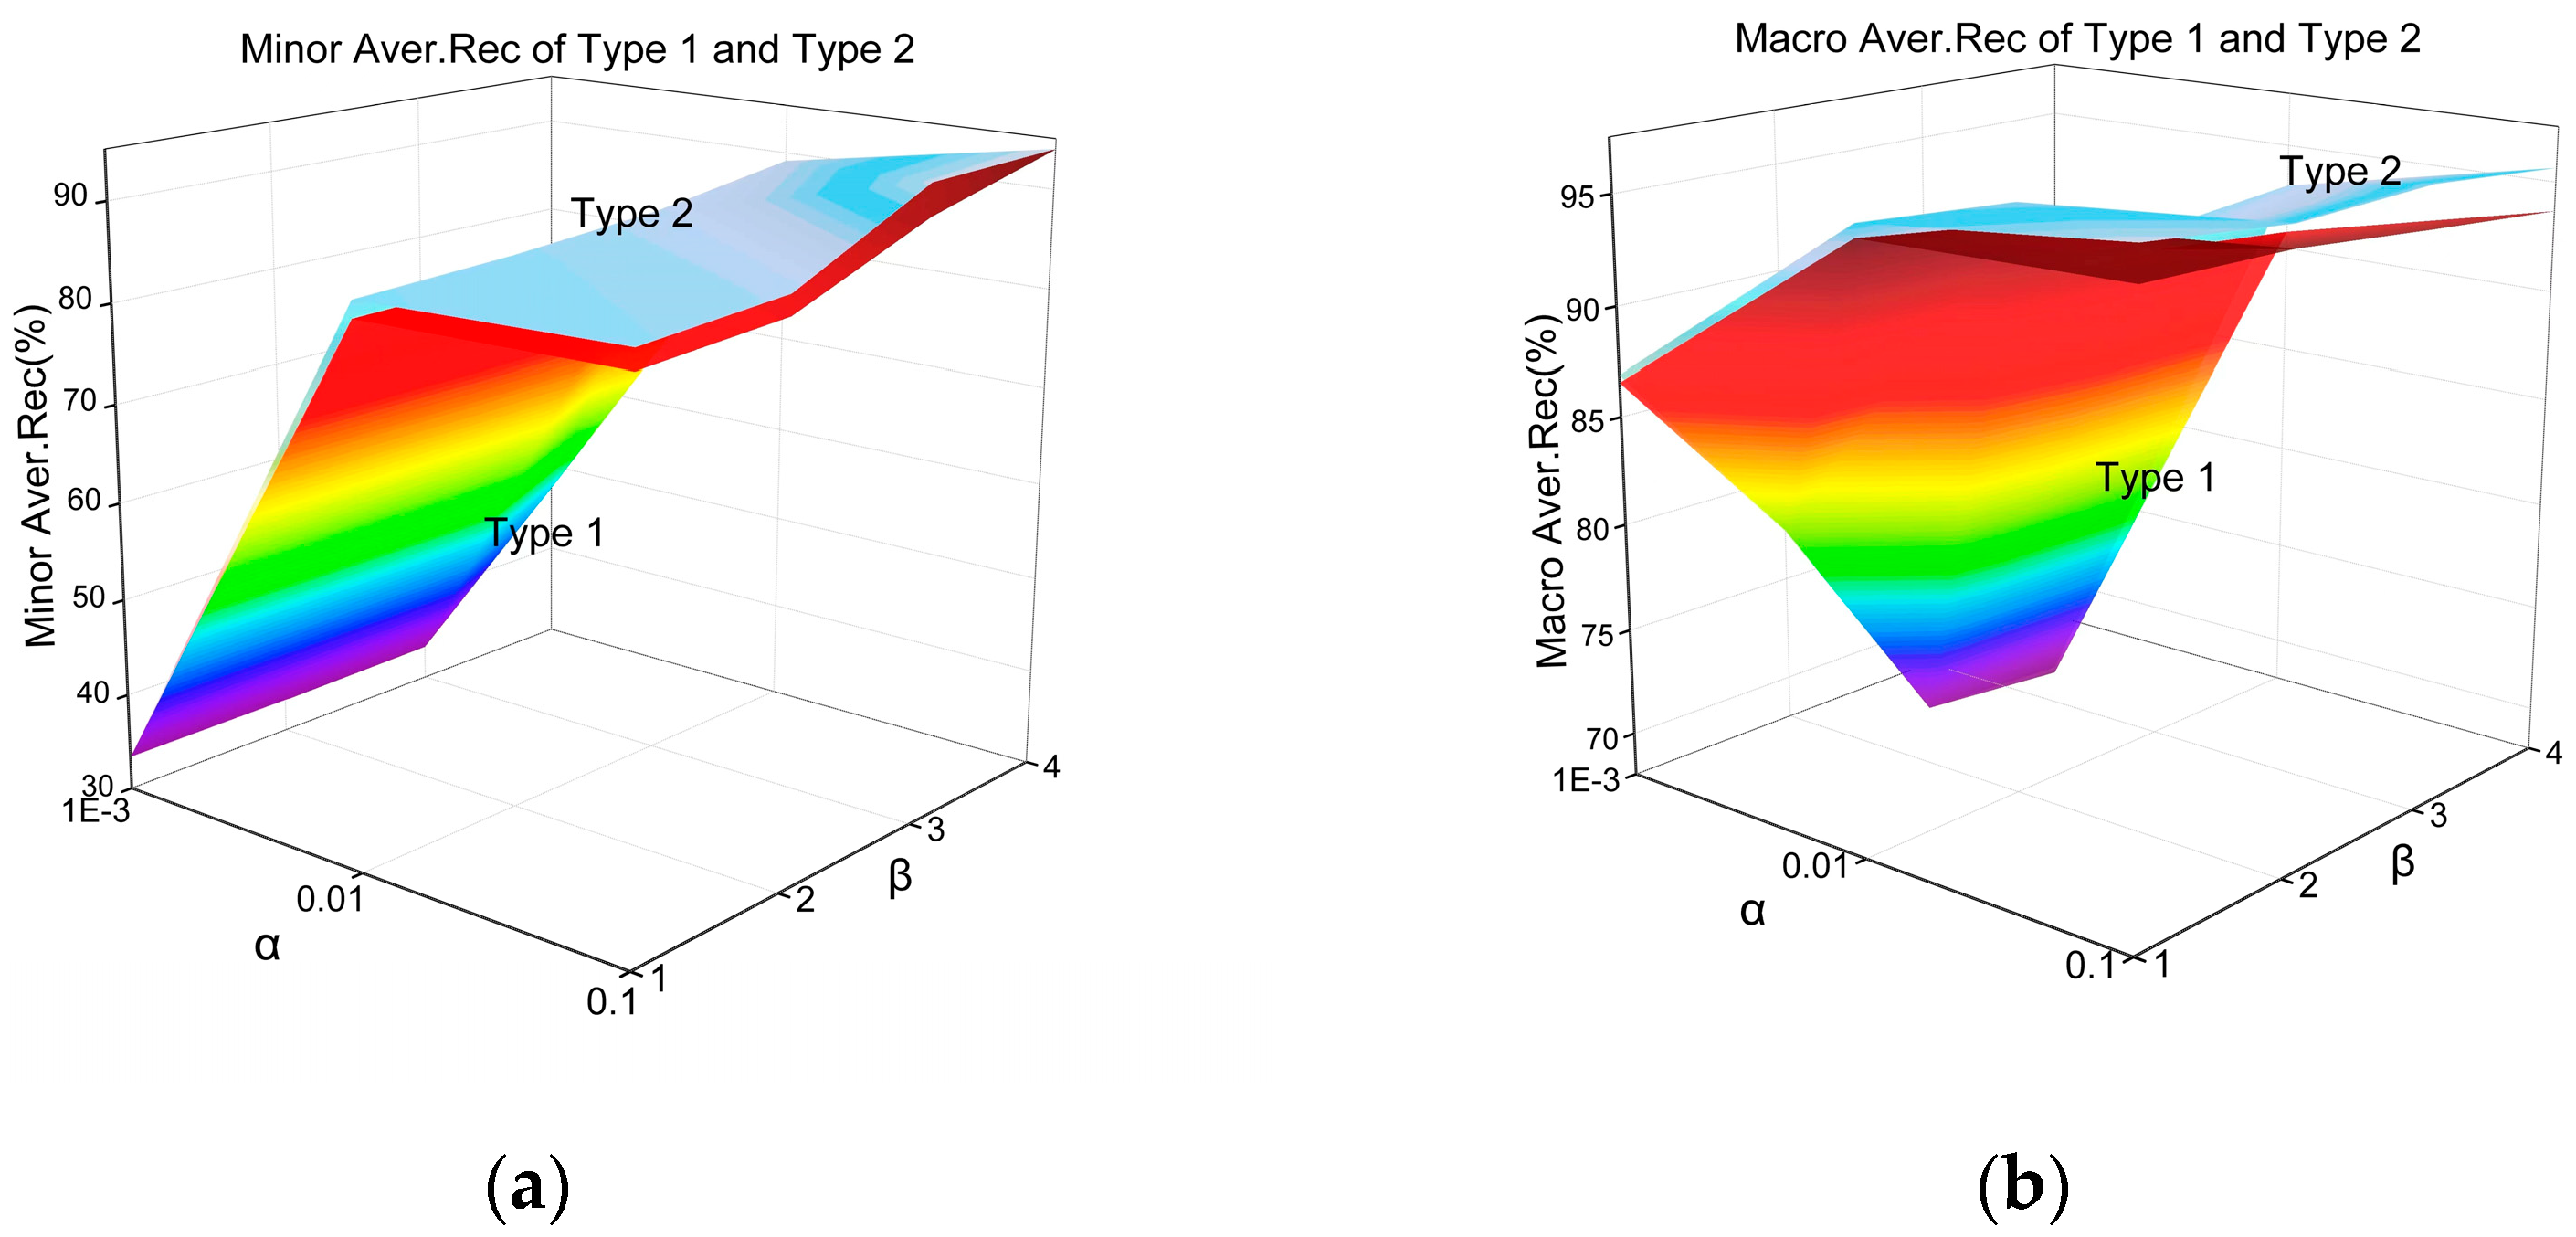
As shown in
Figure 8 and
Figure 9, with the decrease in
, the degree of data imbalance intensifies, the average performance of minority categories and the overall average performance shows a downward trend, which is also true when
. With the increase of
, the class number of minority categories increases, while the class number of majority categories decreases. Accordingly, the average performance of minority categories in Type 1 and Type 2 both increase. The overall performance of Type 1 and Type 2 decrease. The above is also consistent with the conclusion in
Section 4.
The larger is, the higher the partial balance of minority categories is. The better the average performance of minority categories is, the worse the overall performance of Type 1 is. The higher the partial balance of the minority class is, the better the average performance of the minority class will be.
Therefore, the conclusions can be summarized in the classification performance of Type 1 and Type 2 being different. For the average performance of minority classes and the overall classes, Type 2 is better than Type 1.
5.2. Strategy Validation for Improving Classification Performance
From
Section 4, it can be seen
and
can affect the classification performance of the minority classes and overall classes. To further verify this conclusion, several classical algorithms based on the data level are used to conduct experimental comparison and validation.
5.2.1. Experimental Setup
The oversampling strategy and the undersampling strategy are used on the Moore dataset. The categories WWW, MAIL and BULK are regarded as majority classes, MULT, INT and GAME are regarded as minority classes, and the other four categories are medium classes. The detailed experimental settings are shown in
Table 8. Exp. No. 1 is the original imbalanced Moore dataset. Oversampling is achieved by increasing the sample size of minority classes and the changed parameter is
. When undersampling acts on majority classes, the changed parameter is
. When undersampling acts on medium classes, the changed parameter is
. Random Forest classifier is used to perform classification experiments. Each experiment takes the statistical average results by repeating 50 times.
5.2.2. Experimental Results
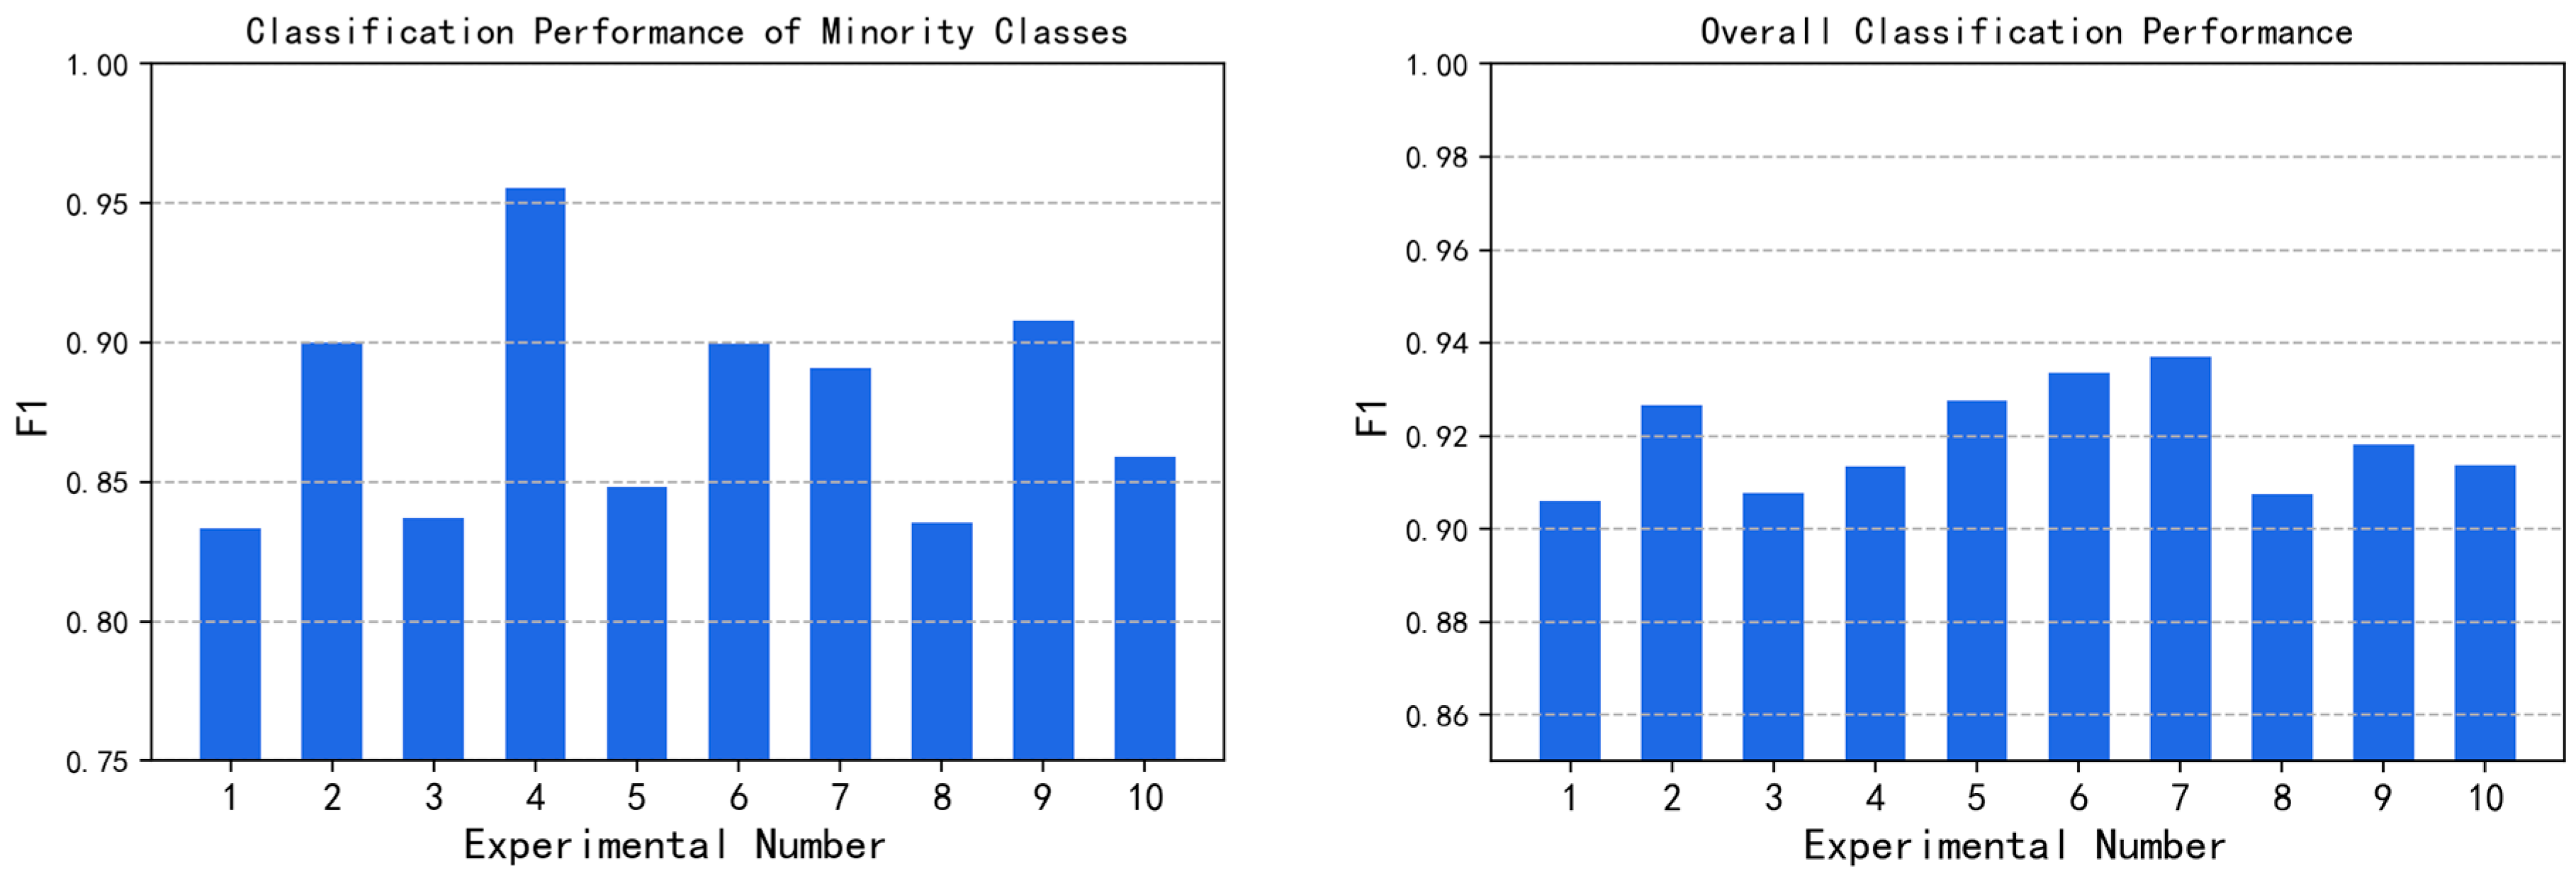
As shown in
Figure 10, in Exp. No. 1, the F1-score of the minority classes is 83%, and that of the overall classification performance is 91%. By using different algorithms to adjust the parameters, the classification performance of minority classes can be effectively improved. In Exp. No. 4,
is changed by using the ADASYN algorithm. After oversampling, the classification performance of minority classes reaches 96%, which is 13% higher than that of the original imbalanced dataset. The improvement is most obvious. In addition, the algorithms of different strategies can not only improve the classification performance of minority classes but also effectively ensure the overall classification performance. The experiment proves the rationality of the conclusions in
Section 4.
Because of the different application scenarios of network data, the categories concerned are different, and the performance indicators focused on are also different. For example, network traffic classification is required for network bandwidth allocation and network resource scheduling, instead of being concerned with the performance of a specific category. Therefore, the overall classification performance should be given much attention. In intrusion detection, malicious traffic as minority classes needs to be paid more attention so that the classification performance of minority classes becomes more important. Therefore, the classification performance of minority classes and overall classes can be improved by changing and . Specifically, undersampling for the majority classes or medium classes can be carried out; or oversampling for the minority classes can be carried out.
6. Conclusions
In the existing research on data imbalance, most studies used the ratio between majority classes and minority classes of the dataset to describe the features of data imbalance, but neglected medium categories. Through analyzing the actual dataset, we find that medium categories have a significant impact on the classification performance. Therefore, we propose partial balance, firstly, in the field of network traffic classification. We define Class Number of Partial Balance (β) and Balance Degree of Partial Samples (μ) to describe the class number of partial balance and the degree of partial balance, respectively. Combined with Global Slope (α), a parameterized model is put forward to depict data imbalance.
By using three machine learning classification algorithms on two classical network traffic datasets, we clarify the factors affecting classification performance. Experimental results show that the lower , the worse the classification performance of the minority classes and overall classes. When of dominant categories increases, the classification performance of minority classes decreases. The lower , the better the average performance.
Based on these conclusions, the classification performance of minority classes and the overall classes can be improved through adjusting and , which can be achieved by resampling strategies. Therefore, we propose that undersampling for majority classes or medium classes, or oversampling for minority classes, can be conducted to improve classification performance. Experiments on several classical sampling algorithms verified the feasibility of the proposed strategies.
There are still some limitations. The experiments were not conducted on the datasets of other fields, such as the well-known image datasets MNIST, CIFAR, etc. On different datasets, the same parameter may result in different classification performance.
In future work, deep learning methods can be considered for oversampling, such as Generative Adversarial Networks. When conducting resampling, the sampling degree at which the classification performance is best remains to be further studied. Furthermore, under imbalanced conditions, the problem of unlabeled data and concept drift need to be further discussed.


