Abstract
The Industrial Internet of Things (I-IoT) is a manifestation of an extensive industrial network that interconnects various sensors and wireless devices to integrate cyber and physical systems. While I-IoT provides a considerable advantage to large-scale industrial enterprises, it is prone to significant security challenges in the form of sophisticated attacks such as Advanced Persistent Threat (APT). APT is a serious security challenge to all kinds of networks, including I-IoT. It is a stealthy threat actor, characteristically a nation-state or state-sponsored group that launches a cyber attack intending to gain unauthorized access to a computer network and remain undetected for a longer period. The latest intrusion detection systems face several challenges in detecting such complex cyber attacks in multifarious networks of I-IoT, where unpredictable and unexpected cyber attacks of such sophistication can lead to catastrophic effects. Therefore, these attacks need to be accurately and promptly detected in I-IoT. This paper presents an intelligent APT detection and classification system to secure I-IoT. After pre-processing, several machine learning algorithms are applied to detect and classify complex APT signatures accurately. The algorithms include Decision Tree, Random Forest, Support Vector Machine, Logistic Regression, Gaussian Naive Bayes, Bagging, Extreme Gradient Boosting and Adaboost, which are applied on a publicly available dataset KDDCup99. Moreover, a comparative analysis is conducted among ML algorithms to select the appropriate one for the targeted domain. The experimental results indicate that the Adaboost classifier outperforms the others with 99.9% accuracy with 0.012 s execution time for detecting APT attacks. Furthermore, results are compared with state-of-the-art techniques that depict the superiority of the proposed system. This system can be deployed in mission-critical scenarios in the I-IoT domain.
1. Introduction
Industrial Internet of Things (I-IoT) refers to unified sensors, computer systems that are a multitude of networked domains connected through the industrial enterprise applications. It is an evolution of Distributed Control System (DCS) that allows higher automation by using cloud computing to optimize industrial process controls. As industrial intelligent sensor systems process terabytes of data daily, I-IoT positions itself at a crucial stage, where prediction accuracy is of utmost importance. Industrial enterprises are massively adopting I-IoT to induce automation for efficiency enhancement with faultless monitoring of resources and reducing safety risks to enterprise wide networks [1]. As the world’s I-IoT market is expected to reach well over 1.1 trillion dollars by 2026, its adoption rate has also been phenomenal, reaching up to 25% of consumer sectors worldwide [2]. Figure 1 shows the worldwide increasing I-IoT adaptation rate projection till 2025.
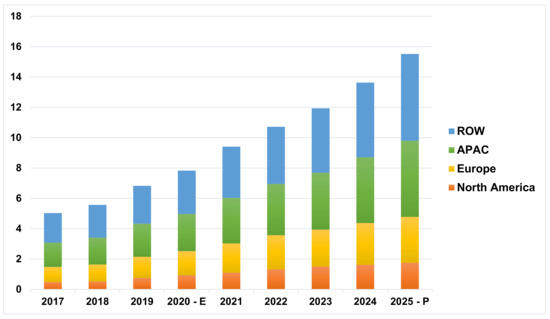
Figure 1.
Worldwide I-IoT adaptation rate [3].
According to a survey [4], 8% of organizations around the world experienced cyber attacks targeting I-IoT systems from 2018 to 2021.The UK stood at 86%, Japan with 64%, whereas 84% of healthcare organizations, 79% of manufacturing and production organizations and 78% of transport organizations worldwide experienced cyber attacks on their I-IoT network in the same period. A cyber attack on the I-IoT network comes with various threats having different scales and sizes from different threat actors [5]. Generally, various levels of the attacks including cyber warfare (top-level), cyber espionage (mid-level) and cyber-crime (low-level) may be launched on organizations [6]. The main targets of such attacks are switches, sensors, CCTV cameras that constitute the machine-to-machine (M2M) and industrial communication networks [7,8]. Moreover, industrial installations have geographically dispersed infrastructures; this provides a greater horizon for the cyber adversaries to inflict maximum damage to industrial infrastructure [9,10,11,12,13,14].
I-IoT provides phenomenal opportunities to enterprise organizations; however, many security challenges also persist in realizing the prospects offered by this domain. These security challenges not only pose a threat to an individual but also cause enterprise wide operational failure with catastrophic effects. The I-IoT system is confronted with the following core security challenges [15,16,17]:
- Resource Constraint: I-IoT has restricted capability in computing that often makes anomaly detection difficult.
- Limited Communication: Compared to traditional devices, I-IoT devices generate very little traffic with limited user interaction.
- Cyber Security: I-IoT devices are prone to various cyber security challenges. With new sensors, intelligent devices frequently emerging rapidly, they are faced with multiple vulnerabilities ranging from simple to complex types of cyber attacks.
- Integration: In I-IoT devices, the integration of information technology (IT) and operational technology (OT) is difficult. Therefore, it is essential to securely integrate them without compromising data.
- Data Storage: I-IoT devices have less storage capacity, which hinders security updates in the form of security patches.
I-IoT systems are mission-critical systems with security limitations. Therefore, it is essential to develop a real time security monitoring mechanism that focuses on preventing unauthorized and malicious users in industrial critical systems. The conventional security models are generally based on cryptographic techniques that require more processing time to process a large amount of data to identify complex threats such as APT. So, such models are not widely adopted for I-IoT environments due to their large voluminous data size. It is required to identify the security threats promptly that may help to take the necessary actions for minimizing the damage. By identifying the APT data traffic in the I-IoT domain, organizations deploying I-IoT sensors may defend their most valuable assets and data from digital disruption in an industrial processing unit.
In this paper, a machine learning based intelligent detection and classification system is proposed that identifies APT data traffic in the I-IoT domain. Several machine learning classifiers such as Decision Tree (DT), Random Forest (RF), Support Vector Machine (SVM), Logistic Regression (LR), Gaussian Naive Bayes (GNB), Bagging, Extreme Gradient Boost (XGBoost) and Adaboost are applied to successfully detect and classify the APT signature traffic.To develop and evaluate the performance of the proposed system, a publicly available dataset KDDCup99 is used. A comparative analysis is performed among machine learning techniques and results indicate that the Adaboost classifier outperforms the others with 99.9% accuracy with an execution time of 0.012 s for detecting APT attacks, thus making it suitable for use in I-IoT domain.
The rest of the paper is organized as follows: Section 2 describes various phases of APT and its behavior in I-IoT networks. The literature review is illustrated in Section 3. Section 4 presents the proposed APT detection methodology. Section 5 presents the experimental analysis. Section 6 concludes the paper and suggests the future directions of the research.
2. APT in I-IoT Networks
The APT attack in the I-IoT network outlines various methodical attack phases in the core network. The Supervisory Control and Data Acquisition (SCADA) system is the underlying major hardware component of the I-IoT ecosystem, mainly comprised of an organized entity primarily used to monitor the various industrial core processes. A typical I-IoT SCADA system is shown in Figure 2.
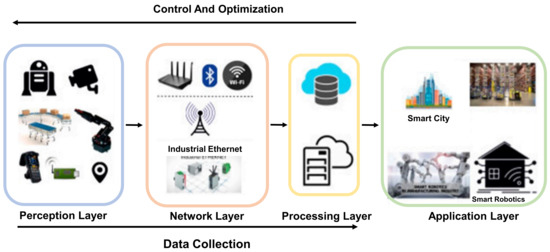
Figure 2.
A typical I-IoT SCADA system [18].
The core system of any I-IoT network is composed of the physical layer that includes sensors, actuators and control systems. The network layer consists of wired or wireless communication media, the processing layer houses the core information processing systems and the application layer collects and transmit information from the communications stack [19].
The APT attacks have four significant characteristics, which make them different from regular cyber attacks. Being complex, persistent, targeted and elusive, APT attacks are precisely planned and systematically launched in multiple stages [20]. Stuxnet attack on the Iranian nuclear facility and Shamoon malware attack on the Saudi Aramco facility as well as Sauron, CopyKittens, Volatile Cedar and ShellCrew are a few examples that made headlines in the research community [21]. Typical attack phases of APT in I-IoT are illustrated in Figure 3.
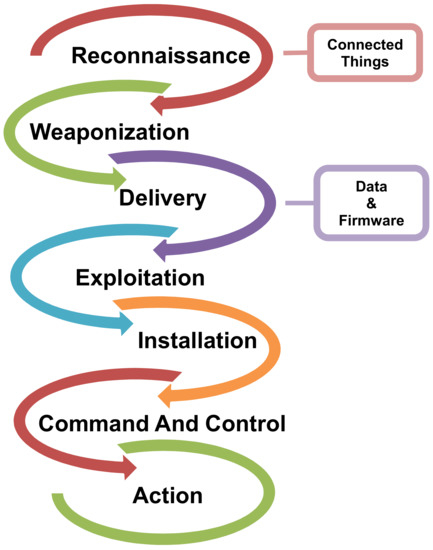
Figure 3.
APT Attack phases in I-IoT.
The attack surface of APT starts with the reconnaissance activities such as probing the target industrial network for vulnerable and exploitable components before actually breaching the network. This task is carried out by collecting information about the intended target network by searching the internet for general information about the industrial network or through social engineering tools used for propagation. In the second phase of weaponization, the attacker creates an infected document paired with a customized phishing email or by using a new strain of self-replicating malware to be distributed through wi-fi, USB and other means for point of entry into the core network. The delivery phase involves the transmission of the malware to the intended industrial network where corresponding account and password management measures are weak. This provides an appropriate door to intrusion. In the exploitation phase, the actual manifestation of the attack takes place by exploiting the target network through infiltrated malware. In the installation phase, the attacker installs the APT malware in target machines of the processing layer. The Command and Control (C&C) phase is the post compromised layer through which the infected systems are controlled by the C&C system that mostly resides outside the network for the cyber attacker to gain control of the compromised network. The communication between the host and the C&C system is usually encrypted. The actions on objectives or data ex-filtration phase involves the cyber attacker establishing access to the organization and executing actions to achieve its objectives, which is usually ex-filtration of high valued data. An APT attack scenario is presented in Figure 4.
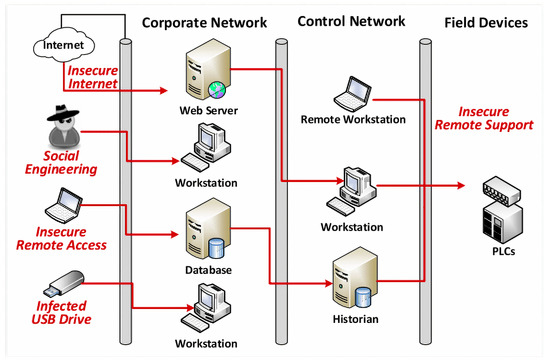
Figure 4.
APT attack scenario [22].
3. Related Work
Efficient classification and detection of benign and malicious feature traffic forms the core foundation of any malware detection system. However, accurate classification of APT attacks, especially within the I-IoT domain, is a challenging task. Many pieces of research have been made on security and intrusion detection systems in the domain of I-IoT networks.
Teyou et al. [23] classified anomaly data traffic in the cyber physical system environment by implementing a Convolutional Neural Network (CNN) based Intrusion Detection System (IDS). The classification model uses the NSL-KDD dataset and its performance is evaluated and compared with the state of the art. The model gave an accuracy of 80.07% and 77.15%, respectively, on the 2 and 5 class classification models. Due to the complexity and resource constraint environment, CNN does not seem suitable for I-IoT and the model performance can be further enhanced to deploy IDS in a real time environment. The approach used five attack classes of the dataset that can be applied to all seven APT phases. Latif et al. [24] proposed a cyber security attack prediction system based on a lightweight random neural network (RaNN) for the I-IoT domain. They targeted malicious operation and control, denial of service (DoS), scan, spying, data type probing and wrong setup attacks. The DS2OS dataset was used for the development of the system comprising seven attack classes that are mapped to seven APT attack phases. The experimental results showed that the system gave 99.20% accuracy with a 0.01 learning rate.
Wang et al. [25] analyzed the features of Command and Control (C&C) in APT and found that HTTP based C&C is quite useful. Moreover, they proposed a new independent access feature and applied it to the DNS records. The public dataset has been applied to validate the proposed approach. The drawback of this approach is that it can easily be evaded when the infected hosts connect to the C&C domains while connected to the malicious server. Brogi et al. [26] proposed a framework known as TerminAPTor, which is an APT detector that highlights links between the traces left by attackers in the monitored system during the diverse stages of an attack campaign. TerminAPTor used the Information Flow Tracking (IFT) to tackle this challenge by correlating generated events in each APT step in a statistical manner. Sigholm et al. [27] proposed a Data Leakage Prevention (DLP) approach that targeted the data exfiltration phase of the APT attack cycle. The DLP scheme processed the network traffic to detect data leaks and generate matching signatures of the leak. This system exploited external cyber counterintelligence (CCI) sensors to track the location and path of the data exfiltration. The approach targeted only the last phase; the data exfiltration of an APT cycle and does not counter the first six phases of the APT life cycle and cannot achieve real time detection.
Cheng et al. [28] presented a cyber situation comprehension framework called APTALCM (APT Alerts and Logs Correlation Method) for edge commuting IoT system devices that are based on APT alerts and correlation of logs on a simulated dataset. Based upon the concept of alert instance, the approach considered only Phases 2, 3, 5 and 6 (Point of Entry, C&C communication, data discovery and data exfiltration). The approach achieved 83.7% TRP and 4.2% FPR. The drawback of this approach is that it did not cover Phases 1 and 4 (Reconnaissance and Exploit) of the APT cycle. Parra et al. [29] proposed a cloud based distributed DL framework for detecting phishing and botnet attacks in the IoT domain. The experimental results provided accuracy of 94.30% and 94.80%, respectively, on the N_BaIoT dataset. The dataset is composed of 10 attack classes related to Botnet targeting IoT devices that covers all seven APT attack phases.
Zheng et al. [30] proposed a linear discriminant analysis based extreme learning technique for IoT intrusion detection. Researchers evaluated the technique on the NSL-KDD dataset. The accuracy of their approach was 92.35% and used four main attack classes, i.e., DoS, Remote to Local (R2L), User to Remote (U2R) and probe attack covering all seven APT phases. Khalvati et al. [31] implemented a system to detect and classify IoT attacks using SVM and Bayesian ML algorithms. The authors achieved an accuracy of 91.50% on the KDDCup99 dataset. The approach targeted four attack classes that cover all seven APT phases. Ghafir et al. [32] presented an autonomous system for the detection of APT signatures. The system is composed of three layer detection, i.e., threat detection, alert correlation and attack prediction that provided an accuracy of 84.4%. The system needs to be tested for real time APT signature covering all seven phases of the APT life cycle.
Shudong et al. [33] proposed an attribution classification method of APT malware in IoT using the ML approach. The method analyzes samples, pre-processes the acquired behavioral data, constructs a behavioral data set of malware samples, then uses the TF-IDF method to perform the feature representation forming a vector matrix and calculates the chi-square value of the high latitude feature vector to perform feature selection. SMOTE-RF model is used in the multi-class model to train and test sets for predicted output with accuracy of 80%. Table 1 summarizes the APT specific related work.

Table 1.
Summarized related work.
It is observed from the existing literature that many intrusion detection systems are available but they cannot accurately classify modern threat signatures on mission critical systems. The existing intrusion detection techniques can be categorized into three categories based on their working principle, i.e., machine learning (ML) based approaches, deep learning based approaches and autonomous approaches that are deployed in different domains, including IoT and I-IoT domains. The publicly available datasets KDDCup99, NSL-KDD and simulated dataset have been utilized mostly for the development and evaluation of detection schemes. These datasets have widely been used to facilitate specific applications of IoT as well as I-IoT domains. Analysis of the above mentioned approaches suggests that deep learning based approaches demand high processing power and storage capacity to identify complex threats such as Advanced Persistent Threats (APT). These are the prime reasons for not making them first choice for developing intrusion detection systems for I-IoT environment. The main issue with autonomous approaches is that they are not scalable. The machine learning based approaches are highly scalable because of their capability to process huge amounts of data and perform massive computations in a cost- and time-effective manner. This positively affects the productivity (fast deployment).
Moreover, it is observed that existing APT detection approaches are not appropriate for the I-IoT domain because of the large voluminous data size that is generated by the system. Furthermore, the existing research work is not compatible with resource constraint edge devices of I-IoT. Therefore, it is required to develop a computationally efficient APT attack system for I-IoT networks that promptly identifies the security threats.
4. Methodology
In light of the above discussion, the main objective of the present research is to propose a novel lightweight and fast ML based APT signature classification system that can detect and predict malicious nodes using various conventional ML algorithms on publicly available KDDCup99 datasets specifically suitable for the I-IoT domain. The proposed system for APT detection and classification for the I-IoT domain is presented in Figure 5. It consists of data acquisition, pre-processing, prediction and performance evaluation phases. These phases are discussed in the following subsections:
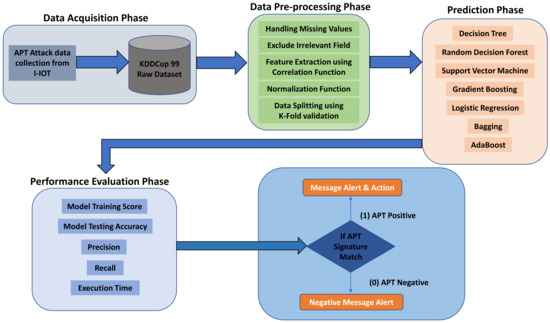
Figure 5.
Block diagram of the proposed system.
4.1. Data Acquisition Phase
In this phase, the publicly available dataset KDDCup99 is used to develop the proposed system [34]. This dataset is widely used for classification and clustering problem handling for the development of IDS. It was developed by the Cyber Systems and Technology Group of MIT Lincoln Laboratory in 1999 to evaluate computer network IDS and is composed of 4,94,021 single-labeled connection vectors, each containing 42 features. The simulated network traffic can be classified into the following categories:
- Normal
- Probing Attack
- Distributed Denial of Service Attack (DDoS)
- Remote to Local Attack (R2L)
- User to Root Attack (U2R)
The attacks mentioned above occur when an attacker sends packets to an I-IoT node over a network. It aims to exploit vulnerability persistent in the node to gain access and perform network reconnaissance to gather information about the network. The apparent purpose of these types of attacks is to circumvent the security controls of the system. Cyber adversaries use similar attack classes to launch a successful APT attack on their targeted I-IoT network [35]. The attack classes mapped to their corresponding APT attack phase are presented in Table 2.
Table 2.
Attack classes and types.
4.2. Data Pre-Processing Phase
Data pre-processing of the dataset is an imperative phase that leads to cleaning the data and making it more meaningful for the classification model to get better accuracy. The following steps were carried out in the data pre-processing phase:
4.2.1. Resolving Missing Value
Analysis of dataset for missing values is a first step towards pre-processing. No missing values were observed in the dataset.
4.2.2. Exclusion of Irrelevant Fields
The only relevant target attributes of APT are selected. Those attributes that do not contribute to the prediction of the attack are excluded by applying the Principle Component Analysis (PCA) technique. The attributes that contribute to the prediction of APT signatures are illustrated in Table 3.
Table 3.
Feature Selection and Extraction.
4.2.3. Feature Selection and Extraction
The Pearson correlation coefficient (PCC) technique is used for feature extraction because the study shows [36] that it consistently generates the best results among different sample sizes with an area under the receiver operating characteristics curve (AUC), to be as high as 0.975. The AUC is the best measurement which is independent of the precise threshold. Figure 6 shows that the PCC technique outperforms the PCA technique for the anomaly based dataset. PCA is a data analysis descriptive and adaptive tool used for dimensionality reduction and widely used in describing the variation and covariance arrangement of a set of variables through linear permutation.
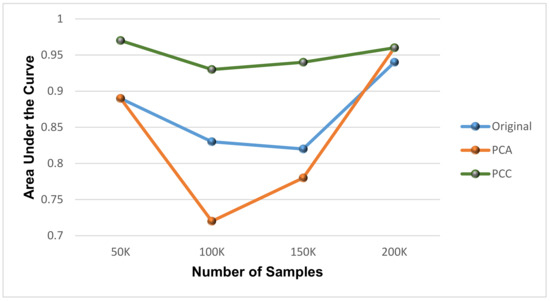
Figure 6.
Comparison of PCC with PCA technique.
4.2.4. Data Normalization
As a pre-processing procedure, the dataset is statistically analyzed to check the normality of the dataset being used by the classifiers. It ensures high prediction results for deploying the ML algorithms. It also helps in noise reduction and outlier removal. In this step, the dataset is checked through a series of features, including data having an asymmetric bell shape. The mean and median are both equivalent and centrally distributed. About 68% of data lies within 1 Standard Deviation (SD). As the dataset fulfills all features, the dataset is normally distributed. Figure 7 illustrates the covariance matrix plot of chosen attributes. The covariance matrix is an efficient method for selecting features and reducing dimensions [37].
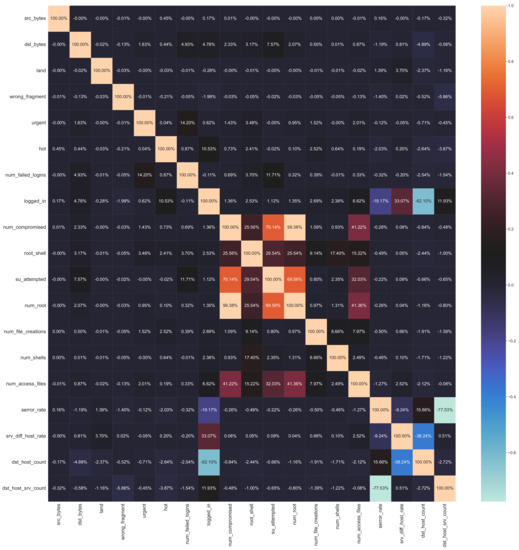
Figure 7.
Selected features covariance matrix.
4.2.5. Bi-Variate Data Visualization
The t-Distributed Stochastic Neighbor Embedding (tSNE) plot is used to understand high dimensional data and project it into low dimensional space like 2D. It is a non-linear technique for reducing dimensionality suited for visualization of elevated dimension datasets [38]. Figure 8 and Figure 9 describe the bivariate analysis of the KDDCup99 dataset with two different perplexities and levels of iteration. For the dataset, both graphs illustrate that the dataset is not linearly separable.
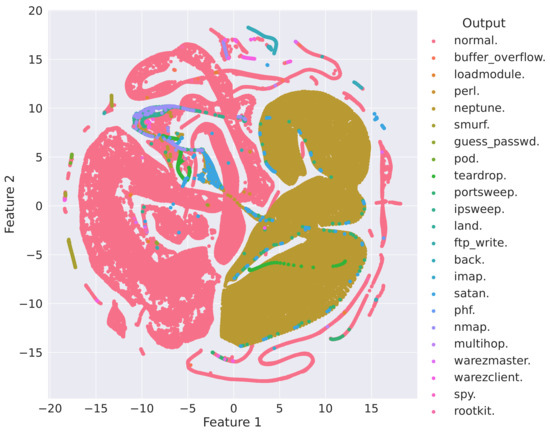
Figure 8.
t-SNE plot with 100 perplexity and 500 iteration levels.
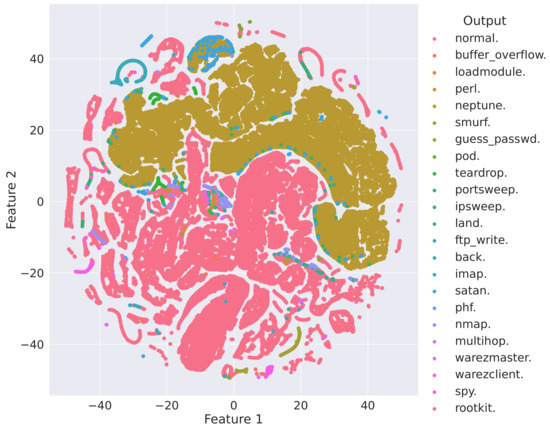
Figure 9.
t-SNE plot with 50 perplexity and 1000 iteration levels.
4.2.6. Dataset Splitting
This phase of the dataset involves the splitting of the dataset into training and testing data. The train–test split approximates the performance of ML algorithms used to predict the data attributes not used to train the model. The K-fold validation method is applied to split the data into test and train parts. At first, the dataset is shuffled to make the inputs and outputs completely random. This is done to ensure that the inputs are not biased.
4.3. Prediction Phase
After the pre-processing phase, the dataset is ready to train and test the classification models. In this work, eight classification models are used for APT prediction, including Decision Tree, Random Forest, Support Vector Machine, Logistic Regression, Gaussian Naive Bayes, Bagging, XGBoost and Adaboost.
4.4. Performance Evaluation Phase
This phase involves the performance evaluation of the classifiers based on different performance measures including model training score, accuracy, precision, recall, F-measure and model execution time.
4.4.1. Model Training Score
Model training score demonstrates how perfectly and accurately training data fits the model. This phase is carried out on training data before the execution of the model on testing data. The training score closer to 1 yields the best-fit model.
4.4.2. Accuracy
Accuracy is a benchmark to assess the classification models. It measures the fraction of predictions that have been accurately classified. The accuracy of the model is calculated according to Equation (1) [39].
4.4.3. Precision, Recall and F1-Score
Precision is defined as the benchmark that measures the number of a correct optimistic predictions made that calculate the accuracy for the minority class. Equation (2) defines the precision [40].
The outcome is a value between 0.0 for no precision and 1.0 for full or ideal precision. The recall is a benchmark that quantifies the number of accurate optimistic predictions made from all positive predictions that could have been made. Equation (3) defines the recall [40].
The outcome is a value between 0.0 for no recall and 1.0 for full or ideal recall.
F-measure or F1 score combines precision and recalls into a sole measure that inculcates both properties. It is the harmonic mean of the two fractions and is illustrated in Equation (4) [40].
5. Experimental Analysis
For experimental analysis, Scikit learns python library is used along with GridSearchCV (cross-validated grid-search over a parameter grid) for determining optimal hyper-parameters from a given range for a particular machine learning model. Simulation is performed on a machine with Intel 1.70 GHz Core i7 CPU and 8 GB of RAM. Several ML classification algorithms were used to classify the data into the APT or normal type of analogous traffic. The following subsections explain the performance of classifiers.
5.1. Decision Tree
This is a supervised learning algorithm that is used for solving regression and classification problems [41]. The input parameters for the decision tree algorithm are listed in Table 4. Figure 10 shows the confusion matrix for the DT classifier. The labels on the x-axis show predicted results, whereas the y-axis refers to actual results. The DT model’s average accuracy is 96.6%, with a 1.021 s execution time.
Table 4.
Input Parameters for Decision Tree.
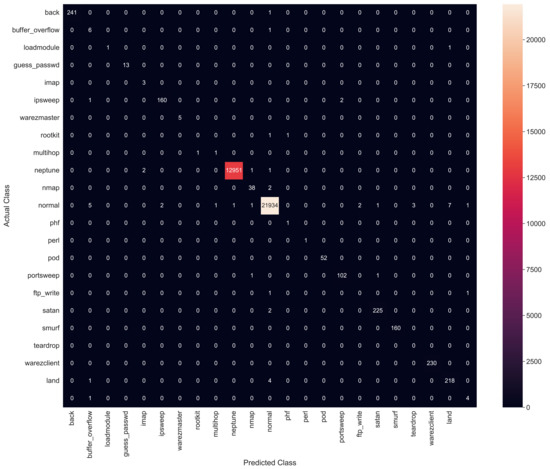
Figure 10.
Confusion matrix for Decision Tree.
5.2. Random Forest
Random Forest is an ensemble learning algorithm that constructs numerous decision trees on various sets of features. It is widely used for classification and regression problems by constructing a multitude of DT during the training phase and generating results that are the mean prediction of each tree. They are well suited for the ensemble domain as they are fast and stable concerning the creation of synergy in the decision tree or forest. In this method, the technique uses trees that arbitrarily choose the attributes to divide the data [42]. Furthermore, this method has better accuracy than standard entropy reducing DT on many datasets in a large ensemble domain. The ensemble learning technique is specifically developed to aggregate the results of numerous decorrelated decision trees that are collected in a forest and classify the output results. RF is then trained using training data against the test dataset. Table 5 shows the input parameters for Random Forest classifier. After applying the classifiers, the experimental prediction accuracy of 98.5%, with an execution speed of 1.092 s, is achieved. Figure 11 shows the confusion matrix for RF.
Table 5.
Input Parameters for Random Forest.

Figure 11.
Confusion matrix for Random Forest.
5.3. Support Vector Machine
This is a linear supervised ML algorithm that analyzes high-dimensional and sparse data for pattern recognition, classification and regression [13,43]. SVM has been applied to classify heterogeneous data of the proposed dataset, as we consider our problem to be in line with multi-class pattern classification. Each data sample is classified into two categories, i.e., regular traffic and APT or malicious data. The model can solve linear and non-linear classification problems by creating a hyper-plane that segregates data into classes. The input parameters for SVM classifier are listed in Table 6. After applying the classifiers, the experimental prediction accuracy is 98.7%; an execution speed of 0.976 s is achieved. Figure 12 shows the confusion matrix of results by applying SVM classifiers.
Table 6.
Input Parameters for SVM.
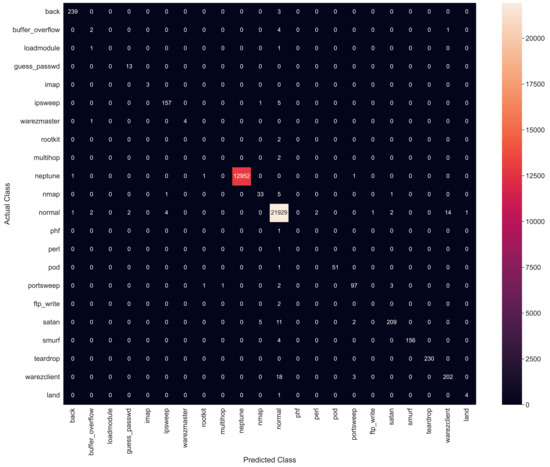
Figure 12.
Confusion matrix for Support Vector Machine.
5.4. Logistic Regression
This is a supervised ML algorithm used for classification and regression problems [44]. The input parameters for the Logistic Regression algorithm are listed in Table 7. The average observed detection accuracy in LR is 98.5%, with an execution time of 2.954 s. Figure 13 shows the confusion matrix of results by applying LR classifiers.
Table 7.
Input Parameters for Logistic Regression.
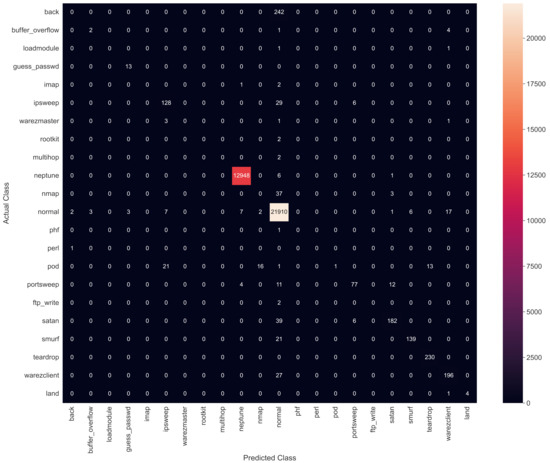
Figure 13.
Confusion matrix for Logistic Regression.
5.5. Gaussian Naive Bayes
This algorithm is based upon a probabilistic approach. A prior and posterior probability calculation of the classes in the dataset is involved in this type of ML algorithm [45]. The input parameters for the GNB classifier are listed in Table 8. The model accuracy of GNB classifiers has been observed as 97.2%, with an execution time of 0.145 s. Figure 14 shows the confusion matrix of results by applying GNB classifiers.
Table 8.
Input Parameters for GNB.
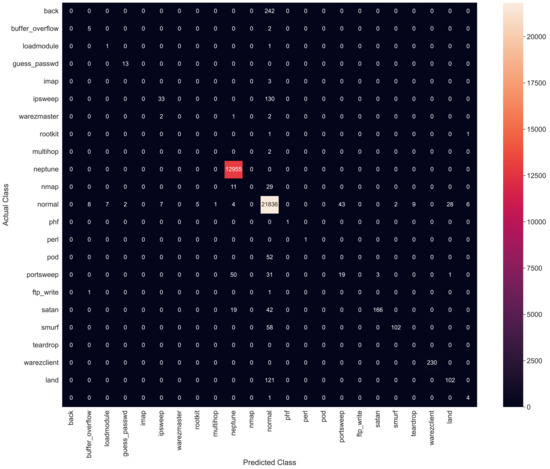
Figure 14.
Confusion matrix for Gaussian Naive Bayes.
5.6. Bagging
Bagging is an ensemble meta-model to improve the stability and accuracy of ML algorithms that form the basis for prediction [46]. In this model, several independent models have been fitted. Bagging has minimal variance as a model, thereby reducing the inherent problem of overfitting [47]. The input parameters for the Bagging algorithm are listed in Table 9. The average observed detection accuracy in bagging is 97.5%, with an execution time of 1.092 s. Figure 15 shows the confusion matrix of results by applying Bagging classifiers.
Table 9.
Input Parameters for Bagging.

Figure 15.
Confusion matrix for Bagging.
5.7. XGBoost
XGBoost is an ML classification technique that is often used in regression to generate a prediction model in the form of an ensemble for weaker prediction models like the decision. It generalizes weaker models by optimization fashion of arbitrary differentiable loss function [48]. The input parameters for the XGBoost algorithm are listed in Table 10. The model accuracy of the XGBoost classifier was observed as 98.7%, with an execution time of 0.985 s. Figure 16 shows the confusion matrix of results for XGBoost.
Table 10.
Input Parameters for XGBoost.

Figure 16.
Confusion matrix for XGBoost.
5.8. Adaboost (An Ensemble Technique)
An ensemble technique is a compound model, which combines multiple low performing classifiers to develop an enhanced classifier. The Adaboost algorithm, as an ensemble approach to the classification models, also known as Adaptive boosting, is highly suited for classification purposes. It combines multiple weaker models to generate one stronger model. The input parameters for the Adaboost algorithm are listed in Table 11. The accuracy of the Adaboost classifier was observed as 99.9%, with an execution time of 0.012 s. Figure 17 shows the confusion matrix for AdaBoost classifiers.
Table 11.
Input Parameters for Adaboost.
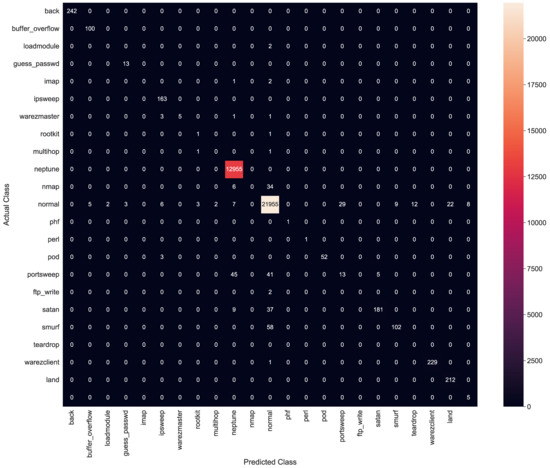
Figure 17.
Confusion matrix for AdaBoost classifier.
5.9. Comparative Analysis
The experimental results for applied classification models in terms of evaluation parameters are listed in Table 12.
Table 12.
Experimental Results.
The results show that Adaboost outperforms others with 99.9%, accuracy and execution time of 0.012 s. While the XGBoost classifier has also yielded promising results of 98.7%, its execution time is comparatively higher than Adaboost. Furthermore, other ML classifiers such as SVM, RF, LR and DT have also performed more or less similarly but not better than XGBoost and Adaboost. Figure 18 shows the comparison among different classifiers.
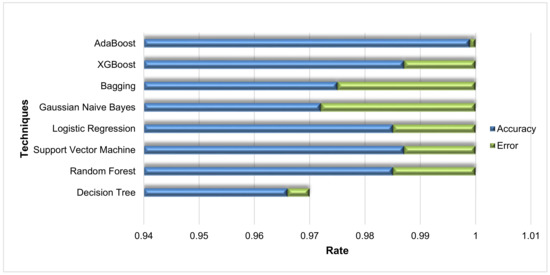
Figure 18.
Classifier comparison based on accuracy.
Therefore, it can be stated that boosting algorithms can positively affect the ML algorithms’ overall performance when classifying complex malware signatures, including the classification of APT data signatures. Table 13 states the comparative analysis of the proposed system with state of the art techniques for APT detection and classification. Results show the superiority of the proposed approach with respect to detection and classification accuracy. Various ML and autonomous approaches have been proposed by different researchers. While Brogi et al. [26] presented a non-ML autonomous approach providing accuracy of 100% TRP, the approach only covers four APT attack phases and that too on a simulated dataset. This approach may not provide an accurate and true representation of APT signatures when deployed on mission critical systems. Contrary to this and other approaches summarized in the table above, minimum computational power is required to process the anomaly data packets in the proposed system, facilitating the overall performance by minimizing comprehensive execution time and computation power consumed by the network that covers all APT attack phases.
Table 13.
Comparison of proposed methodology with existing techniques.
Another main attribute of the proposed system is its scalability, as it is based on machine learning algorithms that make it highly scalable because of its capability to process huge amounts of data and perform massive computations in a cost- and time-effective way. The proposed system can be deployed on the I-IoT gateway to analyze the whole network traffic. This results in high scalability, productivity (faster deployment), modularity and portability.
6. Conclusions and Future Directions
APT is a highly complex and enigmatic attack that targets traditional and enterprise networks such as I-IoT. Such types of attack must be detected at the earliest possible moment, as I-IoT networks are highly sophisticated and an attack on such a network can lead to a catastrophic disaster. This paper presented an intelligent APT detection and classification system for securing I-IoT. After pre-processing, several machine learning algorithms were applied to detect and classify malicious I-IoT nodes prone to APT attacks. To develop a system, a publicly available dataset KDDCup99 is used. The experimental results show that the Adaboost algorithm outperforms the rest of the applied machine learning algorithms by showing 99.9% accuracy, 100% model training score, 99.9% precision, 100% recall and 0.012 s execution time. Moreover, the comparative analysis of the proposed system with state-of-the-art systems depicts its superiority.
In future, the proposed system can be deployed on the I-IoT gateway for real-time traffic analysis of I-IoT networks, including smart cities, smart power plants, smart industries, smart communication systems, etc. The I-IoT gateway is directly connected to the Distributed Control System (DCS) of the I-IoT networks. Whenever a malicious packet is sent into the node that interfaces with the DCS, the system can detect APT traffic signatures and other attack vectors from the regular network traffic that help take the necessary actions to minimize the damage. Furthermore, the arrangement of such methodology may be expanded into other domains, besides I-IoT network, such as SCADA systems to determine new possibilities and limitations imposed by different kinds of datasets.
Author Contributions
Conceptualization, S.H.J.; methodology, S.H.J. and M.B.A.; software, S.H.J. and M.A.; validation, M.B.A. and M.A.; formal analysis, S.H.J. and M.B.A.; investigation, M.A.A.G.; resources, S.H.A.; data curation, K.M. and S.H.A.; writing—original draft preparation, S.H.J.; writing—review and editing, M.A.; visualization, K.M.; supervision, M.B.A.; project administration, M.A.A.G.; funding acquisition, M.A.A.G. All authors have read and agreed to the published version of the manuscript.
Funding
This research work is supported by Data and Artificial Intelligence Scientific Chair at Umm Al-Qura University, Makkah City, Saudi Arabia.
Conflicts of Interest
The authors declare no conflict of interest.
References
- Sisinni, E.; Saifullah, A.; Han, S.; Jennehag, U.; Gidlund, M. Industrial internet of things: Challenges, opportunities and directions. IEEE Trans. Ind. Inform. 2018, 14, 4724–4734. [Google Scholar] [CrossRef]
- Cheng, J.; Chen, W.; Tao, F.; Lin, C. Industrial iot in 5g environment towards smart manufacturing. J. Ind. Inf. Integr. 2018, 10, 10–19. [Google Scholar] [CrossRef]
- Lund, D.; MacGillivray, C.; Turner, V.; Morales, M. Worldwide and regional internet of things (iot) 2014–2020 forecast: A virtuous circle of proven value and demand. Int. Data Corp. (IDC) Tech. Rep. 2014, 1, 9. [Google Scholar] [CrossRef]
- Greengard, S. The worsening state of ransomware. Commun. ACM 2021, 64, 15–17. [Google Scholar] [CrossRef]
- Forestiero, A. Metaheuristic algorithm for anomaly detection in Internet of Things leveraging on a neural-driven multiagent system. Knowl.-Based Syst. 2021, 228, 107241. [Google Scholar] [CrossRef]
- Forestiero, A. Self-organizing anomaly detection in data streams. Inf. Sci. 2016, 373, 321–326. [Google Scholar] [CrossRef]
- Ali, B.; Awad, A. Cyber and physical security vulnerability assessment for iot based smart homes. Sensors 2018, 18, 817. [Google Scholar] [CrossRef] [Green Version]
- Saad, M.; Ahmad, M.B.; Asif, M.; Masood, K.; Alghamdi, M.A. Social Distancing and Isolation Management Using Machine-to-Machine Technologies to Prevent Pandemics. Comput. Mater. Contin. (CMC) J. 2021, 67, 3545–3562. [Google Scholar] [CrossRef]
- Thomson, K.; Von Solms, R.; Louw, L. Cultivating an organizational information security culture. Comput. Fraud Secur. 2006, 2006, 7–11. [Google Scholar] [CrossRef]
- Pedreira, V.; Barros, D.; Pinto, P. A Review of Attacks, Vulnerabilities, and Defenses in Industry 4.0 with New Challenges on Data Sovereignty Ahead. Sensors 2021, 21, 5189. [Google Scholar] [CrossRef]
- Ahmad, M.B.; Akram, A.; Asif, M.; Rehman, S.U. Using Genetic Algorithm to Minimize False Alarms in Insider Threats Detection of Information Misuse in Windows Environment. Math. Probl. Eng. J. 2014, 2014, 12. [Google Scholar]
- Hajda, J.; Jakuszewski, R.; Ogonowski, S. Security Challenges in Industry 4.0 PLC Systems. Appl. Sci. 2021, 11, 9785. [Google Scholar] [CrossRef]
- Oueslati, E.; Mrabet, H.; Jemai, A.; Alhomoud, A. Comparative Study of the Common Cyber-physical Attacks in Industry 4.0. In Proceedings of the International Conference on IoT, Embedded Systems and Communications (IINTEC), Tunis, Tunisia, 20–22 December 2019; pp. 1–7. [Google Scholar] [CrossRef]
- Yeboah-Ofori, A.; Islam, S. Cyber Security Threat Modelling for Supply Chain Organizational Environments. Future Internet 2019, 11, 63. [Google Scholar] [CrossRef] [Green Version]
- Sami, I.U.; Ahmad, M.B.; Asif, M.; Ullah, R. DoS/DDoS Detection for Healthcare in Internet of Things. Int. J. Adv. Comput. Sci. Appl. 2018, 9, 297–300. [Google Scholar]
- Wanasinghe, T.; Wroblewski, L.; Petersen, B.; Gosine, R.; James, L.; De Silva, O.; Mann, G.; Warrian, P. Digital twin for the oil and gas industry: Overview, research trends, opportunities and challenges. IEEE Access 2020, 8, 104175–104197. [Google Scholar] [CrossRef]
- Khan, W.; Rehman, M.; Zangoti, H.; Afzal, M.K.; Armi, N.; Salah, K. Industrial Internet of Things: Recent advances, enabling technologies and open challenges. Comput. Electr. Eng. 2020, 81, 106522. [Google Scholar] [CrossRef]
- Ghosh, S.; Sampalli, S. A survey of security in SCADA networks: Current issues and future challenges. IEEE Access 2019, 7, 135812–135831. [Google Scholar] [CrossRef]
- Mumtaz, S.; Alsohaily, A.; Pang, Z.; Rayes, A.; Tsang, K.; Rodriguez, J. Massive internet of things for industrial applications: Addressing wireless IIoT connectivity challenges and ecosystem fragmentation. IEEE Ind. Electron. Mag. 2017, 11, 28–33. [Google Scholar] [CrossRef]
- Cheng, X.; Luo, Q.; Pan, Y.; Li, Z.; Zhang, J.; Chen, B. Predicting the APT for Cyber Situation Comprehension in 5G-Enabled IoT Scenarios Based on Differentially Private Federated Learning. Secur. Commun. Netw. 2021, 8814068, 14. [Google Scholar] [CrossRef]
- Taylor, P.; Dargahi, T.; Dehghantanha, A. Analysis of apt actors targeting iot and big data systems: Shell crew, net-traveler, projectsauron, copykittens, volatile cedar and transparent tribe as a case study. In Handbook of Big Data and IoT Security; Springer: Cham, Switzerland, 2019; pp. 257–272. [Google Scholar] [CrossRef]
- Fielder, A.; Li, T.; Hankin, C. Defense-in-depth vs. critical component defense for industrial control systems. In Proceedings of the 4th International Symposium for ICS & SCADA Cyber Security Research 2016 (ICS-CSR), Belfast, UK, 23–25 August 2016. [Google Scholar] [CrossRef] [Green Version]
- Teyou, D.; Kamdem, G.; Ziazet, J. Convolutional neural network for intrusion detection system in cyber physical systems. arXiv 2019, arXiv:1905.03168. [Google Scholar]
- Latif, S.; Zou, Z.; Idrees, Z.; Ahmad, J. A novel attack detection scheme for the industrial internet of things using a light-weight random neural network. IEEE Access 2020, 8, 89337–89350. [Google Scholar] [CrossRef]
- Wang, X.; Zheng, K.; Niu, X.; Wu, B.; Wu, C. Detection of command and control in advanced persistent threat based on independent access. In Proceedings of the 2016 IEEE International Conference on Communications (ICC), Kuala Lumpur, Malaysia, 22–27 May 2016; pp. 1–6. [Google Scholar] [CrossRef]
- Brogi, G.; Tong, V. Terminaptor: Highlighting advanced persistent threats through information flow tracking. In Proceedings of the 2016 8th IFIP International Conference on New Technologies, Mobility and Security (NTMS), Larnaca, Cyprus, 21–23 November 2016; pp. 1–5. [Google Scholar] [CrossRef] [Green Version]
- Sigholm, J.; Bang, M. Towards offensive cyber counterintelligence: Adopting a target-centric view on advanced persistent threats. In Proceedings of the 2013 European Intelligence and Security Informatics Conference, Uppsala, Sweden, 12–14 August 2013; pp. 166–171. [Google Scholar] [CrossRef]
- Cheng, X.; Zhang, J.; Chen, B. Cyber situation comprehension for iot systems based on apt alerts and logs correlation. Sensors 2019, 19, 4045. [Google Scholar] [CrossRef] [PubMed] [Green Version]
- Parra, T.; Rad, P.; Choo, K.; Beebe, N. Detecting internet of things attacks using distributed deep learning. J. Netw. Comput. Appl. 2020, 163, 102662. [Google Scholar] [CrossRef]
- Zheng, D.; Hong, Z.; Wang, N.; Chen, P. An improved ldabased elm classification for intrusion detection algorithm in iot application. Sensors 2020, 20, 1706. [Google Scholar] [CrossRef] [PubMed] [Green Version]
- Khalvati, L.; Keshtgary, M.; Rikhtegar, N. Intrusion detection based on a novel hybrid learning approach. J. AI Data Min. 2018, 6, 157–162. [Google Scholar] [CrossRef]
- Ghafir, I.; Hammoudeh, M.; Prenosil, V.; Han, L.; Hegarty, R.; Rabie, K.; Aparicio-Navarro, F. Detection of advanced persistent threat using machine-learning correlation analysis. Future Gener. Comput. Syst. 2018, 89, 349–359. [Google Scholar] [CrossRef] [Green Version]
- Shudong, L.; Qianqing, Z.; Xiaobo, W.; Weihong, H.; Zhihong, T. Attribution Classification Method of APT Malware in IoT Using Machine Learning Techniques. Secur. Commun. Netw. 2021, 2021, 9396141. [Google Scholar] [CrossRef]
- Janarthanan, T.; Zargari, S. Feature selection in unsw-nb15 and kddcup’99 datasets. In Proceedings of the 2017 IEEE 26th International Symposium on Industrial Electronics (ISIE), Edinburgh, UK, 19–21 June 2017; pp. 1881–1886. [Google Scholar] [CrossRef]
- Yang, Q.; Liu, Y.; Chen, T.; Tong, Y. Federated machine learning: Concept and applications. ACM Trans. Intell. Syst. Technol. (TIST) 2019, 10, 1–19. [Google Scholar] [CrossRef]
- Gottwalt, F.; Chang, E.; Dillon, T. Analysis of feature selection techniques for correlation-based network anomaly detection. In Proceedings of the International Conference on Applications and Techniques in Cyber Security and Intelligence, Shanghai, China, 22–24 June 2018; pp. 10–16. [Google Scholar] [CrossRef]
- Hoffbeck, J.; Landgrebe, D. Covariance matrix estimation and classification with limited training data. IEEE Trans. Pattern Anal. Mach. Intell. 1996, 18, 763–767. [Google Scholar] [CrossRef] [Green Version]
- Van der Maaten, L.; Hinton, G. Visualizing data using tsne. J. Mach. Learn. Res. 2008, 9, 2579–2605. [Google Scholar]
- Alkasassbeh, M.; Al-Naymat, G.; Hassanat, A.; Almseidin, M. Detecting distributed denial of service attacks using data mining techniques. Int. J. Adv. Comput. Sci. Appl. 2016, 7, 436–445. [Google Scholar] [CrossRef] [Green Version]
- Dada, E.; Bassi, J.; Hurcha, Y.; Alkali, A. Performance evaluation of machine learning algorithms for detection and prevention of malware attacks. IOSR J. Comput. Eng. 2019, 21, 18–27. [Google Scholar] [CrossRef]
- Safavian, S.; Landgrebe, D. A survey of decision tree classifier methodology. IEEE Trans. Syst. Man Cybern. 1991, 21, 660–674. [Google Scholar] [CrossRef] [Green Version]
- Ali, J.; Khan, R.; Ahmad, N.; Maqsood, I. Random forests and decision trees. Int. J. Comput. Sci. Issues (IJCSI) 2012, 9, 272. [Google Scholar]
- Agarap, A. Towards building an intelligent anti-malware system: A deep learning approach using support vector machine (svm) for malware classification. arXiv 2017, arXiv:1801.00318. [Google Scholar]
- Peng, C.; Lee, K.; Ingersoll, G. An introduction to logistic regression analysis and reporting. J. Educ. Res. 2002, 96, 3–14. [Google Scholar] [CrossRef]
- Jahromi, A.; Taheri, M. A non-parametric mixture of gaussian naive bayes classifiers based on local independent features. In Proceedings of the 2017 Artificial Intelligence and Signal Processing Conference (AISP), Shiraz, Iran, 25–27 October 2017; pp. 209–212. [Google Scholar] [CrossRef]
- Liang, G.; Zhu, X.; Zhang, C. An empirical study of bagging predictors for different learning algorithms. In Proceedings of the AAAI Conference on Artificial Intelligence, San Francisco, CA, USA, 7–11 August 2011; Volume 25. [Google Scholar] [CrossRef]
- Lower, N.; Zhan, F. A study of ensemble methods for cyber security. In Proceedings of the 2020 10th Annual Computing and Communication Workshop and Conference (CCWC), Las Vegas, NV, USA, 6–8 January 2020; Volume 25. [Google Scholar] [CrossRef]
- Peter, S.; Diego, F.; Hamprecht, F.; Nadler, B. Cost efficient gradient boosting. Adv. Neural Inf. Process. 2017, 30, 1551–1561. [Google Scholar]
Publisher’s Note: MDPI stays neutral with regard to jurisdictional claims in published maps and institutional affiliations. |
© 2022 by the authors. Licensee MDPI, Basel, Switzerland. This article is an open access article distributed under the terms and conditions of the Creative Commons Attribution (CC BY) license (https://creativecommons.org/licenses/by/4.0/).