Abstract
High-performance computing systems have become increasingly dynamic, complex, and unpredictable. To help build software that uses full-system capabilities, performance measurement and analysis tools exploit extensive execution analysis focusing on single-run results. Despite being effective in identifying performance hotspots and bottlenecks, these tools are not sufficiently suitable to evaluate the overall scalability trends of parallel applications. Either they lack the support for combining data from multiple runs or collect excessive data, causing unnecessary overhead. In this work, we present a tool for automatically measuring and comparing several executions of a parallel application according to various scenarios characterized by the input arrangements, the number of threads, number of cores, and frequencies. Unlike other existing performance analysis tools, the proposed work covers some gaps in specialized features necessary to better understand computational resources scalability trends across configurations. In order to improve scalability analysis and productivity over the vast spectrum of possible configurations, the proposed tool features automatic instrumentation, direct mapping of parallel regions, accuracy-preserving data reductions, and ease of use. As it aims at accurately understanding scalability trends of parallel applications, detailed single-run performance analyses show minimal intrusion (less than 1% overhead).
1. Introduction
Developing parallel programs capable of exploiting the computational power of high-performance systems is as well-known as it is challenging [1,2,3]. During the development process, the code optimization step is a fundamental part of the software construction strategy and is supported by performance measurement and analysis tools [2,3,4,5,6,7,8,9,10,11]. The main objective of these tools is to help developers understand the execution characteristics, allowing the identification of bottlenecks and behavioral phenomena that compromise the program’s efficiency, thus guiding possible improvements [1,12].
Nowadays, due to the complexity of parallel systems, correctly identifying and locating performance and scalability bottlenecks depends on the developer’s ability to compare several measurements in different execution configurations [4,13]. This investigative process tends to be tedious and complex, requiring in-depth knowledge of the problem domain, parallel systems, and measurement and analysis tools. Mastering the analysis tools is necessary because they differ from each other in terms of measurement strategy, metrics collected, and the many points and focus of observation. Even though some solutions propose organizing and combining metrics from different sources, these distinct characteristics can compel developers to exploit more than one tool depending on their analysis interests.
Every existing tool has its own contributions in helping to understand the inner working of a program. Some can present a vast and varied set of metrics with a high degree of detail. However, developers may have difficulty using these tools when their interest is in analyzing parallel scalability. The main challenge arises from the emphasis on studying a single run because scalability analysis requires contrasting runs of different configurations. In terms of productivity, measuring and comparing only a few data between runs of multiple configurations tends to be more significant to scalability analysis than collecting a vast amount of finer-grain data of single-configuration runs. Furthermore, due to the number of measurements, there is a natural overhead associated with the execution of the analysis tool itself. Some works indicate this overhead can reach 40% of the program runtime, which influences and damages the observation of its efficiency variation [14]. As such, a measurement and analysis approach that uses only the data needed to understand the application’s efficiency variation can be advantageous. First, because measuring and collecting only the necessary data limits the degree of intrusion and, second, because this strategy makes the analysis tool simpler and easier to use. [7].
From this context, we present a measurement tool that focuses on analyzing the parallel scalability of programs. It primarily provides runtime and power consumption measures in an approach that favors inspection of the overall behavior of the program before starting a more in-depth investigation of points that naturally require more detail, time and effort. The work explores and combines strategies already used in other solutions, such as tracing, post-mortem analysis, and automatic instrumentation based on shared libraries. Additionally, it includes an instrumentation model that automatically relates parallel code regions to analysis regions, using a measurement strategy based on the intrinsic and primary behavior of the parallel frameworks. Due to this approach, the tool allows analyzing programs developed for shared-memory environments regardless of the compiler or framework versions. The framework version, which in some cases also requires specific compiler versions, is a limitation for some traditional tools like HPCToolkit [8] and TAU (Tuning and Analysis Utilities) [7].
The proposed tool uses a tracing-based measurement technique to identify and measure the boundaries of the analysis regions. The tracing approach supports a hierarchical region analysis model allowing users to see how the efficiency of inner parts can impact the program’s overall scalability. In addition, the tool uses an aggregation feature to reduce the volume of data produced while preserving accurate analysis capability with minimal overhead. The tool also includes usability features that reduce the developer’s efforts during the measurement and analysis process. These features allow one to automate the process of running and merging data collected from multiple configurations, bypassing manual efforts and avoiding the drawbacks of non-computer-oriented analysis. The collected data, available from the terminal in tabular form, can be exported as data blocks that can be interpreted by other tools or even rendered by graphics libraries to facilitate the visualization and data analysis.
We offer an alternative tool for realizing parallel scalability analysis more efficiently than single-run-centric performance measurement and analysis tools. In addition to that, our framework can also be used to promote energy-aware software; methods that rely on accurate and efficient energy collection could benefit from energy consumption data for the entire program and specific regions of the application [15,16,17,18]. To summarize, the main contributions of this work are:
- A lightweight automated process of measuring and comparing runs with different configurations.
- Transparent linking of parallel code sections to analysis regions.
- Hierarchical views and degrees of efficiency for the inner parts of a program.
- The imposed overhead is low and minimally intrusive, mainly because of the measurement approach and the number of metrics collected.
- It provides energy consumption measures for the different configuration parameters.
The following sections describe how the tool is built and used for performance analysis. Section 2 presents the related works. Section 3 describes the tool architecture and goals; it explains the main features, usage, and collected data. The experimental results are presented in Section 4. Finally, the contributions are summarized in Section 5, with an outlook of future works.
2. Related Works
Performance analysis aimed at code optimization is an essential activity for developing parallel applications with scalable performance. For this purpose, performance analysis tools, like Caliper [19], HPCToolkit [8], Scalasca [6], TAU [7], Vampir [3], and VTune [20], are useful because they help developers identify where the application uses the available computing resources inefficiently through collecting detailed data of its execution. Such tools differ from each other mainly in terms of data measurement and analysis strategy: tracing or profiling, post-mortem or real-time; individual or comprehensive observation focus; and for providing or not providing visual elements that facilitate the judgment of collected data. Other solutions, like the DASHING framework [2] and the HATCHET library [12], allow inspection of performance data from multiple sources. In this case, the goal of DASHING and HATCHET is to provide a more robust data set to support the analysis process.
In the performance analysis process, observing the parallel program’s execution as a sequence of events representing significant activities is essential to understand its behavior [21]. Events are basic units of the analysis process, and the way they are observed influences strategies for collecting performance data. Profiling-based analysis tools collect information from events that occurs in the program execution and commonly operate by statistical sampling using interruptions. These interruptions can be caused, for example, by periodic breaks or hardware events. Interruptions allow checking the system state and the information collected depends on the focus of observation. Profiling-based tools use statistical techniques to describe the program behavior in terms of aggregate performance metrics. They usually ignore the chronology of events, but are known to be useful for identifying, for example, load imbalance, high communication time, or excessive routine calls. Paradyn [9], and Periscope [22] are tools that adopt this strategy.
On the other hand, tracing-based analysis tools collect performance data from events that occur when the program takes over a particular state. Tracing can provide valuable information about the time dimension of a program, allowing users to check when and where transitions of routines, communications, and specific events occur. This measurement strategy tends to be more invasive and intrusive, generating a larger dataset than the profiling-based approach. Vampir [3] and Paraver [23] are examples of this group. Some tools like HPCToolkit [8], Scalasca [6], TAU [7] and VTune [20] support both profiling and tracing.
In this work we propose tracing to identify when parts of a code were executed. To mitigate some of the disadvantages related to tracing, in addition to adopting a time-based analysis, the tool implements features such as automatic instrumentation mode and resources aggregation. Our automatic instrumentation mode allows users to analyze program execution without modifying the source or the executable. Although many other analysis tools use the automatic instrumentation mode, this work presents a different way of mapping and measuring the code parts. In our proposal, parallel regions are the main focus of analysis. The strategy is effective enough to identify the scaling trends of parts or of the entire running parallel program. Furthermore, collecting only specific runtime data reduces the overhead associated with the measurement process. As with other similar tools, such as HPCToolkit [8] and TAU [7], there is no limitation on the version of OpenMP used.
Runtime overhead is an attribute associated with the set of additional instructions that are executed to collect the program measurements. The time to perform this “extra code” varies in line with the tool and is directly related, in quantity and degree of detail, to the aspects it measures. Limiting this overhead is crucial because it can compromise the understanding of program behavior, and divert optimization efforts to less effective points. According to some comparative and practical studies in this regard, tests on traditional tools have shown a runtime overhead ranging from 2% to 40% [14]. Although different depending on the program analyzed, the overhead resulting from our instrumentation strategy can be considered negligible (less than 1%) and optimal for analyzing trends in parallel applications.
Several performance analysis tools employ a post-mortem approach. In this case, the tool performs performance measurements and data collection while the program is running, and then the collected data will be interpreted. HPCToolkit [8], Scalasca [6], TAU [7] and VTune [20] are examples of post-mortem performance analysis tools. Depending on the type of analysis, these tools may require storing large amounts of data, but they are best suited to provide an overall view of the execution. In contrast, run-time analysis tools perform both operations at run time. This approach allows detecting waiting states and communication inefficiencies accurately. Periscope [22] and Paradyn [9] are examples of tools in this group. However, run-time analysis generally requires the coordinated action of tools, which increases the structural complexity. The need for synchronous initialization and communication between analysis resources as well as their impact on the runtime environment are the drawbacks of this approach. In addition, the analysis, particularly that of scalability, which relies on the data collected at the end of the execution, is potentially degraded by the infrastructure overhead and therefore does not benefit from the characteristics of real-time tools.
Energy management solutions can also provide similar features for example GEOPM [16], allows the measurement of time and energy of specific regions. The main advantage that we could not find in any other framework is that our tool can provide specific data of energy consumption of parallel regions in a completely automated way. For example, in GEOPM, it is necessary to instrument the source code to obtain the same result.
By focusing on objective analysis, we offer an alternative tool to observe the scalability trend of a parallel program. Thus, we collect just the information allowing us to infer the overall behavior of the program, or, according to the interest of the user, specifically chosen parts of it, including features relevant to an effective measurement and analysis process. To this end, it is essential to also automate the processes to obtain comparative measurements of several runs. Supported features are the automation of program executions according to various configuration parameters, including a user-specified granularity, the generation of datasets containing comparative measurements of runtime parameters, and efficient optimization of the amount of produced data. Regarding the amount of data collected, our approach uses data aggregation, which facilitates storage and further analysis.
3. Design and Features
This section presents the architecture, components, and interconnections used in the design of the proposed tool. It also includes a discussion about main features, instrumentation modes, and output file structure that contains the data measured and collected by the proposed tool.
3.1. Architecture
The tool we propose to measure, combine and compare multiple runs of a parallel application implements two main concepts to achieve this goal: actuators and sensors.
Actuators characterize the parameters we intend to observe. They are variables representing elements external to the program and which, when changed, can influence aspects such as the performance and efficiency of the running application. Therefore, analyzing the result of actuators’ variation is essential to understand how these elements impact program behavior, especially scalability and power consumption. By default, the tool implements actuators controlling the number of active cores and threads, the program input, and the CPU operating frequency.
The sensor is the concept we use to represent the elements addressed to measure and monitor the variation of actuators. Both sensors and actuators are plugged into the tool core as modules. Currently, the tool implements three types of sensors:
- Begin/end: collects data at launch and end of each program run.
- Time sample: periodically collects data.
- Events-based: collects data when a specific event happens.
Currently, there are sensors to measure time, energy, and performance counters. The default sensor is a begin/end type used to collect the execution time of the whole application. To measure energy consumption, we developed sampling sensors capable of retrieving data from RAPL (Running Average Power Limit) and IPMI (Intelligent Platform Management Interface), which are interfaces that provide power information from the CPU and the entire system. Apart from that, there are time sample and begin/end sensors to gather performance counters data.
Measurements that support scalability analysis are taken from event-based sensors. For this, the tool includes markers that trigger events to automatically identify the boundaries of parallel regions defined by developers in codes that use POSIX Threads or OpenMP. This feature is essential for relating parallel code sections to analysis regions and measuring execution times directly from binary code. The triggers for this measurement mode are implemented in a wrapper library and therefore already available in the system. The tool also provides manual marks that can be inserted into the source code to monitor specific parts of the program. Furthermore, any system event can be set as a trigger. Figure 1 describes the integration of each part of the proposed software. The idea is that actuators and sensors are modular parts that can easily be added or removed. The tool’s core is responsible for all operations, launching the application, and data gathering.
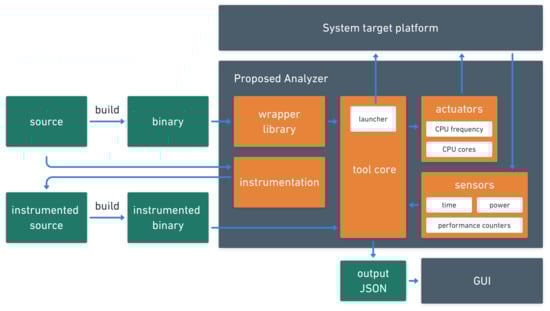
Figure 1.
Architecture showing the interconnections of the central parts of the tool. Either binary (using the wrapper library) or an instrumented source code, the target application can be launched on the target platform by the tool core following the configuration parameters chosen by the user while deploying actuators/sensors. The resulting data collection is stored in Json file format for post analysis and visualization (GUI).
3.2. Instrumentation and Intrusiveness
The instrumentation module is one of the most crucial. In addition to automating the instrumentation, it determines the overload and level of intrusiveness of the instrumentation process. This module is designed to execute the fewest instructions possible in the most optimized manner. Currently, there is instrumentation support for C/C++ languages through shared libraries that work with either automatic or manual instrumentation. Manual instrumentation is preferred when it is necessary to examine the application program in specific code sections, regardless of the type of content.
The manual instrumentation mode is implemented in three routines: one for initialization, another to mark the beginning of the region of interest (analyzer_start), and finally, a routine to mark the end of that region (analyzer_stop). The initialization routine is called when loading the library to create the necessary data structures and set up the data exchange communication. The routines analyzer_start and analyzer_stop identify threads in a region and store timestamps. These routines are implemented in such a way that only one thread at a time writes in a designated position of a two-dimensional array, thus ensuring thread safety and eliminating the necessity of locks.
The automatic instrumentation includes a routine allowing us to intercept the creation of threads via the LD_PRELOAD environment variable. This routine overwrites parts of an existing native library. In this manner, the functions responsible for thread spawning, such as pthread_create in the pthread library, GOMP_parallel (GCC implementation), __kmpc_fork_call (Clang implementation) in the OpenMP framework, and similar functions for other compilers, are intercepted to identify the parallel regions automatically. This approach is less intrusive than other tools, such as using a debugger interface with breakpoints or performing binary code instrumentation.
A key point of performance analysis tools, particularly important when analyzing real-time program execution, is that instrumentation must have a negligible impact on program behavior and execution time. Indeed, as mentioned in Section 3.1, we support three types of sensors, each of which has a different degree of intrusion. There is hardly any sensors intrusion at the start and then at the end of the program execution since it is simply the invocation of both data collection routines.
With sampling sensors, the degree of intrusion depends on the sampling rate and the total execution time of the application under study. Therefore, the intrusion needs to be assessed on a case-by-case basis with this type of sensor.
The instrumentation overhead does not depend on the number of instructions or the runtime required to process the set of instructions to be analyzed. However, it varies according to the number of processing units used and measurements taken. To estimate the order of magnitude of the overhead (), we measured recurring calls to the proposed sampling functions delimiting the regions in a simple benchmark code. This experiment was carried out in the same target architecture described in the experimental results of Section 4.2, and the code structure is presented on Listing 1.
| Listing 1. Code used to measure the overhead of instrumentation functions (analyzer_start and analyzer_stop) defined as . |
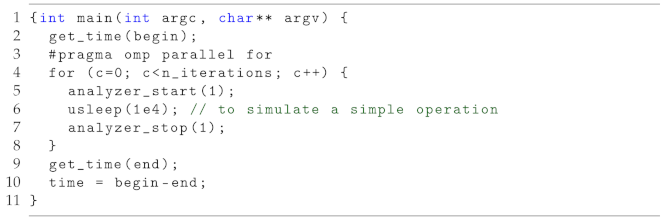 |
The time required to execute N calls to the analyzer_start and analyzer_stop functions was obtained by the routine gettimeofday, from the sys/time.h library. The algorithm ran with 1 , 2 , 3 , 4 , 5 , and 1 calls to the pair of functions, each test repetited ten times, and the mean, median, and variance values computed. Figure 2 shows these results.
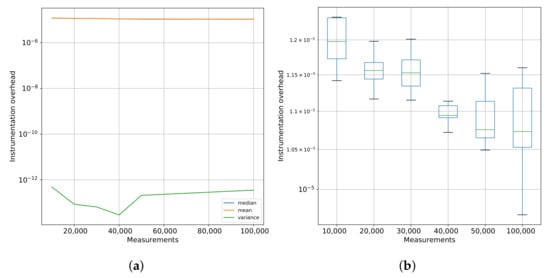
Figure 2.
Measuring variance of the time to single instrumentation, i.e., a call to analyzer_start and analyzer_stop while varying the number of measurements. (a) Time consumed from sampling a region one time in seconds. (b) Box plot showing the statistics of the sampling time of a single region.
In Figure 2a, we can see the mean, median, and variance of the time for a single call to our instrumentation function while varying the number of calls/measurements. The Figure 2a complements these results showing the variance in each execution.
Table 1 shows the results from the same experiment above comparing the time with and without the analyzer. We can observe that proportional impact (overhead) was constant while the number of interactions increased. Table 1 also presents the data referring to the simulation using the TAU profiling tool. For this simulation, we replaced the analyzer directives with the time measurement directives (TAU_PROFILE_START and TAU_PROFILE_STOP) of TAU, which allowed us to approximate the measurement and analysis conditions.

Table 1.
Instrumentation overhead estimation varying the number of samples collected for TAU and Analyzer.
From the results, it is possible to see that the tool proposed in this work has a higher overhead than that presented by the TAU, but the analysis capabilities are distinct. TAU adds the individual runtime of each thread to define the execution time of a parallel region. This strategy does not consider the simultaneous action of threads in processing instructions and can count the same period of time more than once, damaging a precise measurement of the parallel region. The analyzer works around this problem because the intersection periods are counted just once. In this sense, although the TAU has lower overhead, a scalability analysis depends on a more accurate measurement like the one proposed in this work.
Varying the number of threads impacts the cost of instrumentation. As shown in Table 2, there is a trend for the percentage of overhead to increase concerning the application’s runtime. However, it is also possible to see that this increase is negligible, considering the exponential increase in the number of threads. The increase in the processing load, on the other hand, has a beneficial impact on the relationship between execution time and the percentage of overhead. This behavior occurs because the runtime will increase with the greater need for processing, and the overhead will only change if the number of threads is also changed.
Table 2.
Instrumentation overhead while varying the number of threads with the number of samples fixed to one million.
For pluggable sensors, overhead is generally not a concern as they run on a separate thread and have very low CPU usage, which presents only a few scenarios where they can cause interference.
One of these scenarios is where the application needs all the machine’s resources at the same time that we have sensors that can respond faster than the processing speed at a given sample rate. In this case, the overhead would be directly associated with the sample rate and how the system handles concurrency. In general, this is rarer to happen in HPC (High-performance computing) since it would require an application with a perfect linear scaling.
Another possible scenario is I/O overhead, where some network, disk, or memory resource becomes unavailable due to high sensor usage. However, this scenario is even rarer as sensors seldom produce data that quickly and, in all the performed tests, this was not close to being an issue.
3.3. Features and Usage
The analyzer is a simple and easy-to-use tool that allows the user to understand the general behavior of a program before investing in efforts that require in-depth and sometimes longer-term analysis. However, to meet the objectives that best match the needs and resources of the user, the tool provides functionalities to parameterize the measurement process. Among the main ones are:
- 1.
- Automated execution and deployment of parameterized code, actuators, and sensors
- 2.
- Automated low-overhead binary code instrumentation.
- 3.
- No need of the source code or to recompile, unless the user desires it.
- 4.
- Flexible user-defined observation regions: analysis of contexts within and beyond parallel regions.
- 5.
- Automatic instrumentation of parallel and remaining intermediate serial regions.
- 6.
- Aggregation, by region, of the collected metrics, which significantly reduces the amount of data stored on disk and RAM usage; useful in cases where it would be impossible to store information about all sensor events, such as the instrumentation of a for loop with billions of iterations. In this case it is possible to choose how to group the data either by mean, median, minimum or maximum values.
- 7.
- Hierarchical regions: The proposed analyzer also facilitates the identification of aligned regions, enabling the identification of the calling hierarchy of inner regions and block analysis.
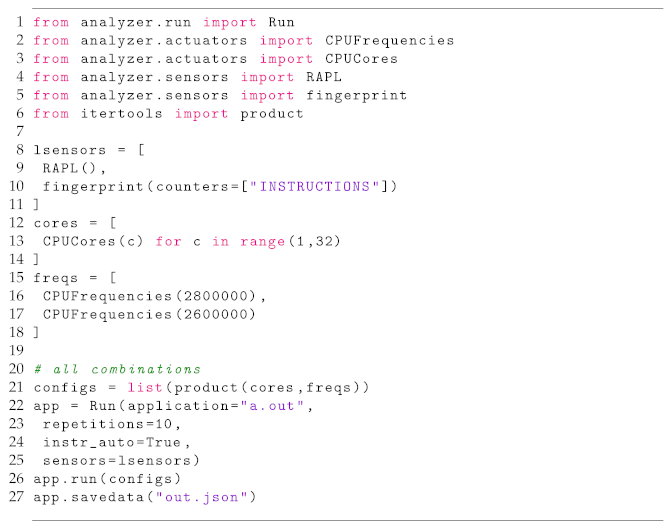
The tool can be used in the command line or via its API. The API provides calls to integrate sensors and actuators as shown in the Listing 2.
| Listing 2. Python script showing some API features provided by the tool, on how a custom run can be configured. |
 |
3.4. Exported Data Structure
The data collected by the tool is exported to a .json file and stored on disk. The data structure is divided into two large groups. One group contains information about the configuration parameters driving deployment and execution. The other includes the performance measurements. The data is grouped in keys representing the processed input, the number of processing elements used in the execution, and the simulation ID. Since the tool can perform the same configuration many times, a simulation ID distinguishes runs that use the same input and number of processing elements.
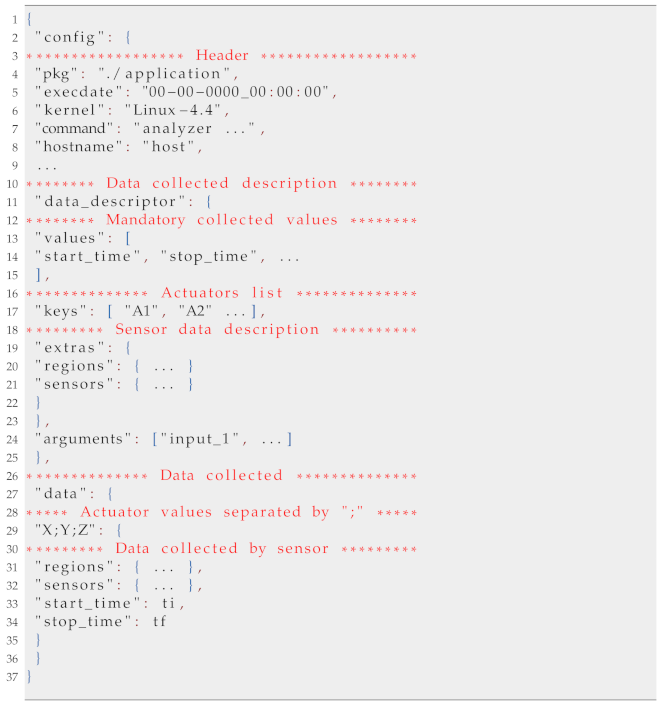
Listing 3 presents an example file exported by the analyzer. There we can see the main parts of the exported structure, with the header where essential information about the system is written followed by the description of the collected data, where the list of actuators is presented as well as the specific type of information that was collected from the sensors. Finally the samples are presented separated by actuator configurations, and sensor type.
The keys and values in the .json file do not represent information that is easy for the user to identify and understand. However, it can be easily interpreted by a script or visualization software such as the PaScal Viewer [13]. The proposed tool provides a visualization module, responsible for interpreting and presenting data in an organized and user-friendly manner.
| Listing 3. Sample of exported data file showing the internal structure and organization of the data. |
 |
4. Experimental Results
In this Section, we discuss the measurements and simulation results for three distinct cases, including two real applications. We also demonstrate how external libraries and standalone visualization tools can be used to render the collected data and investigate performance aspects such as the program’s scalability capacity.
4.1. Case-Study Applications
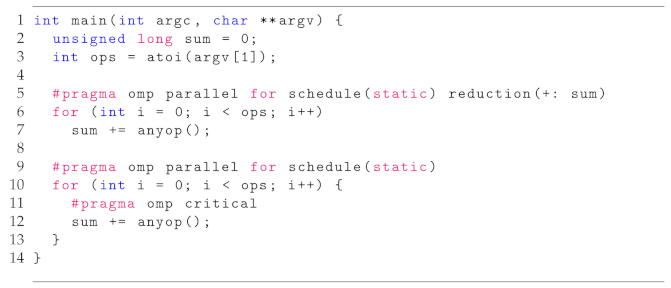
We used three experiments to assess the tool and demonstrate its ability to support analysis aimed at observing parallel scalability. The first includes a runtime imbalance between processing units in a specific parallel region. In this case, the objective is to present how the analyzer helps users observe the impact of the inefficiency of a code part on the whole program. The code for this experiment is presented in Listing 4. It consists of two simple parallel regions with the same functionality that divide the iterations of a loop between the available threads. The difference between the regions lies in the strategies used to manipulate the sum variable, used in the example to store the values of the calculations performed in each thread. We assume that the anyop() function, in this case, invariably has the same runtime in all function calls.
The other two experiments use applications Raytrace [24] and OpenMC [25]. Raytrace is an application addressed on rendering photorealistic scenes. It is available on the PARSEC Benchmark suite, version 2.0. The PARSEC benchmark, focused on emerging workloads, represents the next-generation shared-memory programs for chip multiprocessors. It covers a wide range of areas such as financial analysis, computer vision, engineering, enterprise storage, animation, similarity search, data mining, machine learning, and media processing.
| Listing 4. Sample code used to visualize the impact of regions on program scalability. |
 |
OpenMC is an application that implements the Monte-Carlo method to simulate the transport of neutrons and photons. It is a classic program aimed at high-performance computing.
4.2. Case-Study Architecture
The experiments were executed in a computer node of a SGI ICE X machine, USA, equipped with two Intel Xeon E5-2698 v3 processors with sixteen cores each and two hardware threads for each core. The maximum non-turbo frequency is 2.3 GHz, and the total physical memory of the node is 128 GB (8 × 16 GB). Turbo frequency and hardware multi-threading were disabled during all experiments. The operating system used was Linux CentOS 6.5, kernel 4.16.
4.3. Experiments
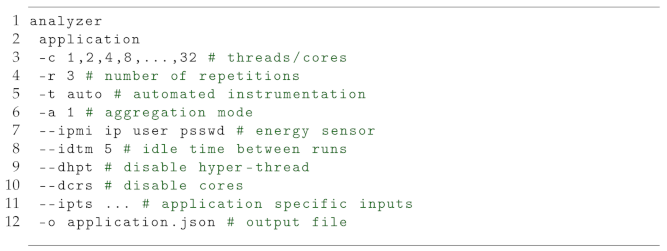
The command presented on Listing 5 was used as base to perform experiments. For the experiment of Listing 4, we use just the parameters -c, -r, -t, -a and -o, including the 64 value to -c option.
| Listing 5. Command line showing how experiments were run through a terminal. |
 |
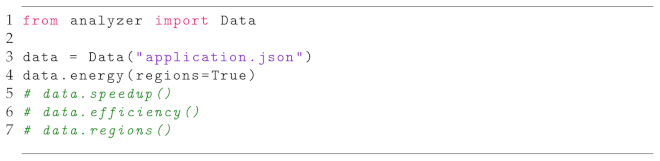
The command return a .json file with all the information necessary for our analysis. We can quickly generate tables with the collected data from this file, thus supporting observation and analysis of scalability, energy trends, and model fitting. The code described in Listing 6 and Table 3 are samples of how users can easily read and view collected data from the control terminal in a tabular way.
Table 3.
Dataframe generated automatically from collected samples using the Python API.
| Listing 6. Example of using the Python API to load analyzer files. |
 |
4.4. Results and Analysis
The analyzer does not display graphics and other visual elements natively. However, the simple use of external libraries allows generating graphics and visualizing points of the program’s behavior that you want to observe. In addition, specialized visualization tools can also be used to view the results. PaScal Viewer [13], for example, natively interprets the analyzer’s output files, complementing its functionality and creating an integrated and appropriate environment for the program’s parallel scalability analysis.
To analyze the experiment presented in Listing 4, we use PaScal Viewer to observe in a hierarchical way how the different OpenMP clauses impacted the region’s efficiencies. The efficiency pinpoints how a program can take advantage of increasing processing elements on a parallel system. It is defined as the ratio of speedup to the number of processing units. In this sense, PaScal Viewer displays an efficiency diagram for each analysis region, as presented in Figure 3. Comparing these diagrams, it is possible to see how the critical clause damages the scalability. In addition, it is also possible to relate that this second region affects the efficiency of the whole program due to the code characteristics.
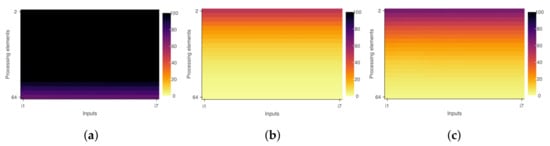
Figure 3.
Efficiency diagrams and impact of inner regions on program scalability. (x-axis = inputs; y-axis = number of threads). (a) First region diagram. (b) Second region diagram. (c) Whole program diagram.
If the reduction clause replaces #pragma omp crtical, the second region and the entire program become more efficient, as shown in Figure 4. The PaScal Viewer diagrams mentioned in this work, the x-axis (i1–i7) corresponds to different data inputs and the y-axis (2–64) to the number of threads used in the processing. Figure 3 and Figure 4 were rendered using a tool feature that smoothes the color transition of diagrams. This feature uses interpolation to create a visual element where the color transition is less pronounced. The diagram axes only show the initial and final values with this option. The user can visualize diagrams with only discrete values or even compare the two presentation modes side by side. Figure 5 shows the difference between discrete and smoothed modes considering the whole program and the simulation scenario that uses the clause #pragma omp crtical.
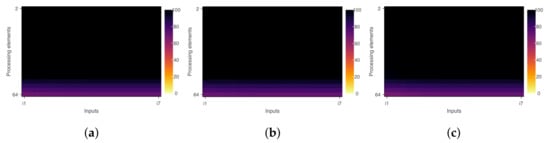
Figure 4.
Efficiency diagrams after removing #pragma omp crtical clause. (x-axis = inputs; y-axis = number of threads). (a) First region diagram. (b) Second region diagram. (c) Whole program diagram.
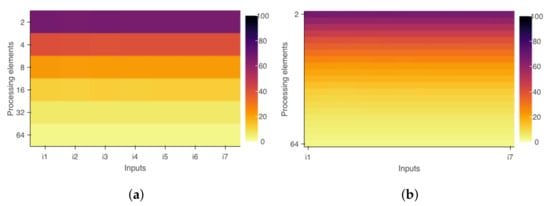
Figure 5.
Visualization modes of diagrams provided by PaScal Viewer. (a) PaScal Viewer diagram on discrete mode. (b) PaScal Viewer diagram on smoothed mode.
Other analysis objectives not supported by PaScal Viewer, such as visualization of the speedup curve or energy consumption, can be supported by traditional plots. Figure 6 and Figure 7 present the charts rendered for analysis by Raytrace and OpenMC applications. In these figures, it is possible to observe that the program efficiency varies according to the increase in the number of threads and the execution of inputs with higher processing loads. From the diagrams in Figure 8, it is possible to observe that the applications present different behaviors concerning their efficiency variations and their scalability capabilities. OpenMC maintains its efficiency almost constant. This pattern represents strong scalability and indicates that the program can maintain its efficiency level when it uses a larger number of threads and processing larger inputs. On the other hand, Figure 8a demonstrates that Raytrace achieves higher efficiency values when processing larger inputs. However, it is also possible to observe that increasing the number of processing units fixing the input size will not improve or hold the efficiency value.
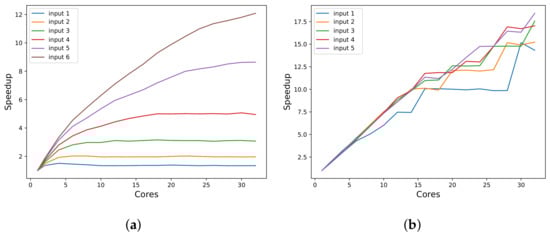
Figure 6.
Speedup of the applications for several input sizes. (a) Raytrace speedup. (b) OpenMC speedup.
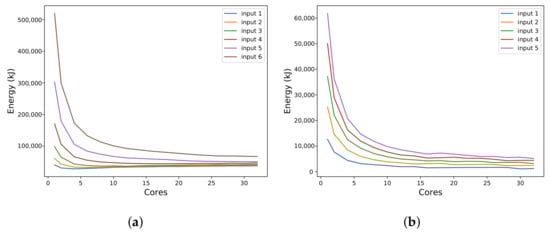
Figure 7.
Energy consumption identified in the execution of applications while varying the number of cores for several input sizes. (a) Raytrace energy consumption. (b) OpenMC energy consumption.
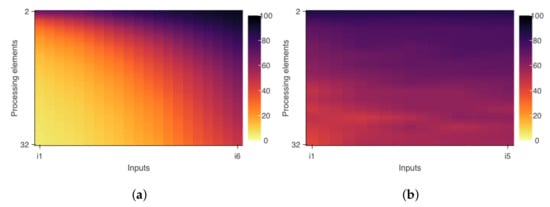
Figure 8.
Efficiency diagram varying the input size and the number of cores. The color bar indicates the efficiency value in percentage. (a) Raytrace efficiency diagram. (b) OpenMC efficiency diagram.
The input values shown in Figure 6, Figure 7 and Figure 8 indicate different data sets for processing. For example, the “input 2” represents a load that will require sequential processing with runtime twice as long as “input 1”. Likewise, the “input 3” represents a load that will require sequential processing with runtime twice as long as “input 2”, and so on.
Even if the analyzer does not display graphics natively, analysis aimed at observing scalability and energy consumption of applications depends on precise measurements, reinforcing the advantage of the analyzer proposed in this work.
5. Conclusions and Future Works
This work introduces a practical and easy-to-use tool for measuring and analyzing the efficiency of parallel applications. The proposed tool focuses on observing scalability and energy consumption and implements features that enables analysis at hierarchical levels of the program’s inner parts. It also simplifies the comparison of the application runs in different configurations, helping developers target software optimization efforts.
The tool has a low level of intrusion added to the program’s performance measurement under analysis, which is a fundamental aspect of understanding the program’s behavior and scalability capacity. Although it does not offer graphic elements to visualize the collected metrics, the tool itself makes it possible to examine the data from the command terminal. It also allows this data to be analyzed by an interface provided in Python or through .json files.
In future work, we intend to evolve this tool to include the ability to predict speedup and efficiency from a few samples using state-of-the-art prediction models present in the literature [26,27]. The idea is to present the general behavior of the program and its scalability trend and reduce the execution time necessary to compose a comprehensive analysis. Furthermore, we intend to include features that allow the observation of parallel applications in distributed environments that use the Message Passing Interface (MPI) standard.
Author Contributions
Conceptualization, V.R.G.d.S., A.B.N.d.S. and S.X.-d.-S.; methodology, V.R.G.d.S., A.B.N.d.S., S.X.-d.-S. and C.V.; software, V.R.G.d.S. and A.B.N.d.S.; validation, V.R.G.d.S., A.B.N.d.S., S.X.-d.-S. and C.V.; formal analysis, V.R.G.d.S. and A.B.N.d.S.; investigation, V.R.G.d.S. and A.B.N.d.S.; resources, V.R.G.d.S., A.B.N.d.S., S.X.-d.-S., C.V. and P.M.; data curation, V.R.G.d.S. and A.B.N.d.S.; writing—original draft preparation, V.R.G.d.S. and A.B.N.d.S.; writing—review and editing, V.R.G.d.S., A.B.N.d.S., S.X.-d.-S. and C.V.; visualization, V.R.G.d.S. and A.B.N.d.S.; supervision, C.V., P.M. and S.X.-d.-S.; project administration, C.V. and S.X.-d.-S.; funding acquisition, C.V., P.M. and S.X.-d.-S. All authors have read and agreed to the published version of the manuscript.
Funding
This work was only possible thanks to the funding provided by Coordenação de Aperfeiçoamento de Pessoal de Nível Superior (CAPES)—PhD scholarship, number: 88887.468397/2019-00.
Data Availability Statement
Data is contained within the article.
Acknowledgments
The experiments performed in this investigation used the compute nodes of the High-Performance Computing Center (NPAD/UFRN). The authors would also like to thank CAPES–Coordenação de Aperfeiçoamento de Pessoal de Nível Superior, University of Mons, Federal Institute of Paraíba and Federal University of Rio Grande do Norte.
Conflicts of Interest
The authors declare no conflict of interest.
Abbreviations
The following abbreviations are used in this manuscript:
| API | Application Programming Interface |
| CPU | Central processing Unity |
| POSIX | Portable Operating System Interface |
References
- Huck, K.; Malony, A.; Shende, S.; Morris, A. Scalable, Automated Performance Analysis with TAU and PerfExplorer. In Proceedings of the PARCO, Aachen, Germany, 4–7 September 2007; Volume 15, pp. 629–636. [Google Scholar]
- Islam, T.; Ayala, A.; Jensen, Q.; Ibrahim, K. Toward a Programmable Analysis and Visualization Framework for Interactive Performance Analytics. In Proceedings of the IEEE/ACM International Workshop on Programming and Performance Visualization Tools (ProTools), Denver, CO, USA, 17 November 2019; pp. 70–77. [Google Scholar] [CrossRef]
- Weber, M.; Ziegenbalg, J.; Wesarg, B. Online Performance Analysis with the Vampir Tool Set. In Tools for High Performance Computing 2017, Proceedings of the 11th International Workshop on Parallel Tools for High Performance Computing, Dresden, Germany, 11–12 September 2017; Springer International Publishing: Cham, Switzerland, 2019; pp. 129–143. [Google Scholar] [CrossRef]
- Bergel, A.; Bhatele, A.; Boehme, D.; Gralka, P.; Griffin, K.; Hermanns, M.A.; Okanović, D.; Pearce, O.; Vierjahn, T. Visual Analytics Challenges in Analyzing Calling Context Trees; Springer: Cham, Switzerland, 2019; pp. 233–249. [Google Scholar] [CrossRef]
- Huck, K.; Malony, A. PerfExplorer: A Performance Data Mining Framework For Large-Scale Parallel Computing. In Proceedings of the SC ’05: Proceedings of the 2005 ACM/IEEE Conference on Supercomputing, Seattle, WA, USA, 12–18 November 2005; p. 41. [CrossRef] [Green Version]
- Geimer, M.; Wolf, F.; Wylie, B.; Ábrahám, E.; Becker, D.; Mohr, B. The Scalasca performance toolset architecture. Concurr. Comput. Pract. Exp. 2010, 22, 702–719. [Google Scholar] [CrossRef]
- Shende, S.S.; Malony, A.D. The Tau Parallel Performance System. Int. J. High Perform. Comput. Appl. 2006, 20, 287–311. [Google Scholar] [CrossRef]
- Adhianto, L.; Banerjee, S.; Fagan, M.; Krentel, M.; Marin, G.; Mellor-Crummey, J.; Tallent, N.R. HPCTOOLKIT: Tools for performance analysis of optimized parallel programs. Concurr. Comput. Pract. Exp. 2010, 22, 685–701. [Google Scholar] [CrossRef]
- Miller, B.; Callaghan, M.; Cargille, J.; Hollingsworth, J.; Irvin, R.; Karavanic, K.; Kunchithapadam, K.; Newhall, T. The Paradyn parallel performance measurement tool. Computer 1995, 28, 37–46. [Google Scholar] [CrossRef] [Green Version]
- Galobardes, E.C. Automatic Tuning of HPC Applications. The Periscope Tuning Framework; Shaker: Herzogenrath, Germany, 2015. [Google Scholar]
- Pillet, V.; Labarta, J.; Cortes, T.; Girona, S. PARAVER: A Tool to Visualize and Analyze Parallel Code. In Proceedings of the WoTUG-18: Transputer and Occam Developments, Manchester, UK, 9–13 April 2007. [Google Scholar]
- Brink, S.; Lumsden, I.; Scully-Allison, C.; Williams, K.; Pearce, O.; Gamblin, T.; Taufer, M.; Isaacs, K.E.; Bhatele, A. Usability and Performance Improvements in Hatchet. In Proceedings of the IEEE/ACM International Workshop on HPC User Support Tools (HUST) and Workshop on Programming and Performance Visualization Tools (ProTools), Atlanta, GA, USA, 18 November 2020; pp. 49–58. [Google Scholar] [CrossRef]
- Silva, A.B.N.; Cunha, D.A.M.; Silva, V.R.G.; Furtunato, A.F.A.; Souza, S.X.-d.-S. PaScal Viewer: A Tool for the Visualization of Parallel Scalability Trends. In Proceedings of the ESPT/VPA@SC, Dallas, TX, USA, 11–16 November 2018. [Google Scholar]
- Eriksson, J.; Ojeda-may, P.; Ponweiser, T.; Steinreiter, T. Profiling and Tracing Tools for Performance Analysis of Large Scale Applications; PRACE—Partnership for Advanced Computing in Europe: Brussels, Belgium, 2016; pp. 1–30. Available online: https://prace-ri.eu/wp-content/uploads/WP237.pdf (accessed on 12 January 2020).
- Roberts, S.I.; Wright, S.A.; Fahmy, S.A.; Jarvis, S.A. Metrics for Energy-Aware Software Optimisation. In High Performance Computing, Proceedings of the 32nd International Conference, ISC High Performance 2017, Frankfurt, Germany, 18–22 June 2017; Kunkel, J.M., Yokota, R., Balaji, P., Keyes, D., Eds.; Springer International Publishing: Cham, Switzerland, 2017; pp. 413–430. [Google Scholar]
- Eastep, J.; Sylvester, S.; Cantalupo, C.; Geltz, B.; Ardanaz, F.; Al-Rawi, A.; Livingston, K.; Keceli, F.; Maiterth, M.; Jana, S. Global Extensible Open Power Manager: A Vehicle for HPC Community Collaboration on Co-Designed Energy Management Solutions. In High Performance Computing, Proceedings of the 32nd International Conference, ISC High Performance 2017, Frankfurt, Germany, 18–22 June 2017; Kunkel, J.M., Yokota, R., Balaji, P., Keyes, D., Eds.; Springer International Publishing: Cham, Switzerland, 2017; pp. 394–412. [Google Scholar]
- Hackenberg, D.; Ilsche, T.; Schuchart, J.; Schöne, R.; Nagel, W.E.; Simon, M.; Georgiou, Y. HDEEM: High Definition Energy Efficiency Monitoring. In Proceedings of the Energy Efficient Supercomputing Workshop, New Orleans, LA, USA, 16 November 2014; pp. 1–10. [Google Scholar] [CrossRef]
- Roberts, S.I.; Wright, S.A.; Fahmy, S.A.; Jarvis, S.A. The Power-Optimised Software Envelope. ACM Trans. Archit. Code Optim. 2019, 16, 1–27. [Google Scholar] [CrossRef] [Green Version]
- Boehme, D.; Gamblin, T.; Beckingsale, D.; Bremer, P.T.; Gimenez, A.; LeGendre, M.; Pearce, O.; Schulz, M. Caliper: Performance Introspection for HPC Software Stacks. In Proceedings of the SC ’16: Proceedings of the International Conference for High Performance Computing, Networking, Storage and Analysis, Salt Lake City, UT, USA, 13–18 November 2016; pp. 550–560. [CrossRef]
- Corporation, I. Intel VTune. Available online: https://software.intel.com/vtune (accessed on 15 February 2020).
- Pantazopoulos, K.N.; Houstis, E. Performance Analysis and Visualization Tools for Parallel Computing. 1997. Available online: https://docs.lib.purdue.edu/cstech/1346 (accessed on 20 May 2020).
- Gerndt, M.; Ott, M. Automatic Performance Analysis with Periscope. Concurr. Comput. Pract. Exp. 2010, 22, 736–748. [Google Scholar] [CrossRef]
- Labarta, J.; Gimenez, J.; Martínez, E.; González, P.; Servat, H.; Llort, G.; Aguilar, X. Scalability of Tracing and Visualization Tools. In Proceedings of the International Conference ParCo, Prague, Czech Republic, 10–13 September 2005; pp. 869–876. [Google Scholar]
- Bienia, C.; Kumar, S.; Singh, J.P.; Li, K. The PARSEC benchmark suite: Characterization and architectural implications. In Proceedings of the International Conference on Parallel Architectures and Compilation Techniques, Toronto, ON, Canada, 25–29 October 2008; pp. 72–81. [Google Scholar] [CrossRef]
- Romano, P.K.; Horelik, N.E.; Herman, B.R.; Nelson, A.G.; Forget, B.; Smith, K. OpenMC: A state-of-the-art Monte Carlo code for research and development. Ann. Nucl. Energy 2015, 82, 90–97. [Google Scholar] [CrossRef] [Green Version]
- Furtunato, A.F.A.; Georgiou, K.; Eder, K.; Xavier-De-Souza, S. When Parallel Speedups Hit the Memory Wall. IEEE Access 2020, 8, 79225–79238. [Google Scholar] [CrossRef]
- Silva, V.R.G.; Valderrama, C.; Manneback, P.; Xavier-de-Souza, S. Analytical Energy Model Parametrized by Workload, Clock Frequency and Number of Active Cores for Share-Memory High-Performance Computing Applications. Energies 2022, 15, 1213. [Google Scholar] [CrossRef]
Publisher’s Note: MDPI stays neutral with regard to jurisdictional claims in published maps and institutional affiliations. |
© 2022 by the authors. Licensee MDPI, Basel, Switzerland. This article is an open access article distributed under the terms and conditions of the Creative Commons Attribution (CC BY) license (https://creativecommons.org/licenses/by/4.0/).