1. Introduction
Robotic machine manufacturers targeting automatic assembly processes are being pushed to do more and better with less waste, urged to align towards the UN Sustainable Development Goal 12.5 (to substantially reduce waste generation through prevention, reduction, recycling and reuse, by 2030) [
1]. Automatic assembly is a complex process that involves strict quality control, mostly by means of computer vision. If an assembled object is faulty, it is rejected and may end up in the trash. The work described in this paper describes an application that classifies, collects, sorts and aligns different objects for later reuse. At the input, the system receives boxes of faulty assembled connectors (different sizes, shapes and colors, and in different poses), while at the output, different boxes are filled with aligned and same-type connectors, as explained later in
Section 3.
The automobile industry has always imposed the growth of the cable assembly industry and is characterized by many technological changes in a short period of time. Vehicles are becoming more comfortable, safer, more efficient and less polluting, but they are also increasingly complex systems with lots of electronics. The Electric Distribution System (EDS) has to constantly adapt to these changes in terms of concept quality and technological requirements. According to recent market reports [
2,
3], the rise of electric vehicles is driving the market. In 2020, global sales of plug-in electric cars increased 39% from the previous year to 3.1 million units. By the end of 2026, annual sales of battery-powered electric cars are expected to exceed 7 million and to contribute about 15% of total vehicle sales. This increase in sales is mainly due to increased regulatory standards imposed by various organizations and governments to limit emissions and promote zero-emission automobiles. As more electric vehicles circulate, the electric harness market is also expected to witness growth, since electric harnesses are used more in electric vehicles than in conventional fossil fuel vehicles.
To meet the growing needs, the electric harness market needs to digitize and automate processes to increase production levels and also reduce the number of failures, often associated with human error. The tasks performed in wire harnesses have traditionally been difficult for robots. Therefore, the solution involves changing the harness architectures, through a Design-for-Automation logic, as well as automating some current processes through robotic stations.
Traditionally, grasping and sorting randomly positioned objects requires human resources, which is a very monotonous task, lacks creativity and is no longer sustainable in the context of smart manufacturing [
4]. Industrial robots, however, require a supplementary cognitive sensing system that can acquire and process information about the environment and guide the robot to grasp arbitrarily placed objects out of the bin. In industry settings, this problem has been commonly referred to as bin-picking [
5] and also historically addressed as one of the greatest robotic challenges in manufacturing automation [
6]. Bin-picking depends on visual-based robotic grasping approaches, which can be divided into methods where the shape of the object is analyzed (analytic approaches) or machine learning-based methods (data-driven approaches). Data-driven approaches can be categorized as model-free or model-based, where model-based approaches require prior knowledge of the object to determine the grasping position and model-free methods directly search for possible grasping points [
7]. In the process of sorting automotive connectors, several different object types can be present and mixed in one pile. To be efficient, it is crucial to determine the object type before grasping as different grasping approaches are required for different connectors. Analytic methods fall short due to the high level of diversity in the region of interest. However, machine learning approaches tend to generalize and cope with uncertainties of the environment. Therefore, in this article, we focus on model-based, machine learning grasping methods.
The remainder of this paper is organized as follows:
Section 2 describes the state-of-the-art and related works.
Section 3 describes the materials and methods for the bin-picking solution.
Section 4 presents the experimental results achieved and, finally,
Section 5 presents the conclusions and future work.
2. Related Work
Bin-picking is a methodology used in Vision-Guided Robotics systems in which pieces are randomly selected and extracted in a container, using a vision system for location and a robotic system for extraction and its subsequent replacement. In recent years, a large number of 3D vision systems have emerged on the market that make it possible to implement bin-picking solutions in a smart factory context. Photoneo [
8] is one of these brands which provides a 3D vision system, with software capable of training Convolutional Neural Networks (CNN) to recognize and classify objects and integrate with different models of robots. In addition, several other players bring machine vision solutions to the market for bin-picking applications, including Zivid [
9], Solomon [
10], Pickit [
11] and more. All of these systems provide very efficient and robust features for the industry, but they are still very expensive systems and are not accessible to the vast majority of small- and medium-sized enterprises (SME). This has led to the pursuit of alternative solutions based on more low-cost 3D vision cameras, investing in the research and the improvements of the machine learning algorithms. One such solution is proposed in [
12], where the authors propose an object detection method based on the YOLOv5 algorithm, which can perform accurate positioning and recognition of objects to be grasped by an arm robot with an Intel RealSense D415 camera in an eye-to-hand configuration.
Bin-picking solutions have been studied for a long time, and in [
13], some limitations and challenges of current solutions for the industry are identified and a system for grasping sheet metal parts is proposed. In [
14], a solution is proposed with an ABB IRB2400 robot with a 3D vision system for picking and placing randomly located pieces. More recently, in [
15] the authors propose a CAD-based 6-DoF (degree of freedom) pose estimation pipeline for robotic random bin-picking tasks using the 3D camera.
Picking only one object in a pile of random objects is a very challenging task, and in [
16] a method is proposed to first compute grasping pose candidates by using the graspability index. Then, a CNN is trained to predict whether or not the robot can pick one and only one object from the bin. In [
17], an approach for bin-picking industrial parts with arbitrary geometries is proposed based on the YOLOv3 algorithm. In [
18], a flexible system for the integration of 3D computer vision and artificial intelligence solutions with industrial robots is proposed using the ROS framework, a Kinect V2 sensor and the UR5 collaborative robot.
One of the challenging tasks in bin-pinking systems is identifying the best way to grip an object, therefore, it is necessary to identify the best gripper for the operation in addition to locating the objects and calculating the pose. In [
19], the authors propose a system for the detection of object location, pose estimation, distance measurement and surface orientation angle detection. In [
20], an object pose estimation method based on a landmark feature is proposed to estimate the rotation angle of the object. The sensitivity of the 3D vision system is very important to the success rate of a bin-picking solution; obviously, low-cost vision systems are useful for demonstrating concepts, but they are not usually suitable for working day-to-day in industrial scenarios.
The success rate of the bin-picking solution beyond the vision sensor depends a lot on the efficiency of the implemented algorithms. In [
21], the authors compared the results of point cloud registration based on ICP (Iterative Closest Point) with data from different 3D sensors to analyze the success rate in bin-picking solutions. Object detection is one of the main tasks of computer vision, which consists of determining the location in the image where certain objects are present, as well as classifying them. The rapid advances of machine learning and deep learning techniques have greatly accelerated the achievements in object detection. With deep learning networks and the computing power of GPUs, the performance of object detectors and trackers has greatly improved. In [
22], a review of object detection methods with deep learning is performed, where the fundamentals of this technique are discussed. One of the algorithms that have emerged in recent years is YOLO (You Only Look Once). The YOLO model is designed to encompass an architecture that processes all image resources (the authors called it the Darknet architecture) and is followed by two fully connected layers performing bounding box prediction for objects. Since its inception in 2015, YOLO has evolved, and in 2020 the company Ultralytics converted the previous version of YOLO into the PyTorch framework, giving it more visibility. YOLOv5 is written in Python instead of C as in previous versions. In addition, the PyTorch community is also larger than the Darknet community, which means that PyTorch will receive more contributions and growth potential in the future. The complete study of the evolution of YOLO can be found in [
23]. YOLOv5 is now a reference and is extensively used in object detection tasks in various domains. As an example, in [
24] it is used as a face detection algorithm suitable for complex scenes, and in [
25] it is used as a real-time detection algorithm for kiwifruit defects. In this work, YOLOv5 is the algorithm implemented for the identification and recognition of electrical connectors in a bin-picking application.
3. Materials and Methods
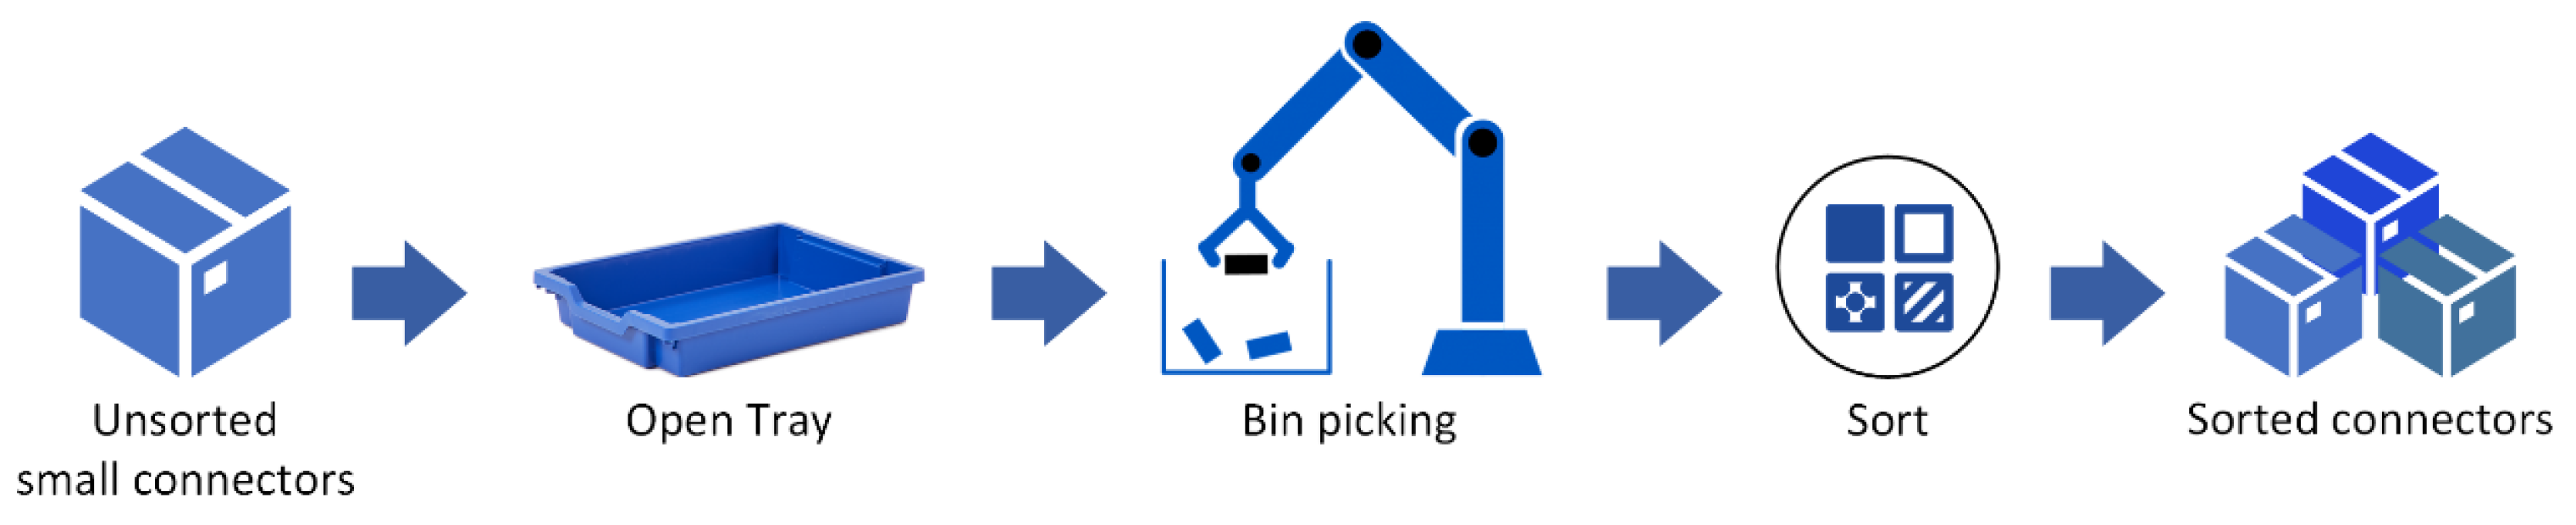
This section describes the methodology followed to implement our bin-picking solution for small automotive connectors and the machine learning algorithm used for object recognition and the respective robot navigation process. The core concept for our approach is depicted in
Figure 1.
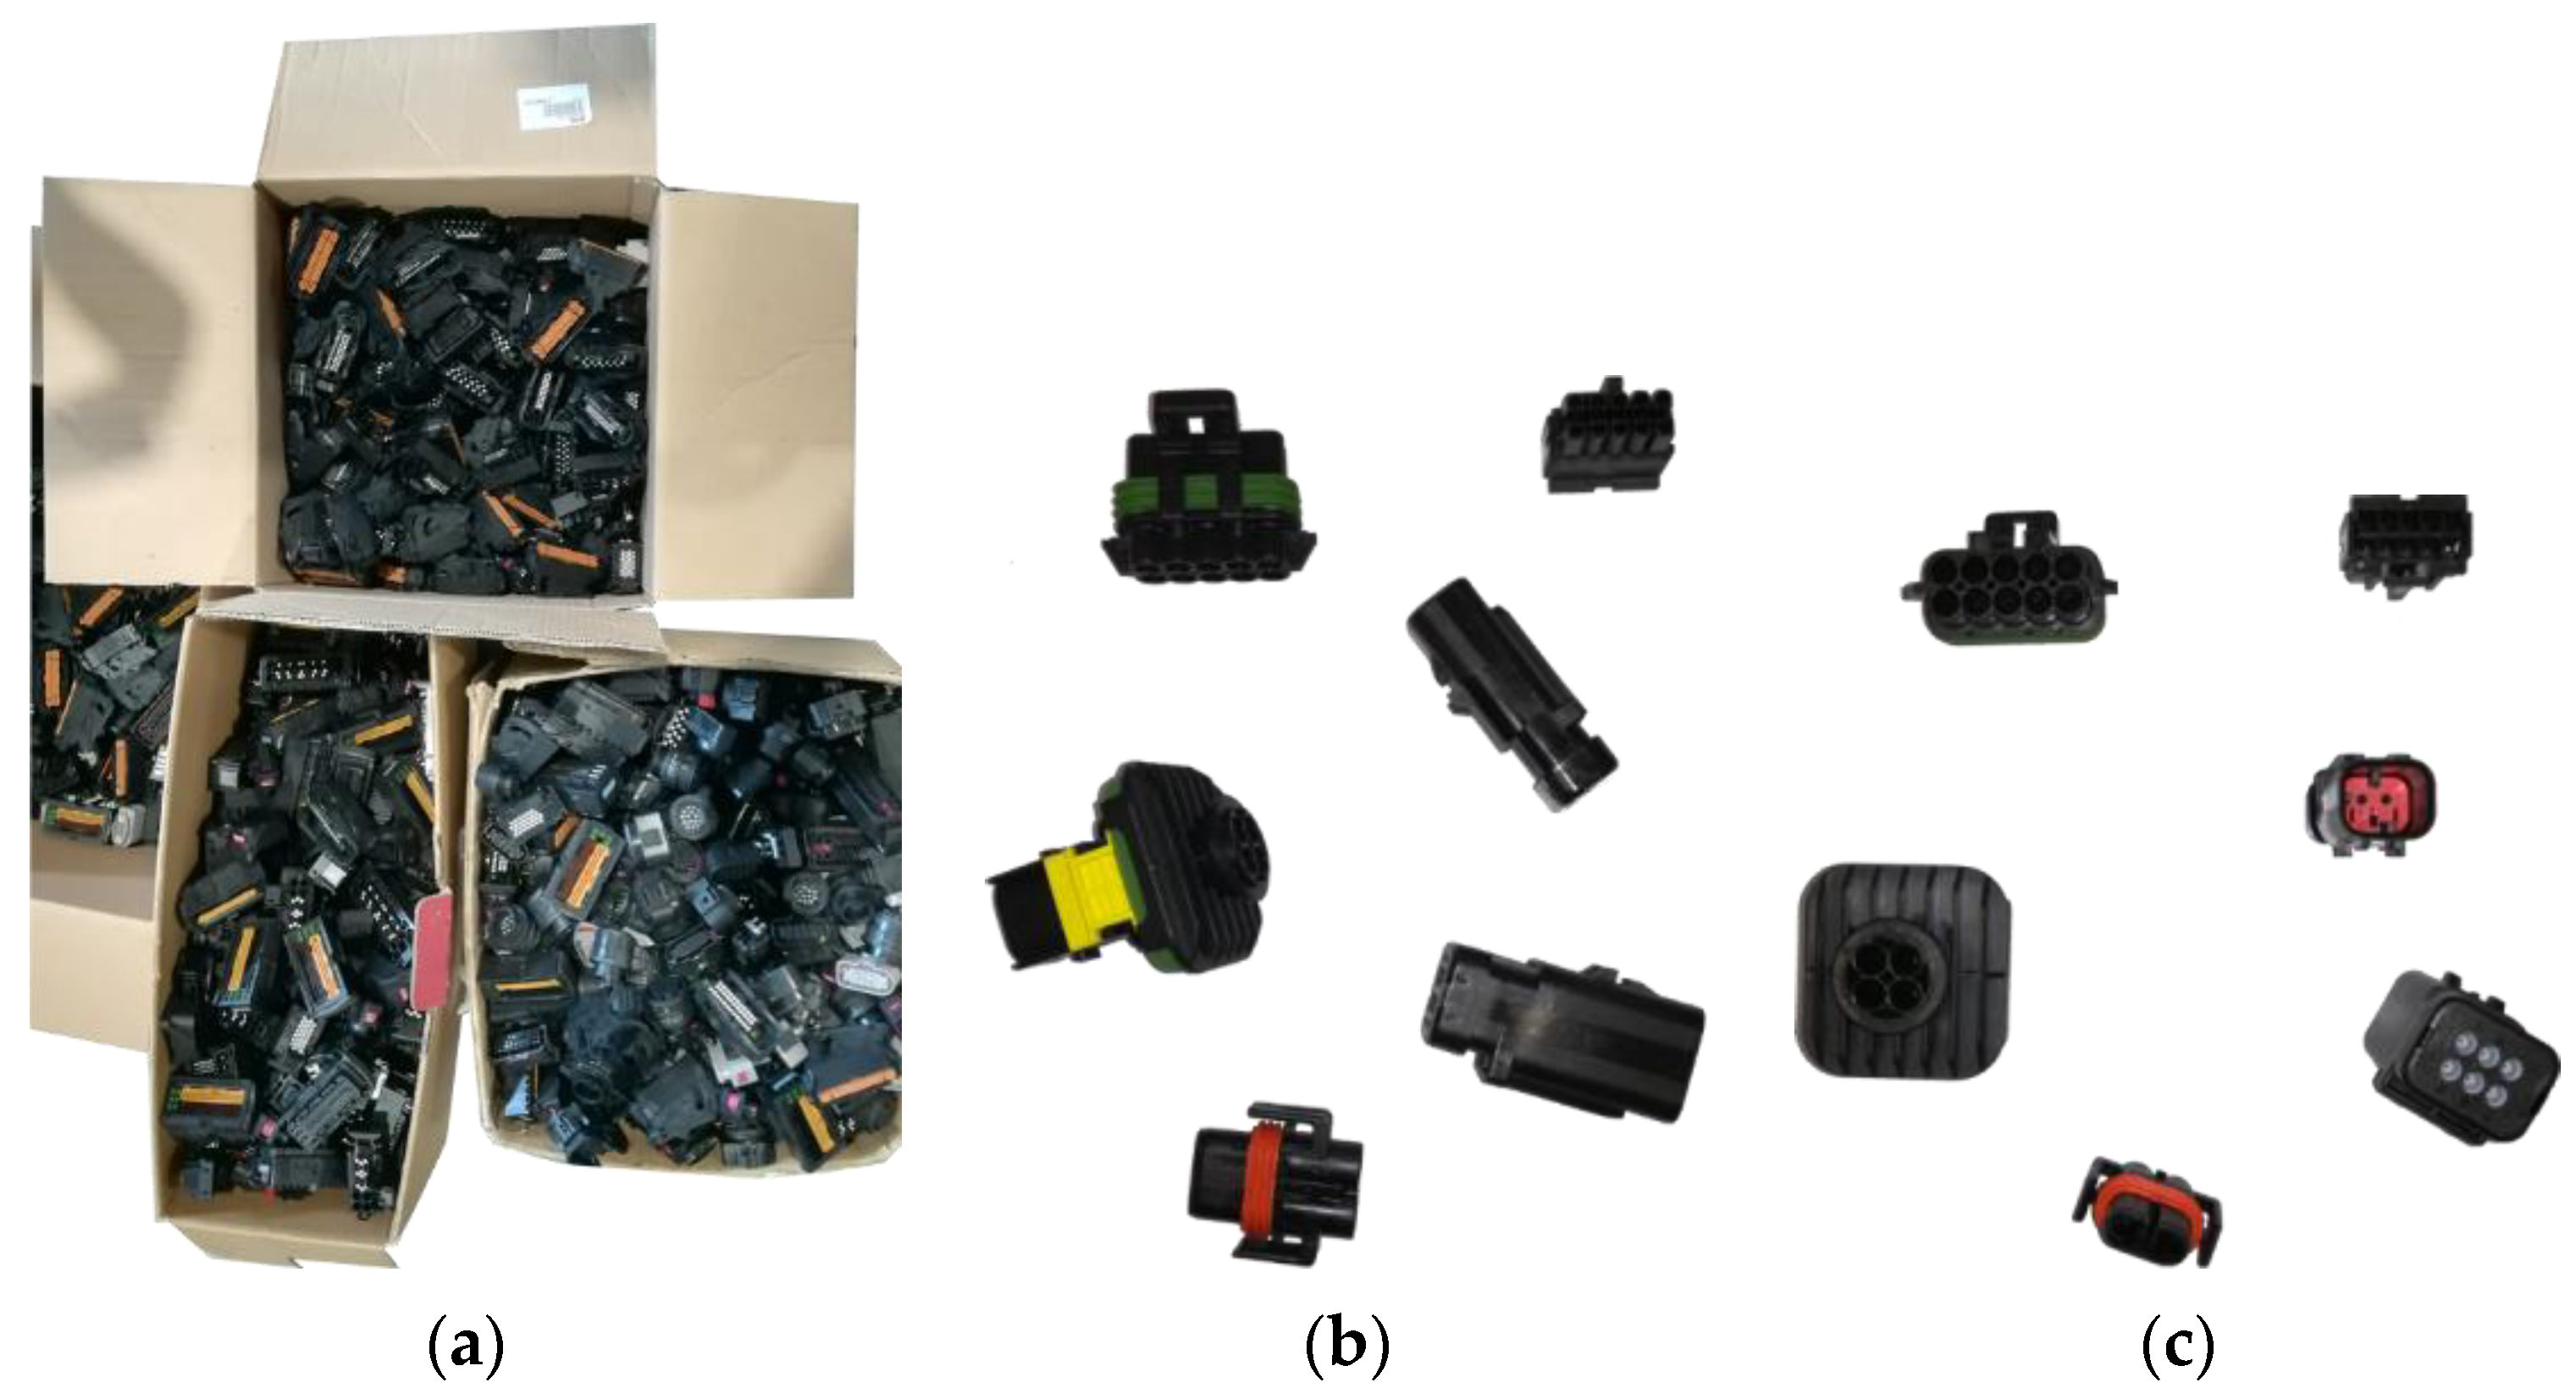
The process of assembling seals into connectors may produce a significant amount of poorly assembled connectors. The connectors that fail the quality tests are placed in large boxes for reuse. In the end, each box will contain multiple types of unsorted connectors, as depicted in
Figure 2a. Each box is then verted (still unsorted) in open trays and our goal is for the robot to perform the bin-picking process and sort the connectors into different output boxes.
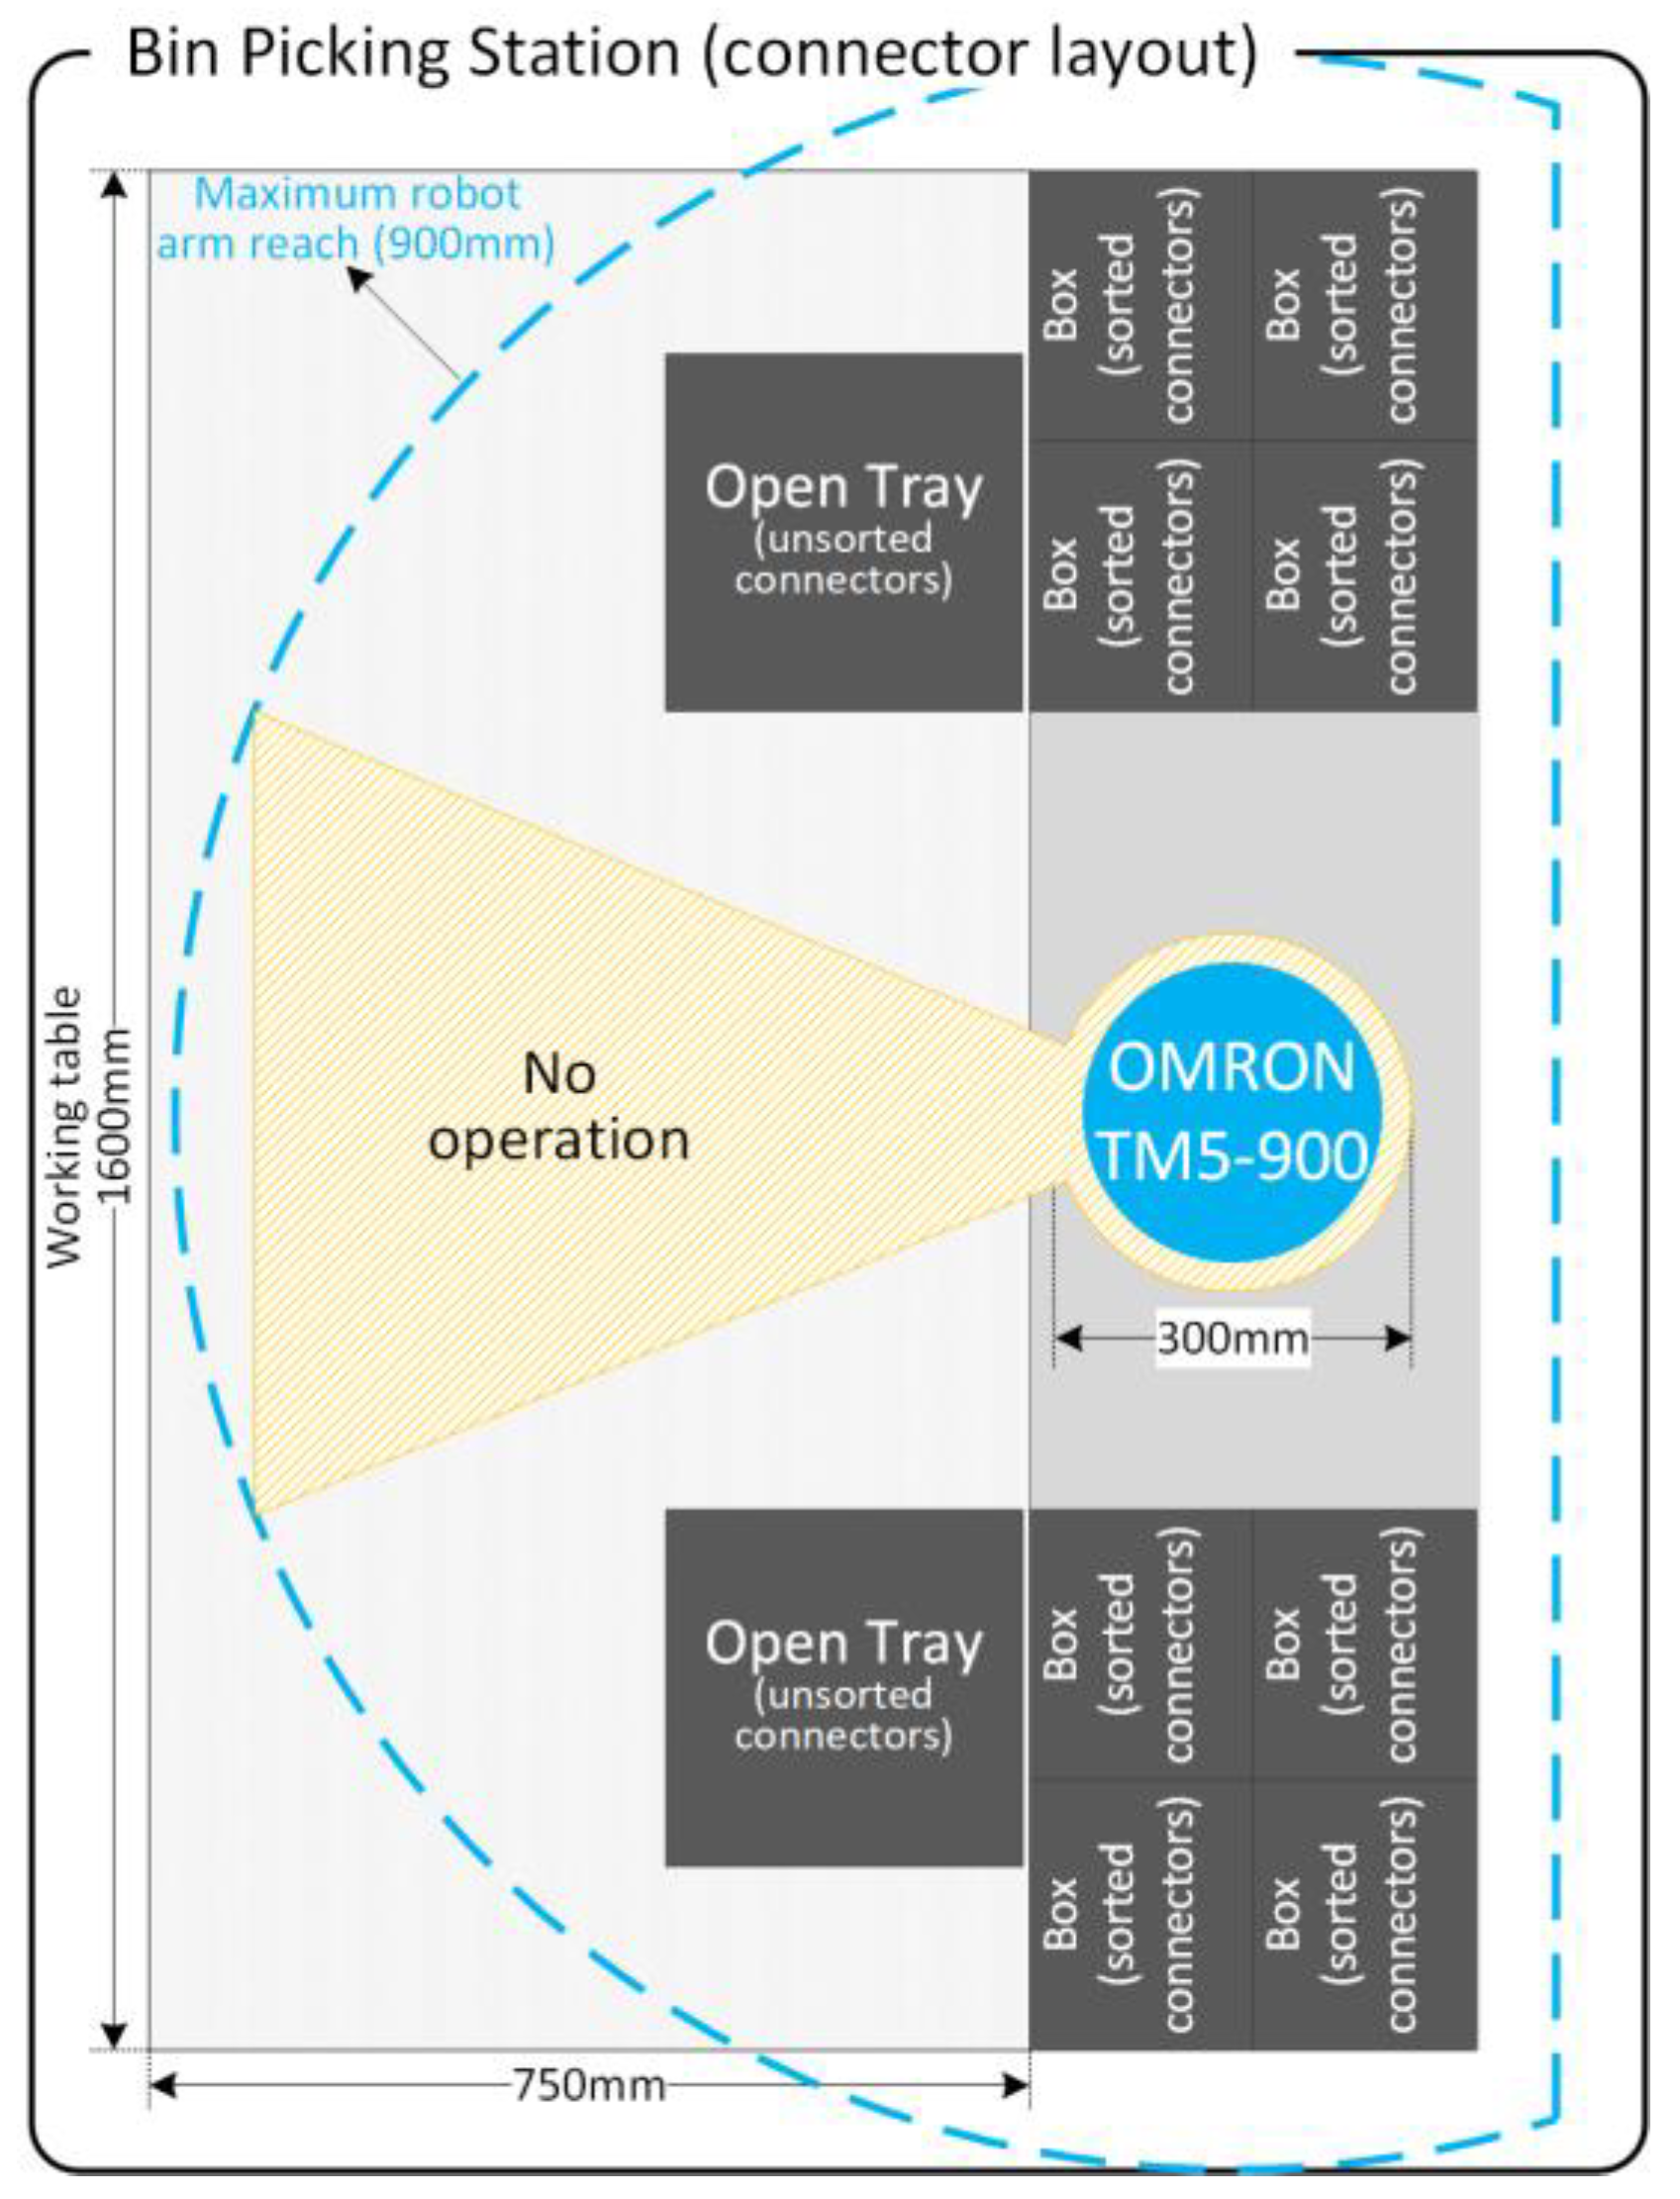
The operation takes place in a ‘Bin-Picking Station’ (see
Figure 3), which consists of a collaborative robot for parts’ manipulation, one Intel RealSense camera for stereoscopic (3D) vision, one working table, two ‘Open Trays’ containing unsorted small plastic connectors and eight ‘boxes’, where the robot will put the sorted connectors.
This station is responsible for grasping the connectors in the ‘Open Trays’ and sorting the connectors into the output boxes, correctly aligned to be reused in other workstations to remove seals and re-insert the connectors into the production lines. As can be seen in
Figure 3, the layout has been prepared to maximize the robot’s working area and operating times. As a collaborative robot is used, it can work on one side of the station, left or right, while an operator can insert new bins and remove sorted boxes on the other side, reducing downtimes as much as possible.
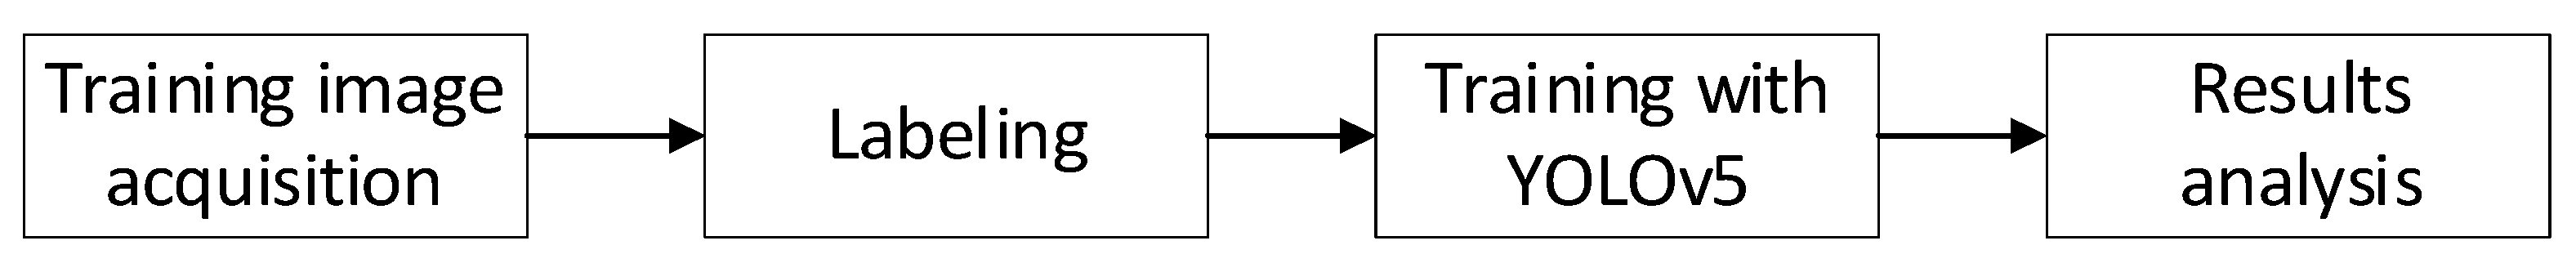
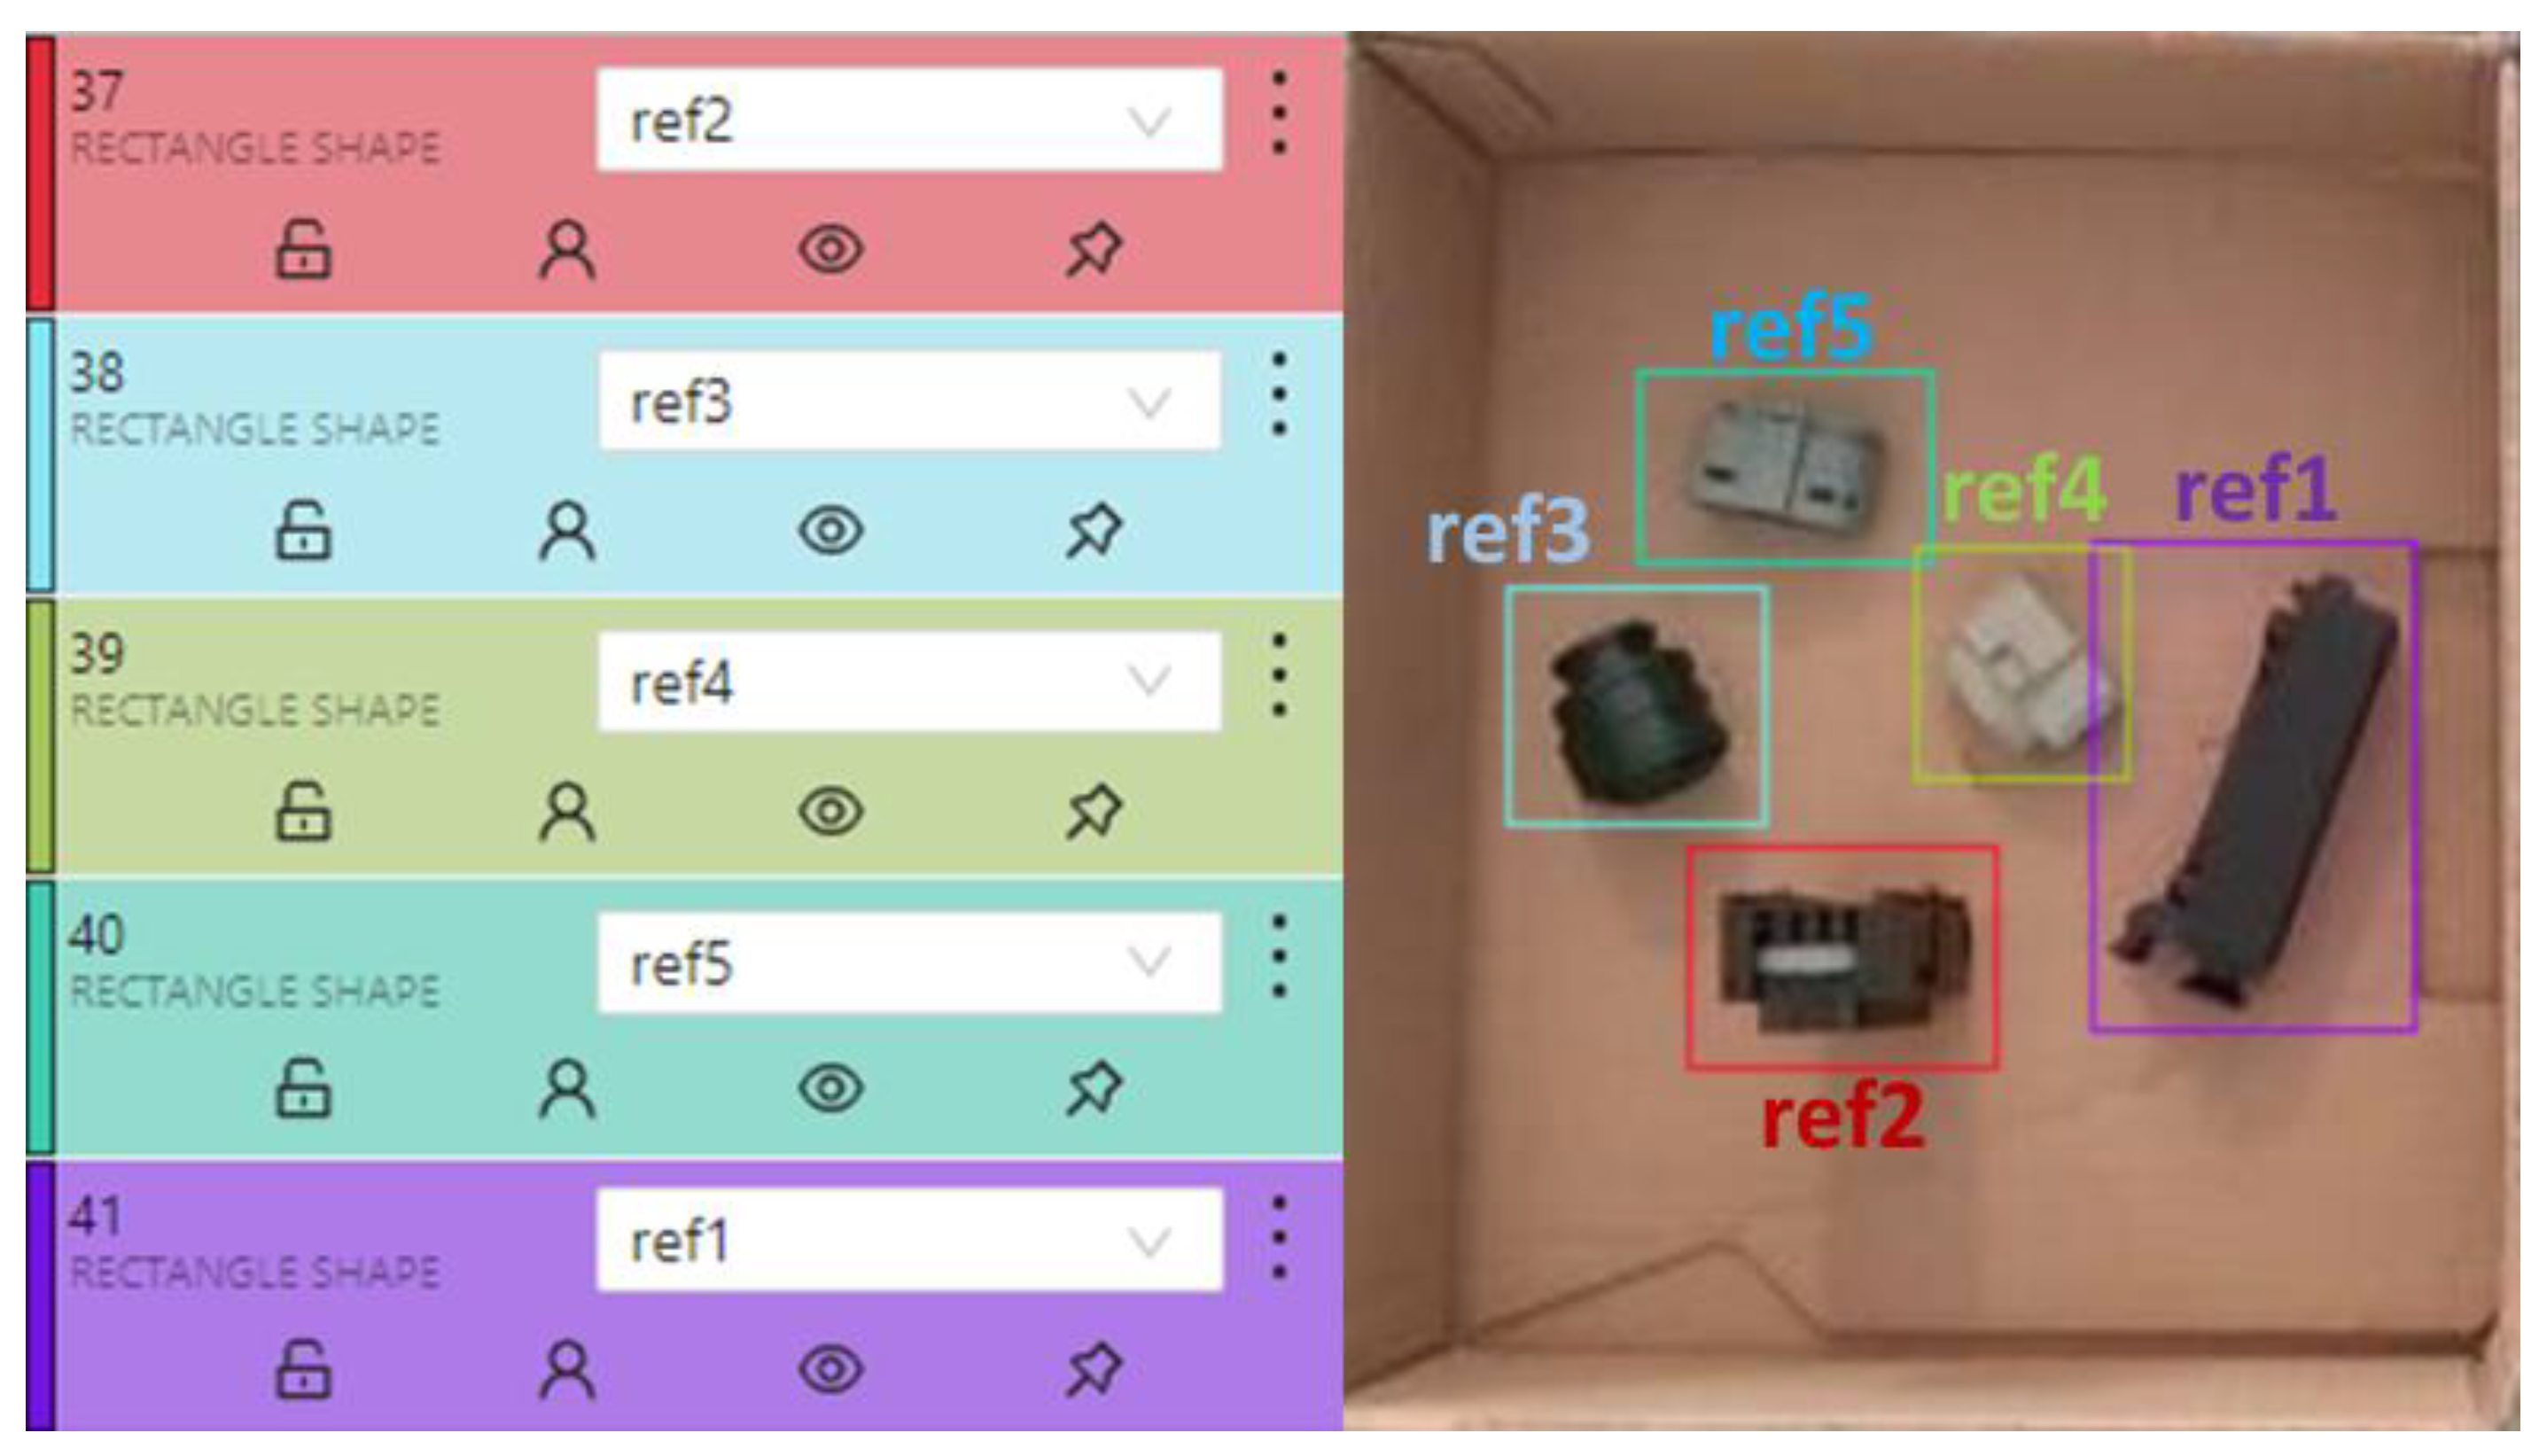
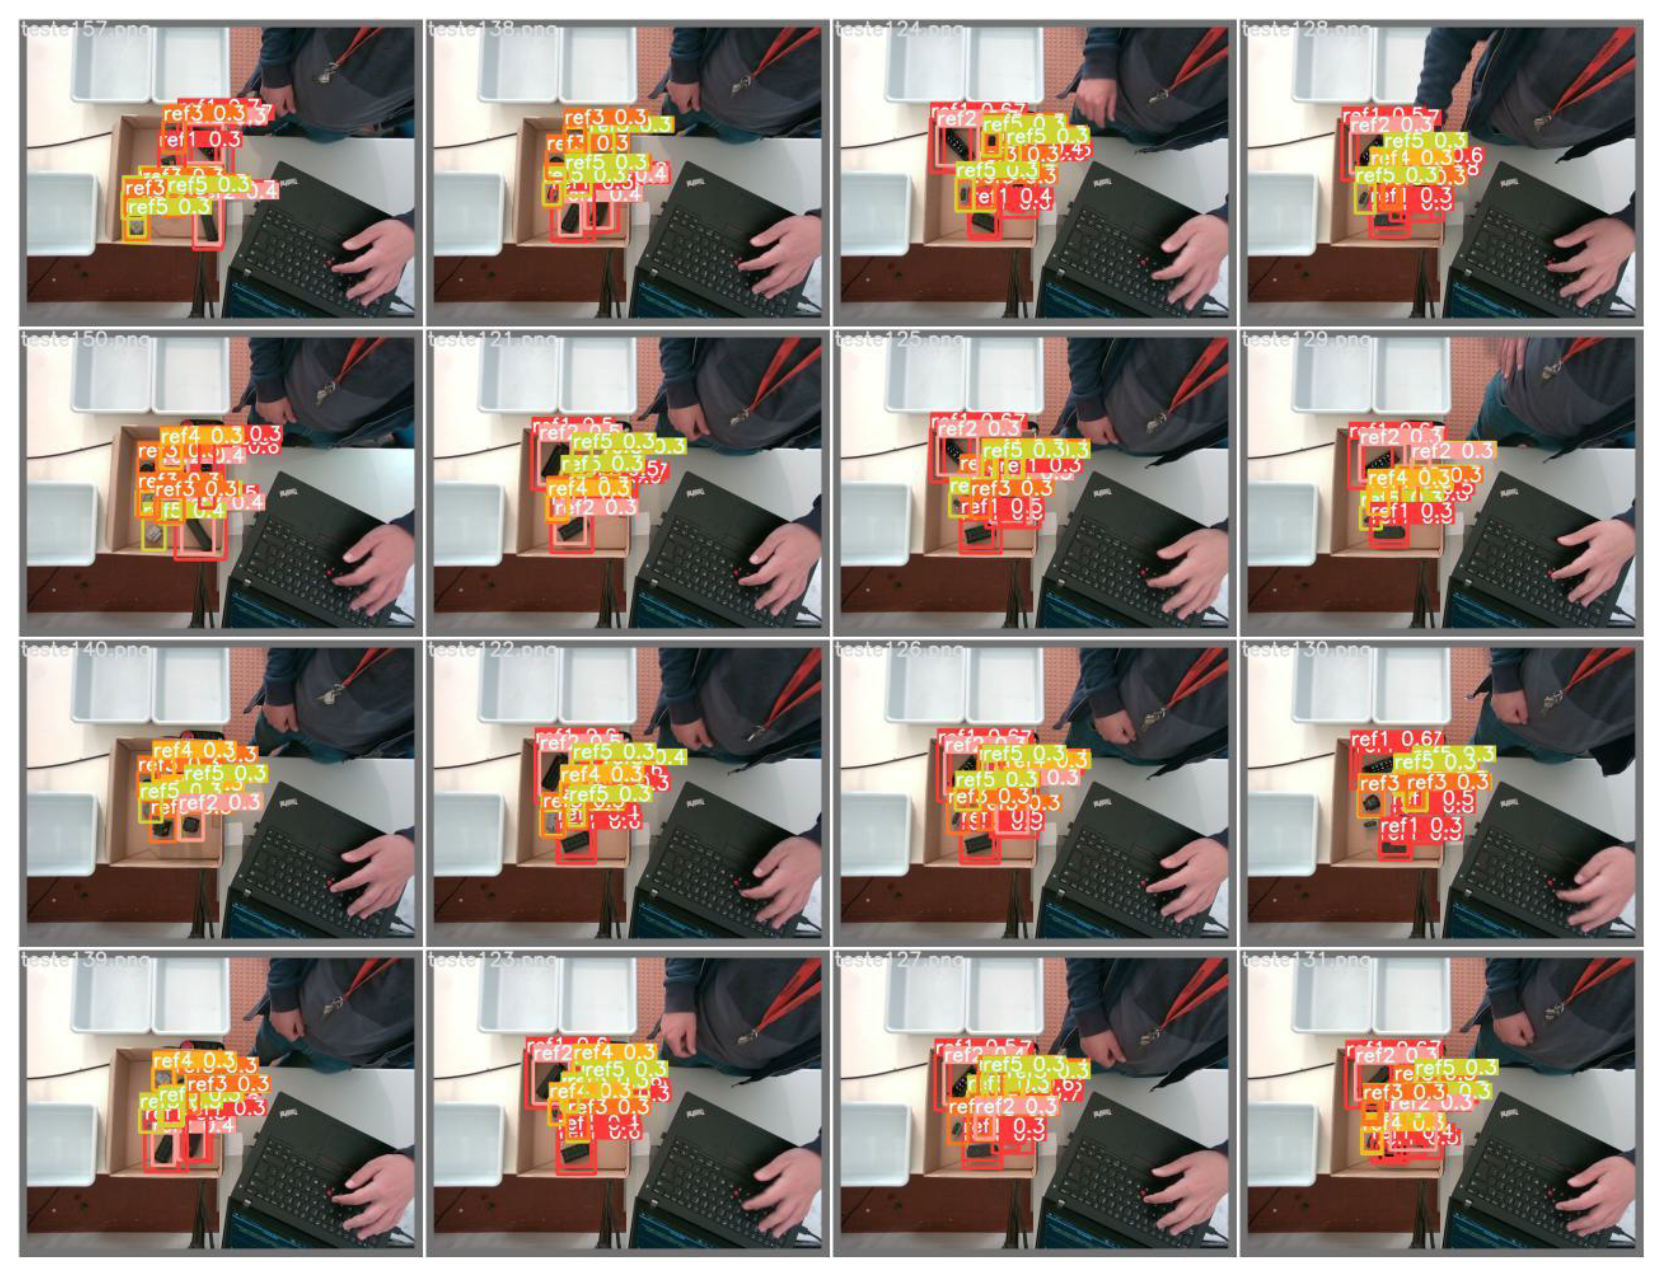
The success of object detection is strongly influenced by the labeling and training of the objects to be detected. The tasks performed in the training process for any object detection are typically composed of four stages, as depicted in
Figure 4. Several images of the connectors in different poses and under different lighting conditions were acquired to cover as much of the variability as possible in the Bin-Picking Workstation. Using a labeling application, by defining regions, references were created for all connectors, as depicted in
Figure 5.
The outputs generated in the labeling application were then used in the training process. In the training task, the images and labels were organized into training, testing and validation groups. The PyTorch-based algorithm, YOLOv5, was configured and used to train the data. YOLOv5 allowed us to work with different levels of complexity associated with neural networks. At the time, four models were of interest to us: YOLOv5s (small), YOLOv5m (medium), YOLOv5l (large) and YOLOv5x (extra (X)large).
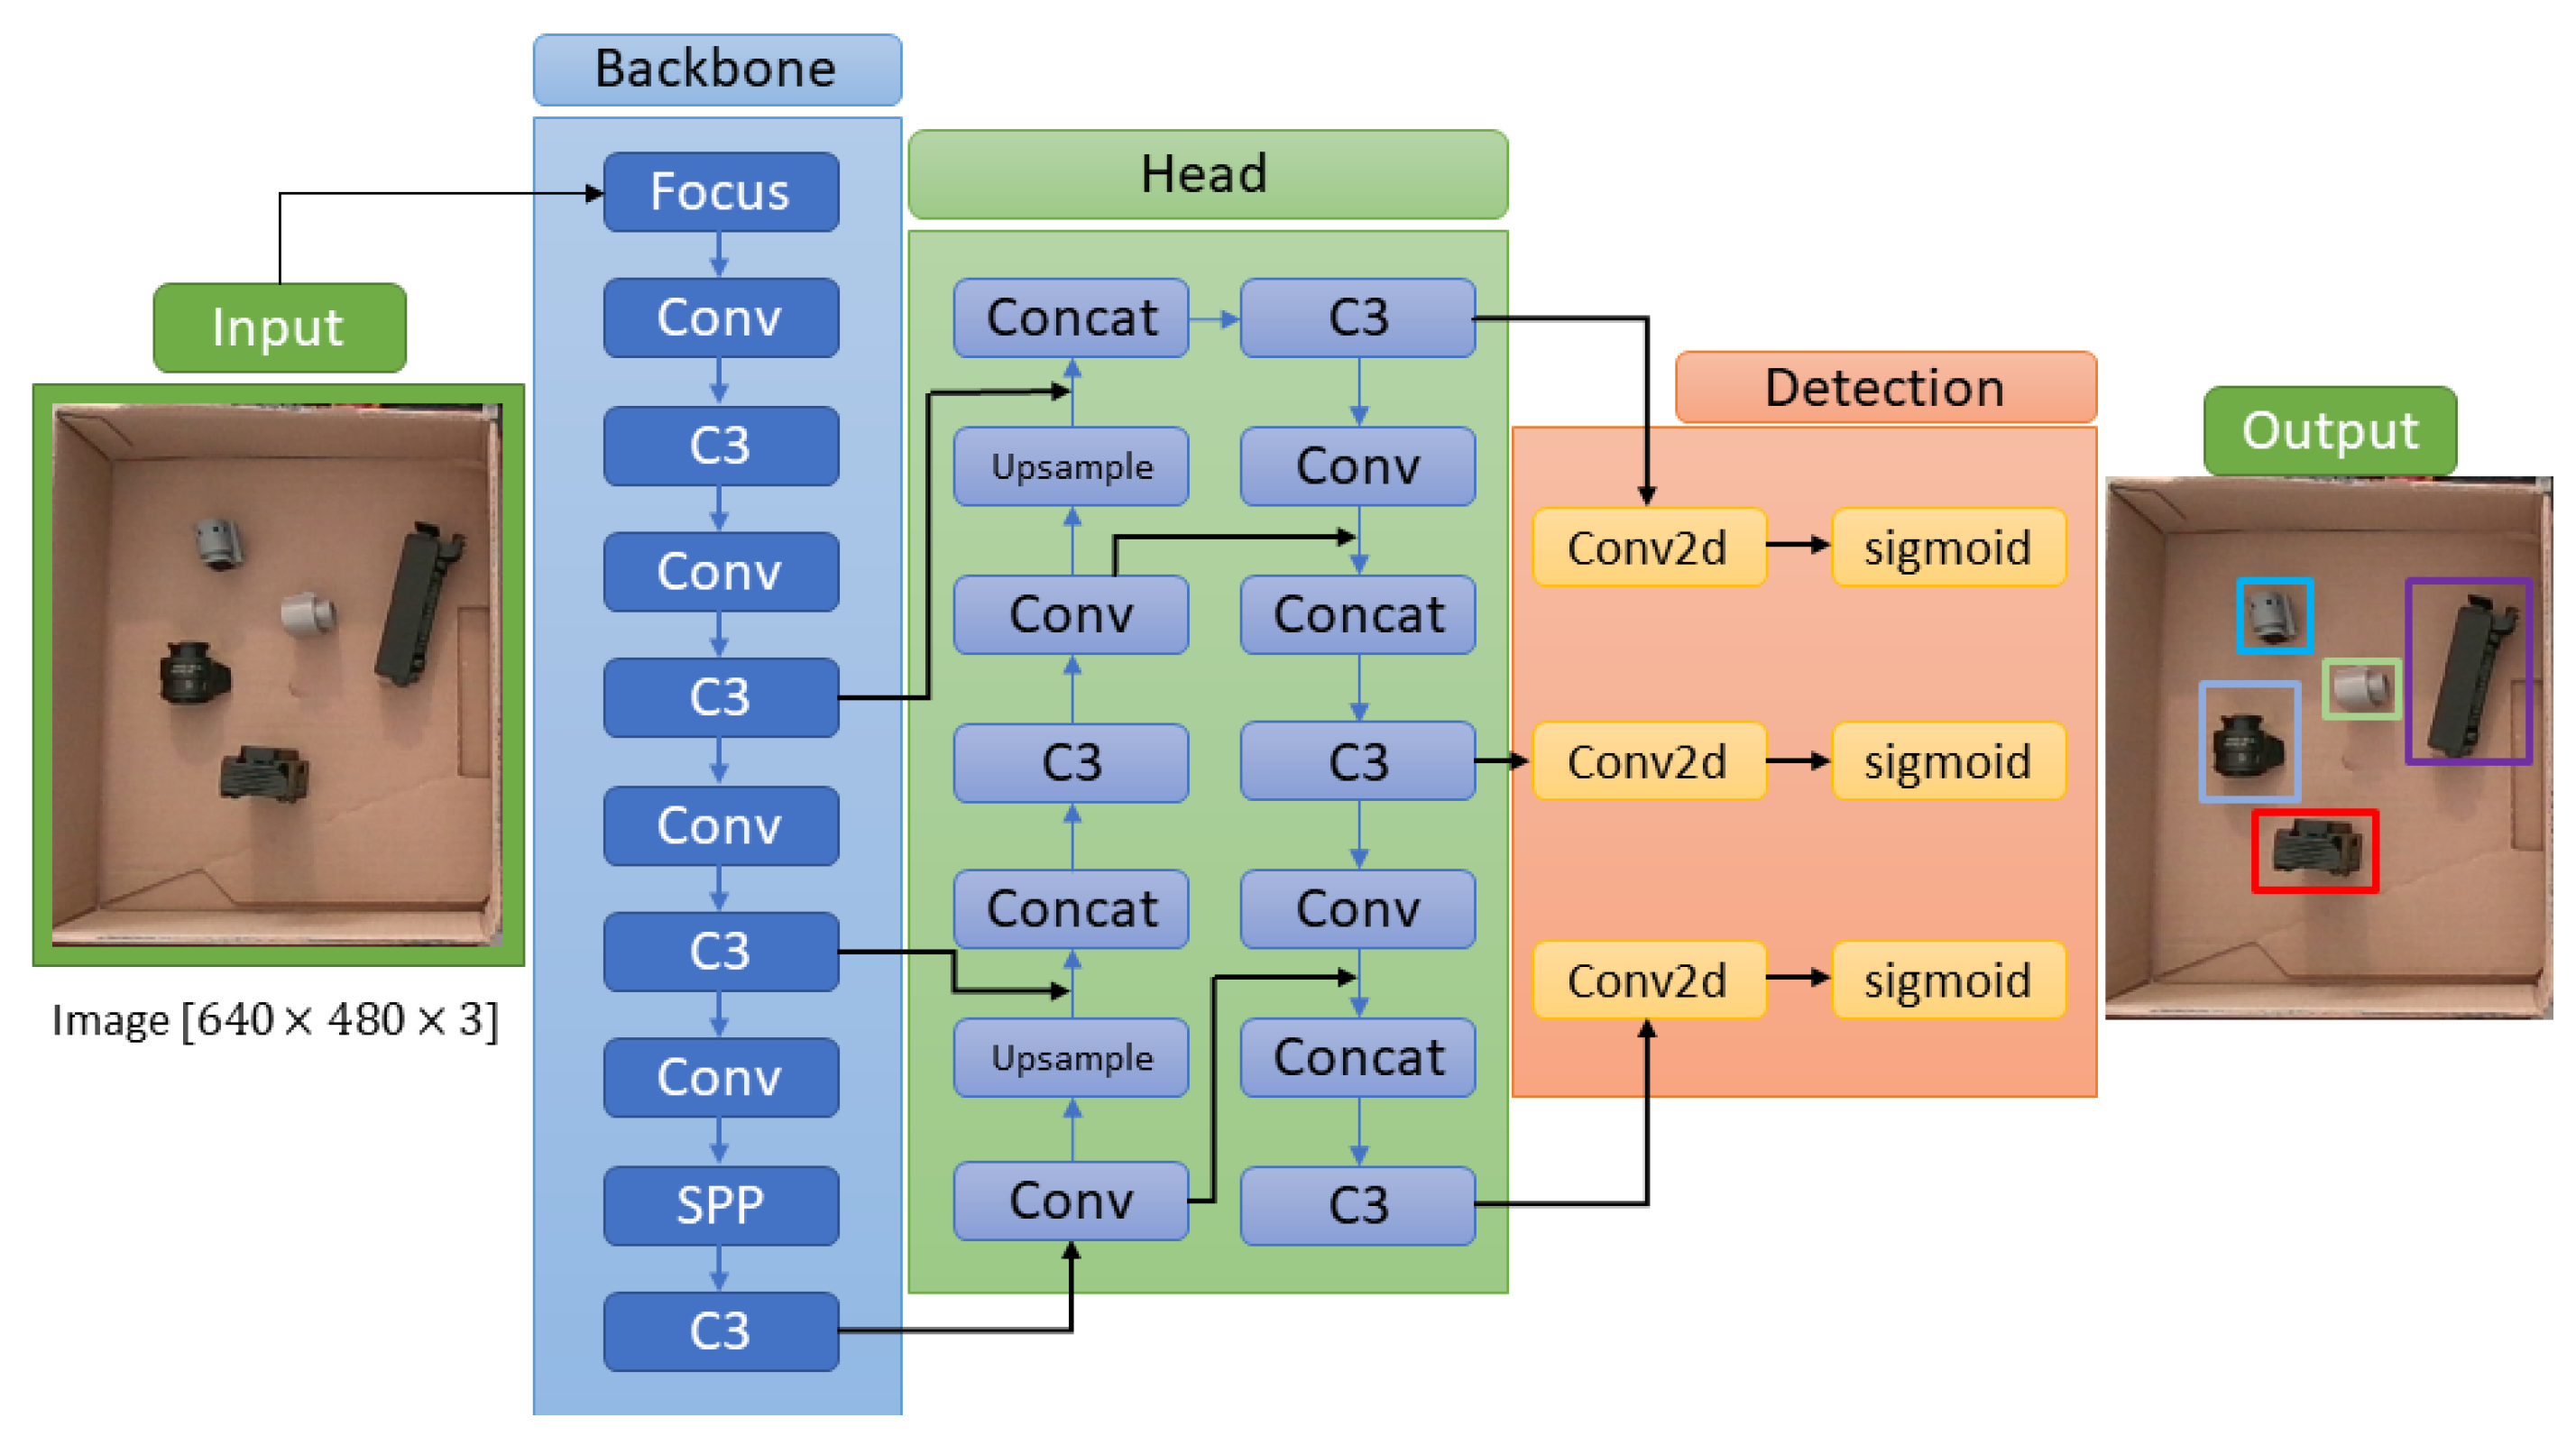
The main difference of each version is in the complexity and number of hidden layers of each deep neural network, which varies from simpler (small) to more complex (Xlarge). To choose the best version to use in each application, a trade-off analysis between speed, computational processing time and accuracy is required. Larger neural networks favor better accuracy results, but on the other hand the computational cost tends to be very slow, sometimes not valid for real-time applications. All YOLOv5 versions were tested and the YOLOv5s was selected for the final application, as it produced the best accuracy–speed–robustness relation for our use case. The YOLOv5 object detection algorithm works like a regression problem with three main components or sections, the Backbone, the Head and the Detection, as illustrated in
Figure 6. The Backbone is a CNN that collects and models image resources at different granularities. The Head is a series of layers to combine image resources to throw them into a prediction process. Detection is a process that uses Head resources and performs box and class prediction steps. To do this, a loss function for bounding boxes’ predictions based on the distance information between the predicted frame and the real frame, known as Generalized Intersection over Union (GIoU), is used. This function is proposed in [
26] and described by Equation (1):
where
is the Intersection over Union, a common evaluation metric used to measure the accuracy of an object detector, by comparing two arbitrary shapes (volumes)
A and
B:
and
C is the smallest convex shape involving
A and
B.
To obtain valid outputs, YOLOv5 requires training datasets to have a minimum of 100 images. It is known that by increasing the dataset size, the output results improve, however, there is a side effect since we need to consider the compromise between the dimension of the datasets and the associated processing time in the training process. Several training experiments were performed, with a total of about 2000 different images of connectors.
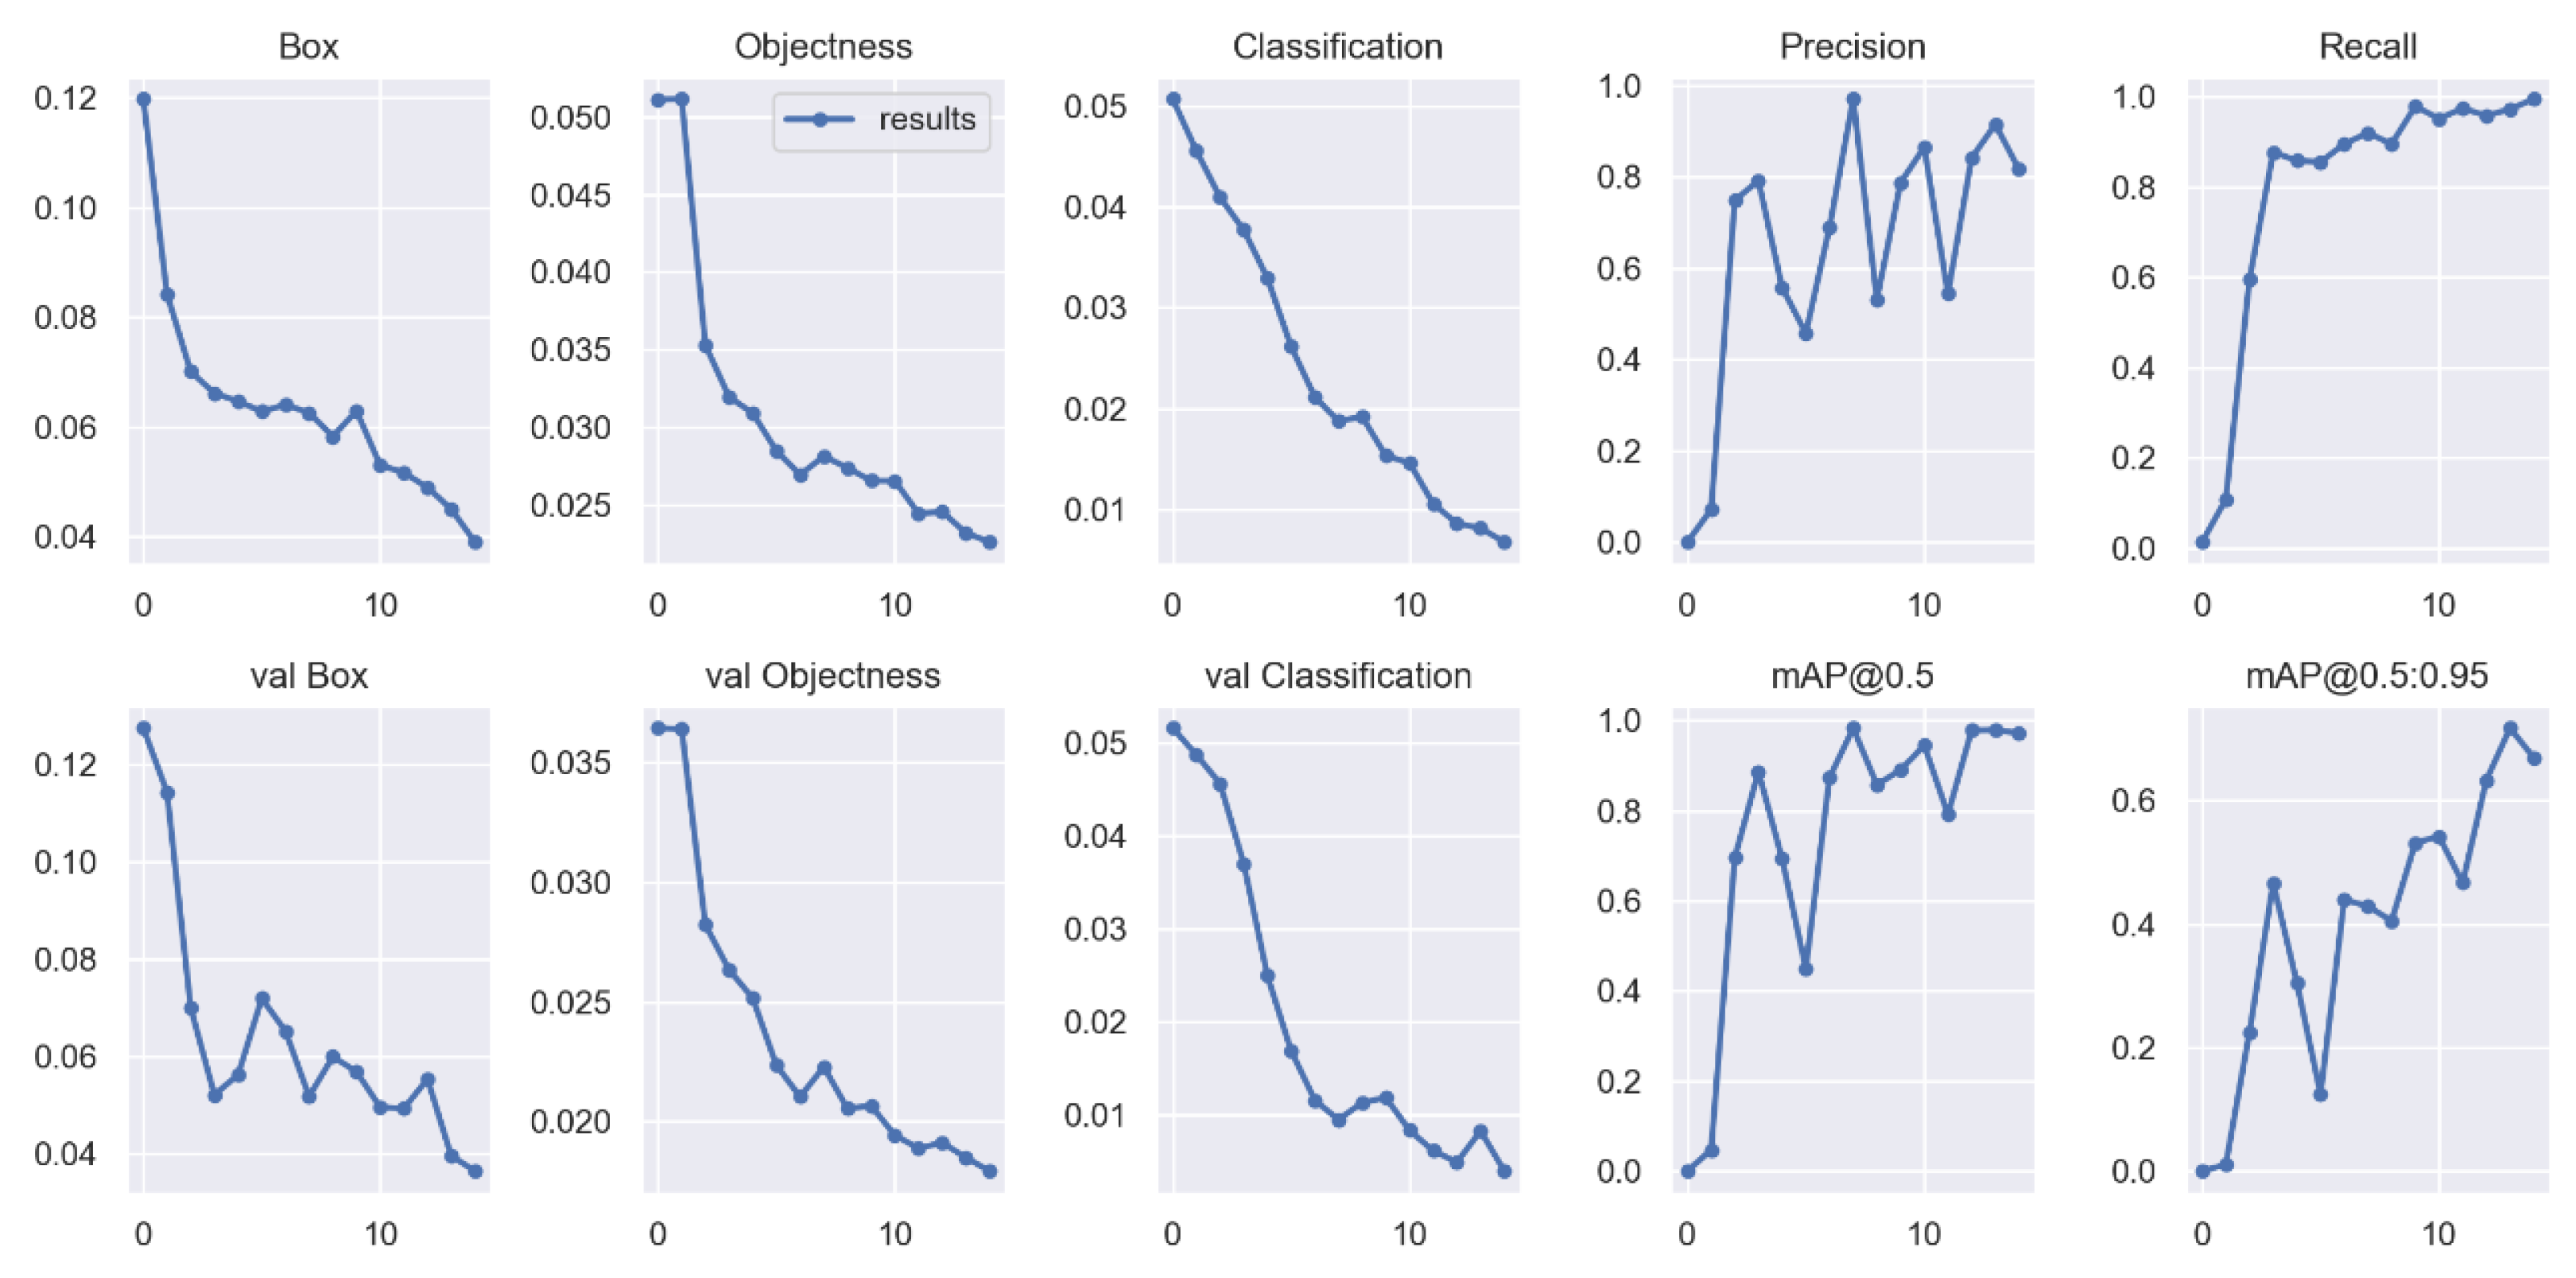
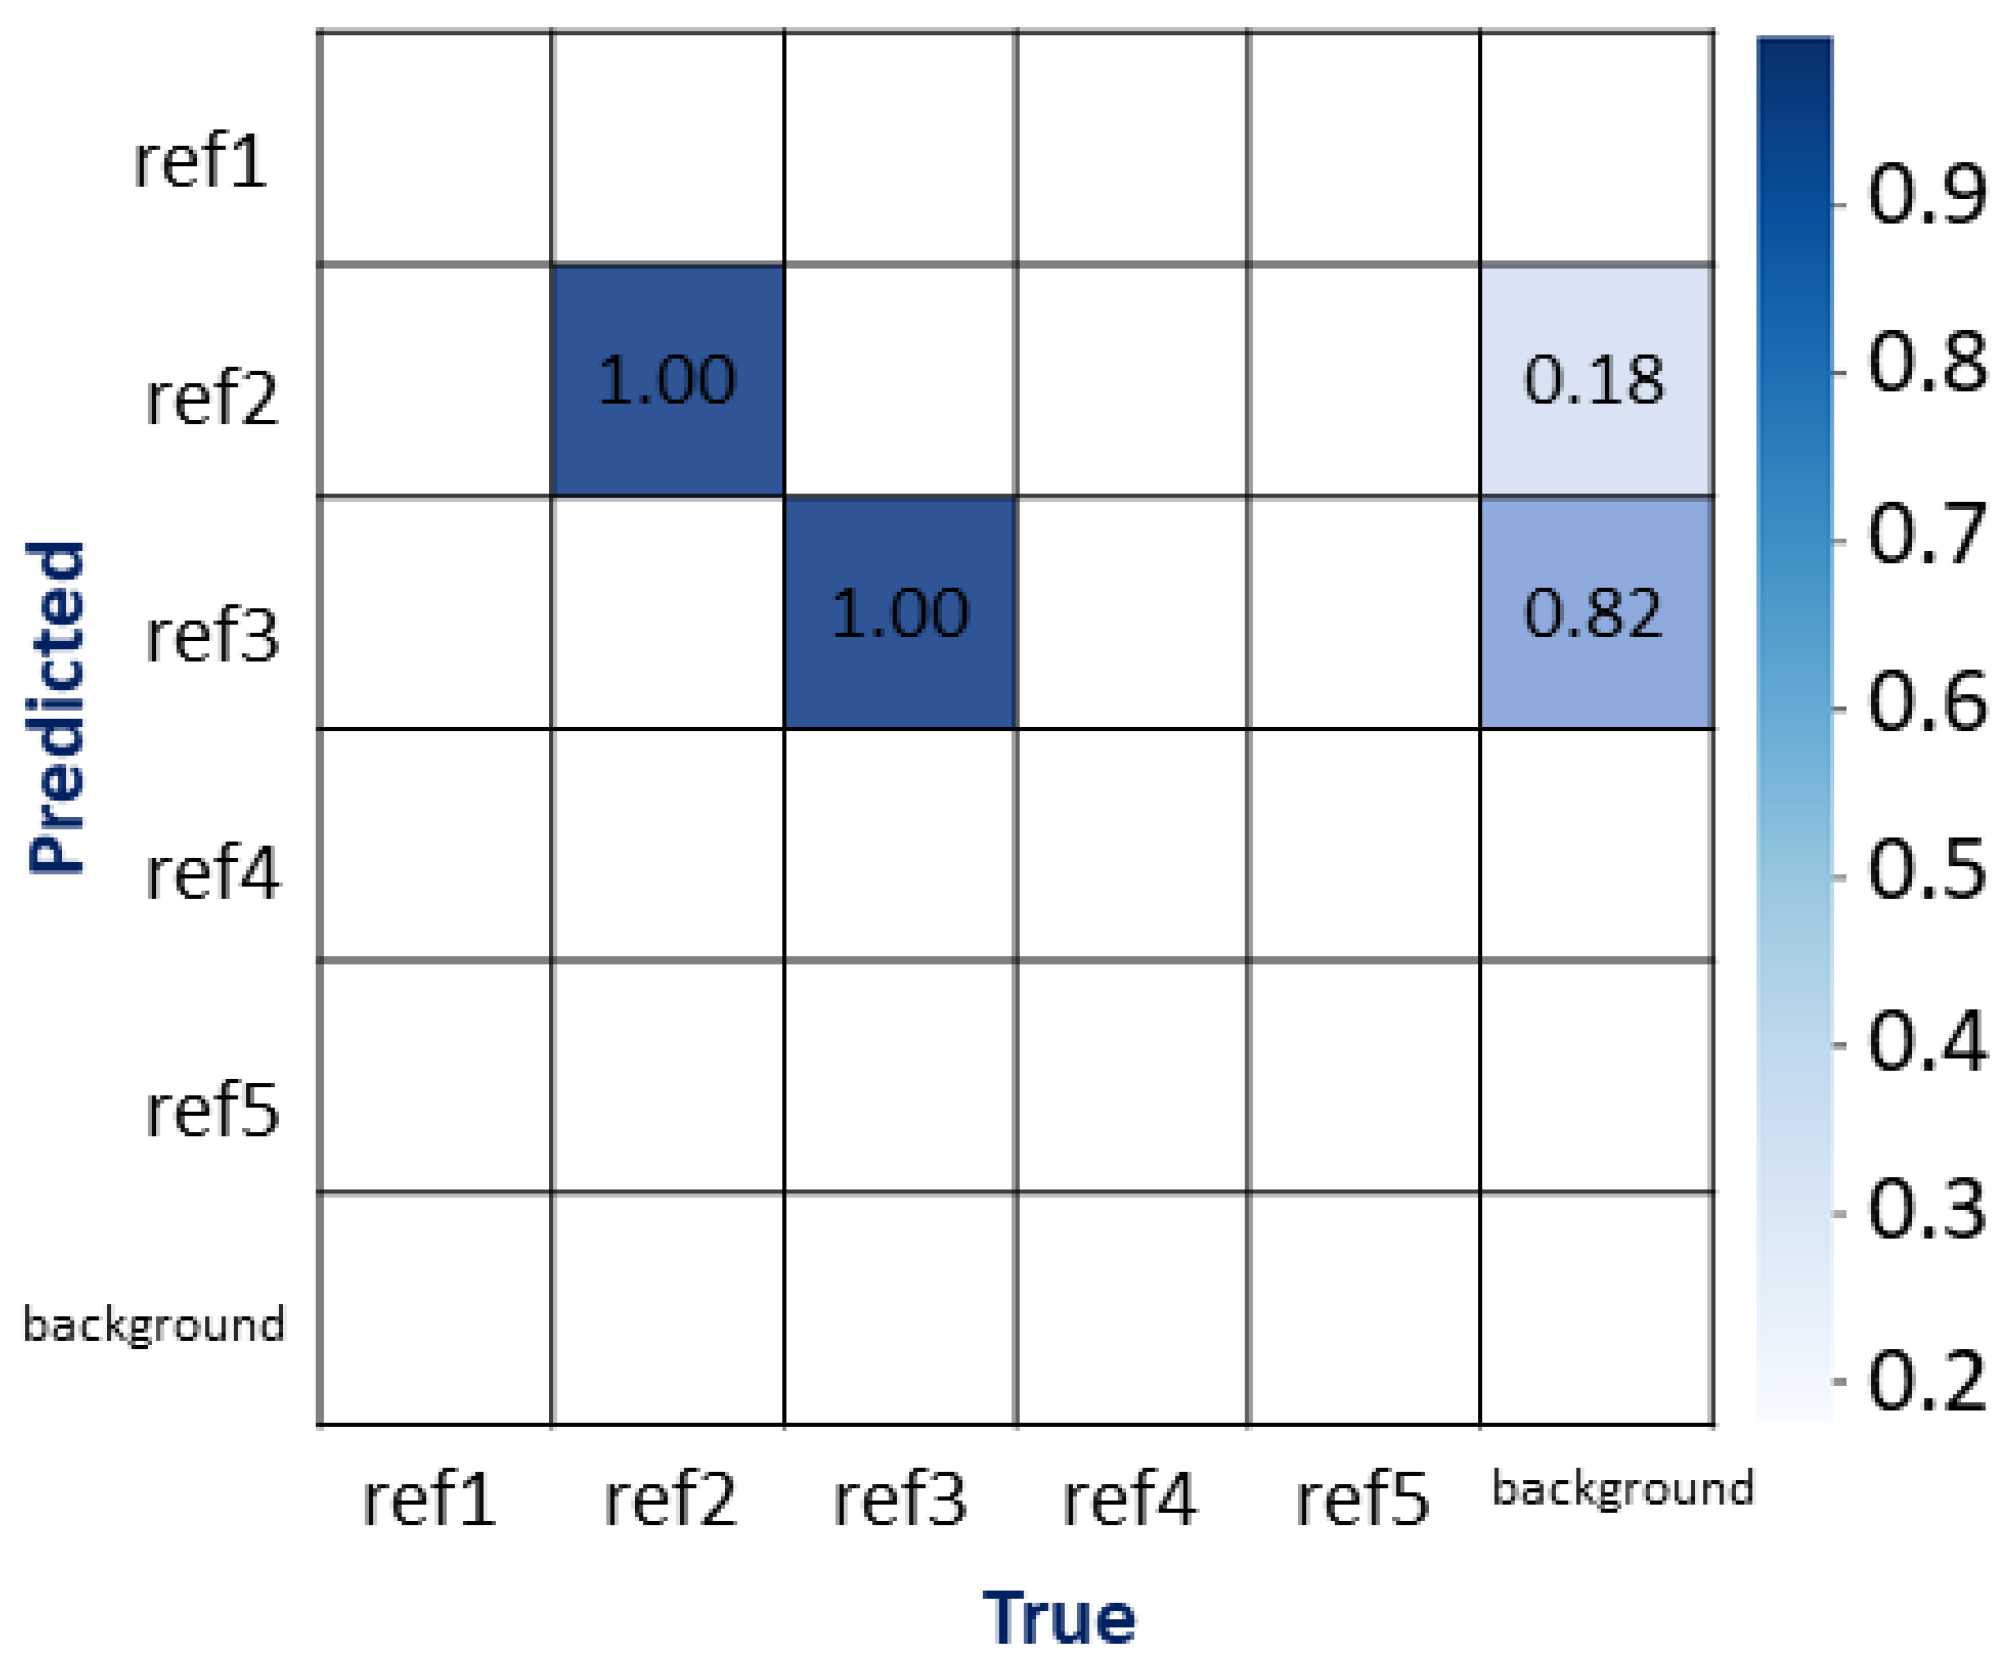
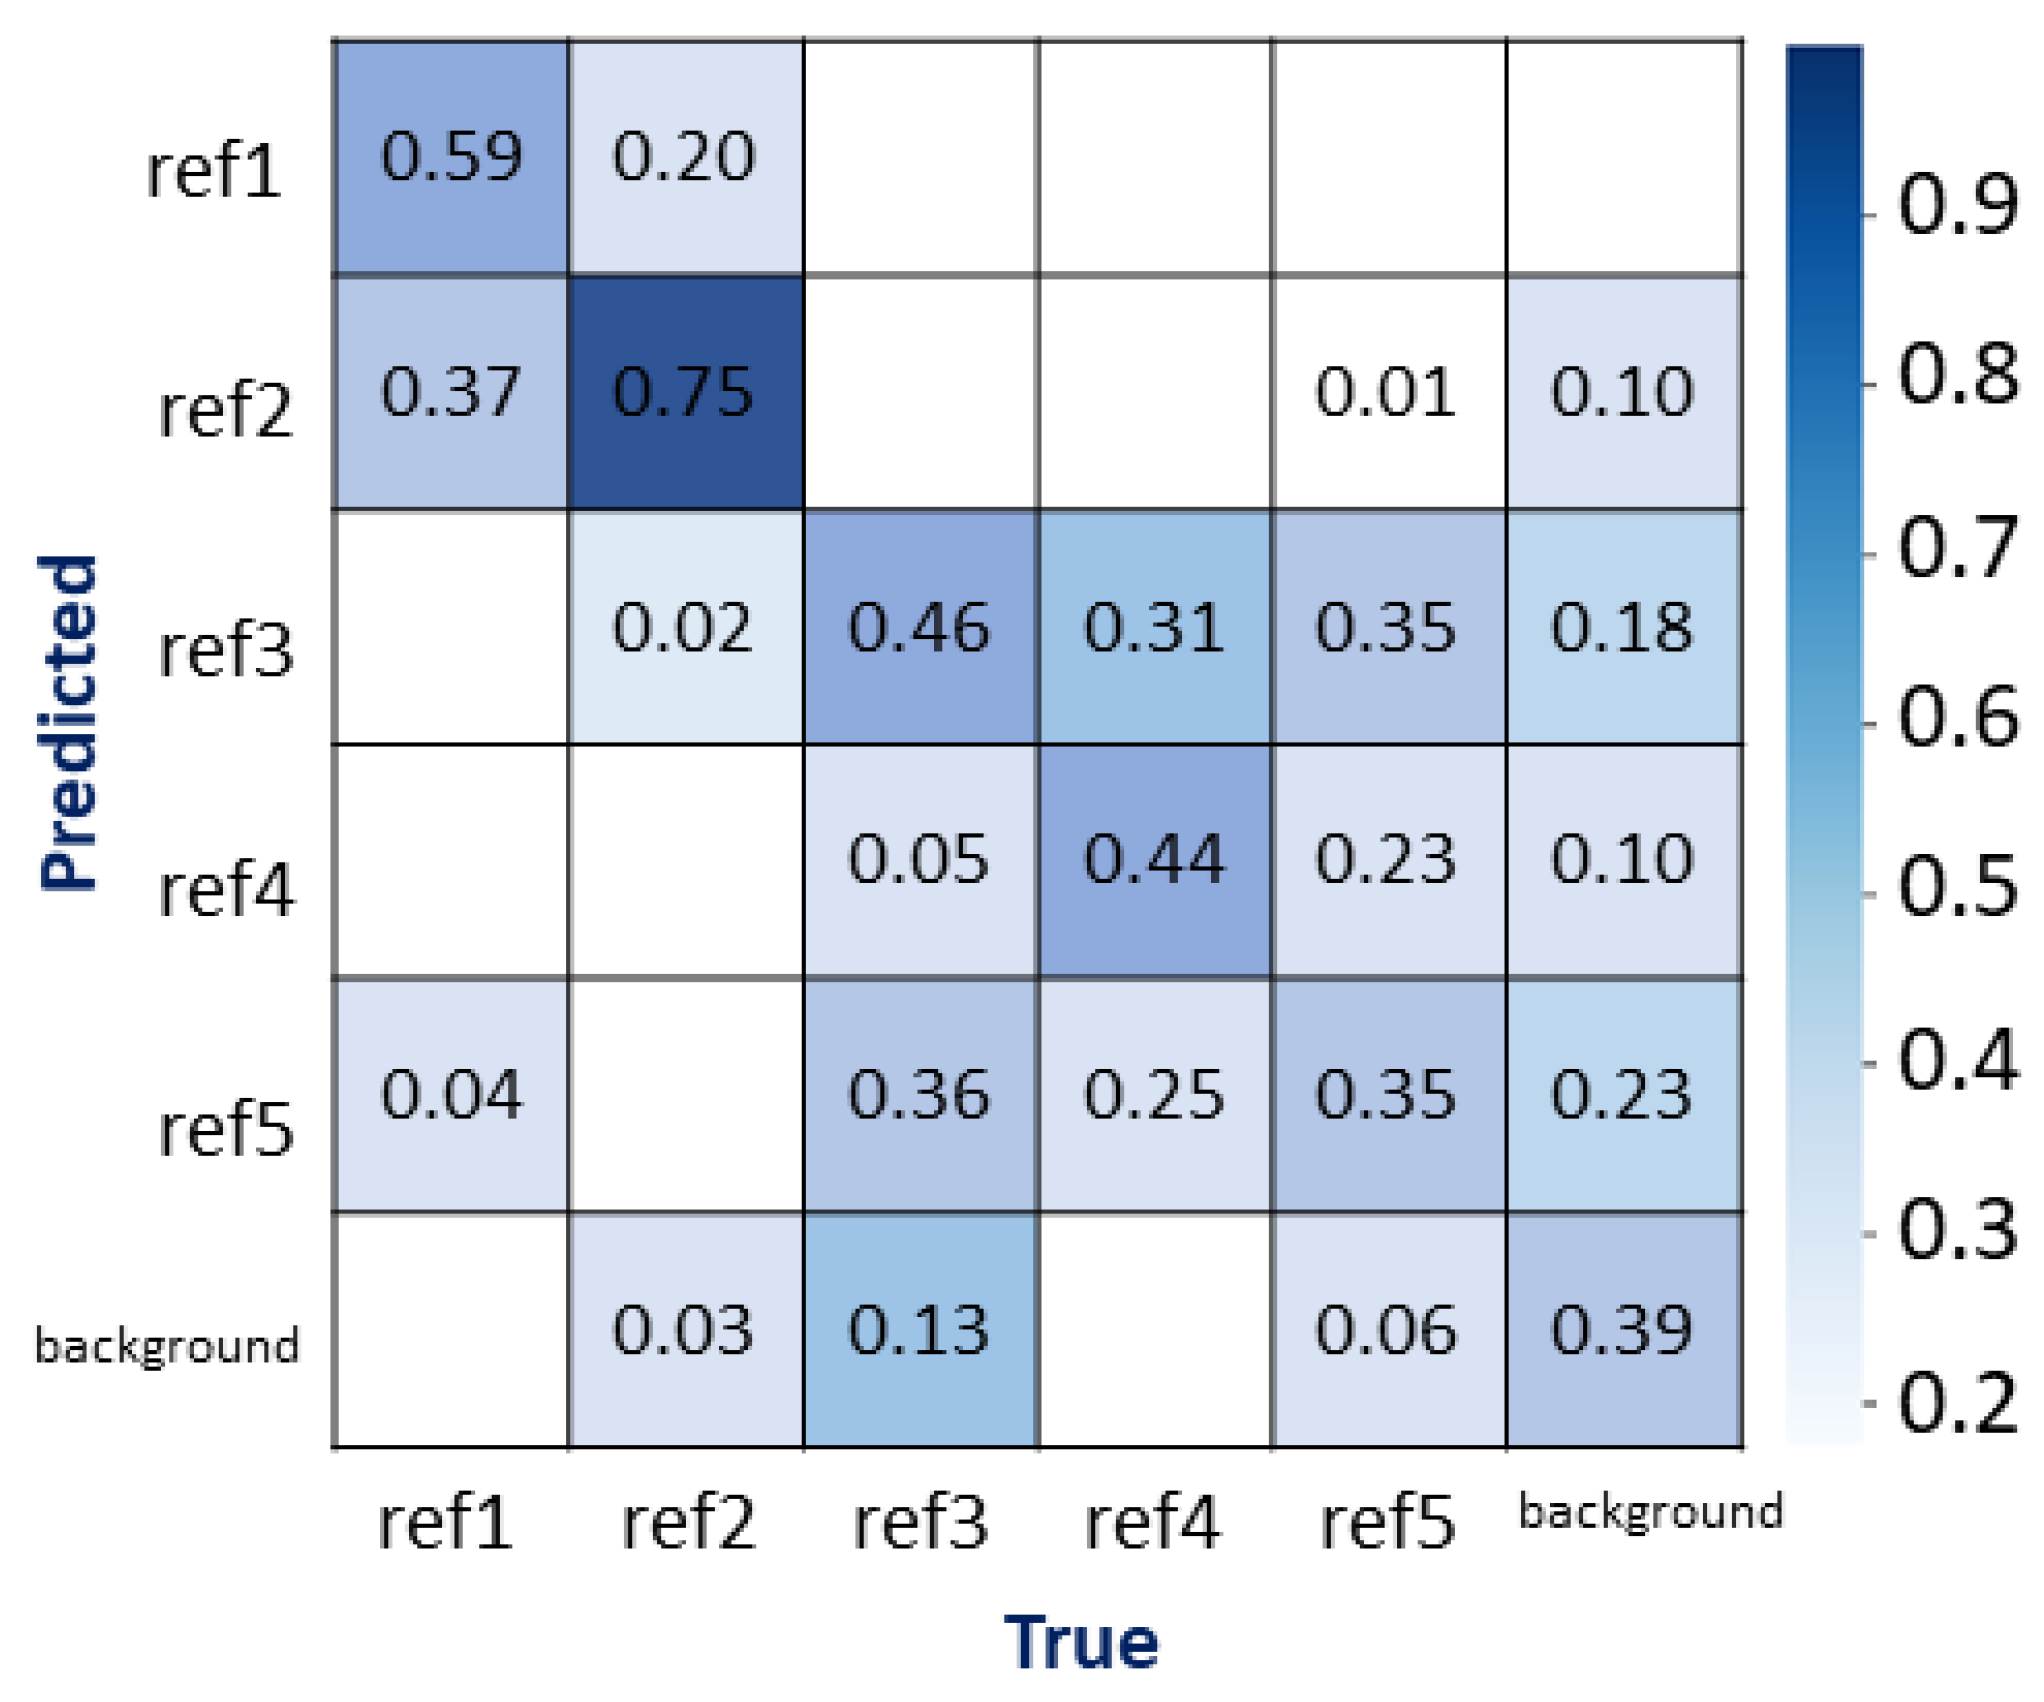
The evaluation of the classification algorithms performance is carried out by a confusion matrix. A confusion matrix is a table for summarizing the performance of a classification algorithm. Each row of the matrix represents the instances in an actual class while each column represents the instances in a predicted class, or vice versa. The computation of a confusion matrix can provide a better idea of what the classification model is getting right and what types of errors it is making.
Vision-Based Robot Navigation
Whether the grasping of objects is achieved by human resources or robotic systems, it is one of the main requirements in many manufacturing processes. However, in highly dense scenes, where the environment includes several uncertainties, such as randomly distributed objects, the robot navigation is closely related to the perception of the scene. This can be affected by features of the objects of interest as well as the previous and following manipulations. Besides the picking and placing of the object, the robotic system must perceive the environment and extract the required features from it to interact with it. Precise information about the location of the object of interest in space is one of the prerequisites to obtain a proper grasp position and therefore accomplish a successful grasp [
27].
The grasping process itself is usually split into several parts that typically depend on the type of gripper and the object of interest. Nevertheless, several standard grasping phases of the two-finger gripper can be identified: approaching the object, coming into contact with the object, increasing the force until the object is securely grasped and moving the object until it can be released in the place position [
28]. In bin-picking settings, a surrounding-aware visual perception system in a combination with the correct approach and retreat movements is a remarkably important part of the navigation system. Objects are randomly distributed, and unintended collisions that can occur with the bin, other environmental elements and the robot itself should be strictly avoided [
29].
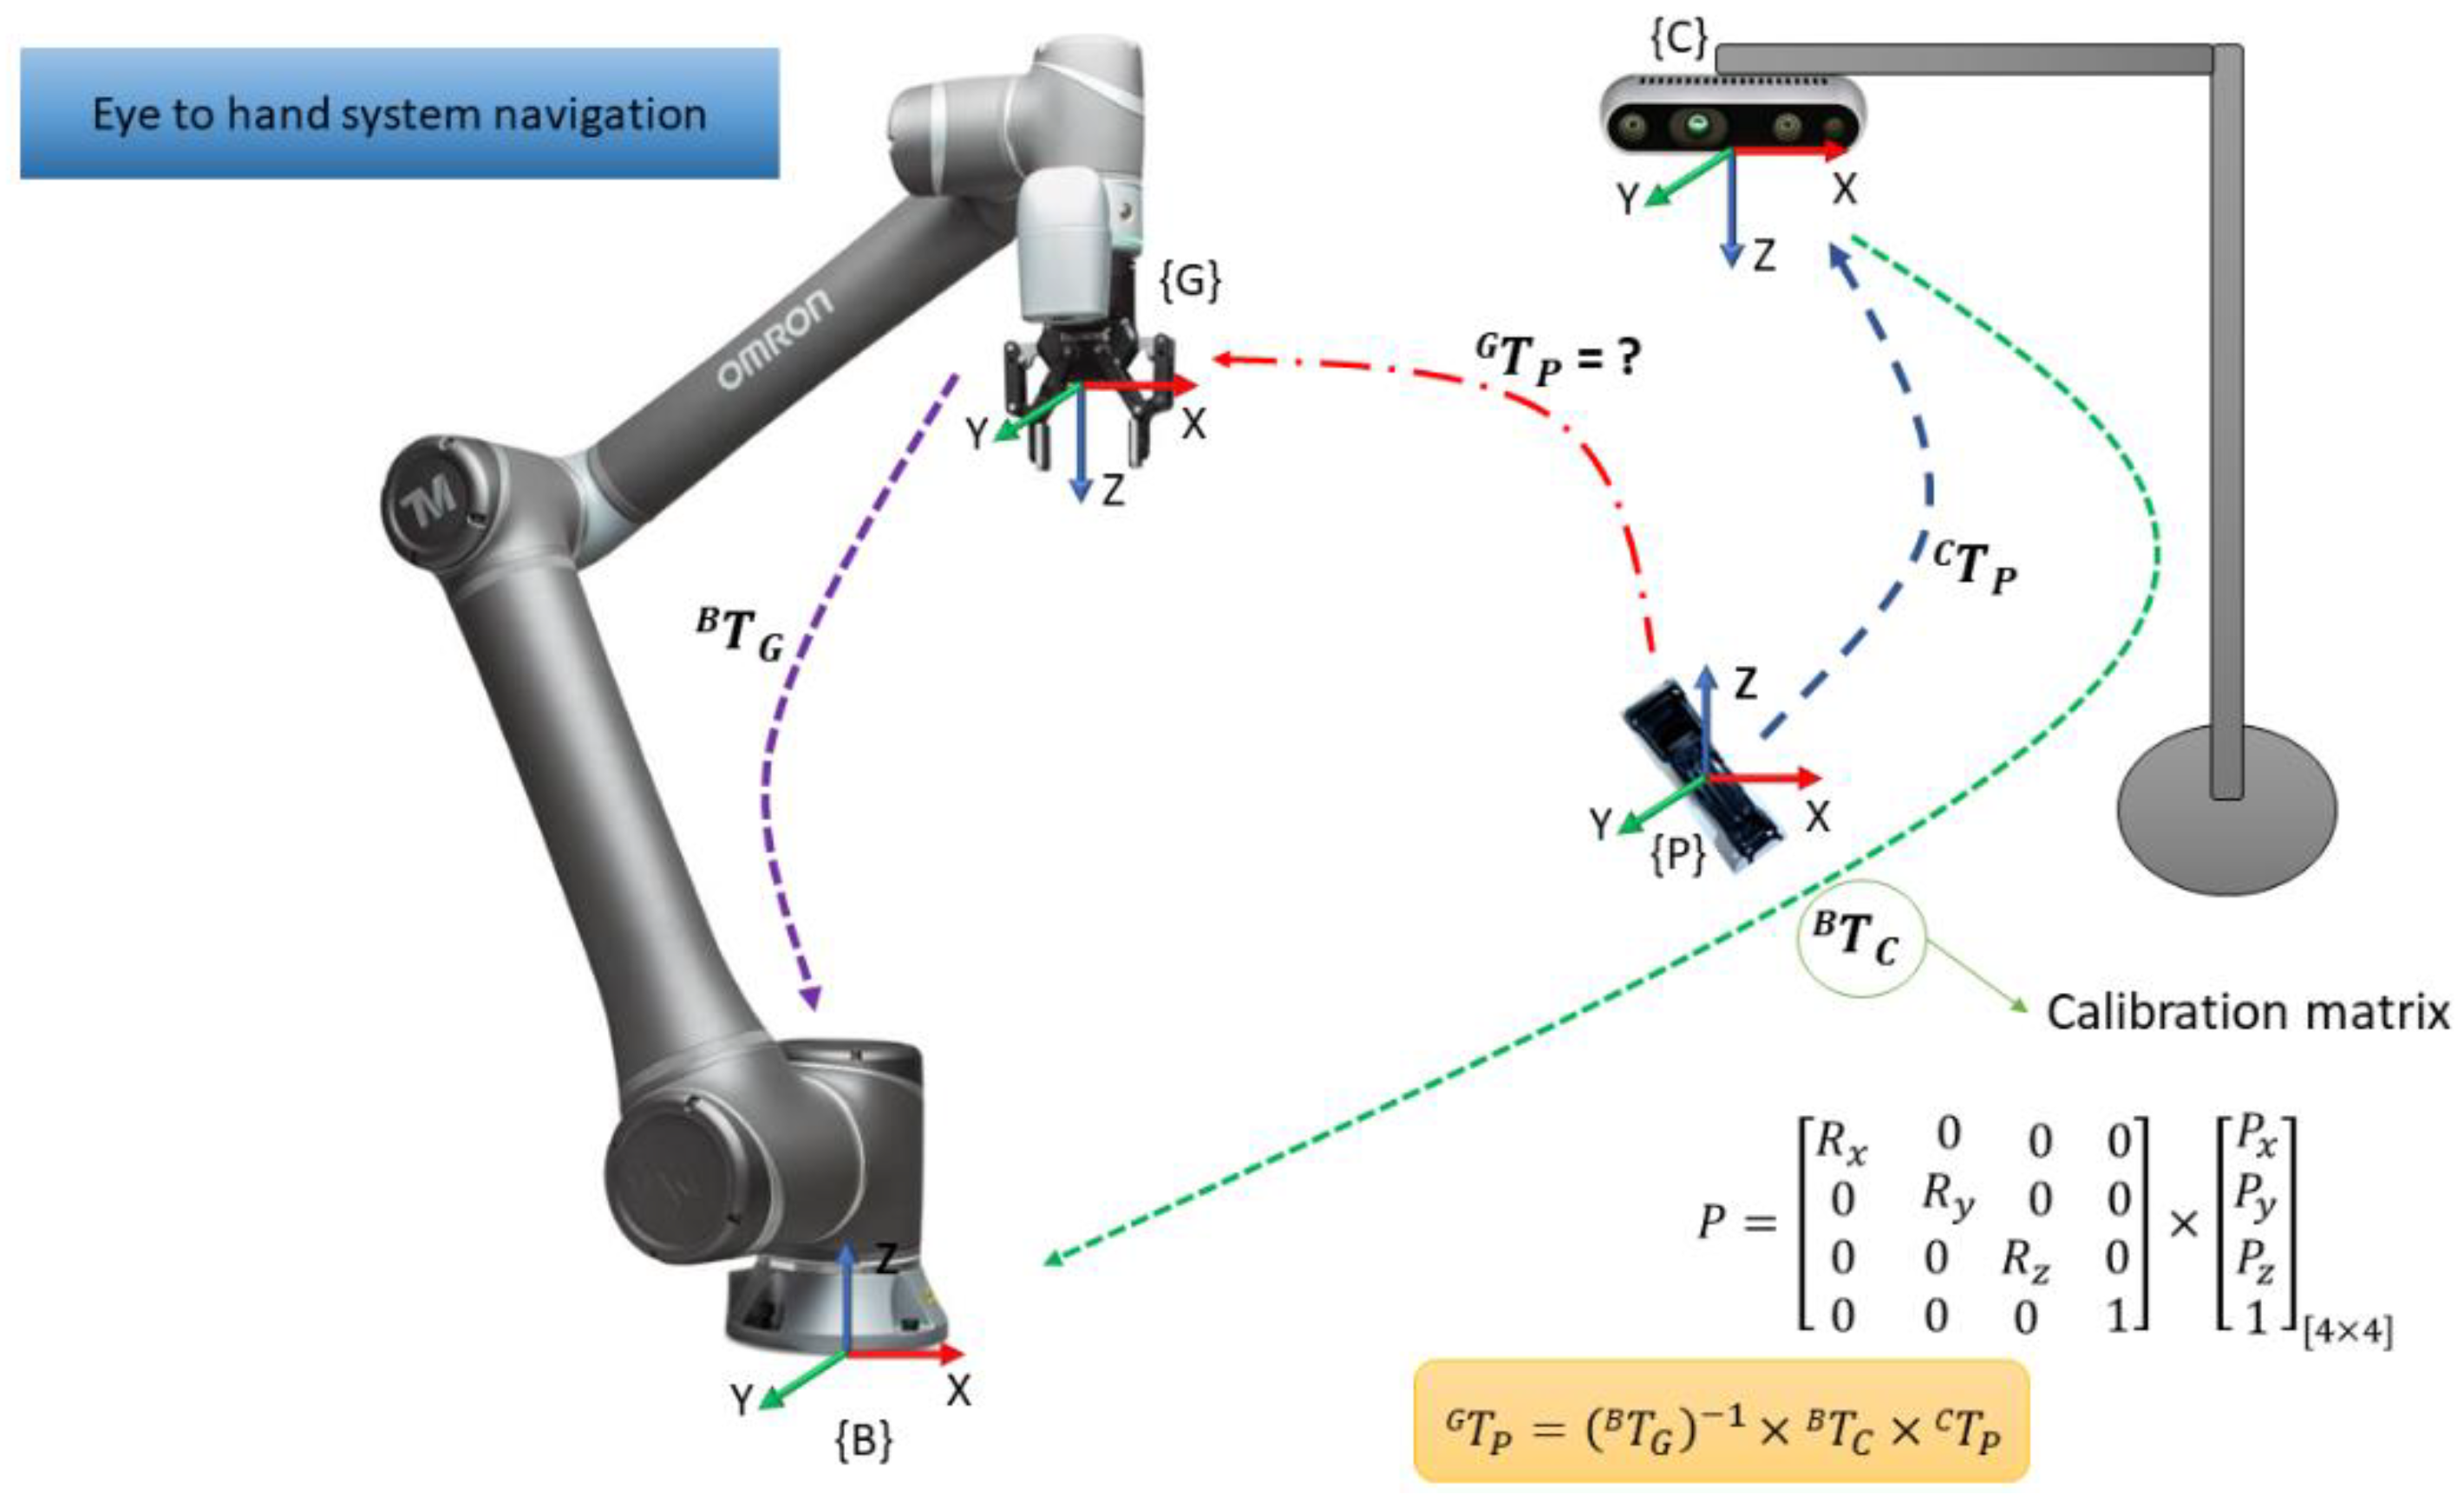
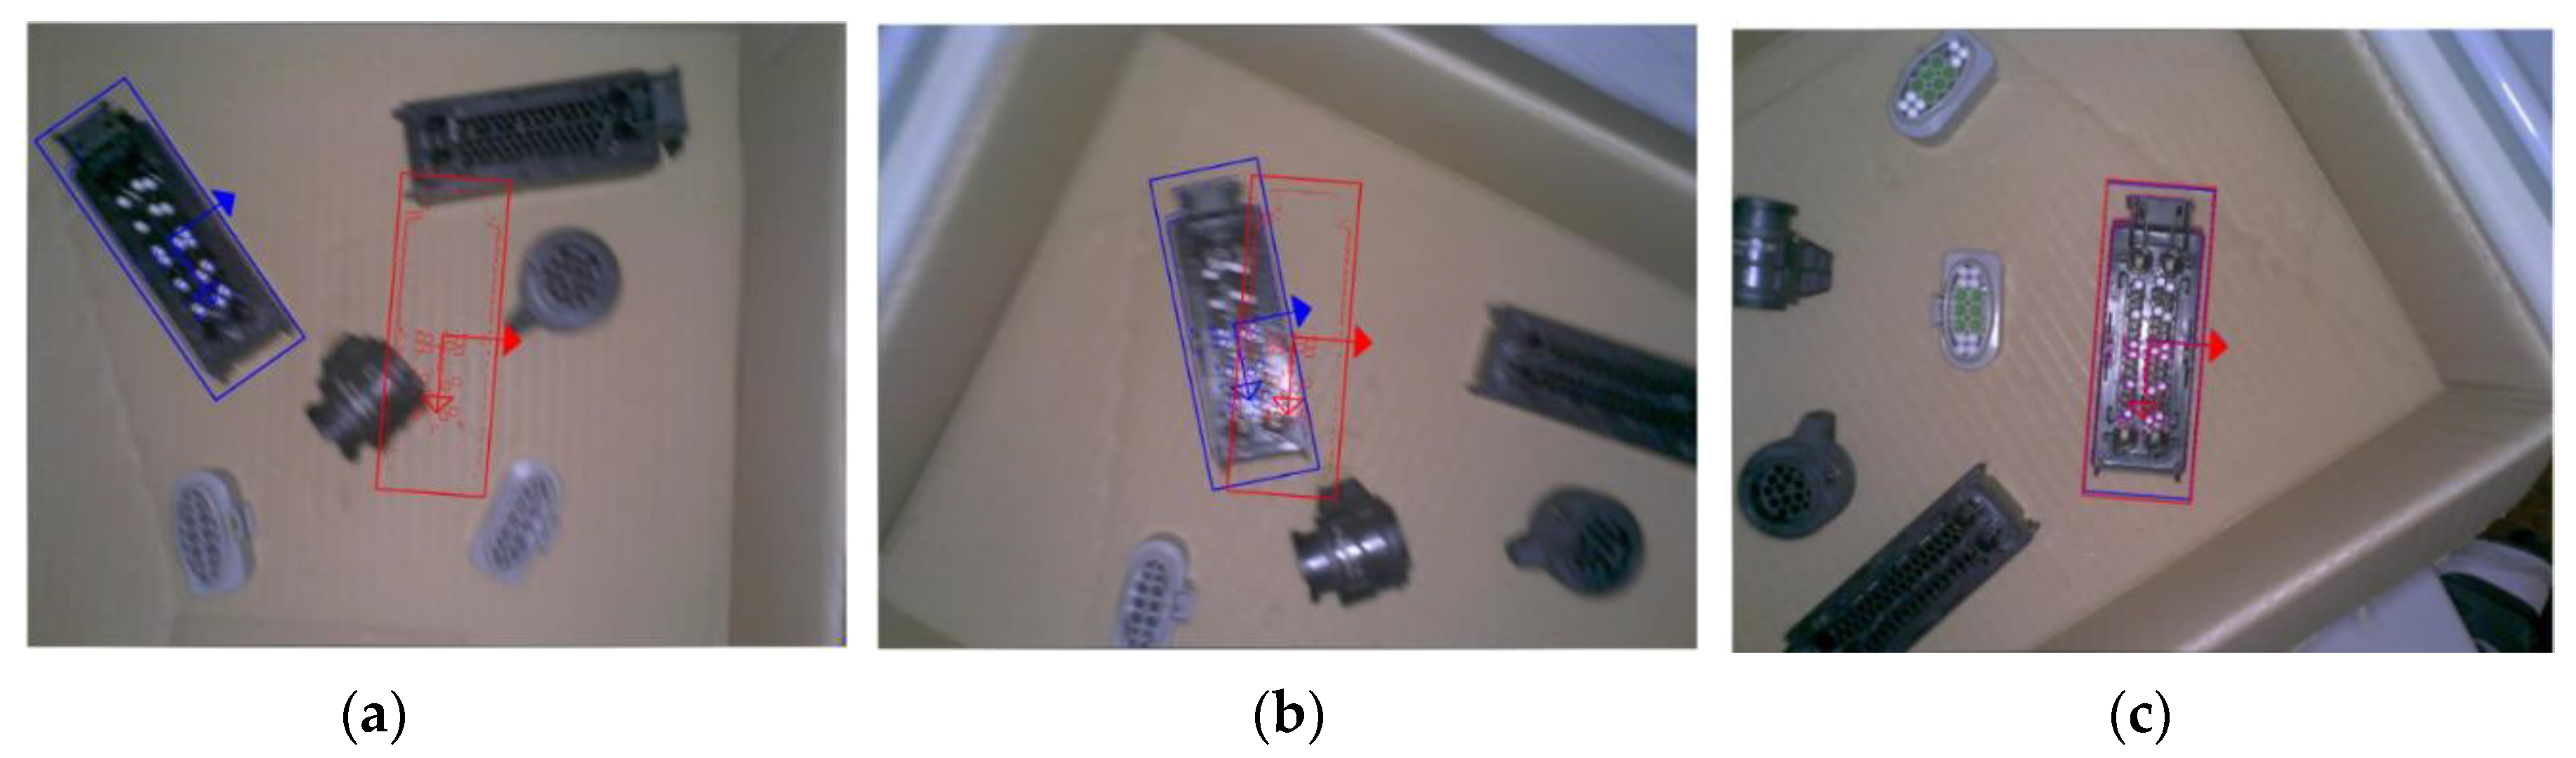
The eye-to-hand system navigation is used to obtain each connectors’ pose from the object recognition task, where the centroid of each connector is extracted and synchronized with the depth obtained by the Intel RealSense camera. To guide the robot to each position, the pose of the connector was calculated in the robot gripper reference frame. This process is performed by a calibration procedure, as illustrated in
Figure 7 and defined by Equation (3):
where all parameters are homogeneous matrices, with rotation and position elements.
is the homogeneous matrix that represents the pose of each recognized connector in the reference frame of the gripper. As expressed by the equation, to achieve this, it is necessary to compute the kinematics of each reference frame involved, such as the relationship between the gripper and the robot base (), the camera pose in the robot’s reference frame () and the object pose in the camera reference frame ().
This equation allows knowing, at each instant, the position and orientation of the connector to be grasped. The computation is performed in Python and the interaction with the robot controller is performed through Modbus. Trajectory planning is performed in the main program running at the controller.
5. Conclusions
This work aimed to demonstrate that for small objects, such as automotive connectors, bin-picking solutions with a low-cost 3D vision system are possible. The machine vision algorithm plays an important role in correctly identifying objects, and this is only possible due to the contribution of machine learning algorithms. The YOLO algorithm has been shown to have great potential for these tasks, in particular, YOLOv5 was shown to recognize these kinds of small objects with high accuracy and repeatability. Grasping this type of connector is a challenging task due to its layout not being solid and it being capable of being vacuum aspirated, which makes manipulation difficult. Our test scenario used a two-finger gripper, which implies identifying the best pose for grasping the connector, and is more propitious to collisions when interacting with very close objects. Despite these challenges, this work demonstrated that it is possible to grasp small objects in bulk, classifying them and sorting them into different output boxes.
As future work, the main focus will be further reducing the cycle time, possibly by improving the time required to identify the best posture to grip the connectors. Additionally, a new type of gripper is being considered that would be more suitable for grasping these types of objects.


