Abstract
This paper shows an advanced method that is able to achieve accurate recognition of fear facial emotions by providing quantitative evaluation of other negative emotions. The proposed approach is focused on both a calibration computing procedure and an important feature pattern technique, which is applied to extract the most relevant characteristics on different human faces. In fact, a 3D/2D projection method is highlighted in order to deal with angular variation (AD) and orientation effects on the emotion detection. Using the combination of the principal component analysis algorithm and the artificial neural network method (PCAN), a supervised classification system is finally achieved to recognize the considered emotion data split into two categories: fear and others. The obtained results have reached an encouraging accuracy up to 20° of AD. Compared to other state-of-art and classification strategies, we recorded the highest accuracy of identified fear emotion. A statistical analysis is carried out on the whole facial emotions, which confirms the best classification performance (positive predictive values (PPV) = 95.13, negative predictive values (NPV) = 94.65, positive likelihood ratio (PLr) = 33.9, and negative likelihood ratio (NLr) = 0.054. The confidence interval for both of PPV and NPV is 92–98%. The proposed framework can be easily applied for any security domain that needs to effectively distinguish the fear cases recognition.
1. Introduction
Facial emotion recognition (FER) [1,2,3,4] is an interesting field that is actually expanding considerably. This domain touches the psychological condition of a human being, his behavior, and his responses. Indeed, several works were interested to FER in 2D and 3D fields using standard conditions i.e., identifying human emotion in an upright posture.
Fear is a special emotion; generally, humans feel fear when faced with an imminent danger, near a threat or with a situation that the brain describes as dangerous. This reaction is classified as a negative emotion, which perfectly reflects an uncomfortable situation.
A fear recognition task is a complex and error-prone process, because it can be confused with other negative emotions, whereas the same negative emotions [5] (sad, anger, disgust, surprise) are moderately easy to detect. The efficiency of human fear emotion evaluation is wholly subject to the complete attention of researchers. Here, we emphasize that automatic systems of fear detection provide the opportunity of getting a reliable and precise screen of pertinent characteristics extraction. In fact, computer-aided methods present a vital work in order to simplify the fear topics recognition, which addresses technology requirements in the security domain.
Automated emotion recognition is an interesting task that controls the detection method. The classification of facial emotions allows us to extract important information of the human face and describe well his cognitive state. In several approaches, the identification framework focuses on relevant extracted information in real cases. Shome et al. [1] proposed a facial feature extraction technique to detect cyber abuse activities. They accomplished an integrated real-time detection module. In the work of Anjith et al. [2], the authors employed a multi-channel convolutional neural network (CNN) structure to achieve better performance when compared to baseline techniques. Taha and Hatzinakos [3] developed an approach to detect and learn informative representations from 2D gray-level images or FER using a CNN structure. They utilized a few layers strategy to mull over the overfitting issue. In the study of Balasubramanian et al. [4], support vector machines, hidden Markov models, and basic CNNs are applied for FER. Melaugh et al. [6] analyzed emotion classification results using the half view or the eyes and mouth. The obtained results are compared with the whole face to demonstrate that using the half view or the eyes and mouth is sufficient. A hierarchical architecture for home surveillance based on Raspberry Pi as the Edge Server is proposed in [7]. The authors introduced a deep learning-based surveillance architecture by the use of edge and cloud computing. Kollias et al. [8,9] projected a useful algorithm based on convolutional and recurrent (CNN-RNN) deep neural architecture (CSP) methods. These techniques detect the finest performance in the validation datasets. An end-to-end deep learning model is established in [10] for simultaneous facial images assessment and pose-invariant FER conditioned on the geometry information. In [11], the authors proposed an emotion recognition procedure using a deep learning system from speech and video. Kaya et al. [12] projected a multimodal expression recognition approach in the wild employing deep transfer learning and score fusion.
The majority of the proposed approaches [5,13,14,15,16,17,18,19] denote many improvements in view of automatic recognition process by detecting the face emotions using CNN models. The aim of the extracted characteristics is provided to a divide between numerous emotions. However, the classification rate of the considered fear emotion ensues the lowest recognition result. This is due to the included confusion with other negative emotions. In this paper, only two classes (fear, others) were considered, compared to other state-of-art that are focused on seven emotion groups [20]. The latest research studies proved an important overlapping in view of fear emotion. Here, we report that it is extremely confirmed that by using a higher emotion number, a finer identification is obtained. However, the security problem still persists due to included overlapping fear detection. To date, few studies have addressed this problem, despite its major necessity thus far especially in relation to terrorism, violence, and abuse problems. Therefore, we have used exceptionally two categories in order to evidently improve the fear characterization. This method is particularly beneficiary for facial emotion detection of fear cases using significant angular deviation.
There are four important contributions of this work. Firstly, a database collection process is considered starting from a neutral posture until the emotive state. The calibration computing phase takes part in the exactness and the efficiency of the proposed volume definition strategy. In fact, this task allows us to mark 18 significant points on different human faces. Secondly, a chief recording procedure is developed in order to extract various negative emotions such as (sad, anger, disgust, surprise, and fear). The resulting emotions are obtained by a Qualisys system (QTM), which includes a data station and six cameras. Note that each subject is characterized by five video sequences. Thirdly, we propose an innovative 3D-2D projection method for the study of diverse AD effects from numerous negative emotions. This scheme is particularly beneficiary for FER in different orientations. Finally, a classification stage is achieved to recognize the considered emotion divided into two groups: fear and others.
In this paper, an extended version of [20] is introduced in which many details are considered to get truthful performance assessment of the proposed scheme: The used classification hyperparameters are exhibited to demonstrate their influence on the categorization results. An improved training network construction is based on the combination of the principal component analysis (PCA) algorithm and the artificial neural network (ANN) classifier (PCAN) using the cross-validation method.
This paper is structured as follows: In Section 2, we define the proposed methodology including data acquisition, emotion recording, 3D-2D projection, and classification strategy. In Section 3 and Section 4, experimental results and discussions are reported on two emotion datasets. Finally, conclusions and future works are drawn up in Section 5.
2. Materials and Methods
2.1. The Proposed Methodology
As shown in Figure 1, the proposed methodology is split into four stages:
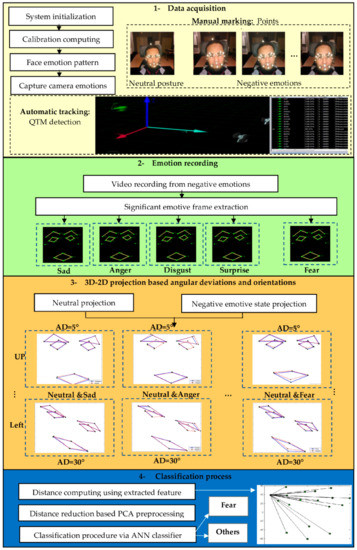
Figure 1.
Representation of the proposed methodology.
- Data acquisition: The calibration computing and the face emotion pattern are extracted to prepare the database.
- Emotions recording: The Qualisys Track Manager process is used to capture motion. This process leads to extract different negative emotions.
- 3D-2D projection: This part is dedicated to the motion in various angular variations. Here, five negative emotions (sad, anger, disgust, surprise, and fear) in seven angular deviations (0°, 5°, 10°, 15°, 20°, 25°, 30°) and four orientations (up, down, right, left) are presented.
- Feature classification procedure: The combination of the principal component analysis and artificial neural network (PCAN) is realized to divide emotions into two classes (fear and others).
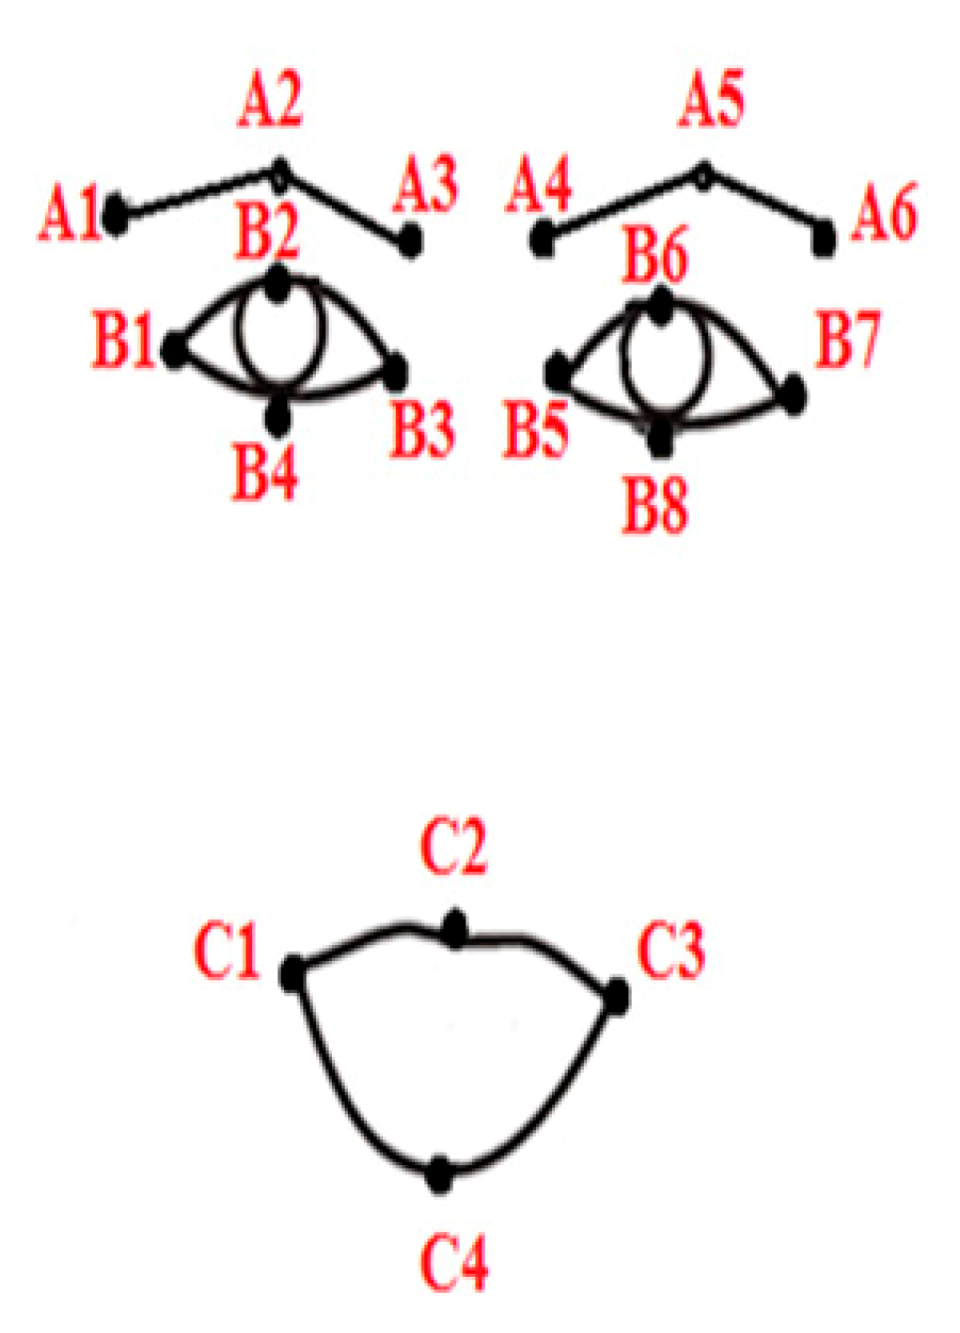
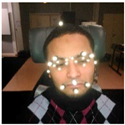
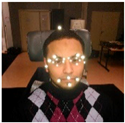
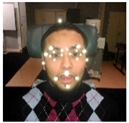
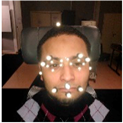
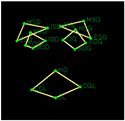
The capture volume was firstly calibrated for enhancing the detection accuracy. The calibration computing stage played a key role in view of the proficiency of the used capture space. Secondly, 18 significant points are extracted from the extremities of different human face organs. Here, we report that only the mouth, eyes, and eyebrows organs act on the facial emotion production. Table 1 reveals the standard marked points:

Table 1.
Standard marked feature on human face.
- The inner and outer corners of the eyes
- The ends of the upper eyelids and the lower eyelids
- The inner and outer corners of the eyebrows
- The upper point of the eyebrows
- The left and right corners of the mouth
- The upper and lower ends of the lips.
2.1.1. Data Collection-Based QTM System
The database collection method is initially measured from a neutral posture until the emotive state. The Qualisys (QTM) scheme is employed to capture movements by the use of three dimensions (3D). Figure 2 shows the used system that integrates one data station, personal computer (PC), and six cameras. The camera characteristics are 1.3 Mega Pixels resolution at a frequency of 120 Hz. The Vicon V460 system provides an overall accuracy of 63 ± 5 μm and overall precision (noise level) of 15 μm for the most favorable parameter setting [21]. Note that the PC contains the Qualisys system manager.
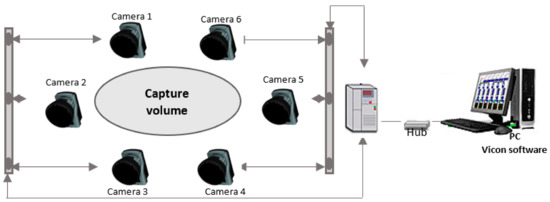
Figure 2.
The used Vicon V460 system.
2.1.2. Emotions Recording
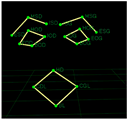
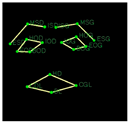
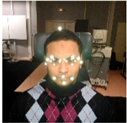
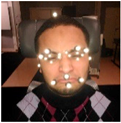
All analyzed topics are voluntarily obtained from the Handibio laboratory of Toulon University, which are generated using the QTM system. In this study, the available dataset is constituted of 69 patients. Several experiments are applied in order to extract diverse negative emotion videos. In this task, each patient is characterized by only one sequence video for each emotion among five. Due to the removing of outcomes, only one relevant emotive image has been used for each emotion. Figure 3 shows some frames from the acquired data, which demonstrate the difference between the outcomes and the most discriminant selected images employed for the recognition procedure.
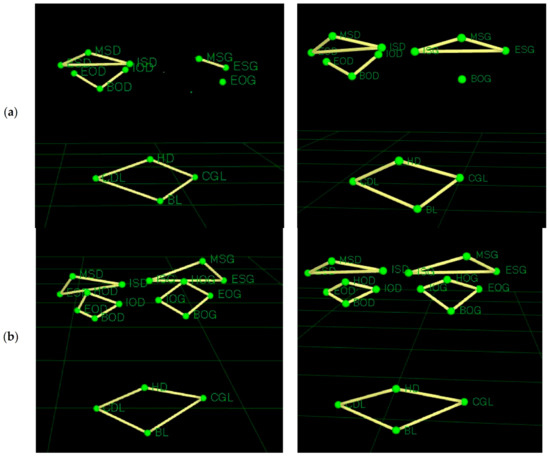
Figure 3.
Overview of the two acquired data (a) Overlapping image, (b) the most significant image
To noticeably explain our experimental image extraction, a common preview is clearly established to summarize the automated selection of the pertinent emotive frames. In Table 2, we highlight the manual marked images for neutral and negative emotive states and their corresponding significant emotive image.

Table 2.
Emotion appreciation via Qualisys system (QTM) for significant emotive image extraction.
2.1.3. 3D-2D Projection
The 3D-2D projection system continues to be a complicated mathematical problem. It has situated 2D distance analysis-focused measure as a valid indirect assessment of 3D image. Significant projections were established via multiple angular variation (AD) analysis, and via the use of a basic mathematical orientation with a 3D-2D relationship. This process has been extensively used in several image processing applications such as the segmentation of medical images [22], medical analysis [23], MRI images [23], etc.
In this work, 2D-3D projection analysis is the used procedure to produce all angular variation that will help us to select the most discriminative features from the original ones. The projection method is a typical technique for reaching lower dimensional characteristics of the obtained data. In particular, it appears that the projection procedure permits accurately separating between the facial emotions that exhibit the same differentiation but using the lowest emotive features. The method computes the distance between manual marked points of each involved subject. Commonly, distance computing preprocessing is suitable for classification processes, characterization, and training datasets. The calculated distance equation is presented as follows:
where θ is the deviation angle, and U(i) the projected vector.
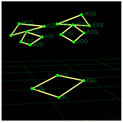
The aim of this research is to grow an efficient approach that supplies a great capture range. The proposed projection plan method is presented as follows. In order to estimate the position of the 3D dataset relative to the projection images, we have fixed three points on the head organ of each patient: one point on the upper head (HT), one point on the right ear (OD), and one point on the left ear (OG). We attained a plan from these three fixed points, which is used for 3D coordinates projection (see Figure 4).
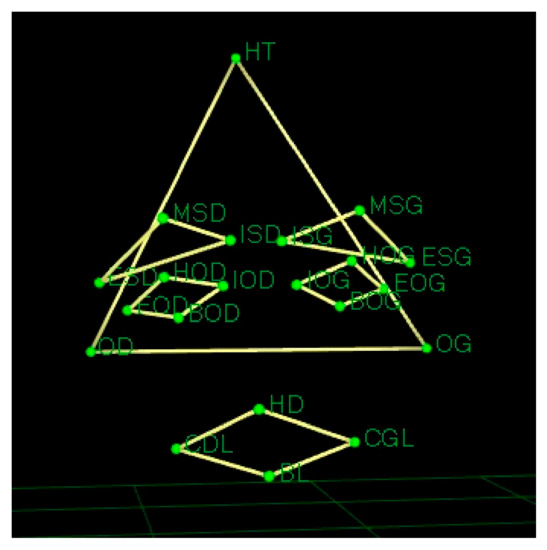
Figure 4.
Schematic overview of the finest projection plan.
In this paper, the 3D-2D projection technique [24] will be employed to pick up the optimum information from the extracted emotion distances. The proposed projection method generated a no-redundant emotive distance feature in order to effectively identify fear subjects. The step-by-step algorithm of 2D-3D projection is described below:
- Step1: feature selection
- Step2: projection plane selection
- Step3: matrix cross with angular deviation
2.1.4. Classification Procedure
For reducing the extracted feature number from facial emotive distance and to discriminate between fear and other subjects, the PCAN approach is performed. Numerous classifiers can be used for pattern acknowledgement. It has been substantiated that the neural network method is an efficient tool for different classification works [25]. We have selected the most discriminative characteristics to prepare the training dataset of the network. This leads to obtaining reliable classification results. The training neural network phase is completed by the use of a computed emotive distance. Many categorization works can be used for image processing. Due to its limited important data, ANN is still needed to resolve the nonlinear problem. This method is widely employed for different categorization machine learning [26]. Calculated facial emotive features have been chiefly selected for improving the fear emotion classification, which aids progress in computer-aided security. Each topic is characterized by 153 distances for each tested emotion, angular variation, and orientation.
PCA is a multivariate statistical technique based on factor analysis of data. Its goal is to produce a new set of uncorrelated variables, which do not carry the same information type as the original attributes, and these are called principal components. Each principal component is a linear combination of the initial variables. PCA consists in finding a subspace allowing us to classify the new components in order of decreasing importance in order to reduce the dimension of the original space. The transition matrix of the new space is obtained by maximizing the variance between the original variables [25,26]:
where is the covariance matrix of the original components and is the set of principal axes that define the new space. The following table summarizes the main steps of the PCA Algorithm 1.
| Algorithm 1 Principal steps of PCA algorithm. |
| For a set of data X: 1. Calculate the covariance matrix |
| 2. Diagonalize the covariance matrix in order to extract the set of eigenvectors w: |
| where D is the eigenvalue matrix. 3. Determine the principal components by the following linear transformation: |
| where is the mean vector of X. |
Depending on the redundancy between the extracted distances in each emotive class, the PCA algorithm is applied for increasing the attribute dimensionality in the input set. This allows us to find a new independent feature for suitable emotion depiction. The network training is achieved using five PCA features. ANN classification contains two fundamental phases: a training phase and a test phase. Table 3 presents the data repartition.

Table 3.
Data repartition.
3. Results
3.1. Results of Projection Procedure Based on Angular Deviations and Orientations
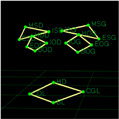
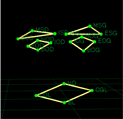
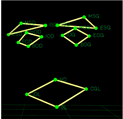
Compared to previous works, 3D-2D projection is based on AD and orientations that are excessively employed to enhance the characterization and FER. This leads to significantly detect the fear emotion in all directions. In this work, the used angular deviations and orientations are respectively (0°, 5°, 10°, 15°, 20°, 25°, 30°) and (UP, DOWN, LEFT, RIGHT) (see Table 4). From these measures, we can see clearly that there is a great identification of the related fear emotion. Some applied orientations are presented in Figure 5.

Table 4.
The used degree in terms of axes and directions.
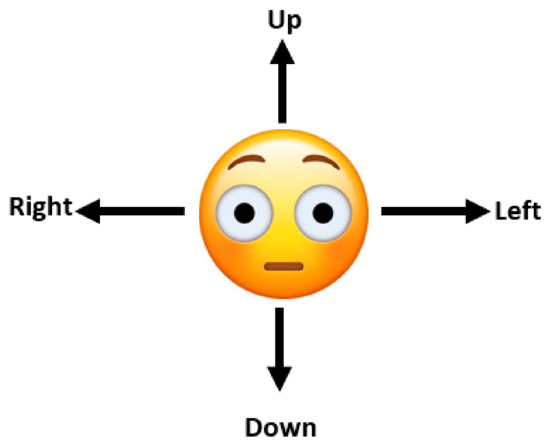
Figure 5.
The applied orientations.
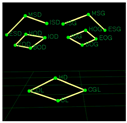
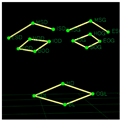
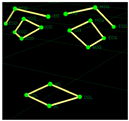
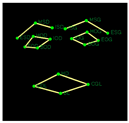
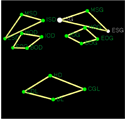
The deviation limit is 30° because greater angular variation will be insufficient to interpret and characterize the resulting distance between manual marked points. We describe that a chief distance deformation is obtained due to the important AD. In Table 5, we expose some samples in some tested AD that prove the included choice from the database categorization. Figure 6 summarizes some obtained emotive images in four orientations.

Table 5.
Angular deviations choice proof.
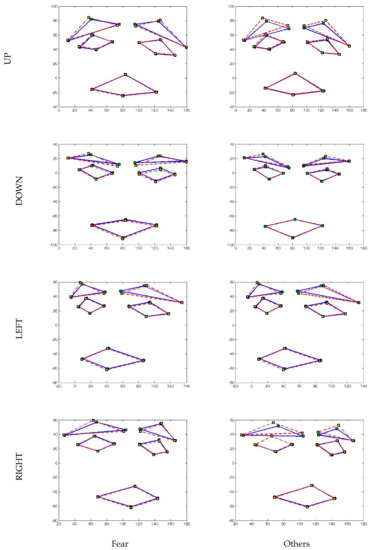
Figure 6.
Example of obtained emotive images in 20° angular deviation and all orientations.
3.2. Discriminant Characterization Results-Based Principal Component Analysis
By the use of the PCA technique, multiple experiments were completed to track down the most relevant features. Indeed, the PCA pre-processing scheme involves substantial preposition-based angular variation and orientation characteristics from the facial emotion dataset. The applied model consists of information selection focused on the sensitivity of the PCA algorithm. Varying the variance , different experiments have established to tear off the new uncorrelated samples that can be more discriminative than original components. In Figure 7, the variation of different variance values is exposed on the resulting mean square error (MSE) of the ANN classification accuracies. The used PCA strategy [27] offers the finest separation performance, while the variance value is fixed to 0.07. Five significant features among 153 are selected to progress effectively the fear emotion detection. The obtained characterization results achieved the least MSE 5.13 10−2 with 1.04 10−2 standard deviation from the validated data. A typical PCAN fusion is projected to improve the classification process by removing the included overlap.
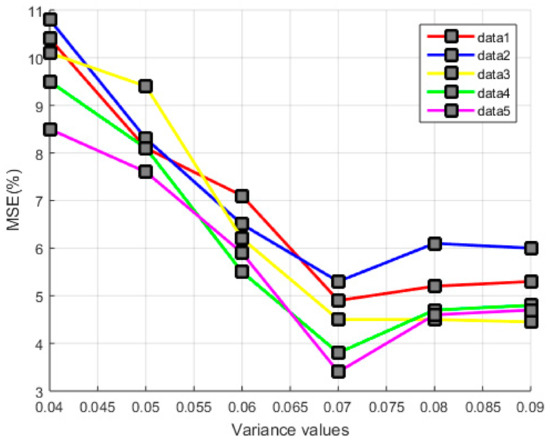
Figure 7.
Diverse principal component analysis (PCA) variance values evaluation in terms of mean square error (MSE) results intended for appropriate feature selection and classification.
3.3. Fear Emotion Classification Results
Fear emotion classification act attempts to establish a significant separation (fear or others) in order to enhance the fear facial emotion identification. In this paper, we used the cross-validation procedure [28] for selecting the finest ANN structure. Ten-fold cross-validation tests are experimented to obtain the effective hidden layers number. These iterations are split into two parts: nine folds for the training and one for the validation. Every learning task, the dimension of one hidden layer is consecutively reformed in all folds. In this regard, we computed the validation error average for each original iteration. As illustrated in Table 6, we can deduce that the PCAN method is more efficient compared to the other classification methods [29,30] in view of the MSE rate. The PCAN classifier gives pertinent results in terms of 0°, 5°, 10°, 15°, 20°, 25°, and 30° AD with a mean average of 0.5%, 3.6%, 3.9%, 4.1%, 4.4%, 21.2%, and 30%, respectively. The simulation results demonstrated in Table 6 highlight the strength of the proposed framework using (AD = 0°) that corresponds to the highest classification rate. The obtained results have reached an encouraging accuracy until 20° of AD using the PCAN classifier. We note that over 20° AD, the extracted distance suffers an important deformation that leads to an undesired classification rate value. In this context, all orientations are considered in each AD. The measured MSE values are the mean of all orientations. For instance, (AD = 5°) represents the average of different orientations (5° UP, 5° DOWN, 5° LEFT, 5° RIGHT). To prove the performance of the proposed method, support vector machine (SVM), the combination of PCA and SVM (PSVM), the combination of Fisher Linear Discriminant (FLD) and SVM (FSVM), ANN, FLD-ANN (FANN), and PCA–ANN (PCAN) are experimented on all validation dataset.

Table 6.
MSE rates (%) of the support vector machine (SVM), combination of PCA and SVM (PSVM), combination of Fisher Linear Discriminant (FLD) and SVM (FSVM), artificial neural network (ANN), FLD-ANN (FAAN) and PCA–ANN (PCAN) methods using the used AD.
The lowest MSE mean of SVM presents 6.7% at 0°, and 6.4%, 6.5%, and 6.8% respectively at 0°, 5°, and 10° of PSVM, while 5.6%, 6.2%, and 6.9% are achieved using FSVM respectively at 0°, 5°, and 10°. ANN method reached 6.2% only at 0° compared to the FANN approach reaching 5.3%, 5.5%, 5.8%, and 6% respectively at 0°, 5°, 10°, and 15°. The proposed PCAN remains the most relevant in terms of the higher classification rates of 0.5%, 3.6%, 3.8%, 4.1%, and 4.4% of MSE at 0°, 5°, 10°, 15°, and 20° respectively.
In this study, the hybrid methods (PCAN, PSVM, FSVM, and FAAN) are established in order to reduce the feature number extracted from facial emotion distance and to distinguish between fear and other negative emotions. By the use of PCAN classifier, the network training is focused on five emotive features. The relevant distance characteristics are selected based on the principal component analysis criterion. This technique is applied to reduce the characteristics dimensionality in the training input in view to the similarity system between the original attributes in each emotive category. The supervised artificial neural network is applied in order to separate the used data into two groups (fear, others). However, one input layer containing the reduced features by the PCA preprocessing model, two hidden layers including 12 and 30 neurons, and only one output layer are used in the network. By applying the cross-validation procedure, many experiences were realized to obtain the significant hidden layers number, reaching the best classification result. The hybrid PCAN technique supplies the finest separation performance, having independent features of the used database. To considerably explain the used parameters of compared classifiers (SVM, PSVM, FSVM, ANN, and FAAN), Table 7 is perceptibly established to recapitulate the used hyper-parameters in the resulting classification approach. The hyper-parameters process is completed for all tested supervised classifiers, as revealed in Table 7.

Table 7.
Hyper-parameters procedure for all used classifiers.
From the obtained results, the performance of the classification method relies on robustness. As illustrated in Table 8, the PCAN algorithm gives accurate results (AC = 96.20%, SE = 94.88%, SP = 95.32%). Ten folds are experimented, which can achieve almost 33.9% and 0.054% for positive likelihood ratio (PLr) and negative likelihood ratio (NLr), respectively. The confidence interval for both of positive predictive value (PPV) and negative predictive value (NPV) is 92–98%. Table 8 reveals the obtained statistical analysis of the projected hybrid approach in order to confirm the classification results.

Table 8.
Statistical analysis of the proposed PCAN approach.
4. Discussion
In order to noticeably enhance the performance of projected methods, statistical analysis is introduced as follows. The following terms “SE, SP, AC, PPV, NPV and Prv” are defined in terms of true positive (TP), true negative (TN), false negative (FN), and false positive (FP).
Accuracy: AC = (TP + TN)/(TP + FP + TN + FN)
Sensitivity: SE = (TP)/(TP + FN)
Specificity: SP = (TN)/(FP + TN)
Positive predictive values: PPV = (TP)/(TP + FP)
Negative predictive values: NPV = (TP)/(TP + FP)
Positive Likehood ratio: Plr = (SE)/(1 − SP)
Negative Likehood ratio: Nlr = (1 − SE)/(SP)
Prevalence: Prv = (TP + FN)/(TP + FP + TN + FN)
Pre-test-odds: Pto = (Prv)/(1 − Prv)
Post-test-probability: PtPo = (PtoP)/(1 + PtoP)
Pre-test-probability: PtPr = (PtoN)/(1 + PtoN)
5. Conclusions
In this work, we defined a computerized method that can be used for fear facial emotion recognition. First, a new 3D-2D projection method was applied to angular variation extraction for improving the detection of a negative emotive dataset. The proposed procedure gives suitable optimization when compared to existing FER results. Second, a useful PCA criterion was employed to the calculated emotive distance reduction and effectively enhanced the classification process of the fear emotive training dataset. Compared to the test preprocessing system, this technique demonstrates an important characterization and a notable rapidity. Finally, we have suggested an advanced approach that can precisely separate the “fear” and “others” topics. The involved emotive distance assessment is classified into two categories according to their assessed appropriate angular deviation and orientation features using the PCAN method to obtain the subsequent final partition.
Experimental results demonstrate that the proposed methodologies are strong and effective for the fear facial recognition. Compared to negative facial emotion recognition methods using neural network [20], the proposed method has the highest values of classification percentage, which can achieve almost 97%, even in images containing AD and multiple orientations. We conclude that our method is more consistent than numerous supplementary approaches and can supply a high categorization rate. Furthermore, the proposed method has been compared with existing progressive processes to make noticeable enhancement of separation accuracy. In addition, the performance of proposed system supplies a rigid groundwork in support of computer-aided security evaluation. In future works, we can propose the use of a deep transfer learning method to enhance the recognition performance and obtain higher accuracy for fear detection. A possible enhancement to the established process is the incorporation of an automatic system in terms of feature extraction to considerably improve the reliability of the identification rate with an interesting computation time and a significant rapidity.
Author Contributions
Data curation, P.G.; Methodology, H.S.; Software, A.F.; Supervision, M.S.; Validation, A.F.; Writing—original draft, A.F.; Writing—review and editing, H.S. All authors have read and agreed to the published version of the manuscript.
Funding
This research received no external funding.
Acknowledgments
The authors wish to thank the team of Handibio Lab for their permission to use the QTM station. In addition, the authors wish to thank Nicolas Luis, for his useful and relevant advices during the extraction of biometric measurements.
Conflicts of Interest
The authors declare no conflict of interest.
References
- Shome, A.; Rahman, M.M.; Chellappan, S.; Islam, A.A. A generalized mechanism beyond NLP for real-time detection of cyber abuse through facial expression analytics. In Proceedings of the 16th EAI International Conference on Mobile and Ubiquitous Systems: Computing, Networking and Services, Texas, TX, USA, 12 November 2019; pp. 348–357. [Google Scholar]
- George, A.; Mostaani, Z.; Geissenbuhler, D.; Nikisins, O.; Anjos, A.; Marcel, S. Biometric face presentation attack detection with multi-channel convolutional neural network. IEEE Trans. Inf. Forensics Secur. 2019, 15, 42–55. [Google Scholar] [CrossRef]
- Taha, B.; Hatzinakos, D. Emotion Recognition from 2D Facial Expressions. In Proceedings of the IEEE Canadian Conference of Electrical and Computer Engineering (CCECE), Edmonton, AB, Canada, 5 May 2019; pp. 1–4. [Google Scholar]
- Balasubramanian, B.; Diwan, P.; Nadar, R.; Bhatia, A. Analysis of Facial Emotion Recognition. In Proceedings of the IEEE 3rd International Conference on Trends in Electronics and Informatics (ICOEI), Tirunelveli, India, 23 April 2019; pp. 945–949. [Google Scholar]
- Nguyen, D.H.; Kim, S.; Lee, G.S.; Yang, H.J.; Na, I.S.; Kim, S.H. Facial Expression Recognition Using a Temporal Ensemble of Multi-level Convolutional Neural Networks. IEEE Trans. Affect. Comput. 2019, 33, 1940015. [Google Scholar] [CrossRef]
- Melaugh, R.; Siddique, N.; Coleman, S.; Yogarajah, P. Facial Expression Recognition on partial facial sections. In Proceedings of the 2019 11th International Symposium on Image and Signal Processing and Analysis (ISPA), Dubrovnik, Croatia, 23–25 September 2019; pp. 193–197. [Google Scholar]
- Kaskavalci, H.C.; Gören, S. A Deep Learning Based Distributed Smart Surveillance Architecture using Edge and Cloud Computing. In Proceedings of the IEEE International Conference on Deep Learning and Machine Learning in Emerging Applications (Deep-ML), Istanbul, Turkey, 26–28 August 2019; pp. 1–6. [Google Scholar]
- Kollias, D.; Zafeiriou, S. A Multi-component CNN-RNN Approach for Dimensional Emotion Recognition in-the-wild. arXiv 2018, arXiv:1805.01452. [Google Scholar]
- Kollias, D.; Zafeiriou, S. Exploiting multi-cnn features in cnn-rnn based dimensional emotion recognition on the omg in-the-wild dataset. arXiv 2019, arXiv:1910.01417. [Google Scholar]
- Zhang, F.; Zhang, T.; Mao, Q.; Xu, C. Geometry Guided Pose-Invariant Facial Expression Recognition. IEEE Trans. Image Process. 2020, 29, 4445–4460. [Google Scholar] [CrossRef] [PubMed]
- Hossain, M.S.; Muhammad, G. Emotion recognition using deep learning approach from audio–visual emotional big data. Inf. Fusion 2019, 49, 69–78. [Google Scholar] [CrossRef]
- Kaya, H.; Gürpınar, F.; Salah, A.A. Video-based emotion recognition in the wild using deep transfer learning and score fusion. Image Vis. Comput. 2017, 65, 66–75. [Google Scholar] [CrossRef]
- Ueda, J.; Okajima, K. Face morphing using average face for subtle expression recognition. In Proceedings of the IEEE 11th International Symposium on Image and Signal Processing and Analysis (ISPA), Dubrovnik, Croatia, 23–25 September 2019; pp. 187–192. [Google Scholar]
- Pitaloka, D.A.; Wulandari, A.; Basaruddin, T.; Liliana, D.Y. Enhancing CNN with preprocessing stage in automatic emotion recognition. Procedia Comput. Sci. 2017, 116, 523–529. [Google Scholar] [CrossRef]
- Hua, C.H.; Huynh-The, T.; Seo, H.; Lee, S. Convolutional Network with Densely Backward Attention for Facial Expression Recognition. In Proceedings of the IEEE 14th International Conference on Ubiquitous Information Management and Communication (IMCOM), Taichung, Taiwan, 3–5 January 2020; pp. 1–6. [Google Scholar]
- Singh, S.; Nasoz, F. Facial Expression Recognition with Convolutional Neural Networks. In Proceedings of the IEEE 10th Annual Computing and Communication Workshop and Conference (CCWC), Las Vegas, NV, USA, 6–8 January 2020; pp. 0324–0328. [Google Scholar]
- Salah, A.A.; Kaya, H.; Gürpınar, F. Video-based emotion recognition in the wild. In Multimodal Behavior Analysis in the Wild; Academic Press: Cambridge, MA, USA, 2019; Volume 1, pp. 369–386. [Google Scholar] [CrossRef]
- Yang, H.; Han, J.; Min, K. A Multi-Column CNN Model for Emotion Recognition from EEG Signals. Sensors 2019, 19, 4736. [Google Scholar] [CrossRef] [PubMed]
- Zhang, B.; Quan, C.; Ren, F. Study on CNN in the recognition of emotion in audio and images. In Proceedings of the IEEE/ACIS 15th International Conference on Computer and Information Science (ICIS), Okayama, Japan, 26–29 June 2016; pp. 1–5. [Google Scholar]
- Fnaiech, A.; Bouzaiane, S.; Sayadi, M.; Louis, N.; Gorce, P. Real time 3D facial emotion classification using a digital signal PIC microcontroller. In Proceedings of the 2018 IEEE International Conference on Image Processing, Applications and Systems (IPAS), Sophia Antipolis, France, 12–14 December 2018; pp. 285–290. [Google Scholar]
- Windolf, M.; Götzen, N.; Morlock, M. Systematic accuracy and precision analysis of video motion capturing systems—Exemplified on the Vicon-460 system. J. Biomech. 2008, 41, 2776–2780. [Google Scholar] [CrossRef] [PubMed]
- Mouelhi, A.; Sayadi, M.; Fnaiech, F.; Mrad, K.; Ben Romdhane, K. Automatic image segmentation of nuclear stained breast tissue sections using color active contour model and an improved watershed method. Biomed. Signal Process. Control. 2013, 8, 421–436. [Google Scholar] [CrossRef]
- Hemanth, D.J.; Vijila, C.K.S.; Selvakumar, A.; Anitha, J. Performance Improved Iteration-Free Artificial Neural Networks for Abnormal Magnetic Resonance Brain Image Classification. Neurocomputing 2014, 130, 98–107. [Google Scholar] [CrossRef]
- Arif, S.; Wang, J.; Hussain, F.; Fei, Z. Trajectory-Based 3D Convolutional Descriptors for Human Action Recognition. J. Inf. Sci. Eng. 2019, 35, 851–870. [Google Scholar] [CrossRef]
- Sahli, H.; Ben Slama, A.; Mouelhi, A.; Soayeh, N.; Rachdi, R.; Sayadi, M. A computer-aided method based on geometrical texture features for a precocious detection of fetal Hydrocephalus in ultrasound images. Technol. Health Care 2020, 28, 643–664. [Google Scholar] [CrossRef] [PubMed]
- Sahli, H.; Mouelhi, A.; Ben Slama, A.; Sayadi, M.; Rachdi, R. Supervised classification approach of biometric measures for automatic fetal defect screening in head ultrasound images. J. Med. Eng. Technol. 2019, 43, 279–286. [Google Scholar] [CrossRef] [PubMed]
- Sahli, H.; Ben Slama, A.; Bouzaiane, S.; Marrakchi, J.; Boukriba, S.; Sayadi, M. VNG technique for a convenient vestibular neuritis rating. Comput. Methods Biomech. Biomed. Eng. Imaging Vis. 2020, 8, 571–580. [Google Scholar] [CrossRef]
- Sahli, H.; Mouelhi, A.; Diouani, M.F.; Tlig, L.; Refai, A.; Landoulsi, R.B.; Sayadi, M.; Essafi, M. An advanced intelligent ELISA test for bovine tuberculosis diagnosis. Biomed. Signal Process. Control 2018, 46, 59–66. [Google Scholar] [CrossRef]
- Tang, Y.; Jing, L.; Li, H.; Atkinson, P.M. A multiple-point spatially weighted k-NN method for object-based classification. Int. J. Appl. Earth Obs. Geoinf. 2016, 52, 263–274. [Google Scholar] [CrossRef]
- Ventouras, E.M.; Asvestas, P.; Karanasiou, I.; Matsopoulos, G.K. Classification of Error-Related Negativity (ERN) and Positivity (Pe) potentials using kNN and Support Vector Machines. Comput. Biol. Med. 2011, 41, 98–109. [Google Scholar] [CrossRef] [PubMed]
Publisher’s Note: MDPI stays neutral with regard to jurisdictional claims in published maps and institutional affiliations. |
© 2021 by the authors. Licensee MDPI, Basel, Switzerland. This article is an open access article distributed under the terms and conditions of the Creative Commons Attribution (CC BY) license (http://creativecommons.org/licenses/by/4.0/).
