Abstract
A self-excited induction generator (SEIG) is very simple and robust, has a reduced unit size, is easy to implement and simple to control, and requires very little maintenance compared to other types of generators. In variable operating conditions, the SEIG requires a power electronics interface to transform from the variable frequency voltage output of the generator to a battery voltage output or the related applications. In our study, we tied the SEIG to the power electronics system comprising a diode rectifier and DC/DC converter, and then a final DC load for fuel cell applications was connected. An example of such an application is an electrolyzer where an equivalent circuit is modeled for use in this study. To accomplish the proposed system, we utilized PSCAD and MATLAB for its simulation, control, and analysis. A new system configuration considering three different wind speeds and breaker conditions is modeled and analyzed. The results show that the suggested strategies in this study would contribute to designing and analyzing a more practical power electronics interface system for a wind turbine generator with a DC load.
1. Introduction
In recent times, amongst the renewable energy sources, one of the fastest-growing energy sources in the world is wind energy. The use of an induction machine is very popular for wind energy applications [1,2,3]. From the beginning of the study of wind turbines, a self-excited induction generator (SEIG) has been considered for wind energy system applications because of its reduced maintenance cost, inherent short-circuit protection capability, good over-speed capability, reduced size, and better transient performance as compared to other generators [3]. The SEIG is appropriate for single applications with the generated energy captured ability through an electrolyzer during wind varying conditions. Several studies have been conducted related to SEIG’s voltage and frequency regulations [1,2,3,4]; however, there has not been much concern with its power and flux controls. Lately, in a variable speed wind power generation system, authors researched the active power and flux control algorithm of a SEIG in [3]. An active power and flux control technique for a SEIG for a variable speed wind generation (VSWG) using a power electronics interface, a DC/DC converter, was described and a SEIG performed as an isolated generator without other power sources. If the power system is attached to the SEIG, the power system can deliver the reactive power for the SEIG. Then, a three-phase AC capacitor or solid-state excitation with capacitors can mitigate the reactive power for the SEIG. Similarly, in an isolated operating condition, the active and reactive powers of the SEIG are preserved [3,4]. In [5], a cheap wind DC generator equipped with a self-excited induction generator and a controlled AC/DC converter is suggested. The use of a controlled AC/DC converter corrected the negative effect of the SEIG, being highly influenced by the impedance of loads. However, while inexpensive and reliable, the suggested converter caused a serious harmonic distortion problem. In [6], two different converter topologies were implemented to achieve optimal and low order harmonic voltage regulation for a SEIG. From the obtained results, in terms of harmonic and regulation performance, when utilizing a serial pre-dump resistor with a switched dump resistor, the converter configuration with no capacitor at the end of the bridge rectifier gave acceptable and great outcomes relative to the capacitor model. When the consumer load was resistive, keeping the line voltage and frequency constant at desired values was very easy, but in the case of an inductive load, which causes a decrease in the harmonic level, the frequency increased slightly, and line voltage increased due to the reductions in magnetizing current. Our study regarding SEIG has been extended to a fuel cell application that involves an electrolyzer because a combination of the SEIG and fuel cell system would be a very ideal standalone medium-range power system [7,8,9]. The excessive energy from wind can be easily harnessed for hydrogen generation for the fuel cell system via an electrolyzer [7,8,9]. A technique for voltage and frequency regulation of three-phase SEIG feeding unbalanced loads, instead of common methods based on induction machine per-phase equivalent circuit, is presented in [10]. The performance of the suggested method is validated for three different previously assigned reference load voltages. The outcomes show that the SEIG load voltages remain constant at desired values with a maximum error of 2.27% even if it feeds three-phase constant unbalanced resistive load and balanced inductive load. Recently, a multi-phase SEIG was studied in [11] for a high-power generation range of megawatts for SEIG, but our focus is limited to medium-powered, three-phase SEIG.
In this research, based on the previous study conducted in [3], an electrolyzer was added as an equivalent circuit model for the conjunction with a DC/DC converter, and a new system configuration was developed to verify the feasibility of this study’s proposed idea. We explain details of the parameter selection procedure for the electrolyzer and describe the power control algorithm of the electrolyzer using the DC/DC converter in system analysis. Like other DC grid systems from renewable energy resources, AC/DC and one switch DC/DC converters are considered [11,12,13,14,15,16,17,18]. In addition, a selection method of the values of parallel and series capacitors for SEIG is proposed by considering the reactive power losses from the magnetizing and leakage inductances. For the system analysis, the PSCAD [16] simulation is performed for the power and flux control validation. The paper is organized as follows. In Section 2, system configuration, electrolyzer model, power control, and capacitor selection, a modified system configuration of the electrolyzer circuit model, are explained. Section 3 and Section 4 present the simulation analysis and conclusion, respectively.
2. System Analysis
2.1. System Configuration
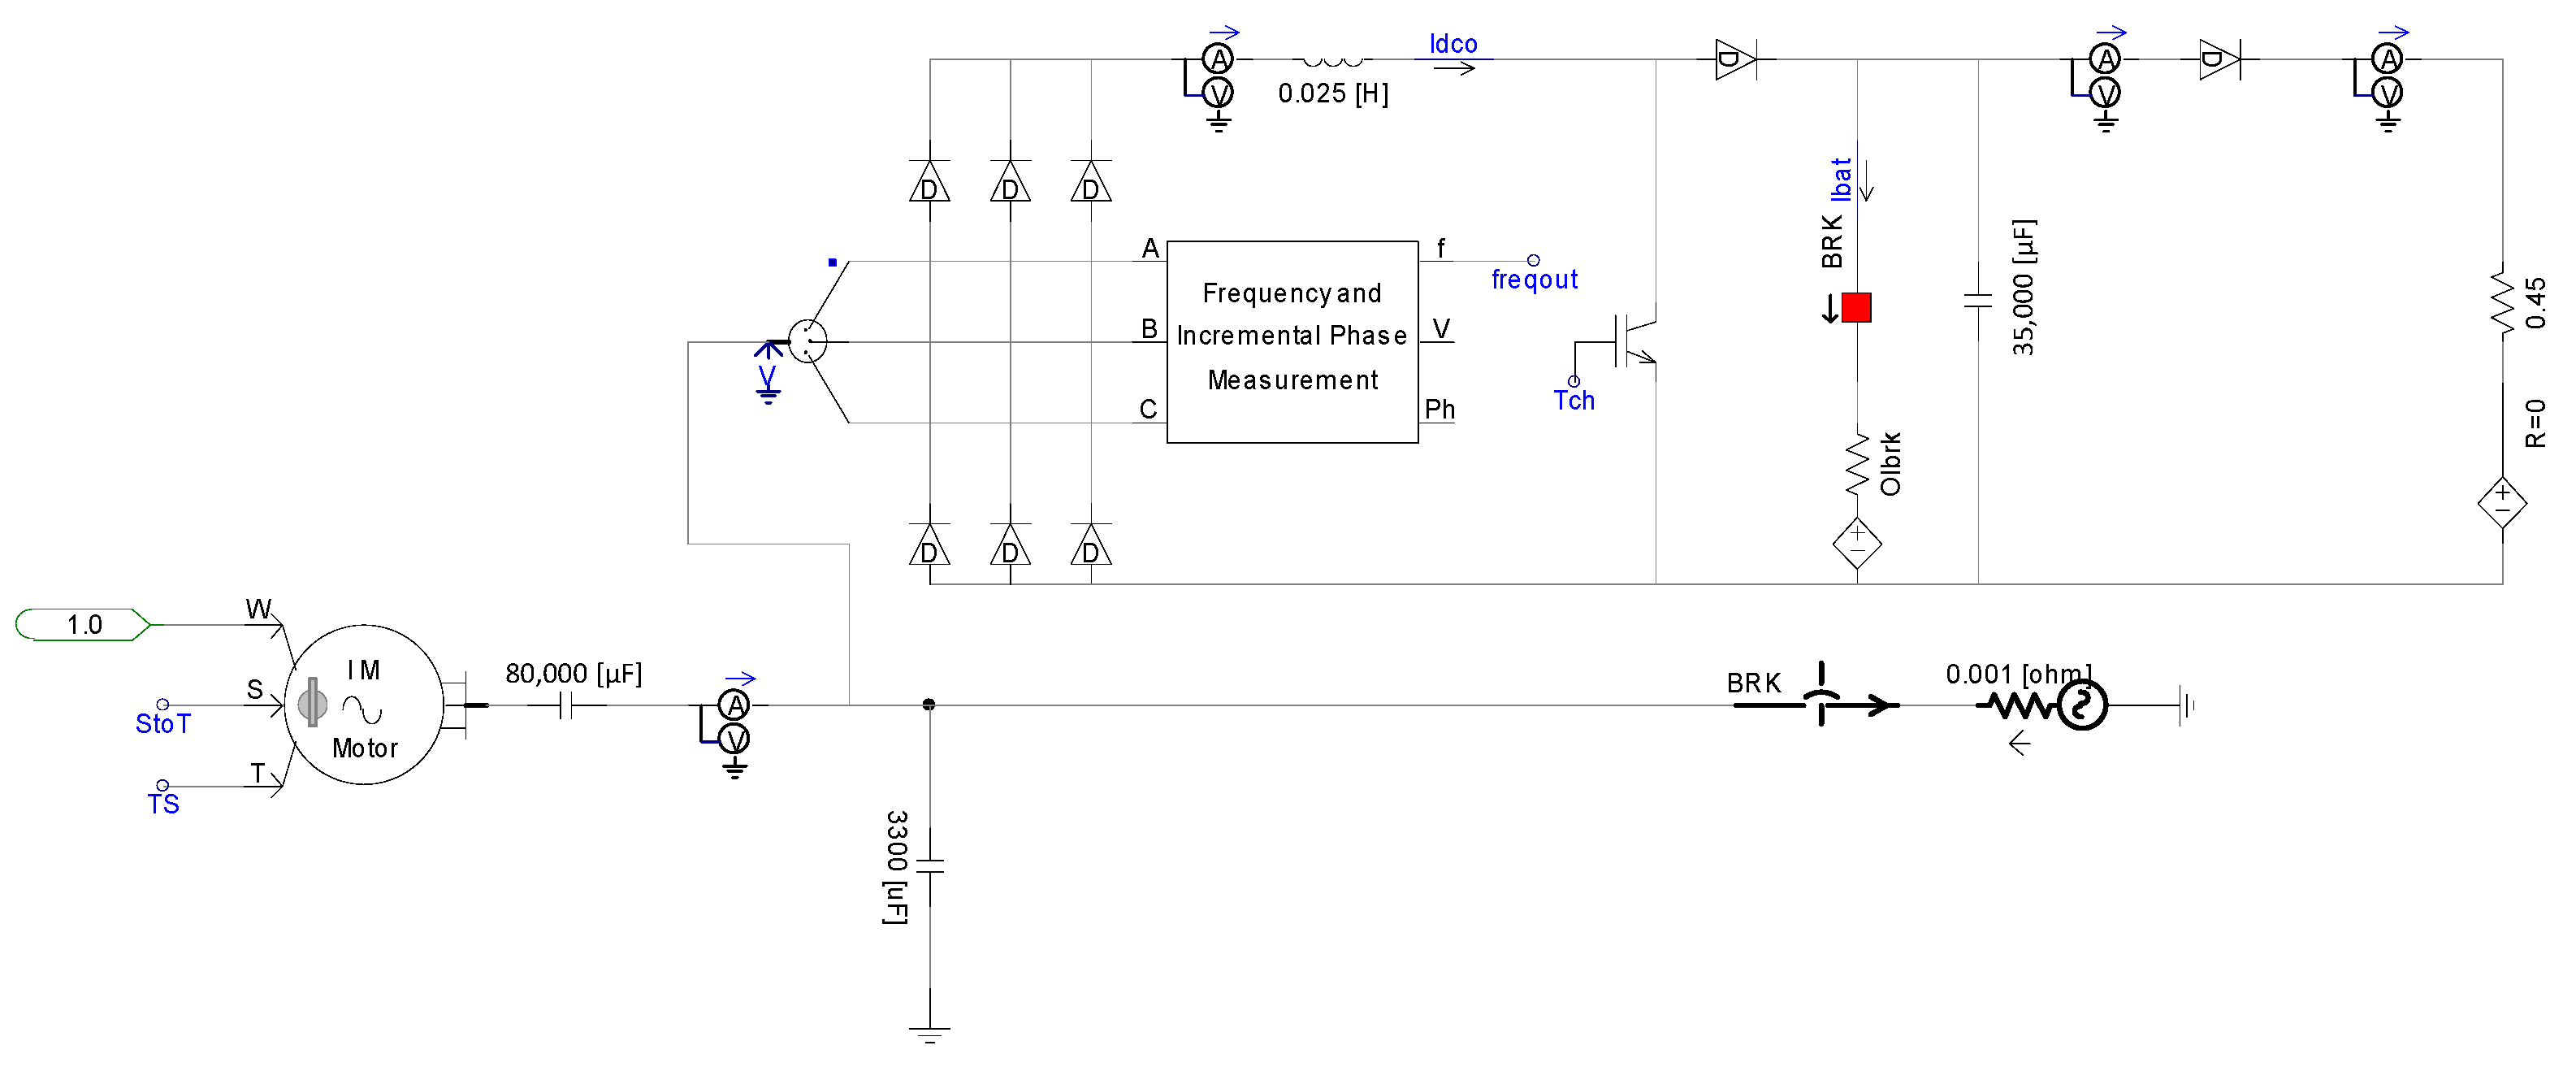
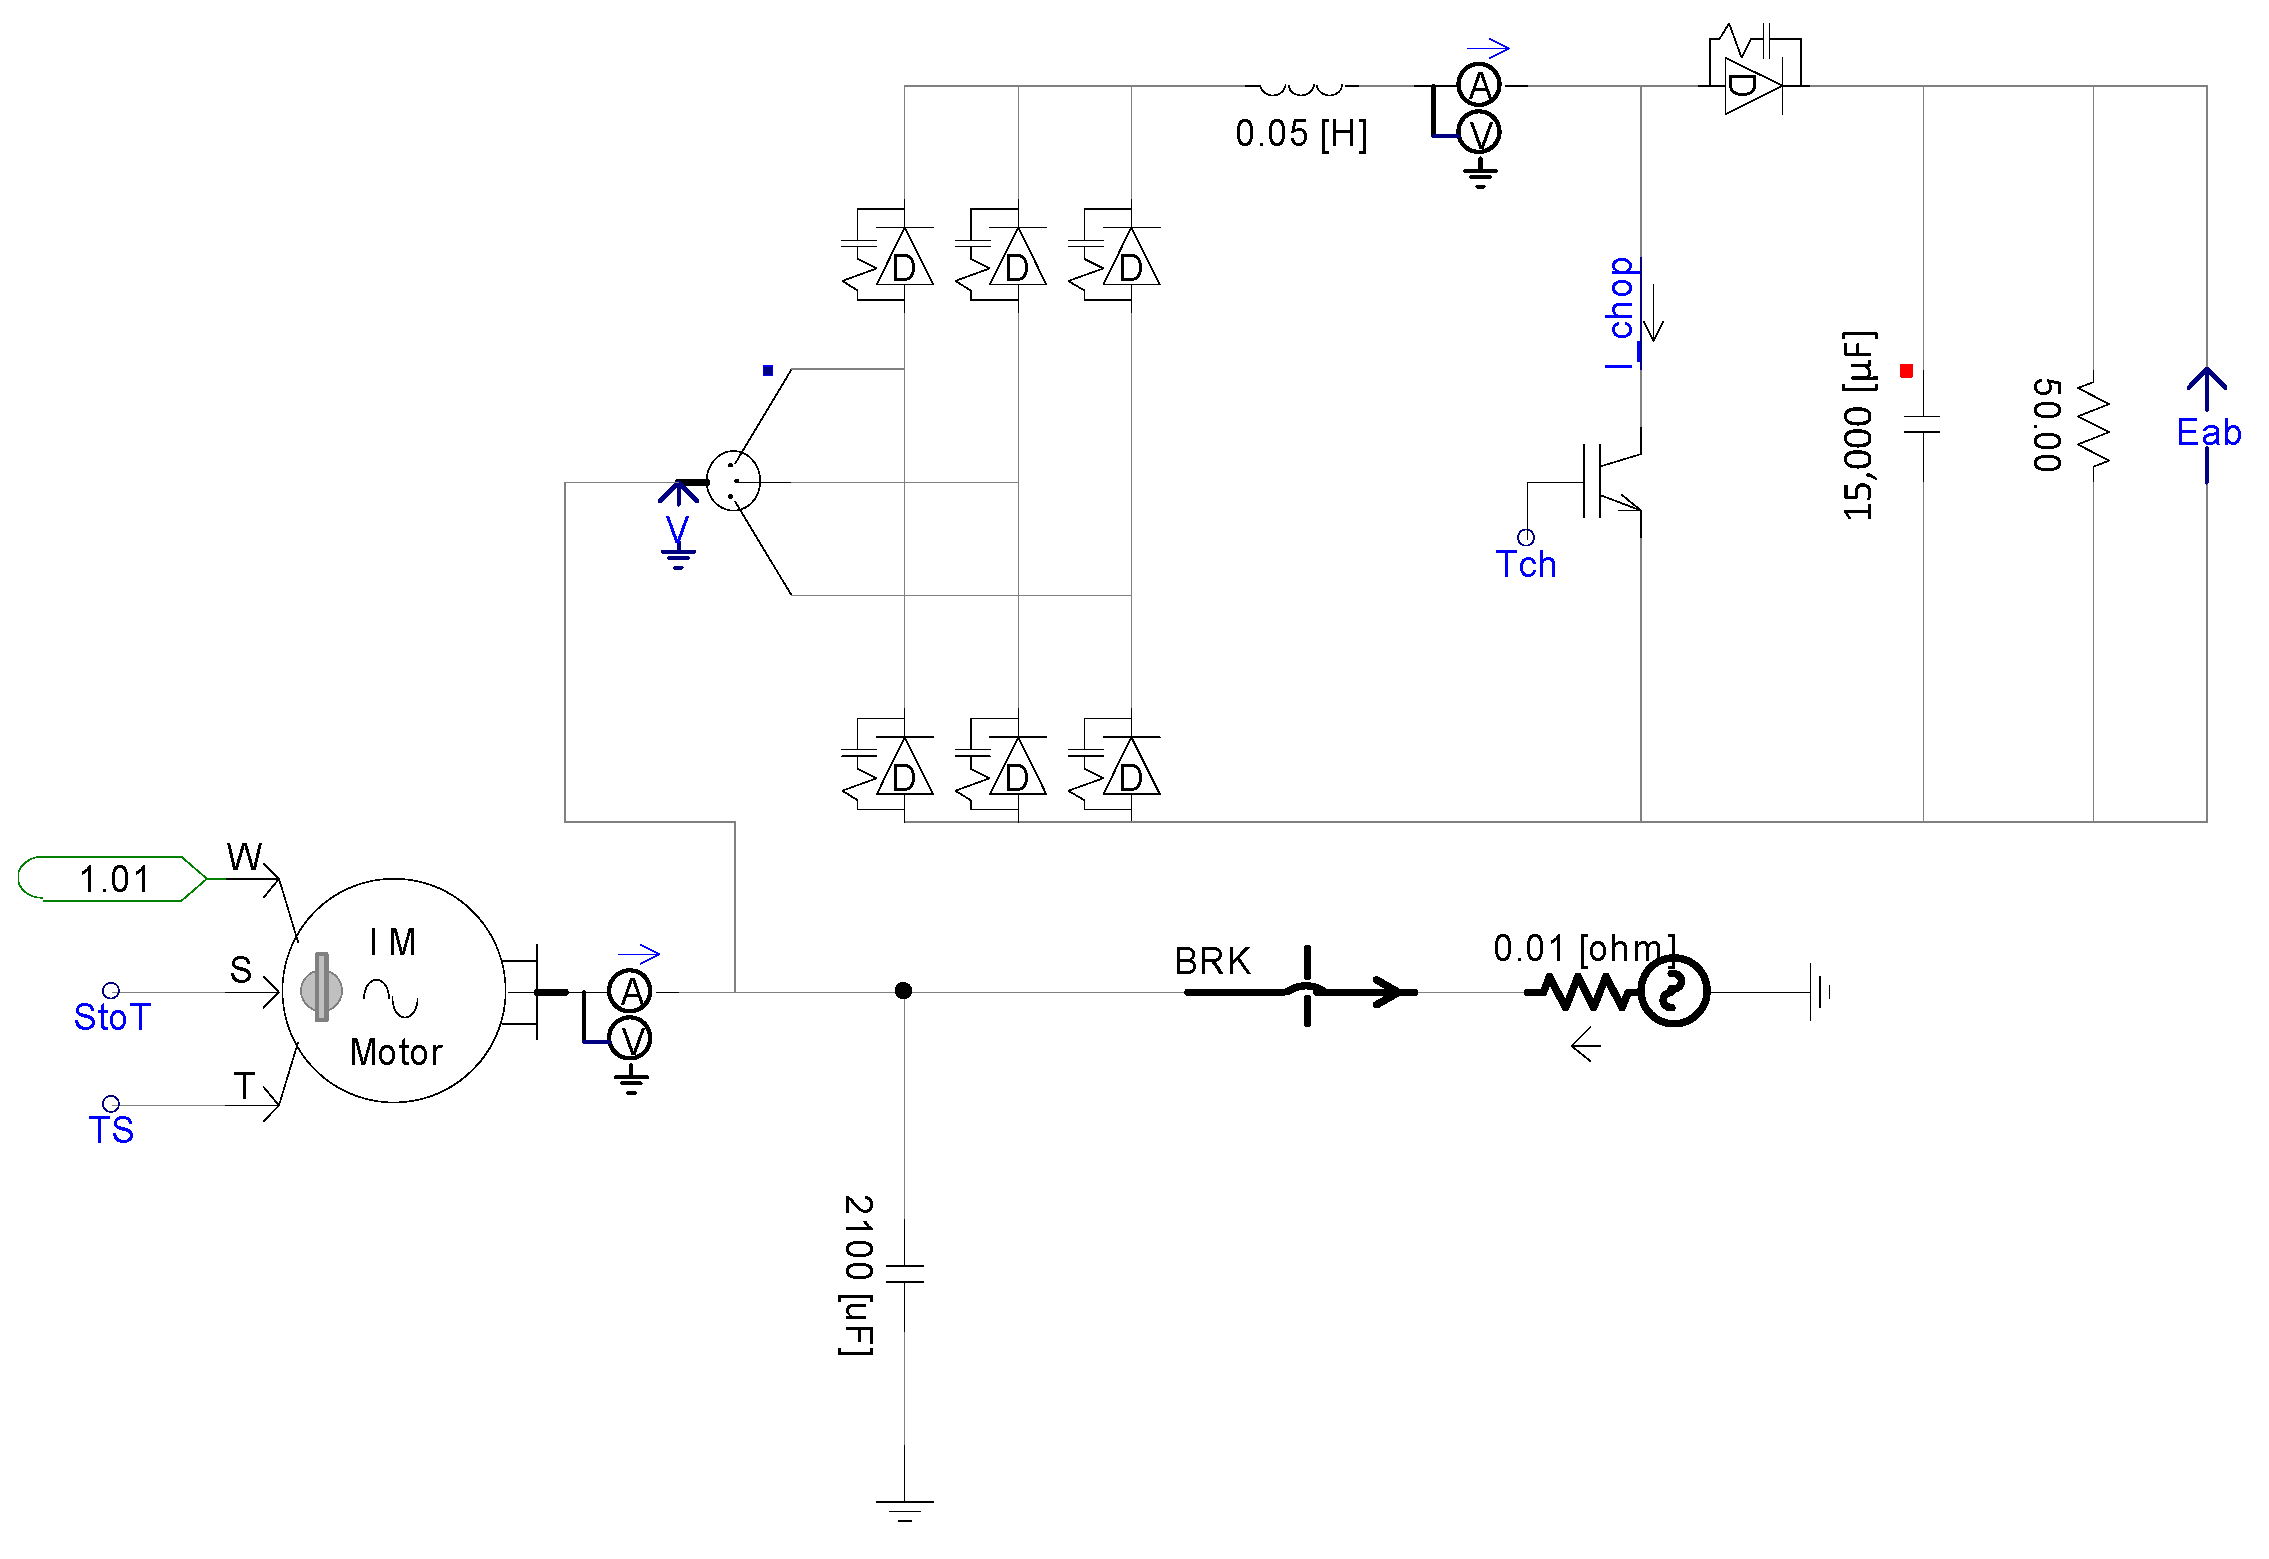
In Figure 1, the system schematic comprising the SEIG, power electronics interface, and DC load is designed by PSCAD [16]. An induction generator has speed (W), switch signal (S), and torque (T). The induction machine (IM) motor can be controlled in speed control mode and torque control mode using W and T, respectively. The switch signal performs the control action of switching between operating modes. In this study, the torque control mode is required more for designing active power and flux controllers than the speed control mode under the variable speed conditions. The SEIG is connected to the series and parallel excitation capacitors, and the three-phase AC output generated from SEIG is provided to the three-phase diode rectifier via these capacitor banks, and subsequently, a boost converter is connected between the diode rectifier and the final load. The main purpose of the boost converter is to control the load power fed to the electrolyzer. Details of the electrolyzer model, power control, and excitation capacitor selections are described in the following sections. For self-excitation to occur, a three-phase capacitor is connected in a star (Y) configuration in between the diode rectifier and SEIG. The capacitance in a three-phase connection would be derived based on the characteristic parameters of the SEIG. As described above, the proposed system controls the active power and estimates the flux for the self-excitation from the root mean square (RMS) value and frequency of the SEIG’s output voltages.
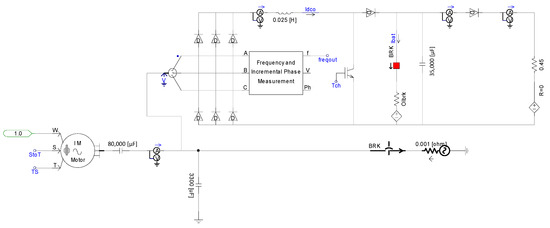
Figure 1.
System configuration.
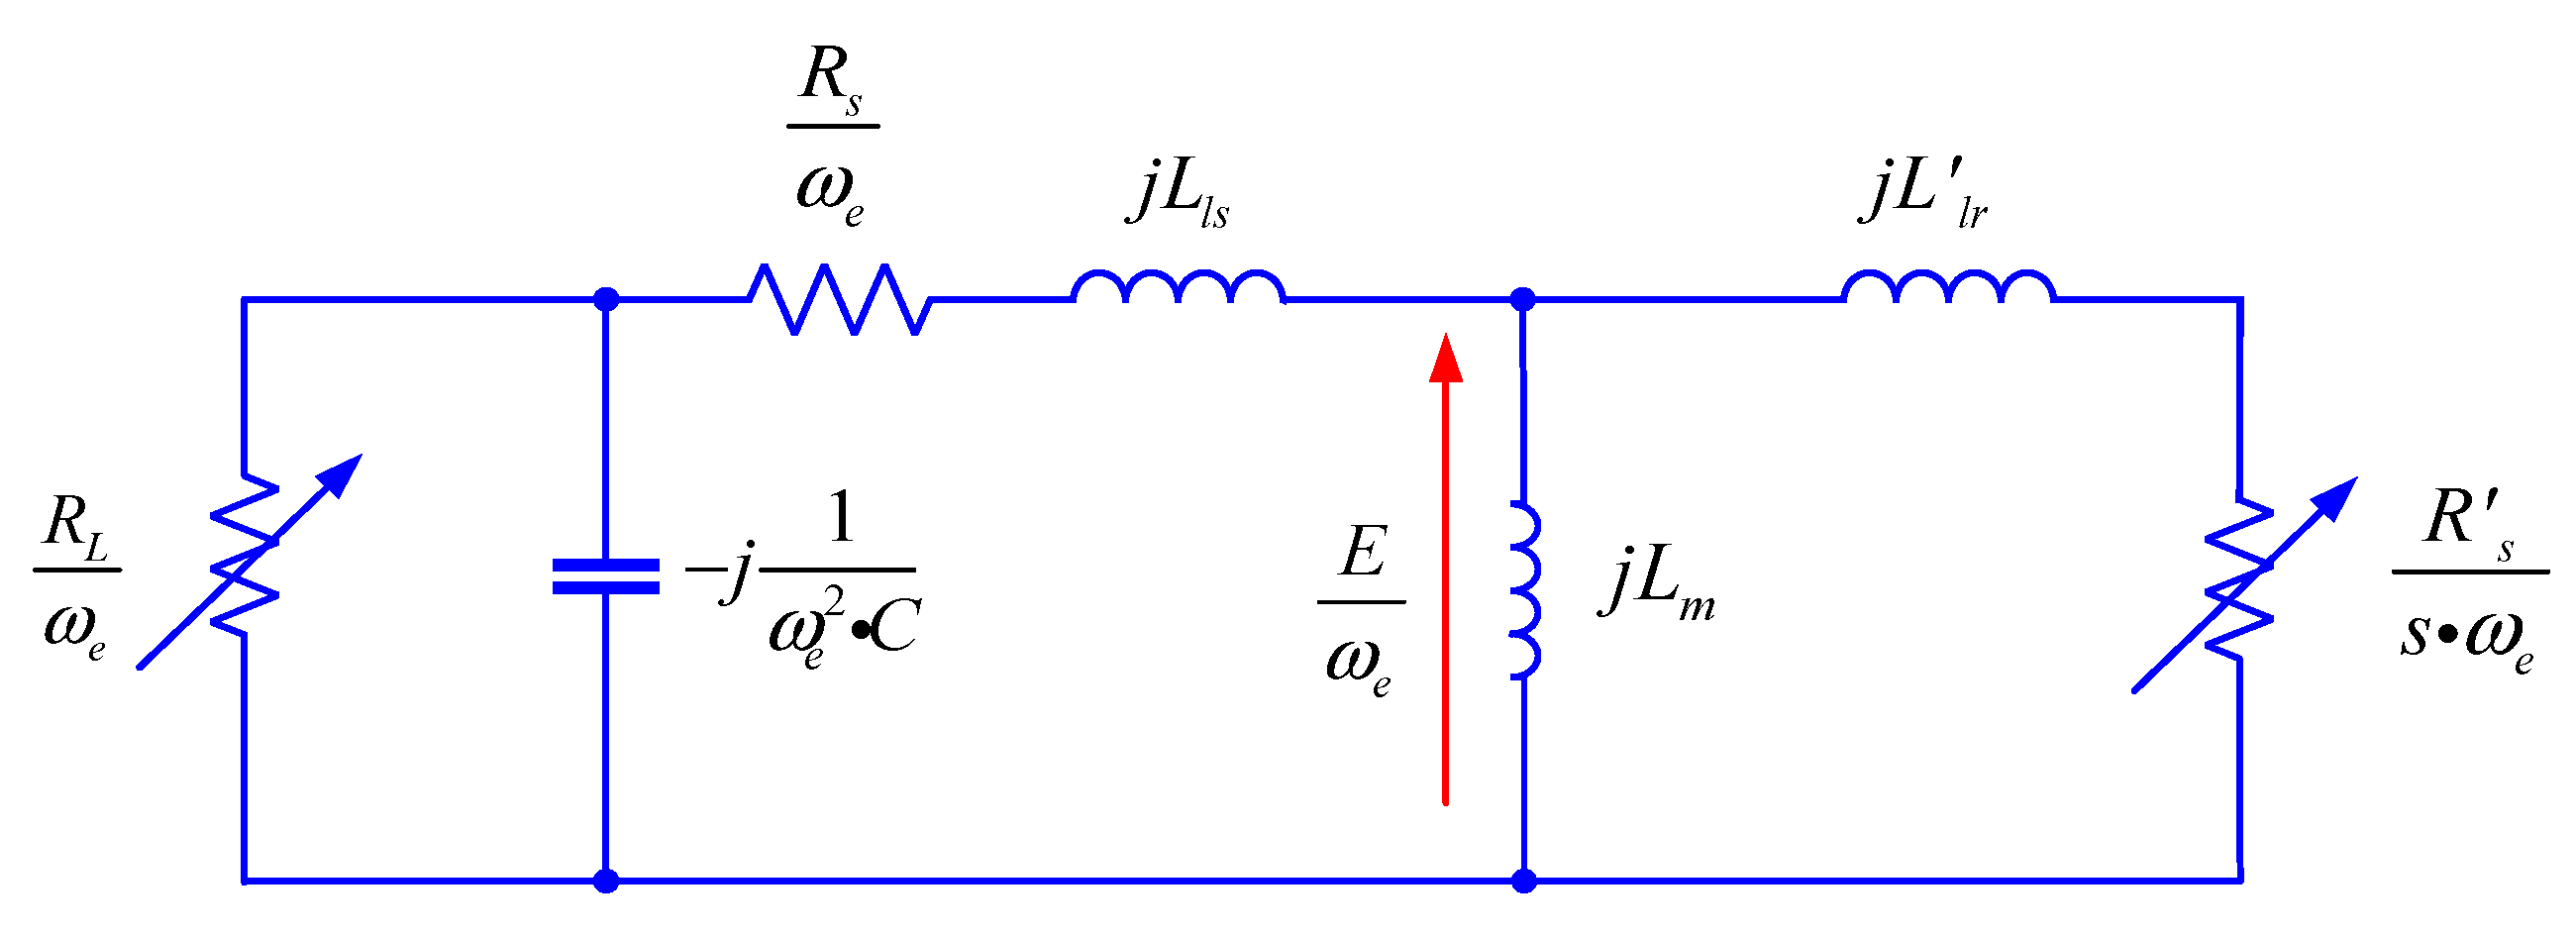
Figure 2 shows a per-phase equivalent circuit of the SEIG, where RL, Rs, Lls, Llr′, Rr′, Lm, E, ωe, and s are the equivalent effective load resistance, resistance of stator, reactance of stator, reactance of rotor referred to the stator side, resistance of rotor referred to the stator side, magnetization reactance, generator air-gap voltage, operation frequency, and motor slip, respectively. For the analysis with a load on the generator, the per-phase equivalent circuit can be resorted to, which includes the connected load and rotor circuit. In this circuit, all reactance refers to the base operating frequency ω, while ωe is pu-generated frequency. The self-excitation results in the saturation of the main flux. Thus, as the value of the magnetization reactance reflects the magnitude of the main flux, its variation is essential to be considered.
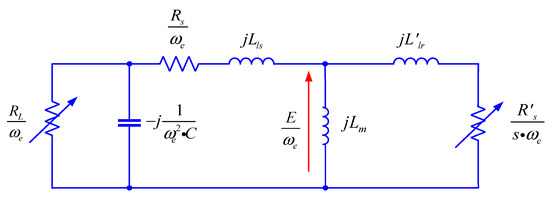
Figure 2.
Per-phase equivalent circuit of the self-excited induction generator (SEIG).
The main impedance equations for balancing the stability of the real and reactive power are as follows:
where Re, Im, Ztotal denote the real part, imaginary part, and total impedance of the per-phase equivalent circuit, respectively, in Figure 2.
Re(Ztotal = 0) for the real power balance,
Im(Ztotal = 0) for the reactive power balance,
2.2. Electrolyzer Model
The structure of an electrolyzer could consist of complicated mechanical dynamic flow models [19] or several resistors, and capacitors based on an equivalent circuit model [19]. An electrolyzer can be applied to complex modeling, controls, and optimal sizing design with a DC/DC converter, and wind–hydrogen production [20,21,22]. Due to the combination of the wind system, AC/DC, and DC/DC converters, the electrolyzer is modeled as a simple circuit model consisting of a resistor and ideal voltage source in series because it is connected to the power converter generating a voltage or current source. According to the parameters of the electrolyzer [7] shown in Table 1, our electrolyzer parameters are re-scaled. In [8], the line-to-line voltage of SEIG is given as 1.6 kV.

Table 1.
Parameters of the electrolyzer [6].
Assuming that the rated power capacity of our targeted electrolyzer is 66 kW with the line-to-line voltage of 480 V by considering the power capacity of SEIG as 66 kW, the new internal resistance for the electrolyzer, Ro_new is obtained by Equation (3).
The new internal voltage of our electrolyzer, Vo_new, can be calculated by Equation (4).
The re-scaled parameters for the 66 kW electrolyzer are seen in Table 2.
Table 2.
Parameters of 66 kW electrolyzer.
2.3. Power Control
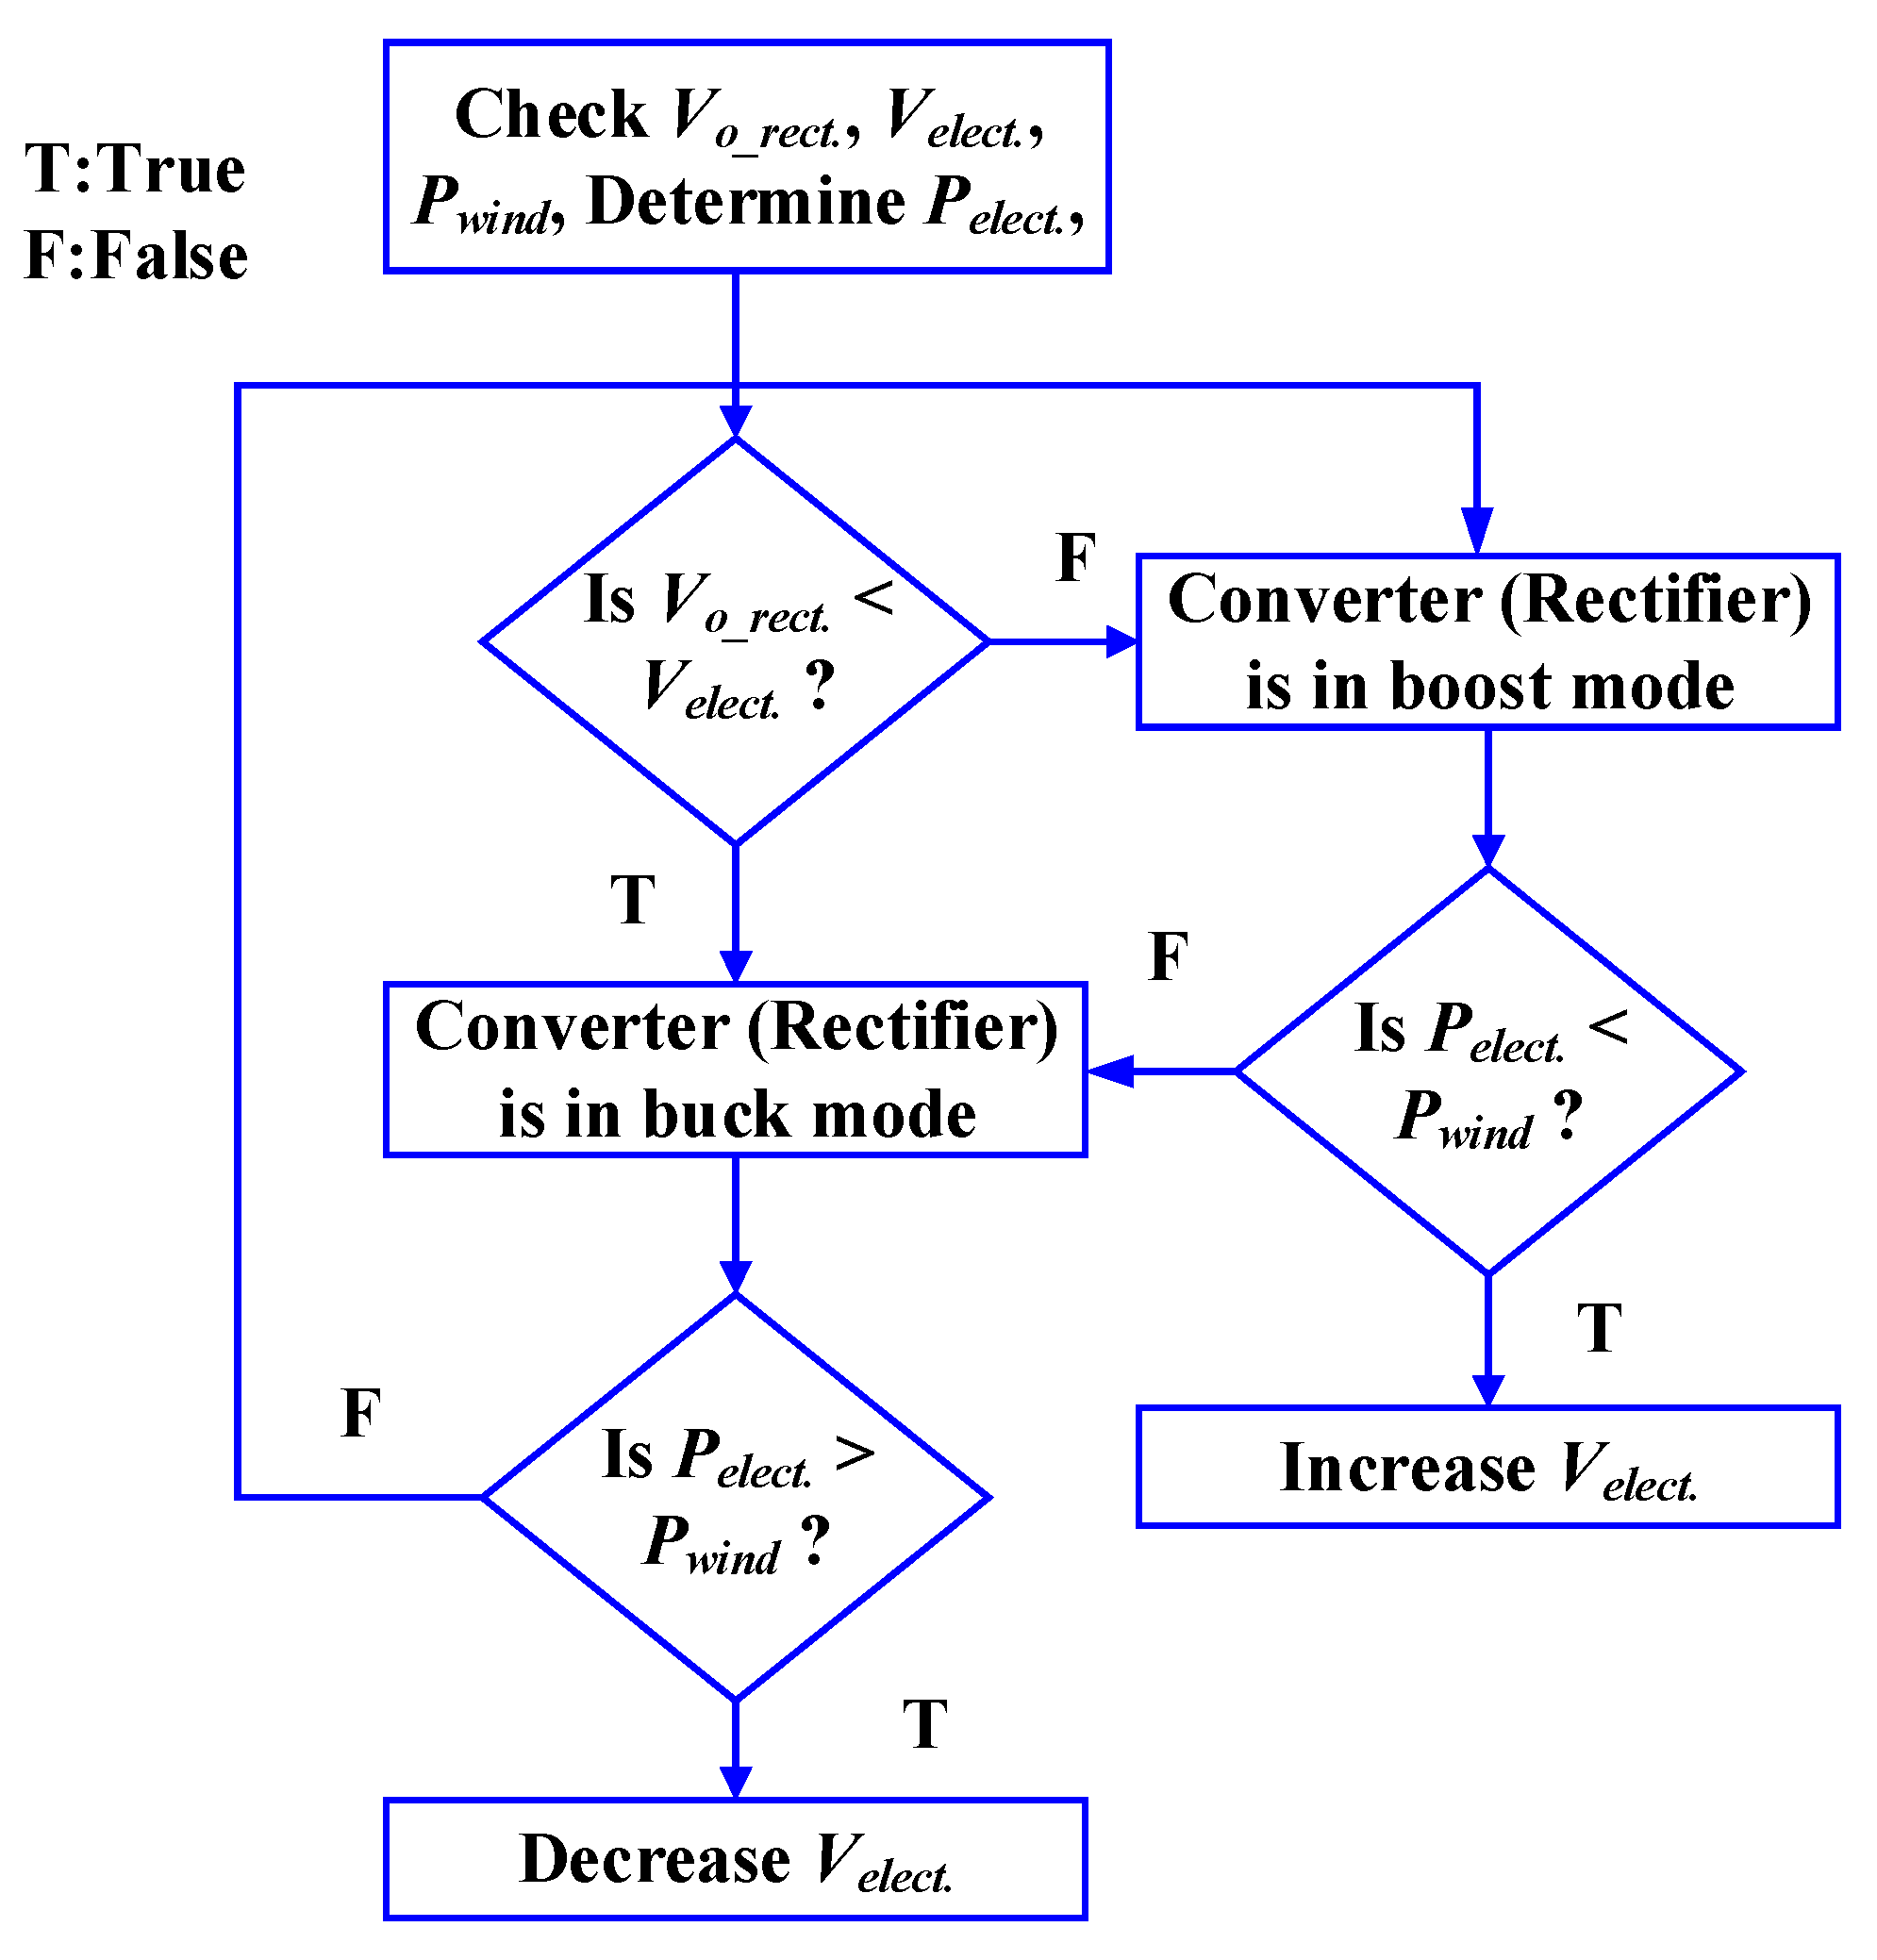
Details of the power control algorithm for the electrolyzer are shown in the flowchart of Figure 3. First, the output voltage of the three-phase diode rectifier in Figure 1 and the input voltage to the electrolyzer is sensed, and the power of the electrolyzer is calculated. Secondly, the ideal power of the wind turbine is extracted from the cubed rotor speed (n) in revolutions per minute (rpm) of SEIG with the computed data, Kp, as in [2]:

Figure 3.
Flowchart of power control for electrolyzer.
The optimum power derived from Equation (5) can be assumed to make the analysis simple, that the rotor speed varies proportionally as the wind speed changes. Based on the sensed voltages, the mode of the power converter is determined, that is, whether it can be in a boost or buck mode. For example, if the output voltage Vo_rect. of the diode rectifier is less than the electrolyzer voltage Velect., or the output voltage of the power converter, the power converter will be operated in the buck mode; otherwise, it can be operated in the boost mode. Once the mode of the operation of the power converter is decided, the electrolyzer power Pelect. is compared with the ideal wind power, Pwind. Thus, in the buck mode, if Pelect. is bigger than Pwind, the output voltage of the power converter or electrolyzer voltage Velect. is decreased; otherwise, Velect. would be increased in the boost mode, and vice versa.
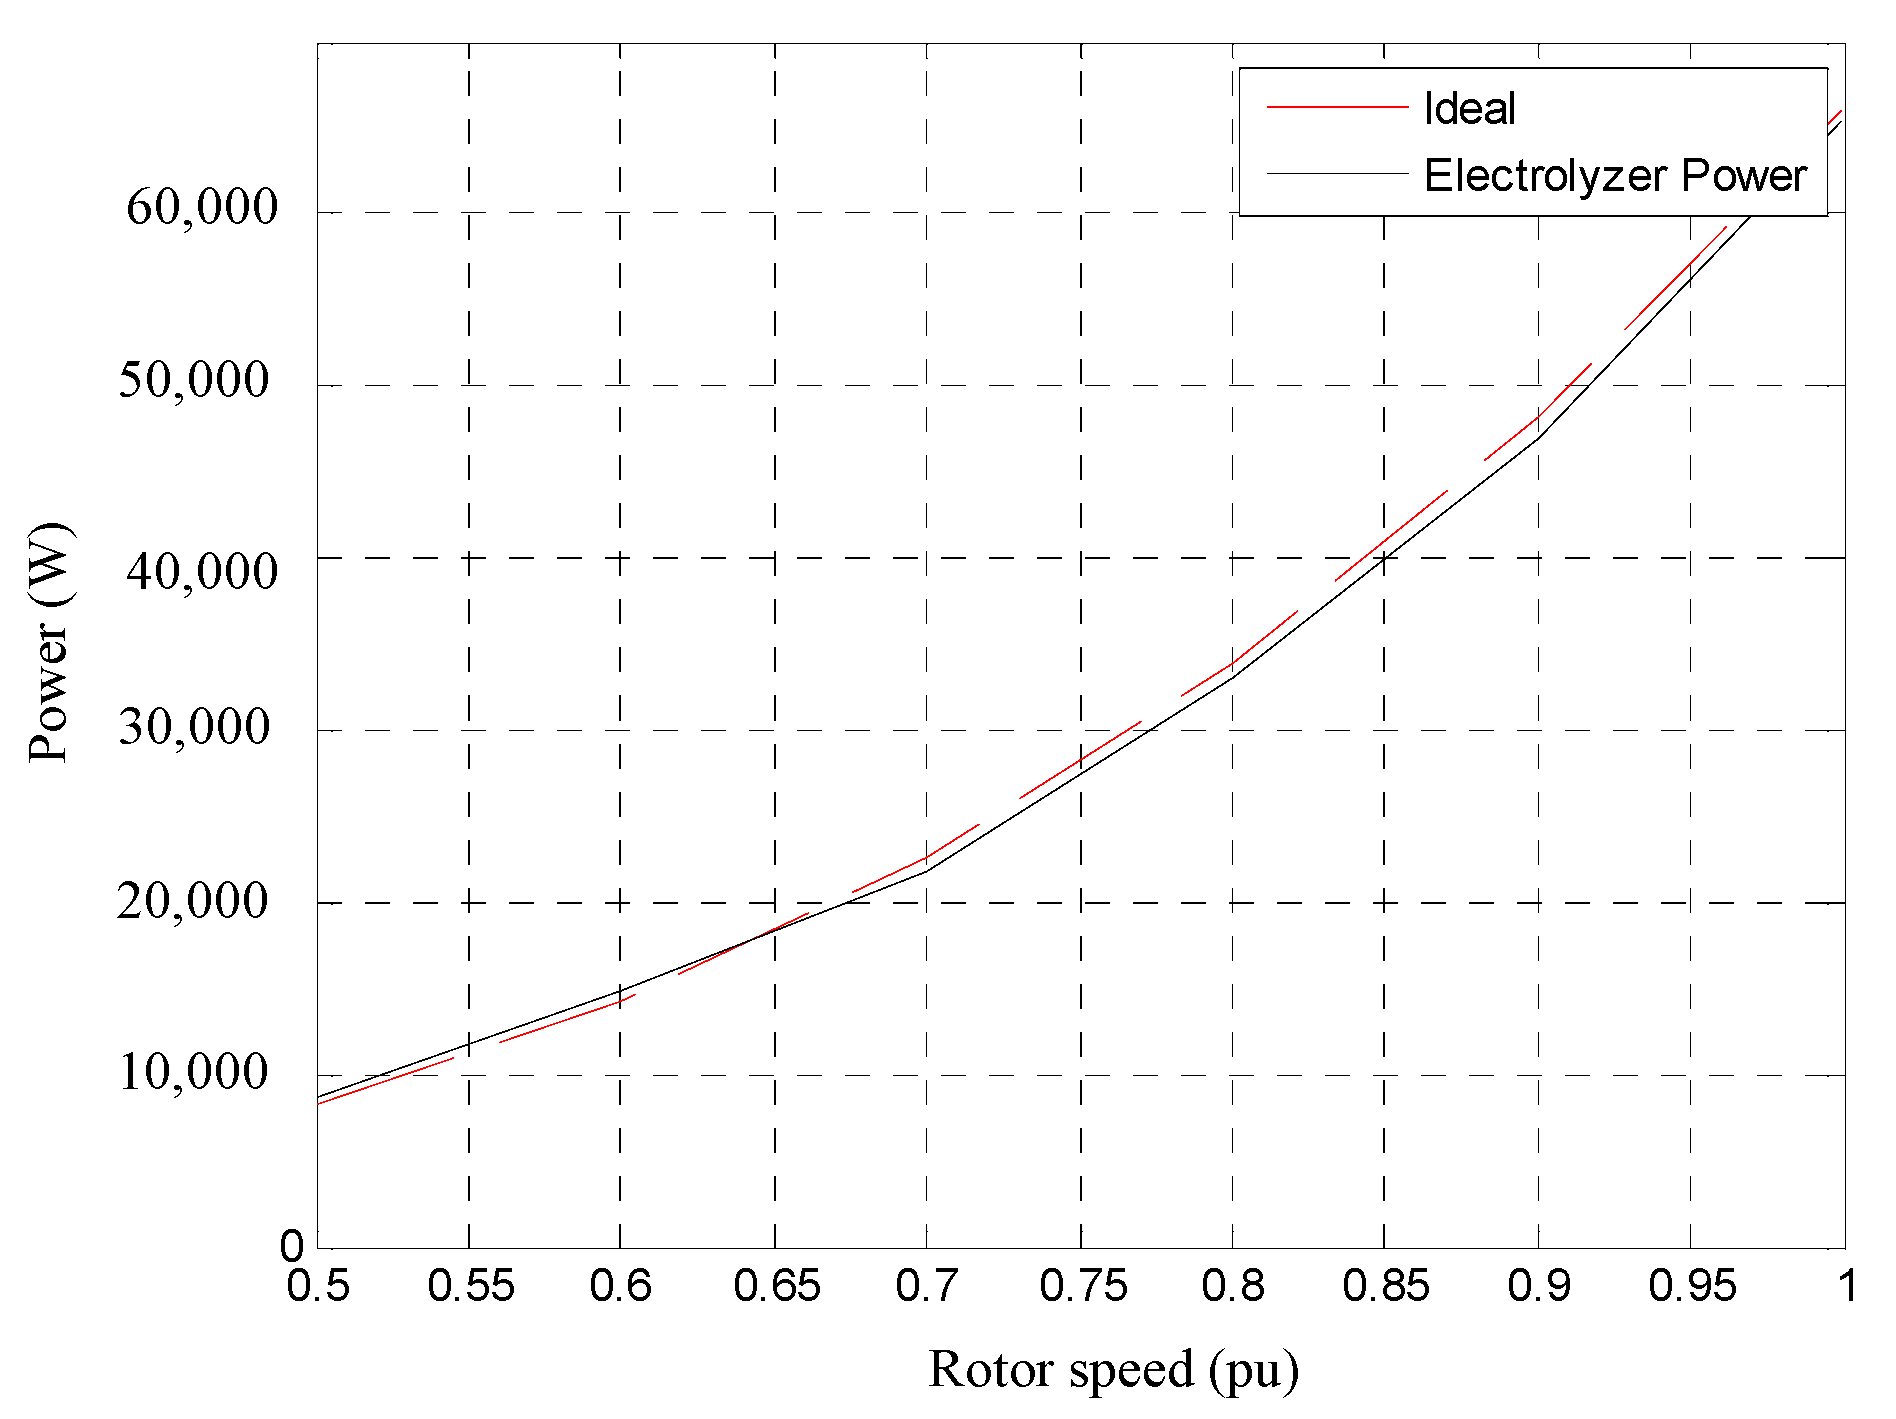
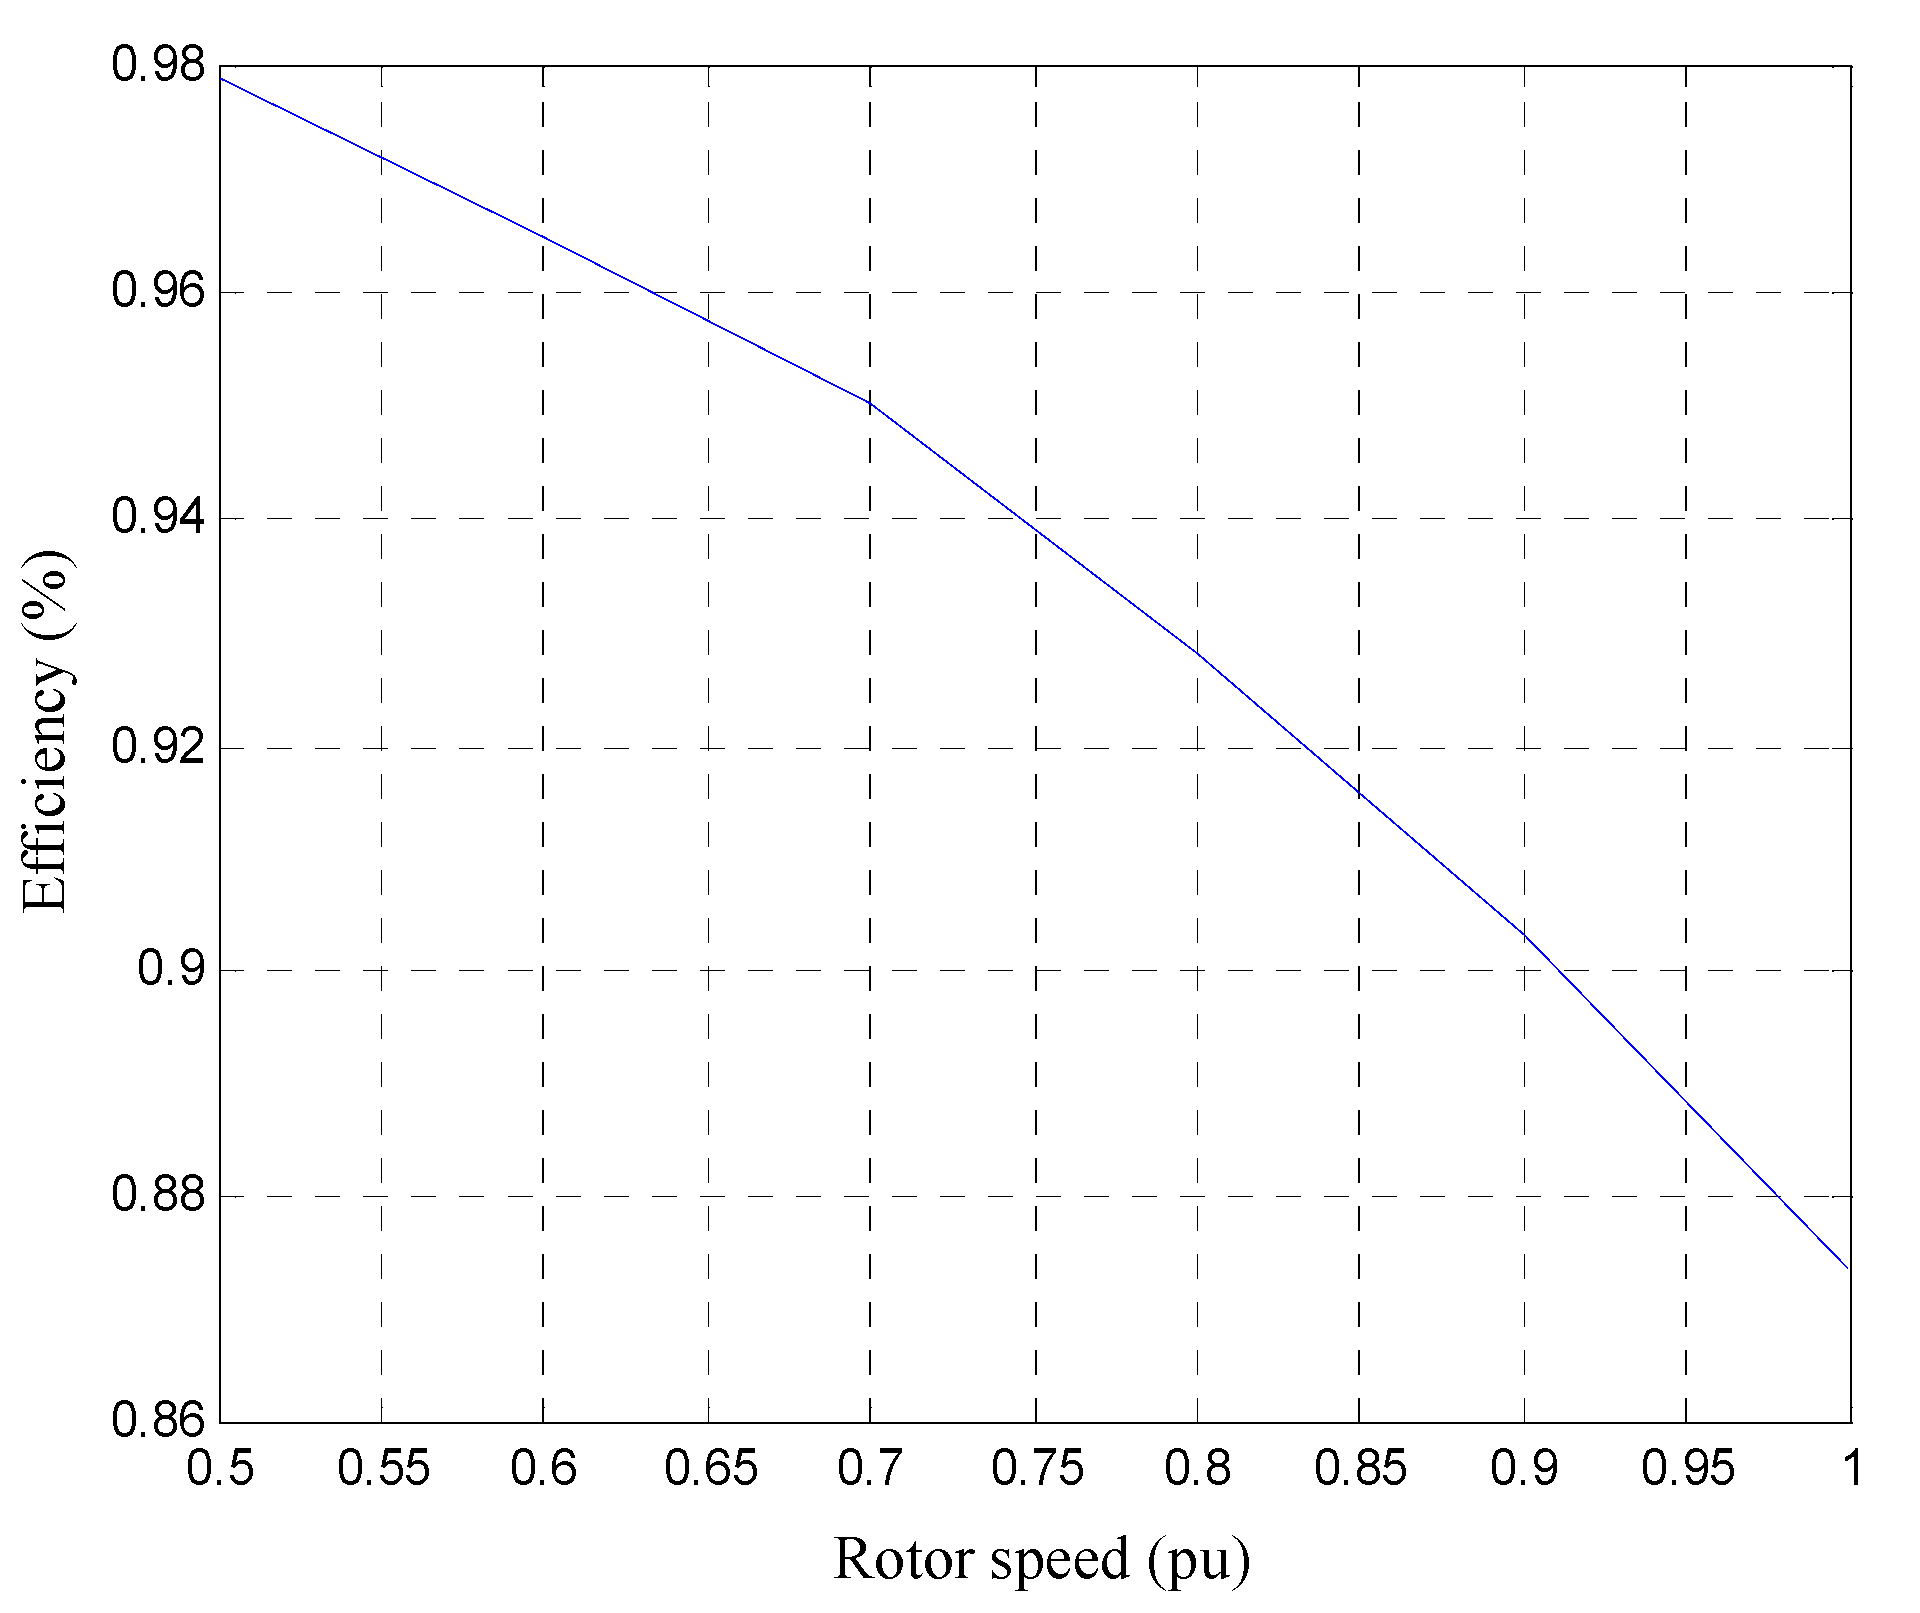
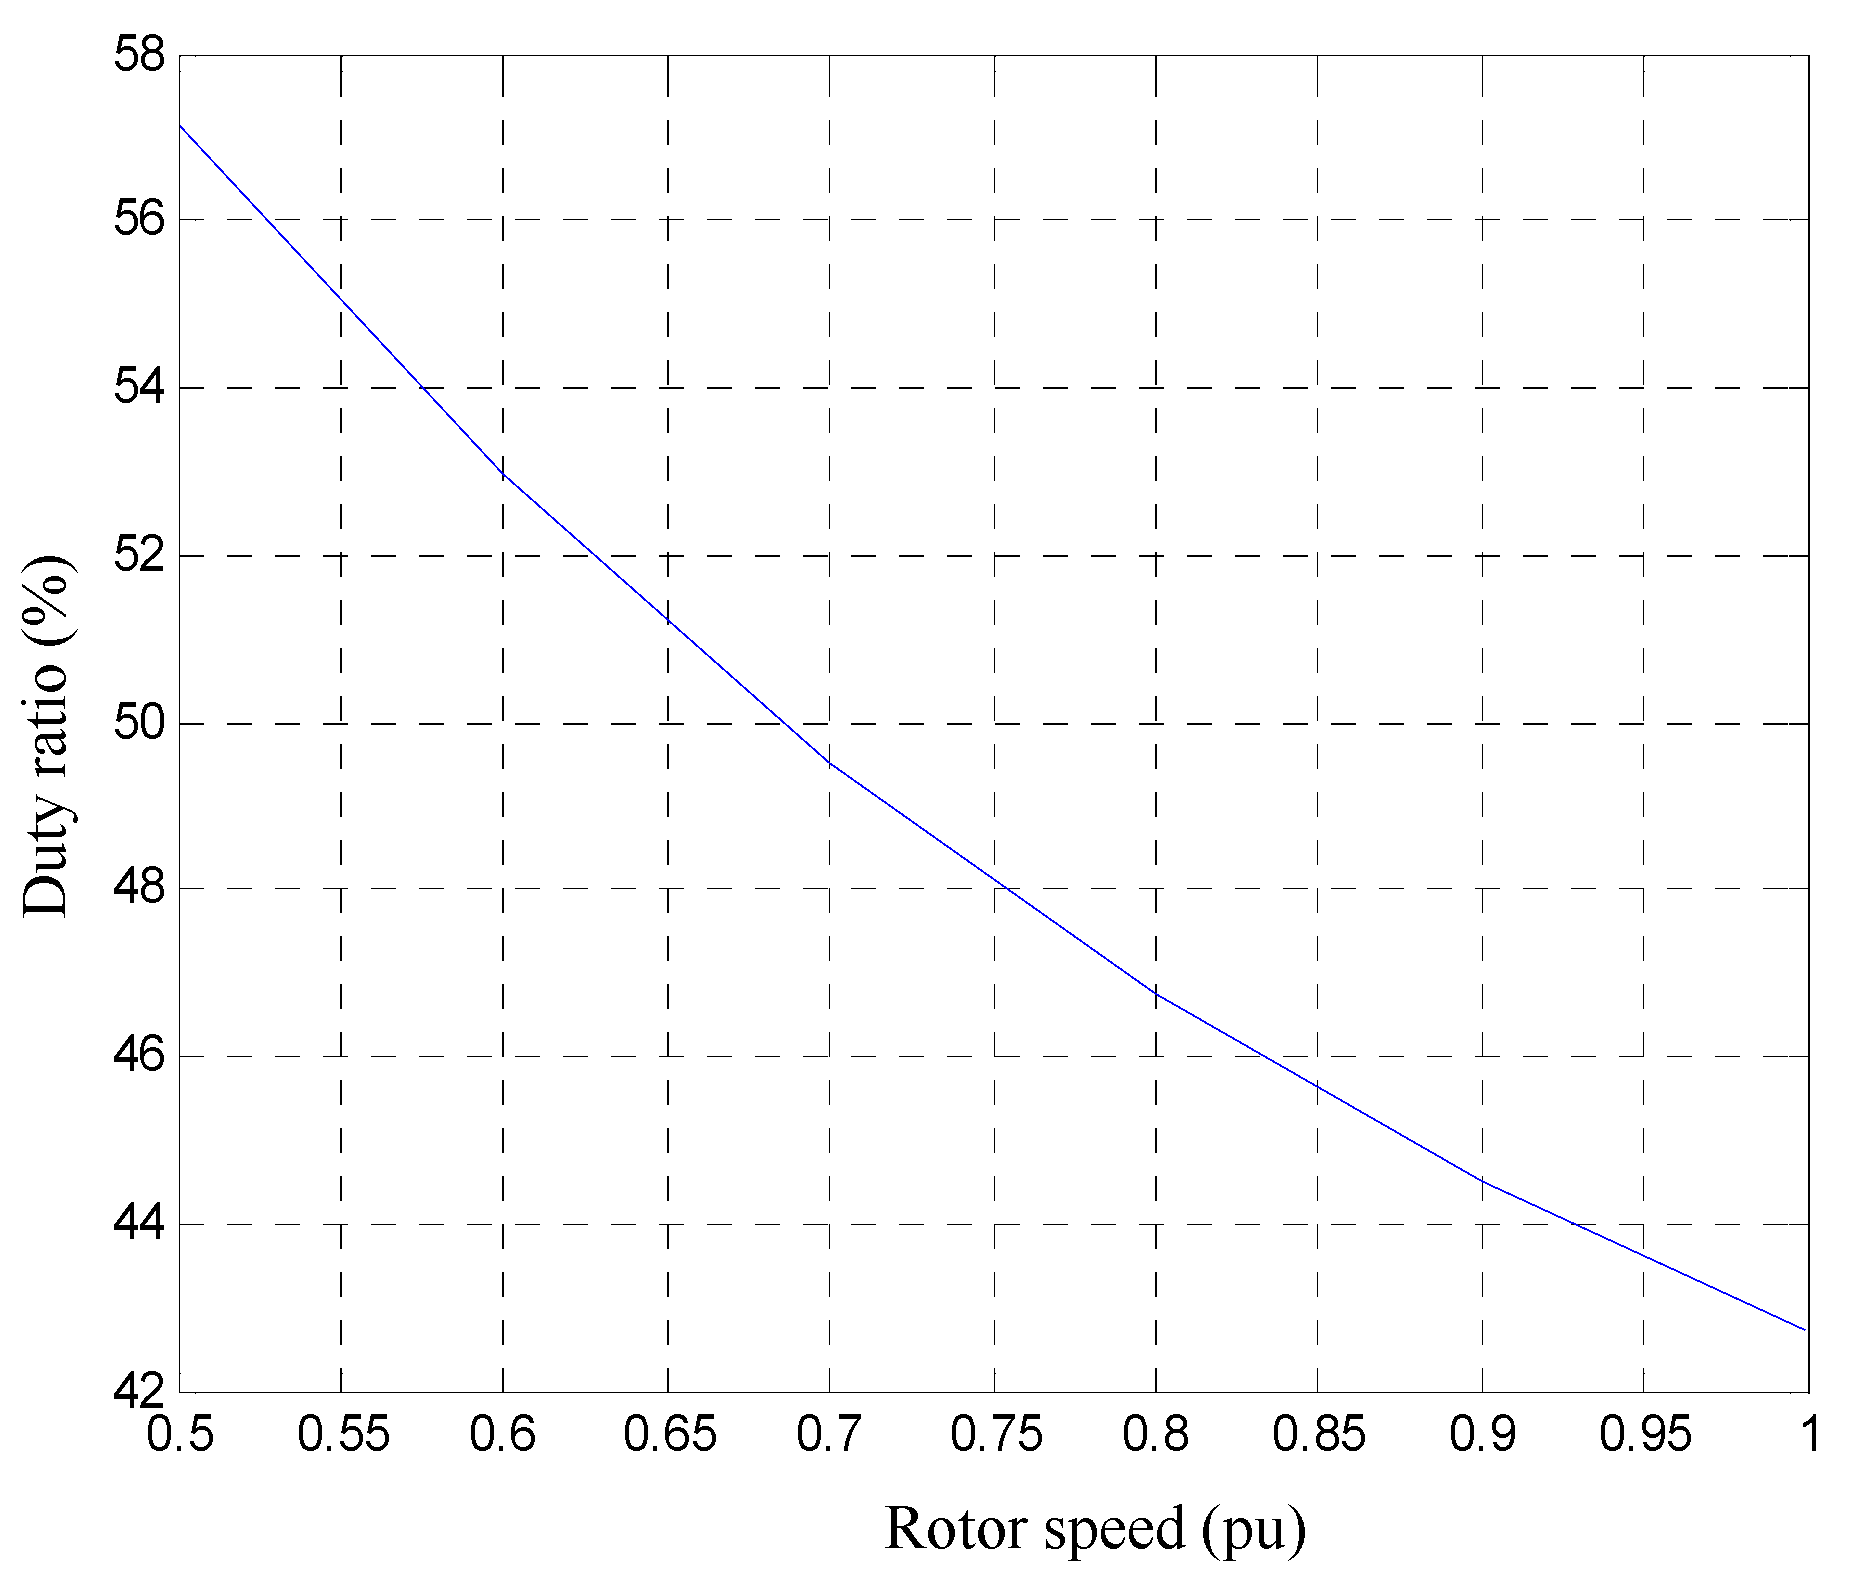
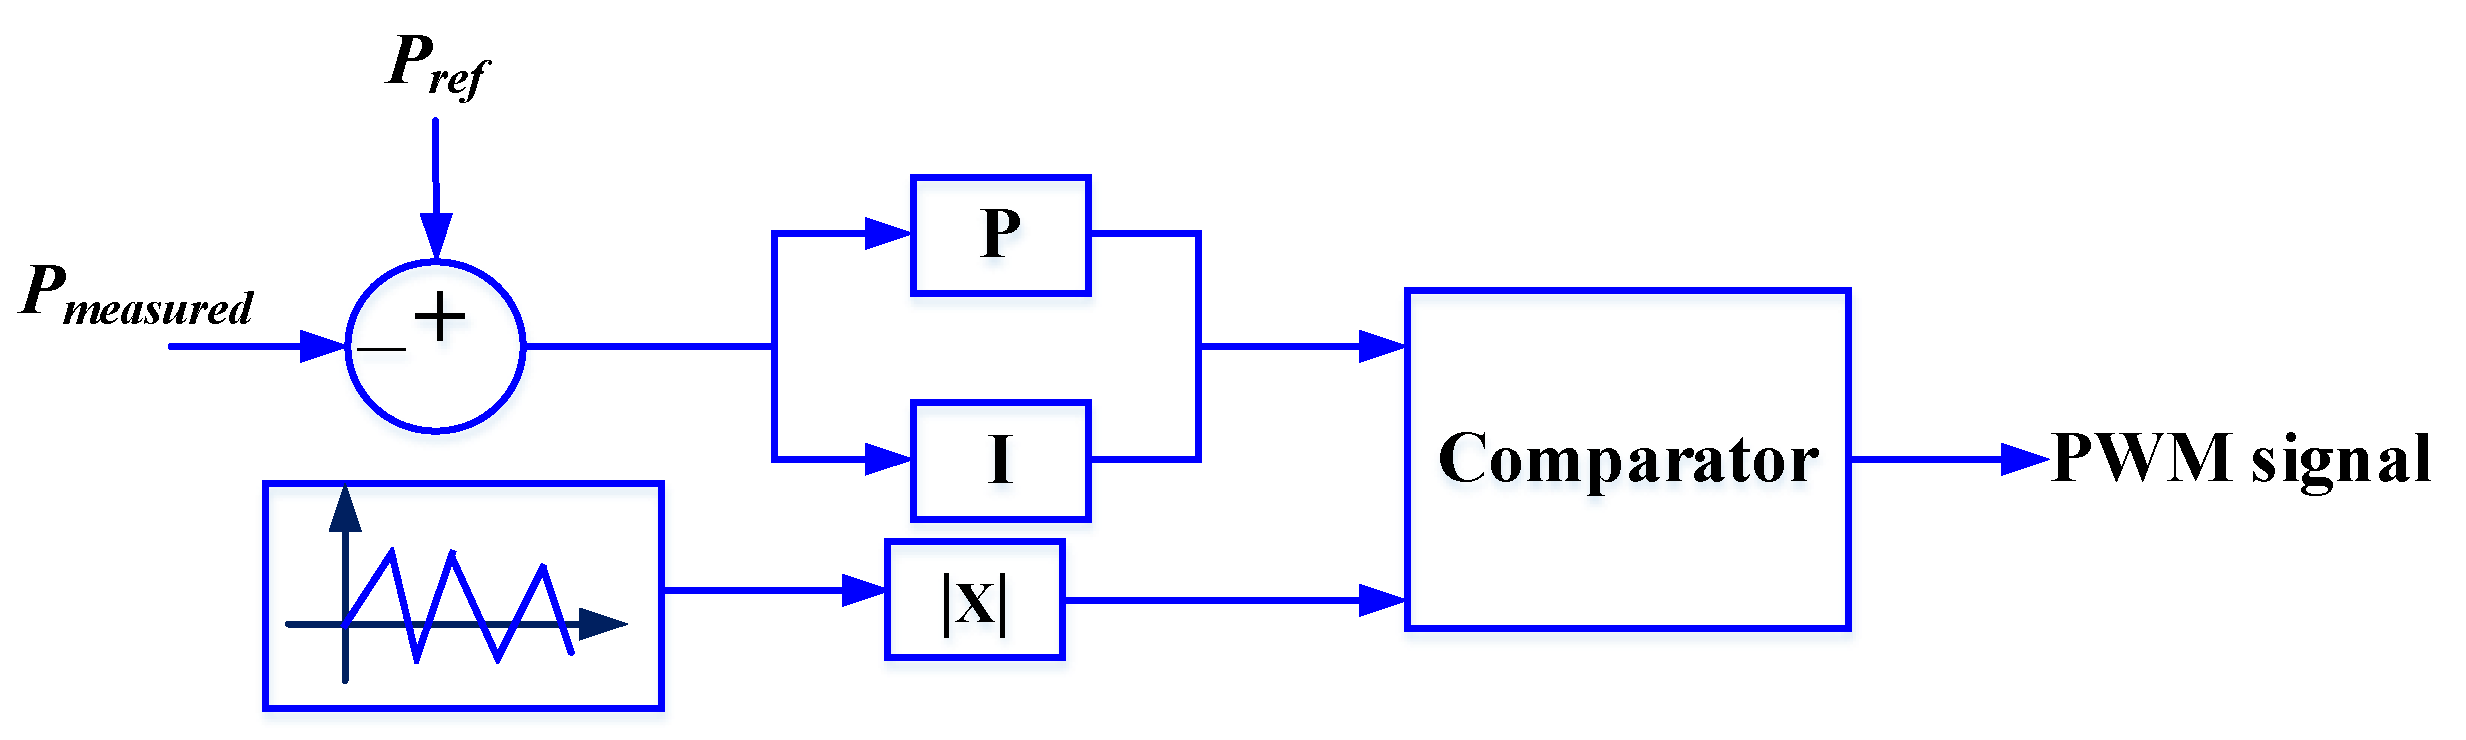
Figure 4, Figure 5 and Figure 6 show MATLAB results by enforcing the proposed power control algorithm based on the flowchart seen in Figure 3. Figure 4 shows the power versus the rotor speed curve. From the figure, the power of the electrolyzer exponentially increases with an increase in the rotor speed. The electrolyzer power almost nearly matches the ideal power required within a system. Figure 5 shows the efficiency of the system against the rotor speed. The efficiency is high at a low-speed condition but decreases at higher speeds. The rotor speed is to be regulated optimally to ensure efficiency for the system. The duty ratio to drive the converter within the system circuit is plotted against the rotor speed, as shown in Figure 6. The duty ratio is decreasing with increasing rotor speed. However, the ideal duty ratio is attained for the optimal operation of the converter. The power is inversely proportional to the efficiency and duty ratio with increasing speeds. Figure 7 presents the block diagram of the active power controller modeled in PSCAD. Pmeasured and Pref are the SEIG measured power and the reference power, respectively. In Figure 7, a proportional and integral (PI) controller is utilized where its output is compared with a triangular signal generator. The PI controller calculates an error signal by taking the difference between the measured and reference powers. The reference power is the power at which the system is expected to operate, and ideally, we expect the system to operate near its maximum power without any disturbances. The DC/DC boost converter obtains a 1.5 kHz of PWM signal from a triangular signal generator for active power control in high power applications over 100 kW. The PI controller’s gains are decided through analytical approaches.
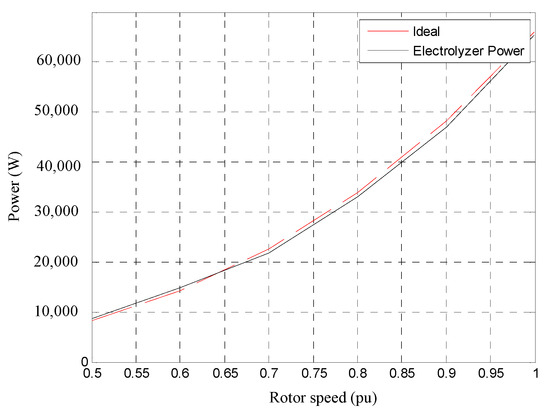
Figure 4.
Power versus rotor speed.
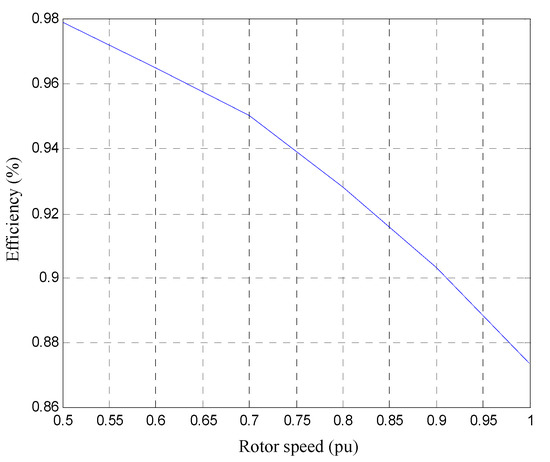
Figure 5.
Efficiency versus rotor speed.
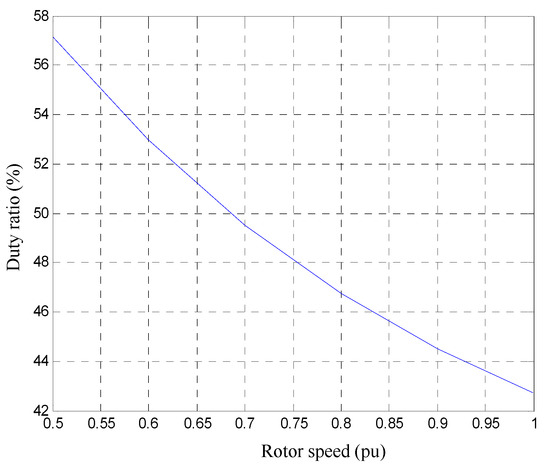
Figure 6.
Duty ratio versus rotor speed.
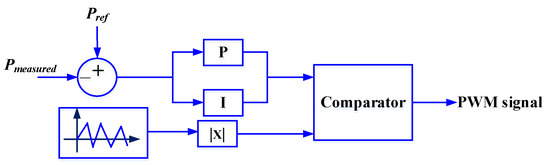
Figure 7.
Active power controller.
2.4. Capacitor Selections
With the given machine parameters, the values of the capacitors for excitation can be determined. The values of the parallel capacitor Cp and series capacitor Cs for the excitation can be calculated using Equations (6) and (7), respectively.
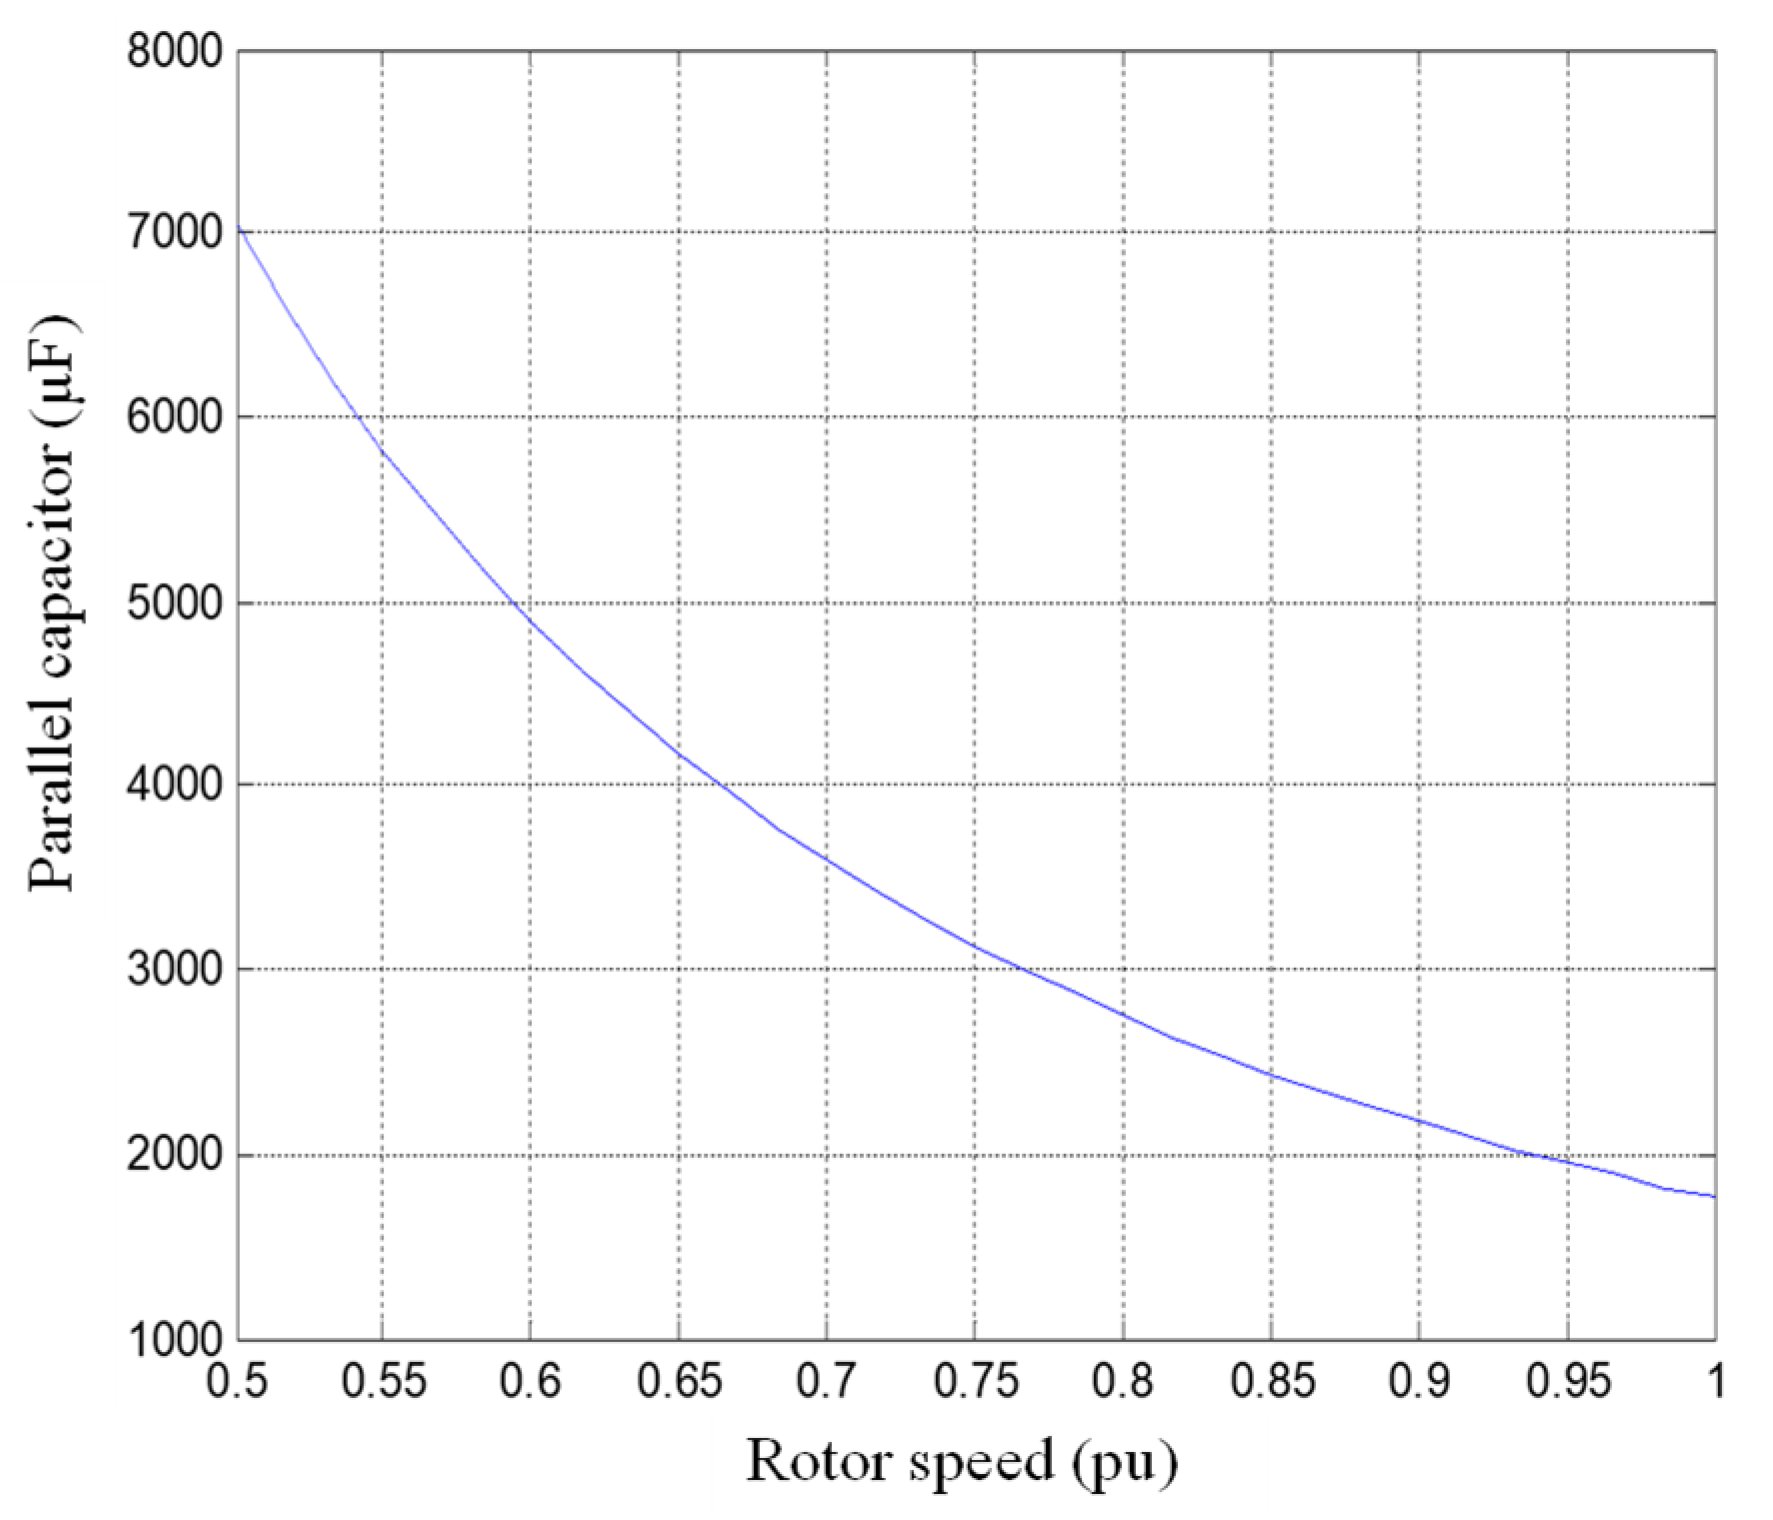
where for ωm is the angular rotor speed (rad/s), Lm is magnetization inductance (H), Lls is stator leakage inductance, and Llr is rotor leakage inductance (H). Figure 8 and Figure 9 show each capacitor variation based on the rotor speed variation. From Equations (6) and (7), we notice the capacitance is inversely proportional to the square of speed. Thus, an increasing speed requires a lower minimum capacitor for self-excitation and vice versa; consequently, as the rotor speed increases, each capacitor tends to be decreased. Additionally, if sufficient capacitors are connected as required at the rotational speed of the generator, the generator can operate as a self-excited generator. However, it is necessary to have full knowledge of the phenomenon of self-excitation that produces a voltage across the generator decided by the capacitor and speed.
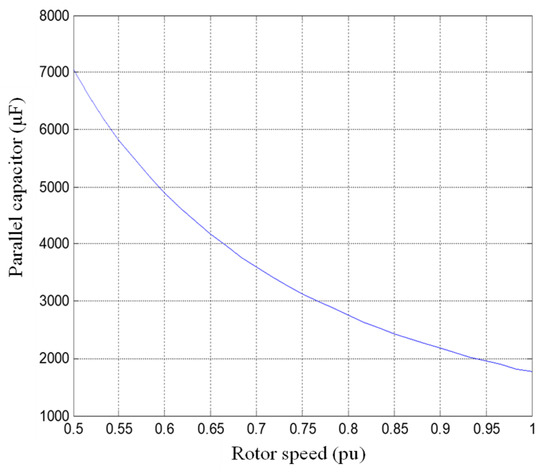
Figure 8.
Cp variation.
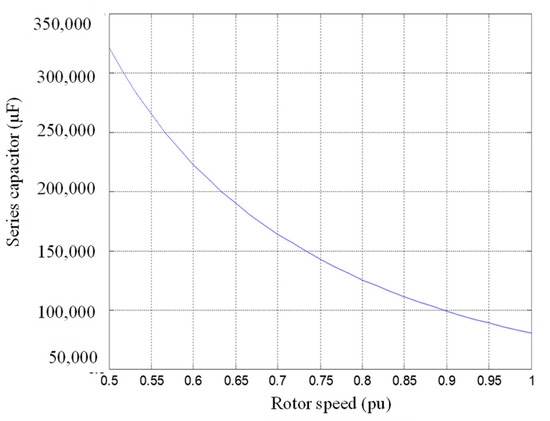
Figure 9.
Cs variation.
2.5. Modified System Configuration of the Electrolyzer Model Circuit
In this configuration, the electrolyzer is modeled in a parallel connection of a resistor and a DC voltage source. Figure 10 shows the system configuration where the SEIG is connected to the parallel excitation capacitor of 2100 µF, and the three-phase AC output generated from the SEIG is delivered to the three-phase diode rectifier and then a boost converter connection between the diode rectifier and the modeled electrolyzer circuit. The SEIG has speed (W), switch signal (S), and torque (T) signal ports. The SEIG can be controlled in speed and torque control modes.

Figure 10.
Modified electrolyzer system configuration.
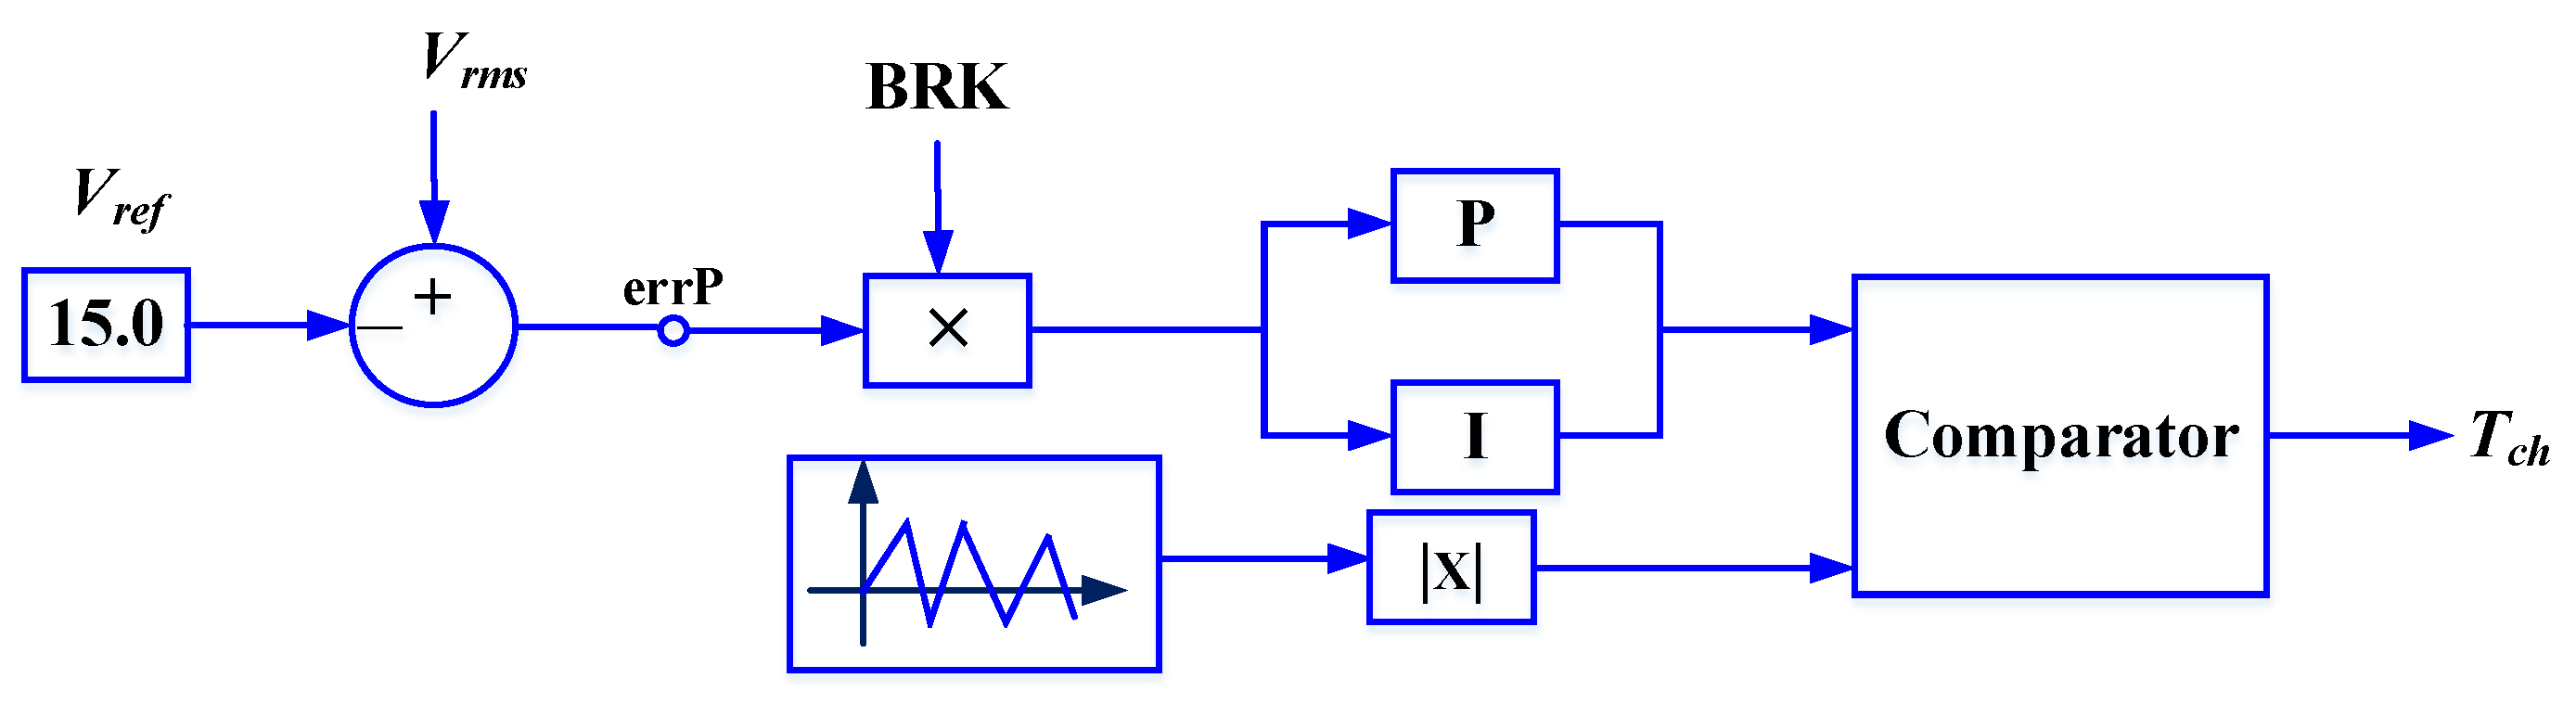
Figure 11 shows the PSCAD schematic diagram for the active power controller for the converter. A reference voltage is compared with the RMS voltage. The error is multiplied by an open breaker time value, then the result is put through a PI controller. The output of the PI controller is compared with the magnitude of a triangular waveform and the output of the comparator is the control signal (Tch) for the converter.
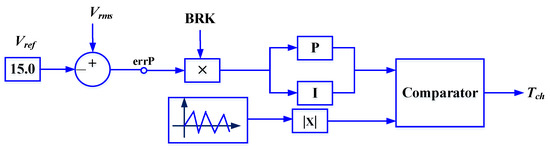
Figure 11.
Active power controller for the converter.
3. Computer Simulation Analysis and Discussion
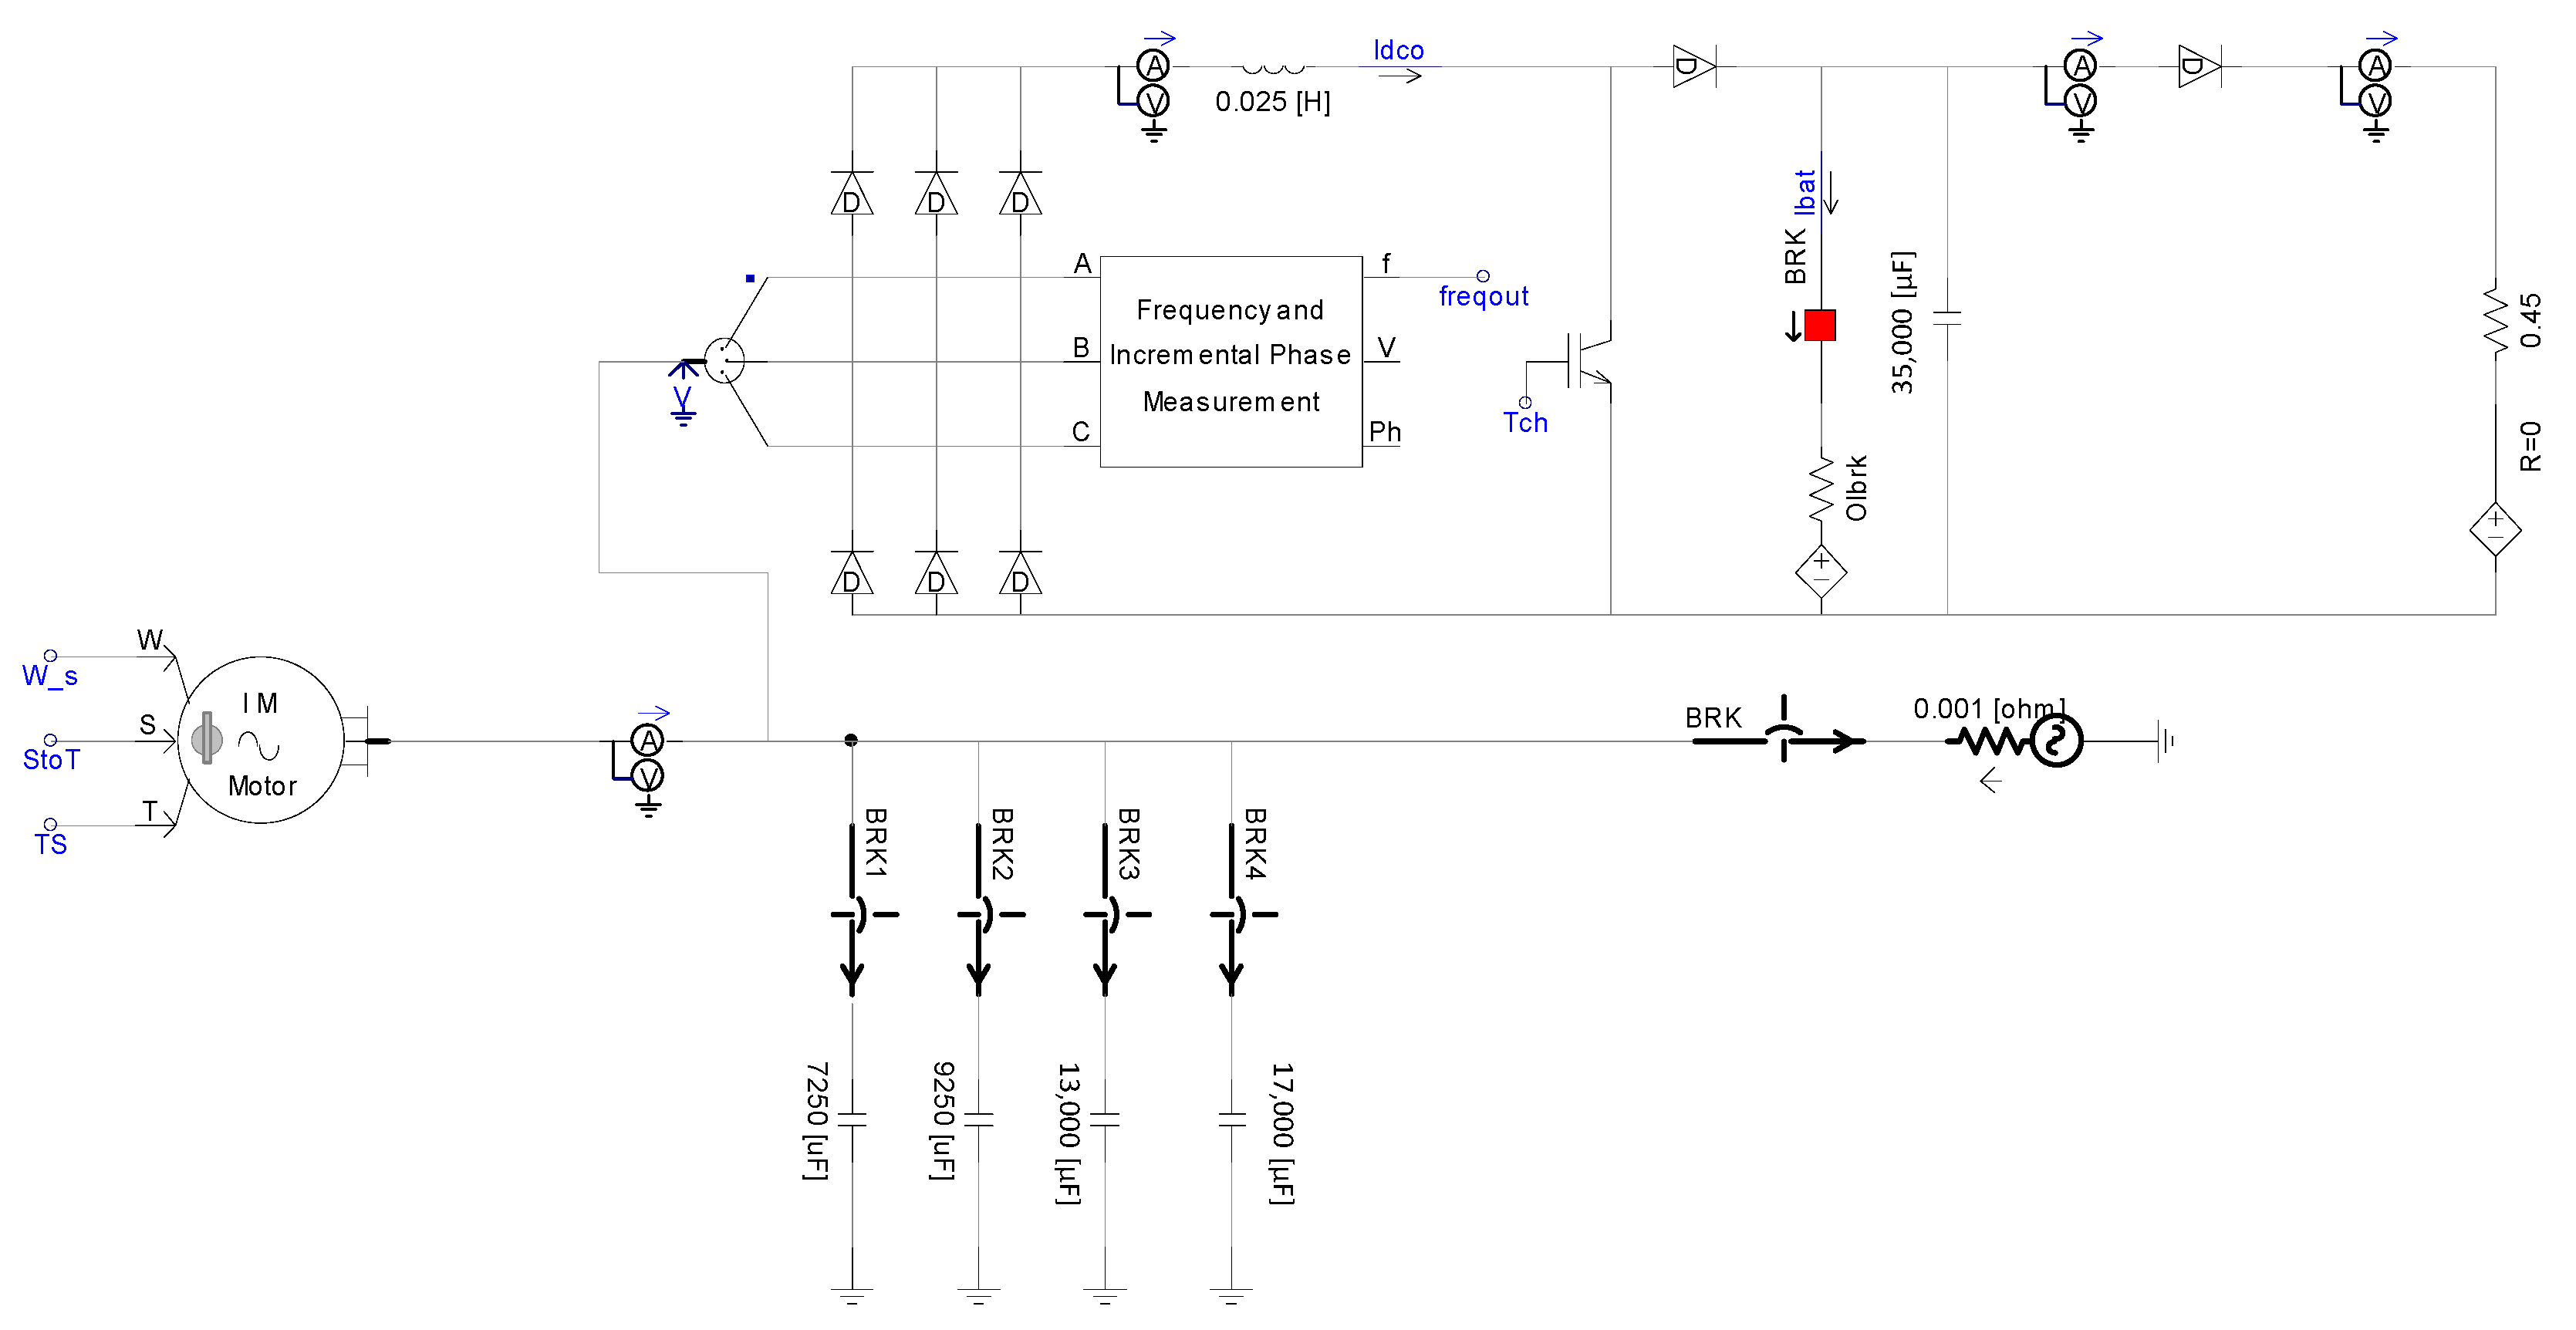
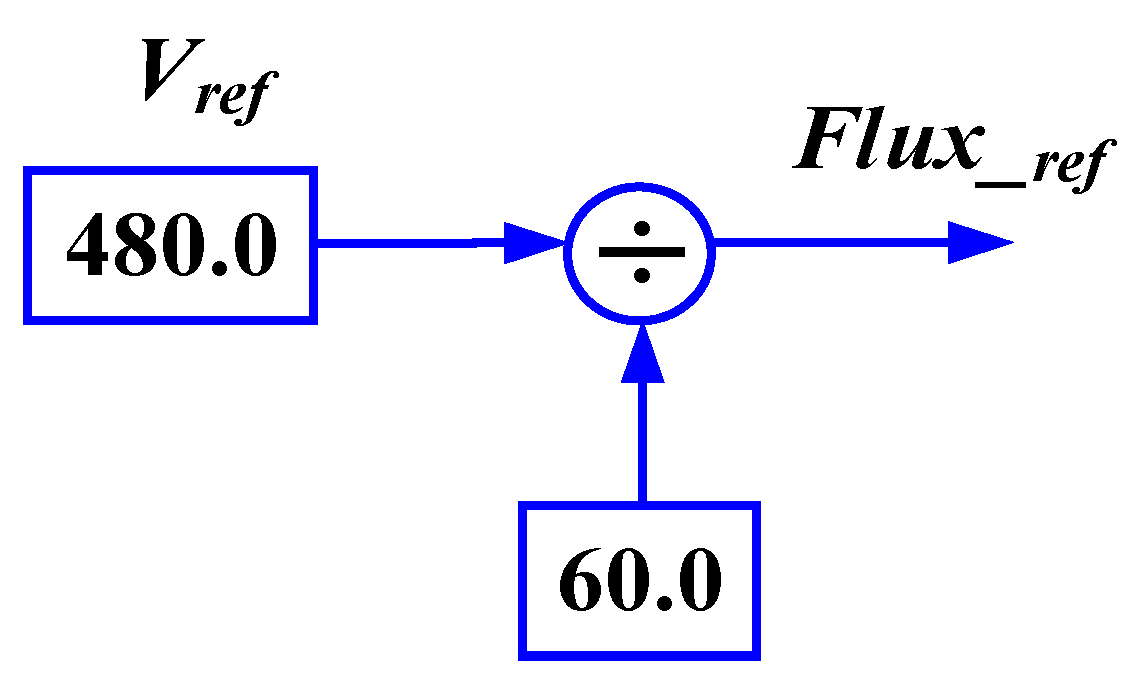
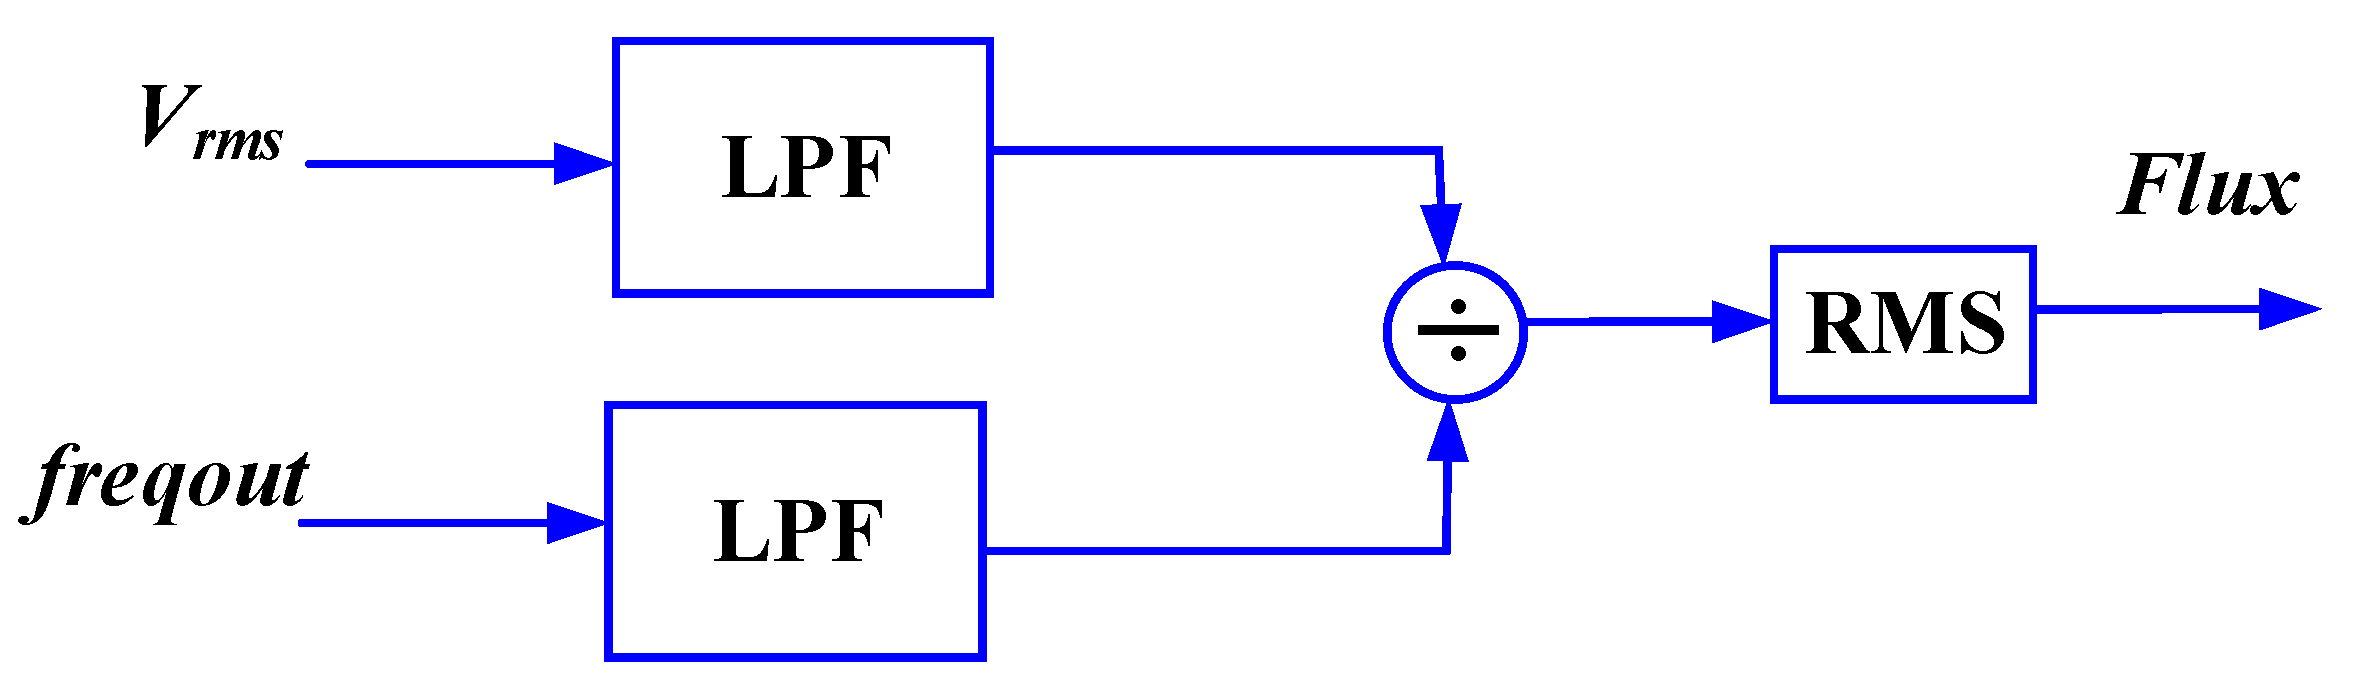
According to the analysis in Section 2, the series capacitor could be placed. However, in Figure 8 and Figure 9, the ratio of Cs/Cp is above 45, which means most likely that the series capacitor acts as the short circuit during the operation. In addition to this capacitor ratio, the magnetizing saturation curve is seen in Figure 12 from the PSCAD model. In our simulation, the series capacitor compensated for the magnetization losses is not considered, but only the parallel capacitors compensated for the leakage losses are placed, as seen in Figure 13. The reference flux is determined by the reference input voltage (480 V) and the reference frequency (60 Hz), as seen in the block diagram of Figure 14. The actual flux can be estimated from the measured voltage of the generator and the frequency of the three-phase diode rectifier through low pass filters which provide a smoother form of the signals, removing short-term fluctuations, as shown in the block diagram of Figure 15. The actual flux should follow through the reference flux during the system operation.
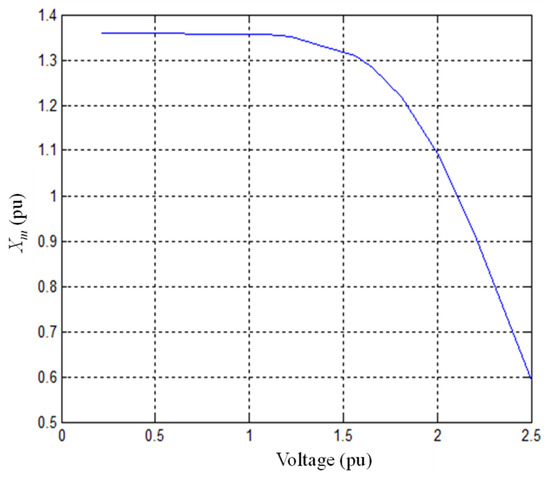
Figure 12.
Magnetization curve.
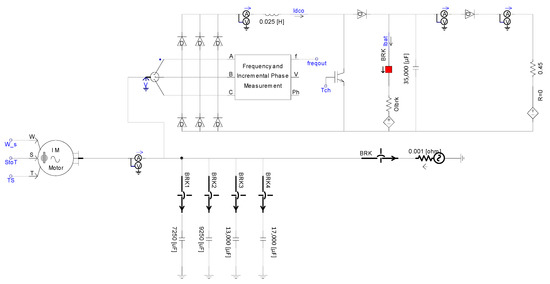
Figure 13.
Overall system configuration with an electrolyzer.

Figure 14.
Reference flux estimator.
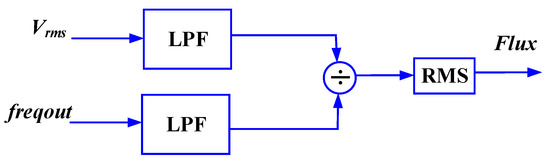
Figure 15.
Flux estimator.
The relationship between the magnetizing reactance, Xm, and the air gap voltage, E, with the operating frequency of 60 Hz is given in Figure 13 from the SEIG open- and short-circuit tests. It is shown that the value of Xm decreases as the inductor generator saturates in which the based RMS phase voltage is set to 277 V, and its base RMS current is set to 10 A.
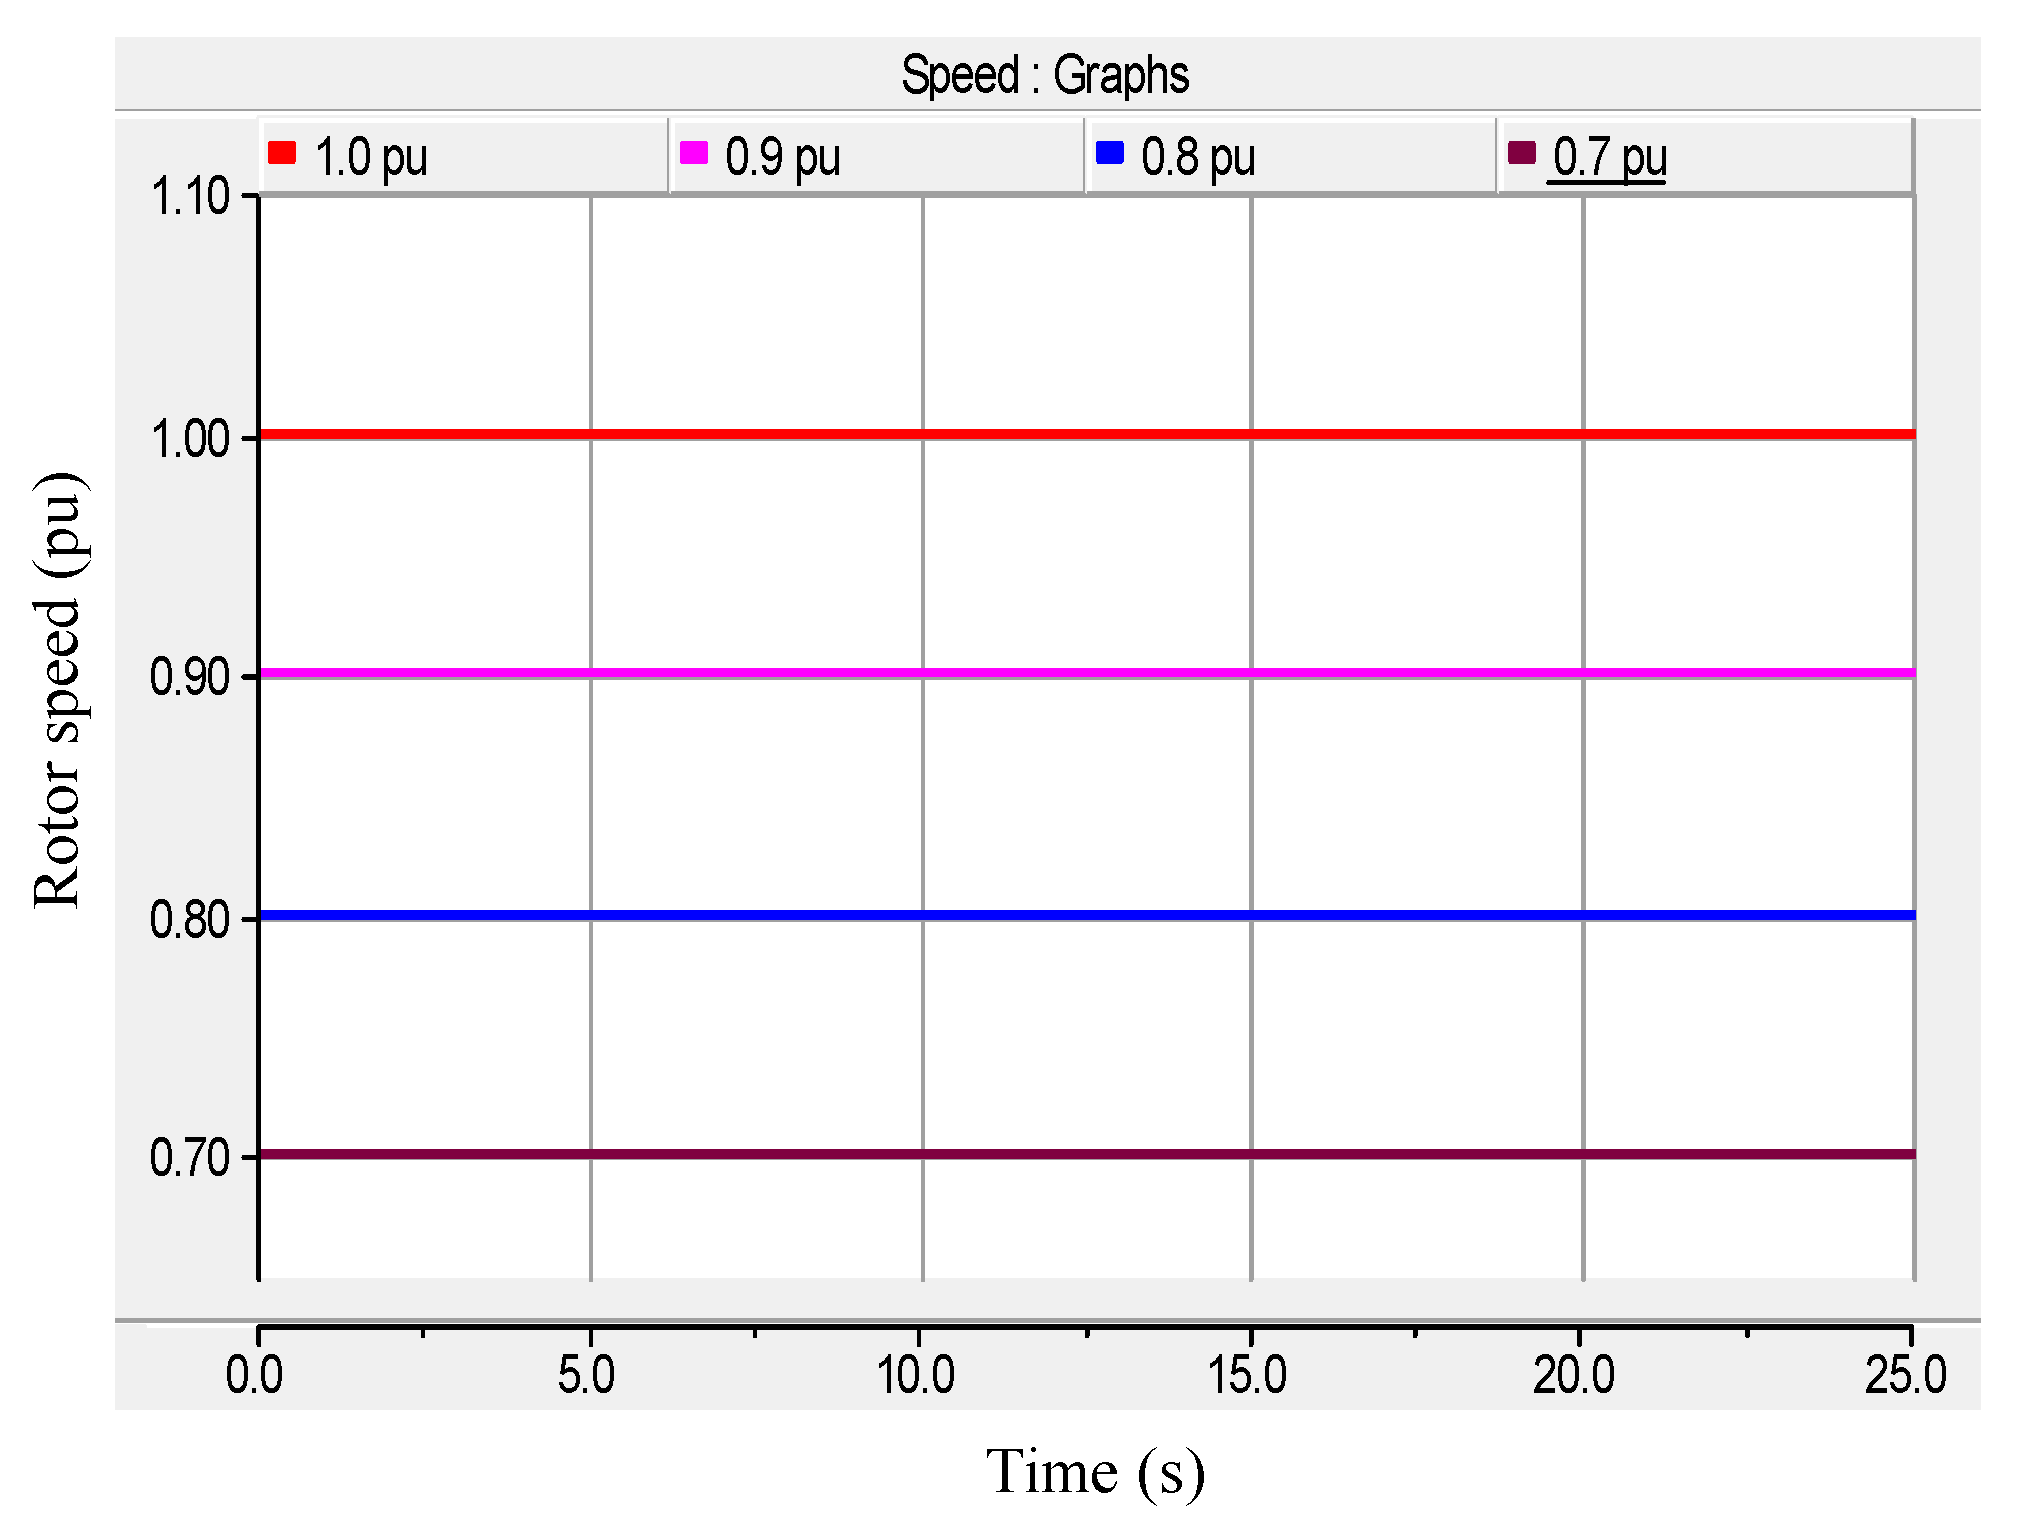
Each parallel capacitor for the excitation is determined by a different constant rotor speed test—1.0 pu, 0.9 pu, 0.8 pu, and 0.7 pu—as seen in Table 3 and illustrated in Figure 16. Due to the inaccurate magnetizing saturation curve in the induction machine model in the PSCAD library, the capacitor values are not matched with the theoretical calculations. Although the increasing trend of the capacitance is the same as Figure 9, the lower the rotor speed, the higher the capacitor value needed.
Table 3.
Parallel capacitor.
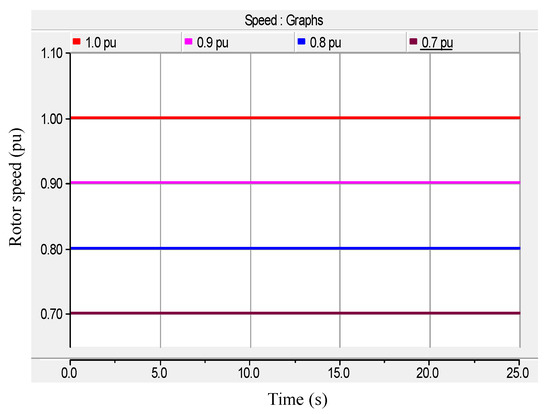
Figure 16.
Rotor speed variation.
The steady-state analysis of the SEIG is quite involved as the generator operates at varying saturation levels determined by the capacitance and speed, which alters both the magnetization reactance and operating frequency. Due to low residual flux, the generator’s core is unsaturated; however, this gradually increases owing to the connection of capacitors that drives the core to saturation as per the magnetization curve. Thus, the magnetization curve of the generator is central to the analysis and accurate data are required to be obtained by design or test. Here, in Figure 12, the magnetization curve is the variation of the generator’s air gap voltage, referred to as the base frequency with the magnetization reactance. The magnetizing reactance assumes different values based on the level of saturation determined by the operating voltage or flux.
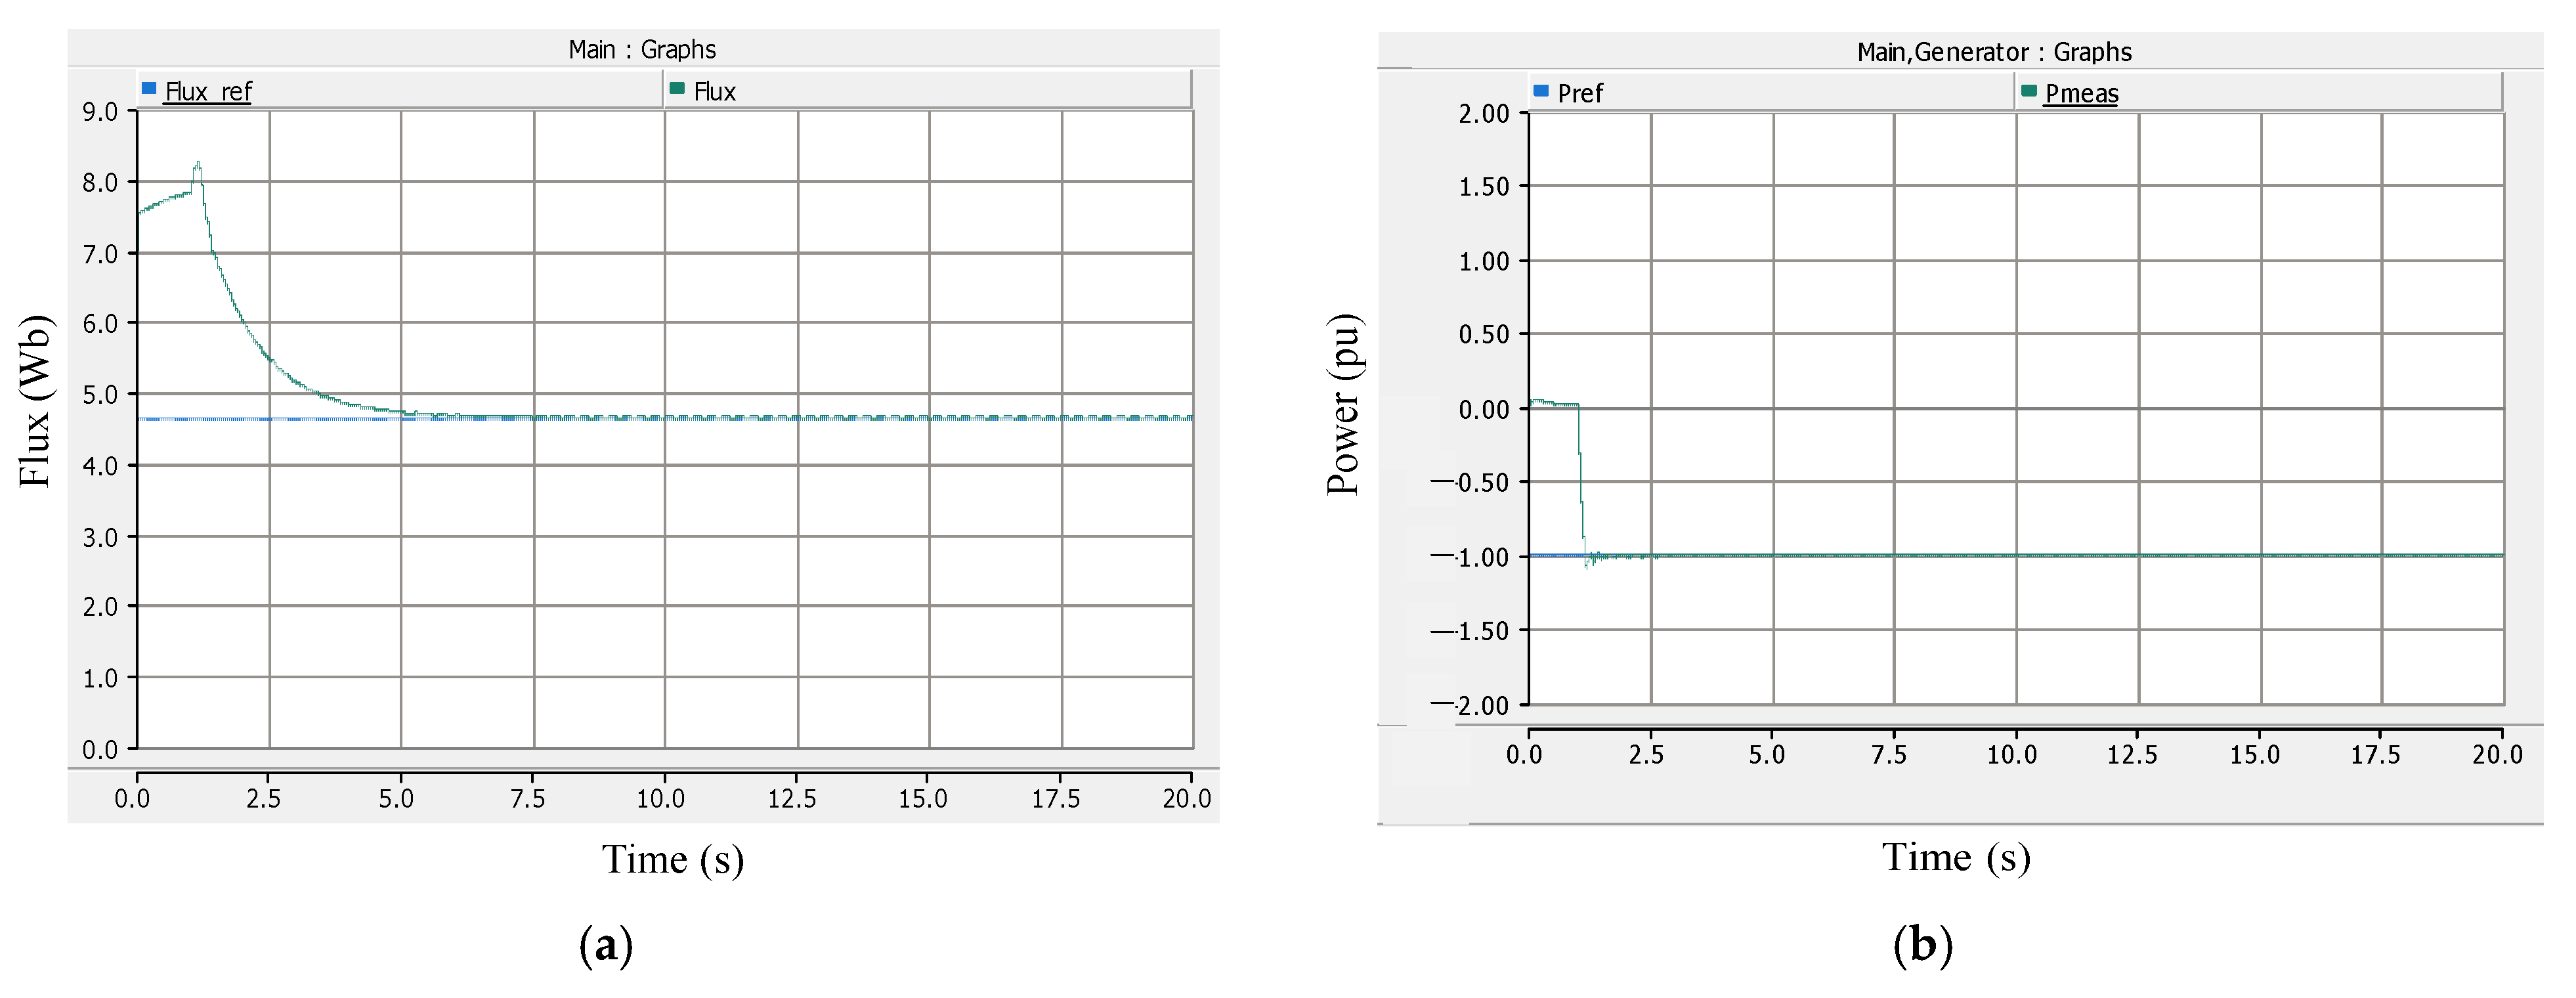
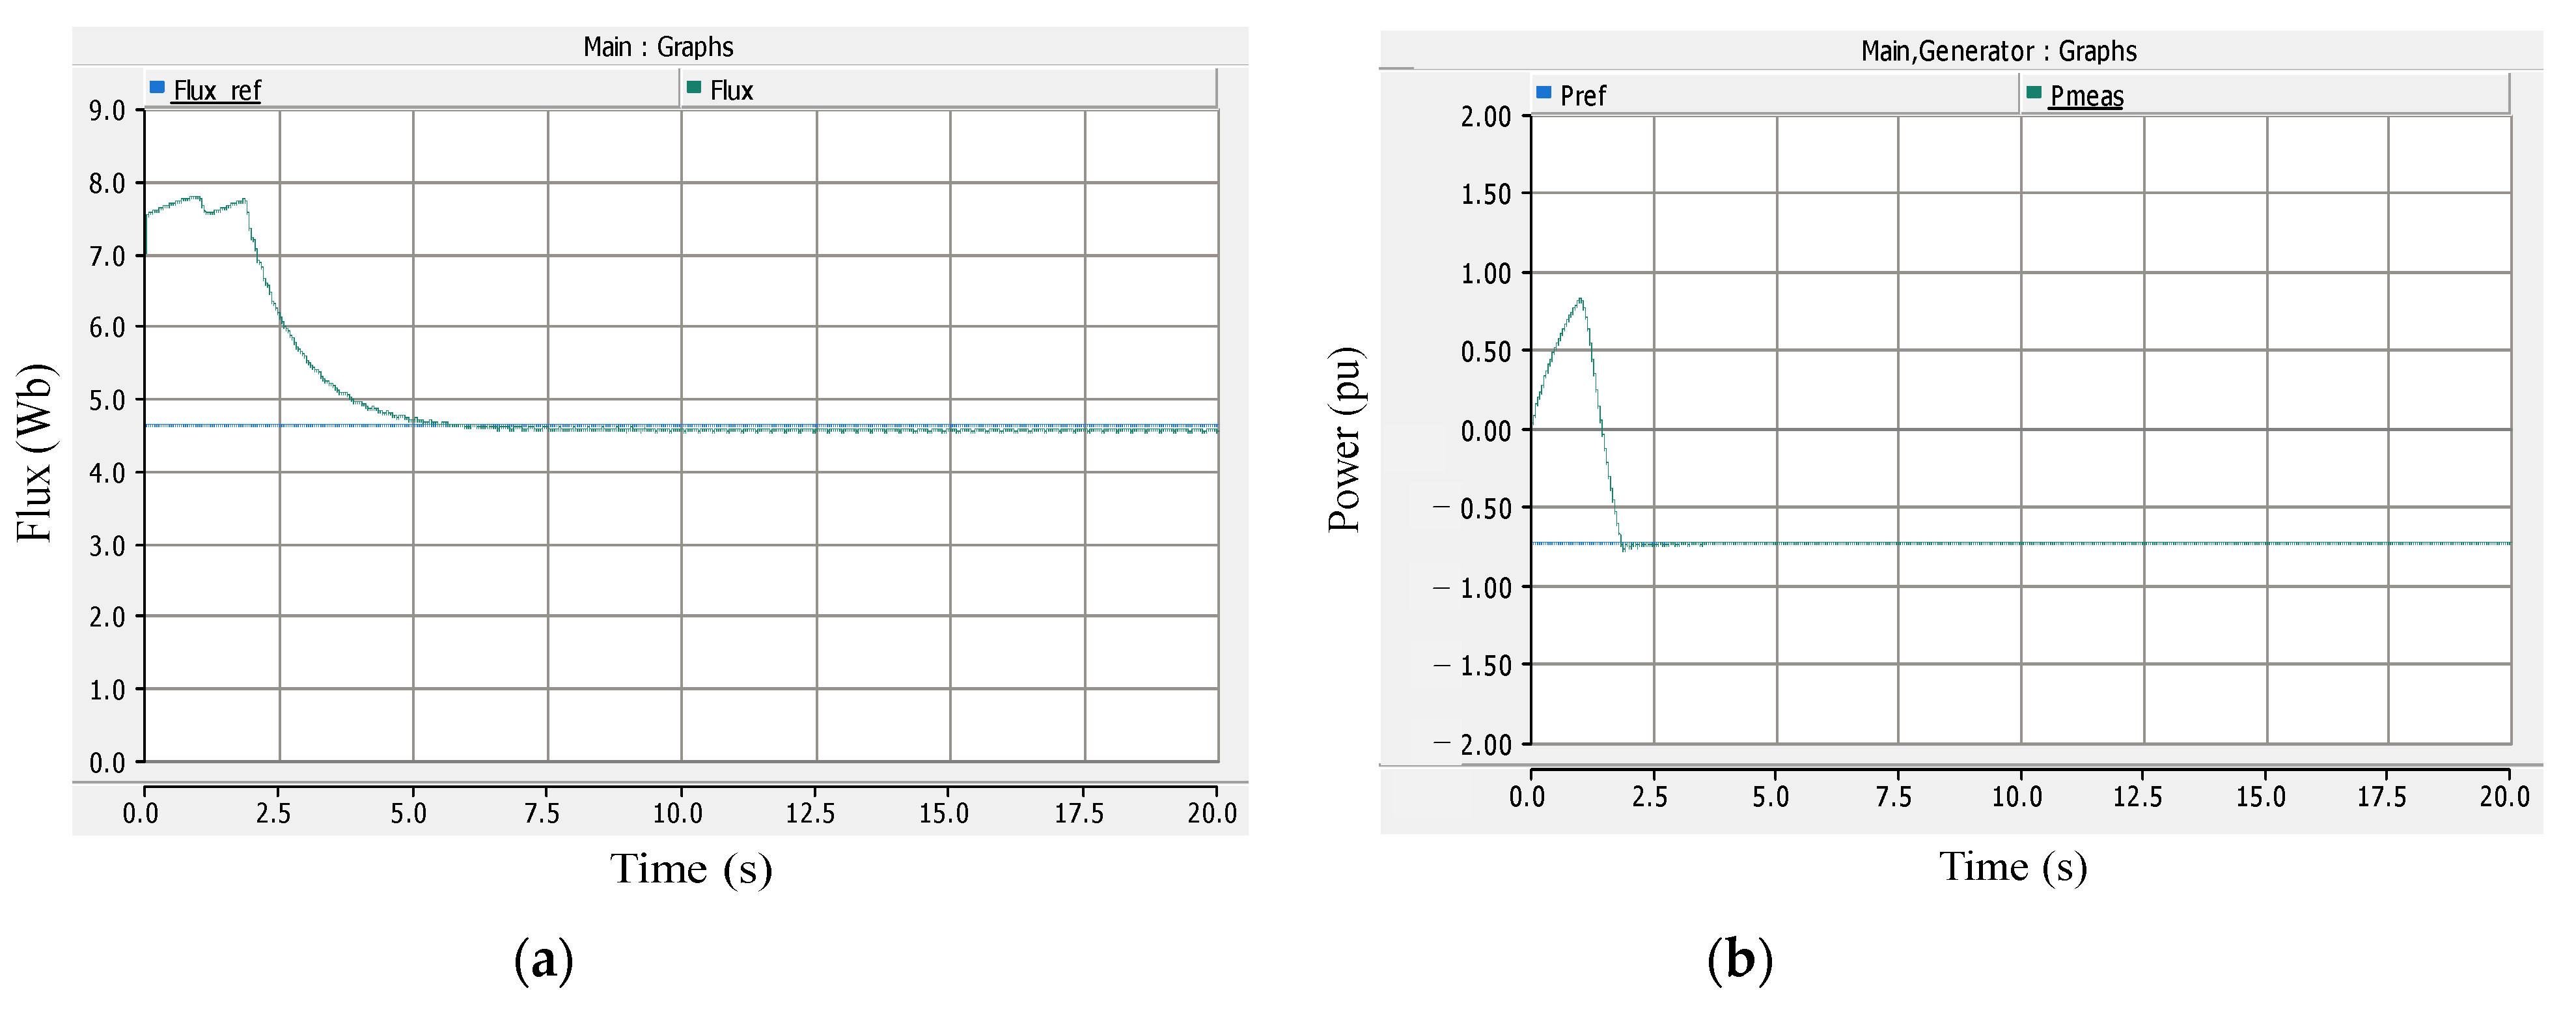
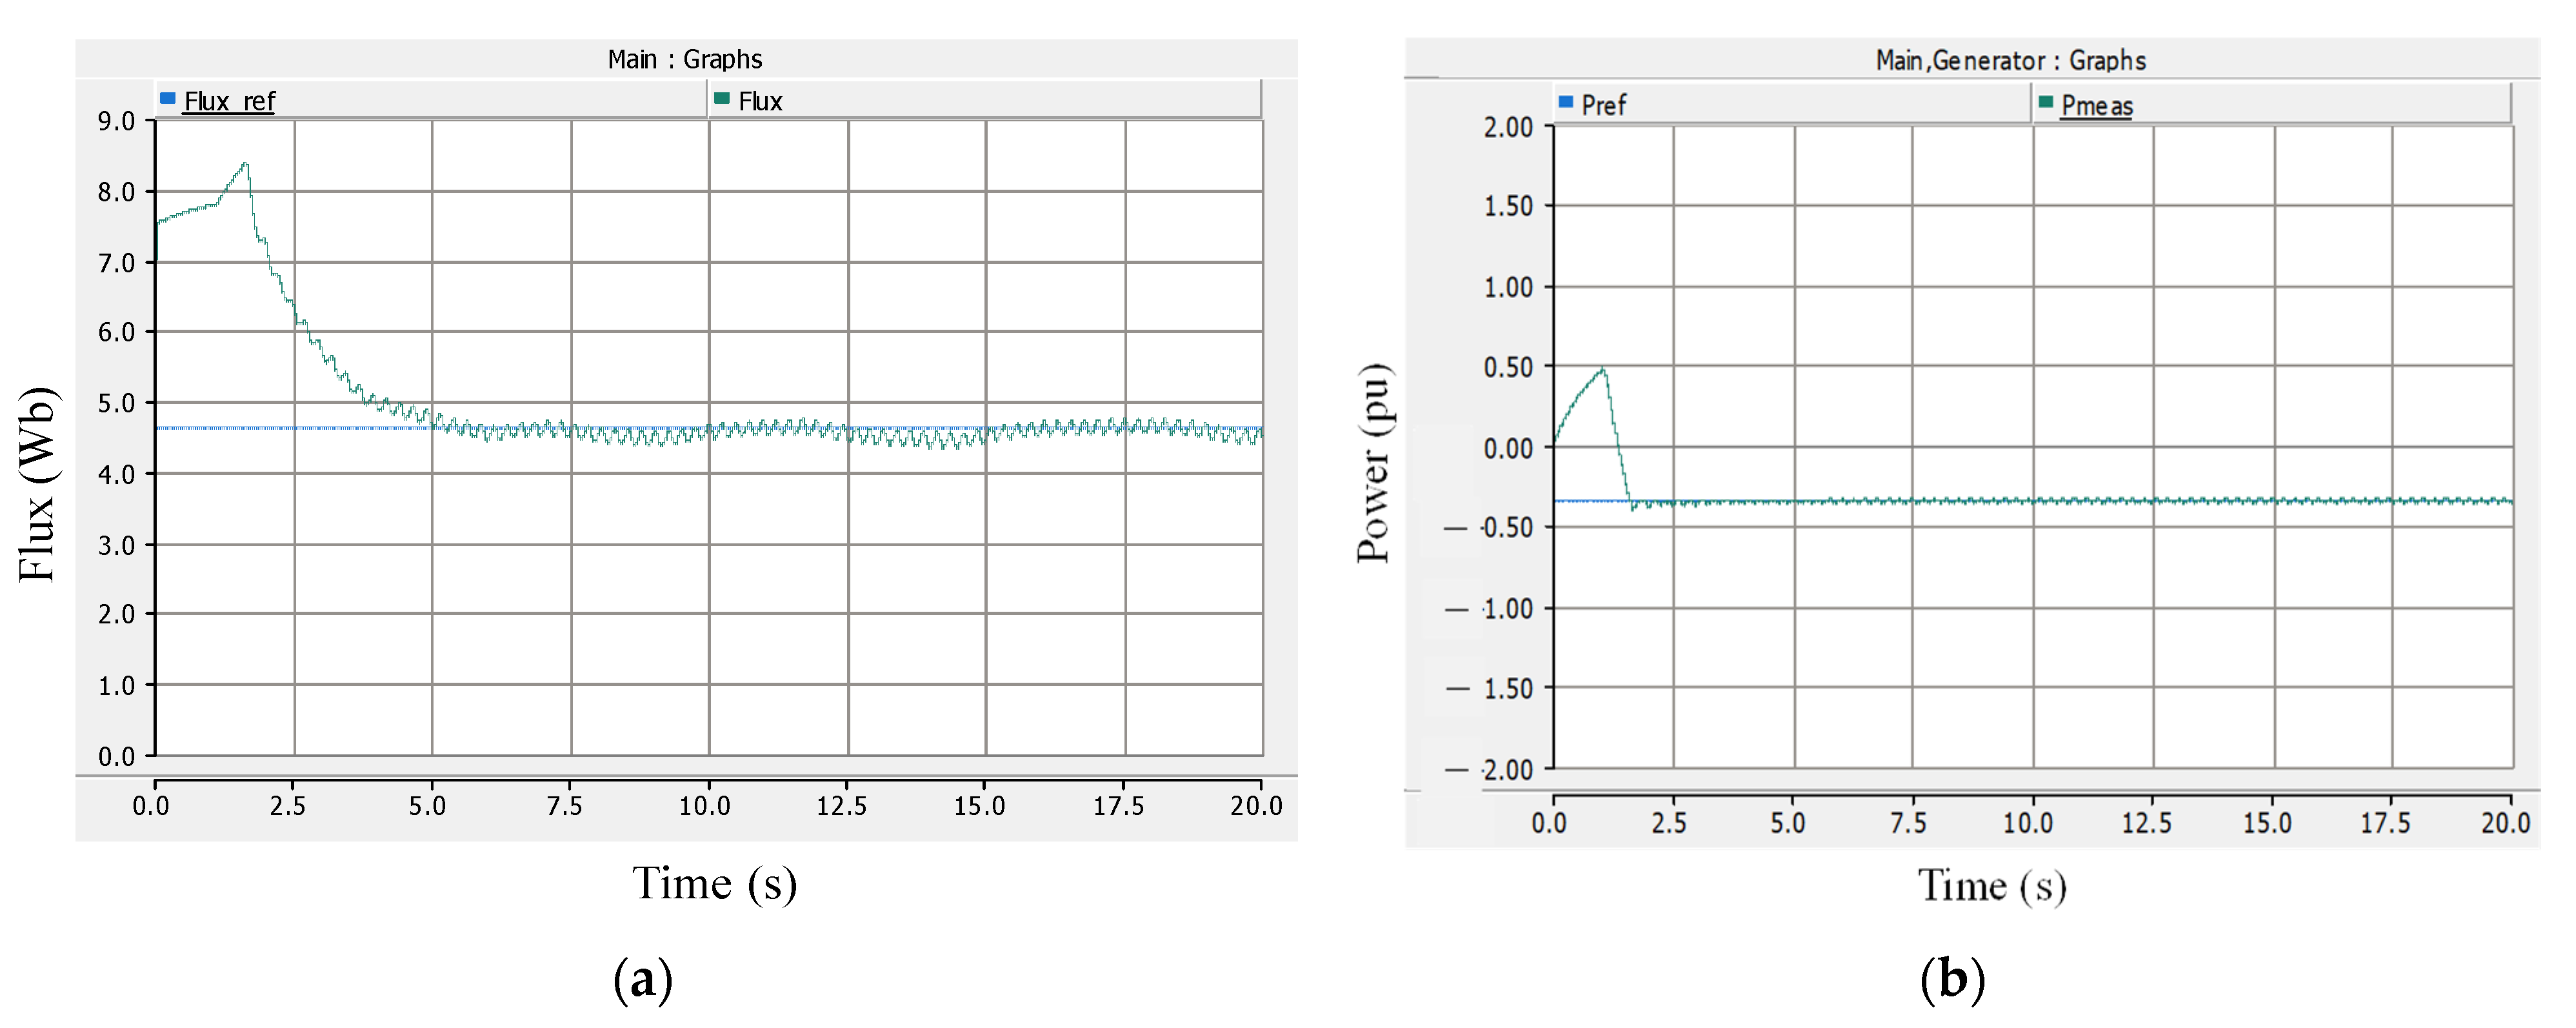
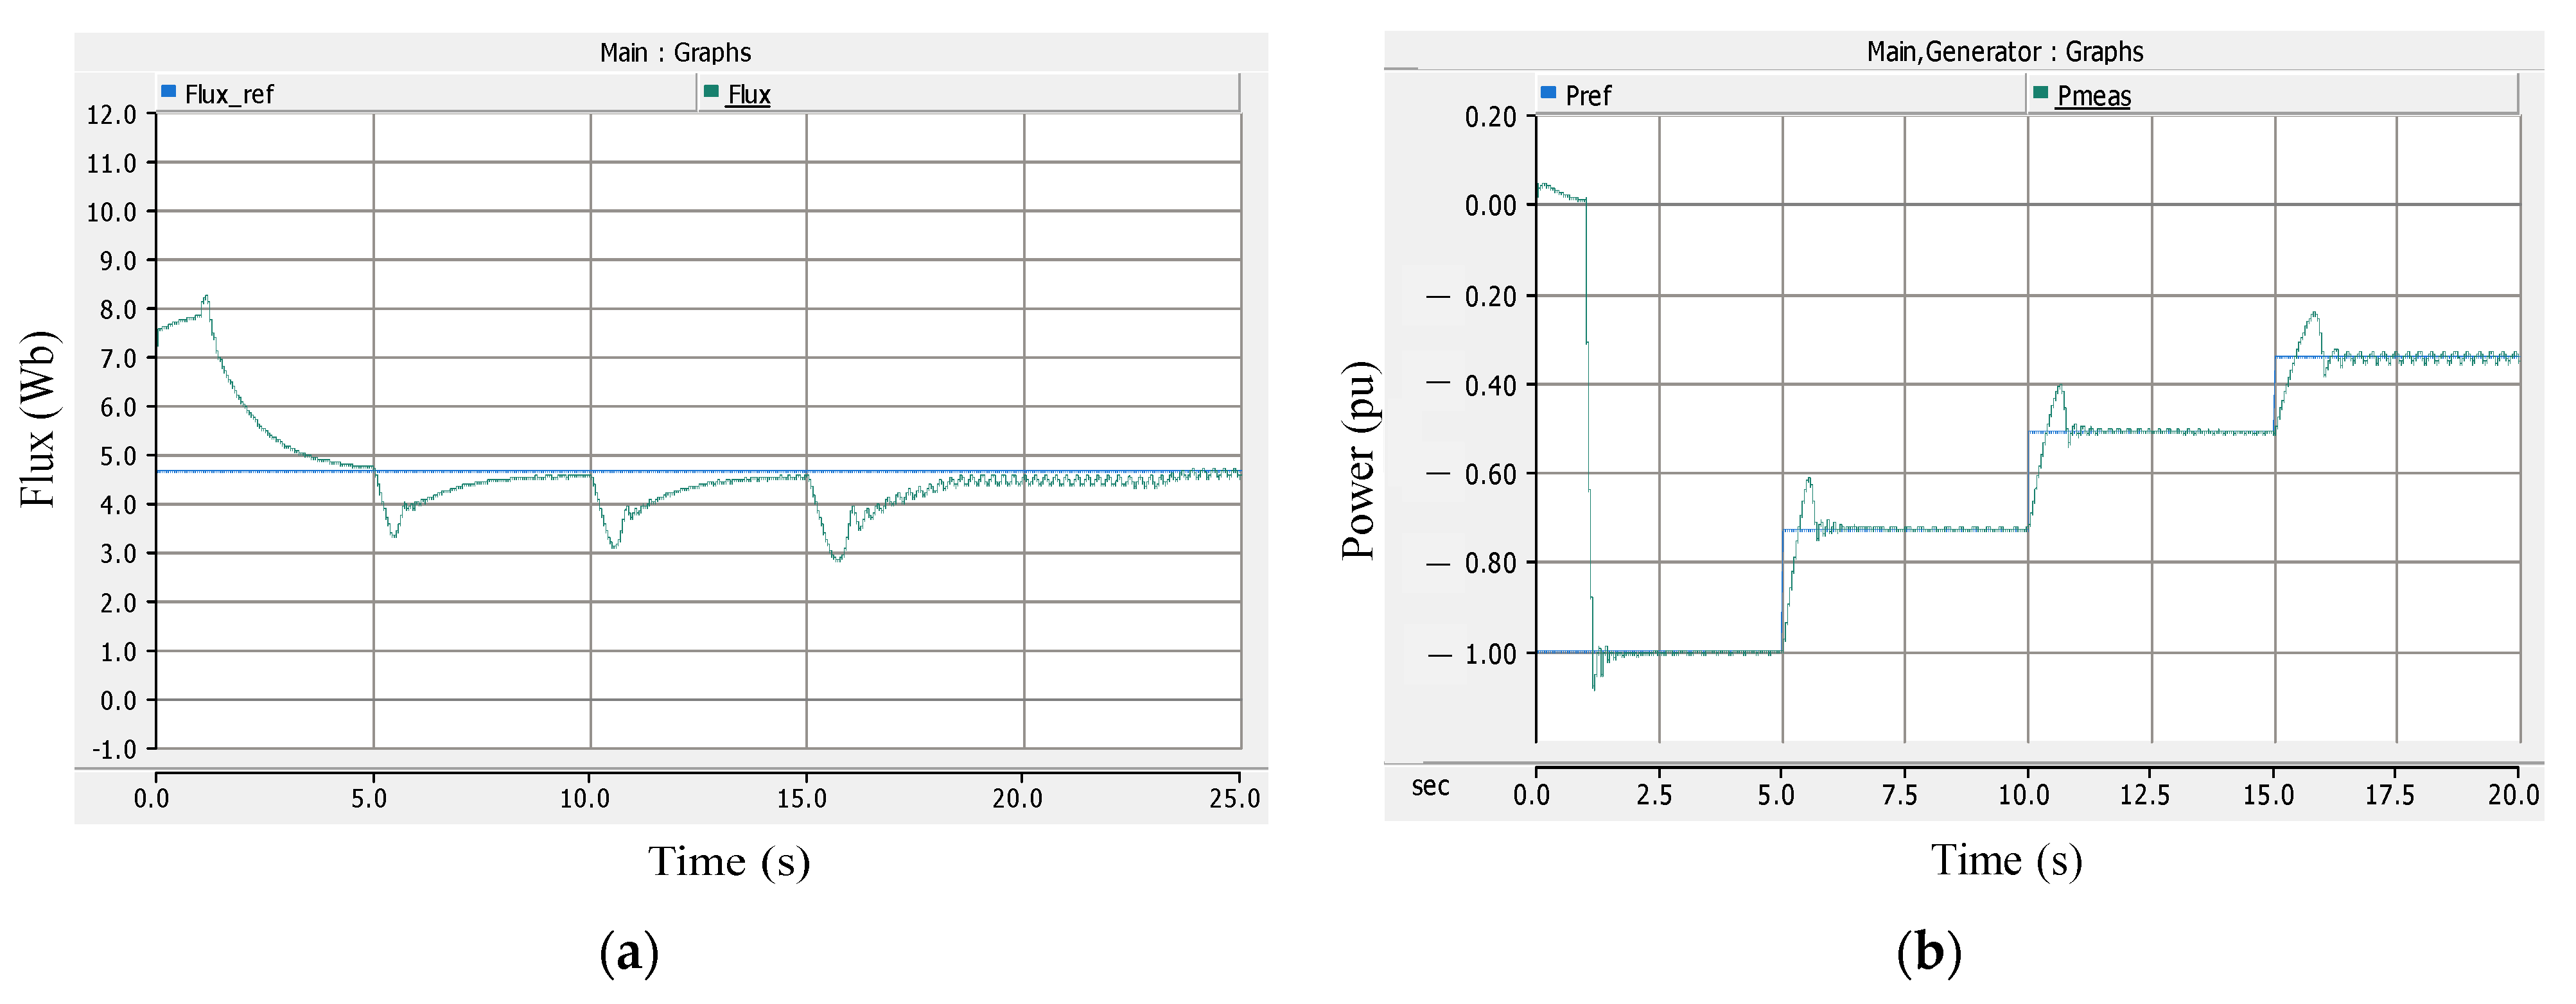
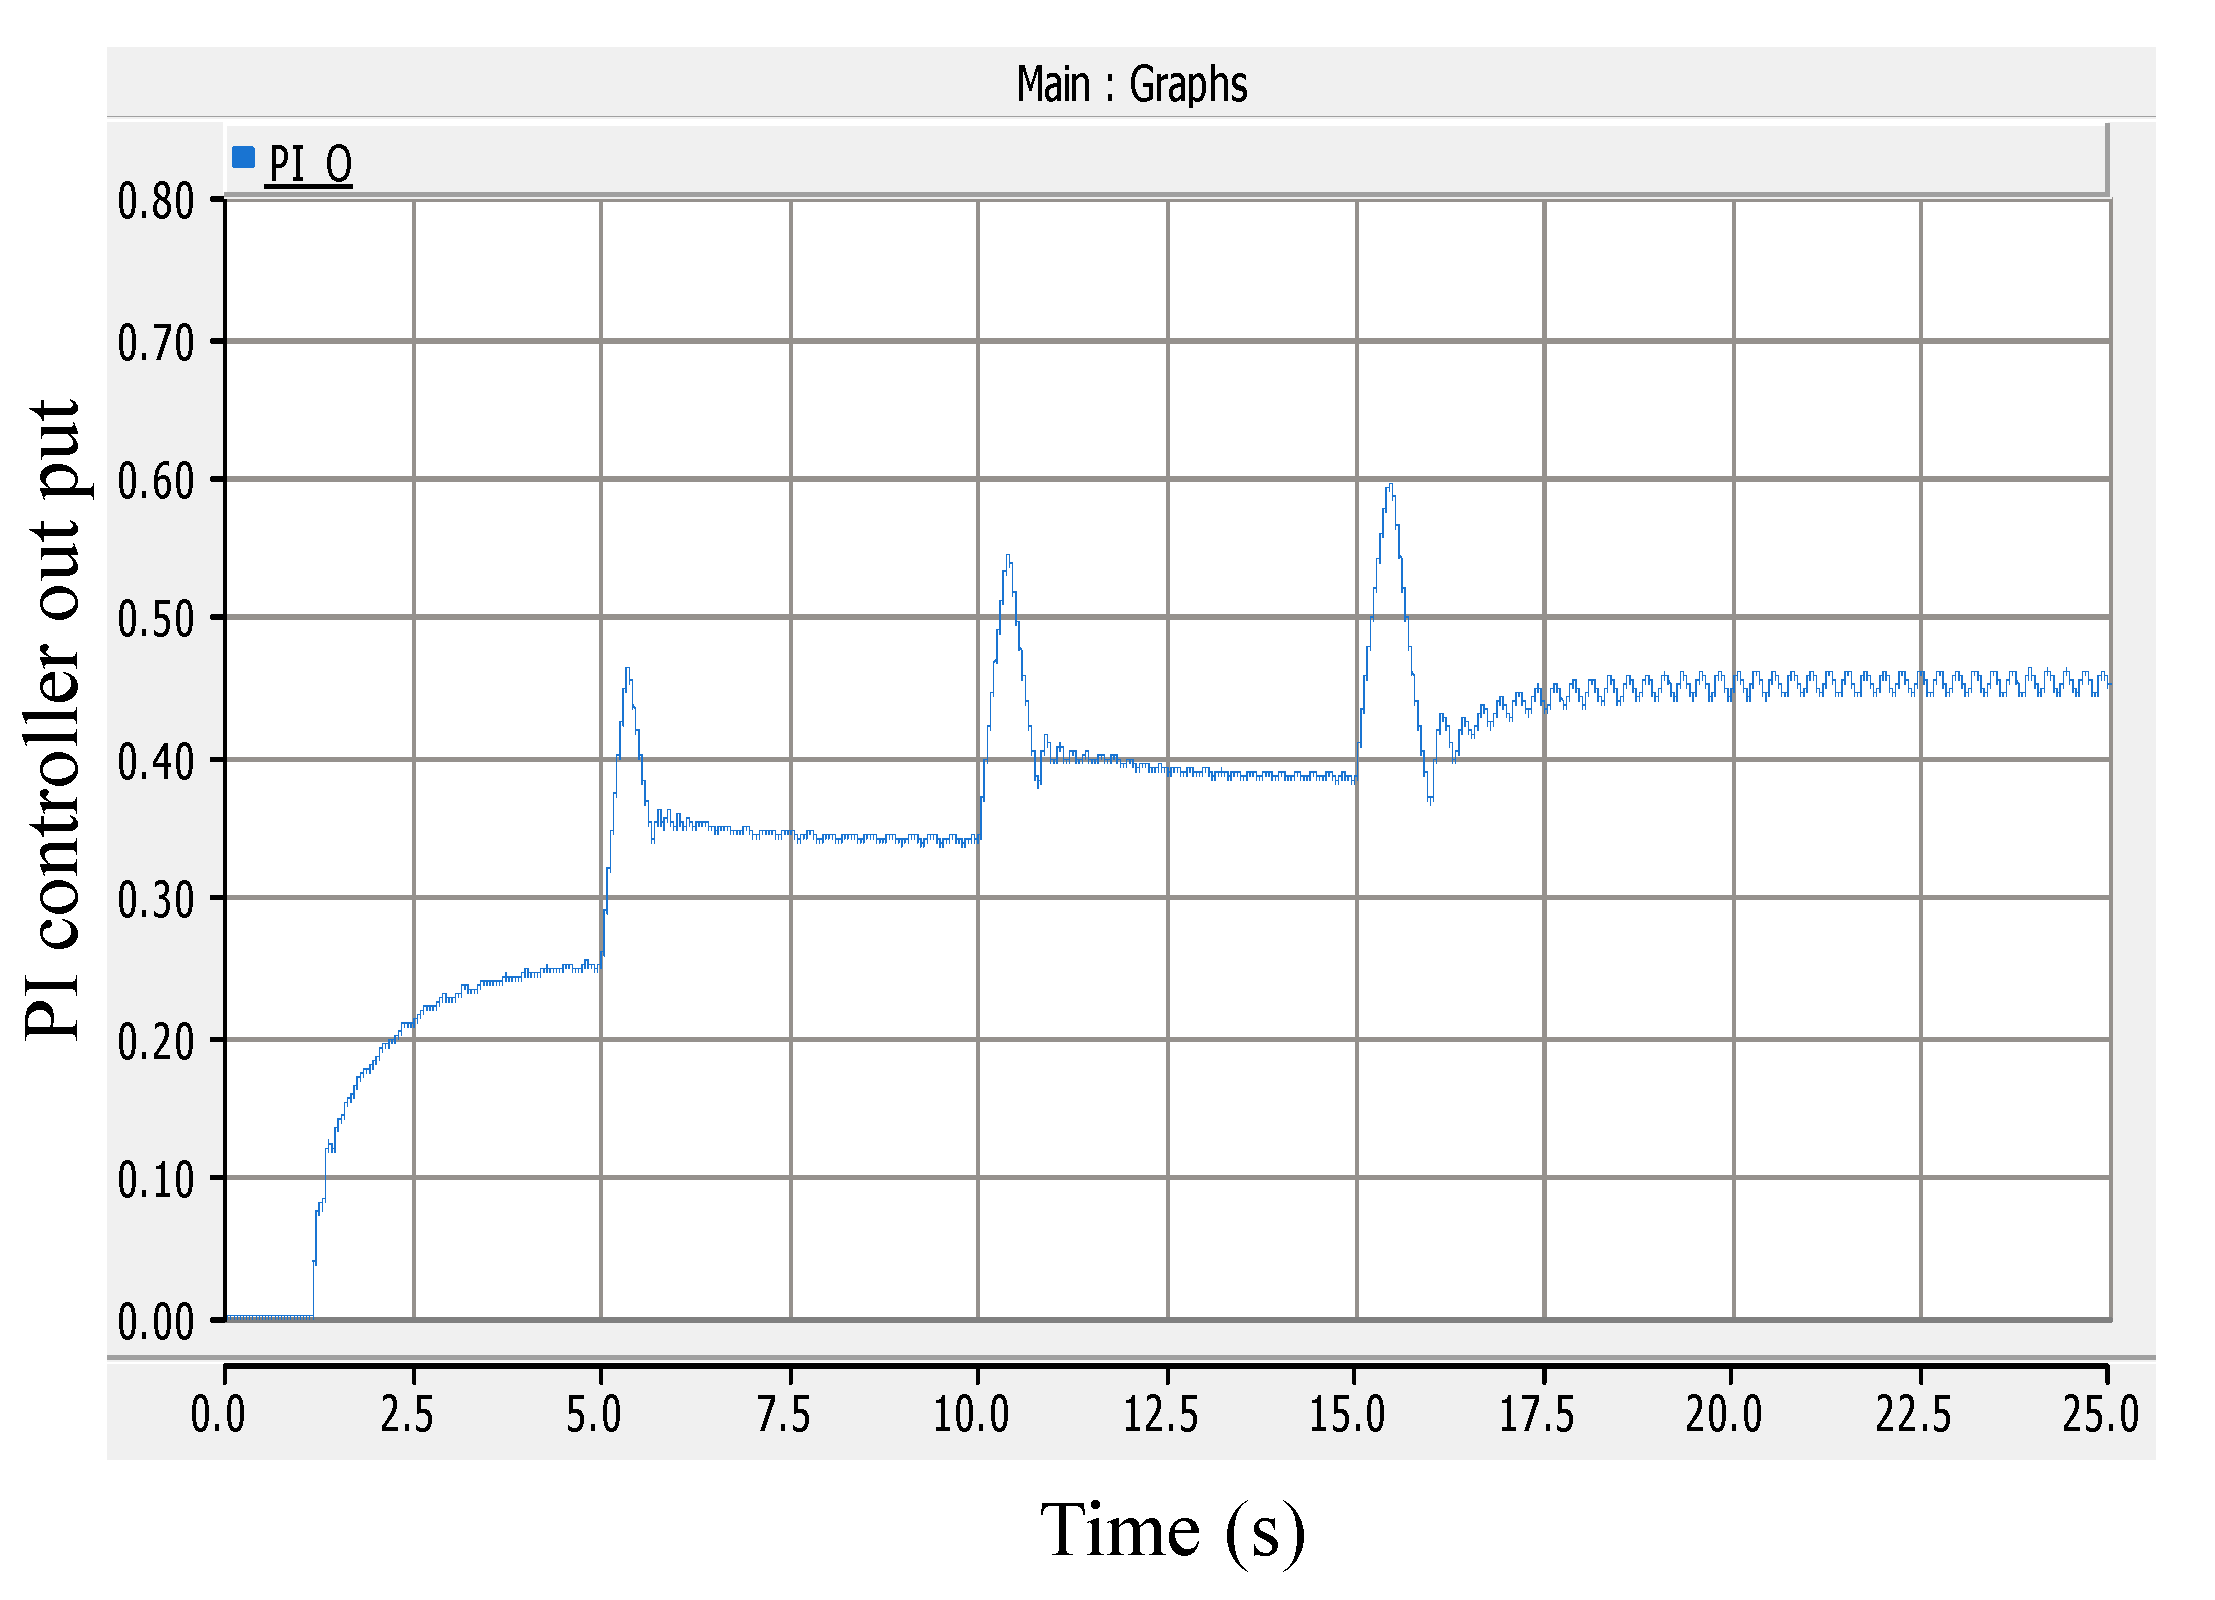
Figure 17, Figure 18, Figure 19, Figure 20 and Figure 21 show the flux control and power control performances at the constant rotor speed cases: 1.0 pu, 0.9 pu, 0.8 pu, and 0.7 pu. As the rotor speed decreases, the control performances are degraded due to the unstable and lack of voltage generation from the SEIG, but it is still controllable with a ripple component caused by PWM switching. From the rotor speed variations in Figure 16, the capacitor values can be changed via switching the breakers seen in Figure 13 based on Table 3 for the flux control, and power also can be controlled via the DC/DC booster converter in Figure 13. The flux is well controlled with a slow time constant, approximately 5 s, due to the nature of the magnetizing saturation characteristics of the SEIG shown in Figure 12, while the power is properly controlled with the limited overshoot and fast transient response, less than 1s, in Figure 17. Figure 22 shows the PI controller output for the power control that is directly related to the duty cycle of the boost converter in Figure 8, increasing up to 45% during the speed variation.
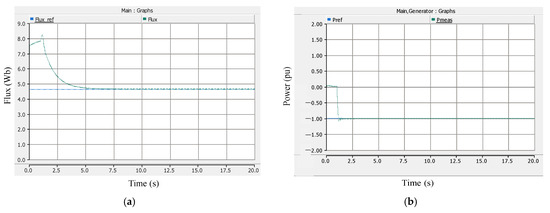
Figure 17.
(a) Flux control; (b) power control at 1.0 pu rotor speed.
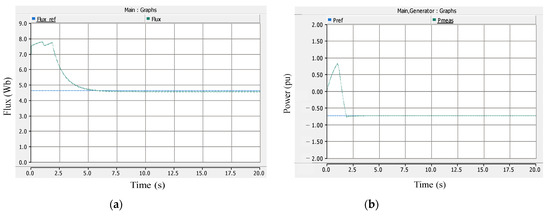
Figure 18.
(a) Flux control; (b) power control at 0.9 pu rotor speed.
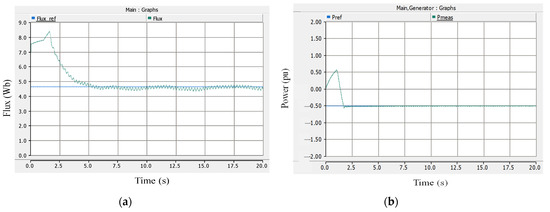
Figure 19.
(a) Flux control; (b) power control at 0.8 pu rotor speed.
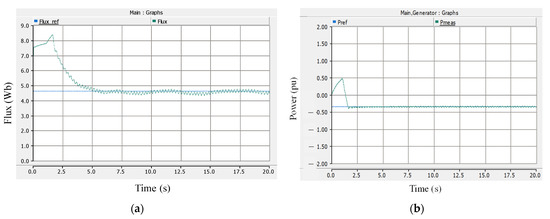
Figure 20.
(a) Flux control; (b) power control at 0.7 pu rotor speed.
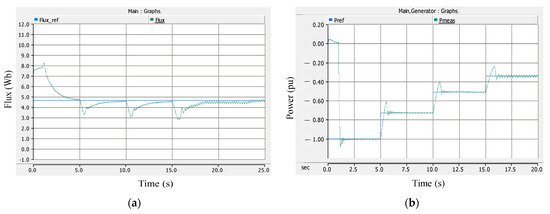
Figure 21.
(a) Flux control; (b) power control during rotor speed variation.

Figure 22.
PI controller output for power control.
Modified System Configuration of the Electrolyzer: Results and Analysis
The simulation results of the modified system configuration are presented in this section. For this circuit, three different cases for wind speed values are considered and power supplied or disconnected from the power source. The cases implemented are expressed as:
- Case I: SEIG speed of 1.01 pu and source breaker opened at 1.5 s.
- Case II: SEIG speed of 0.9 pu and source breaker opened at 10 s.
- Case III: SEIG low speed of 0.5 pu with source breaker closed throughout system operation.
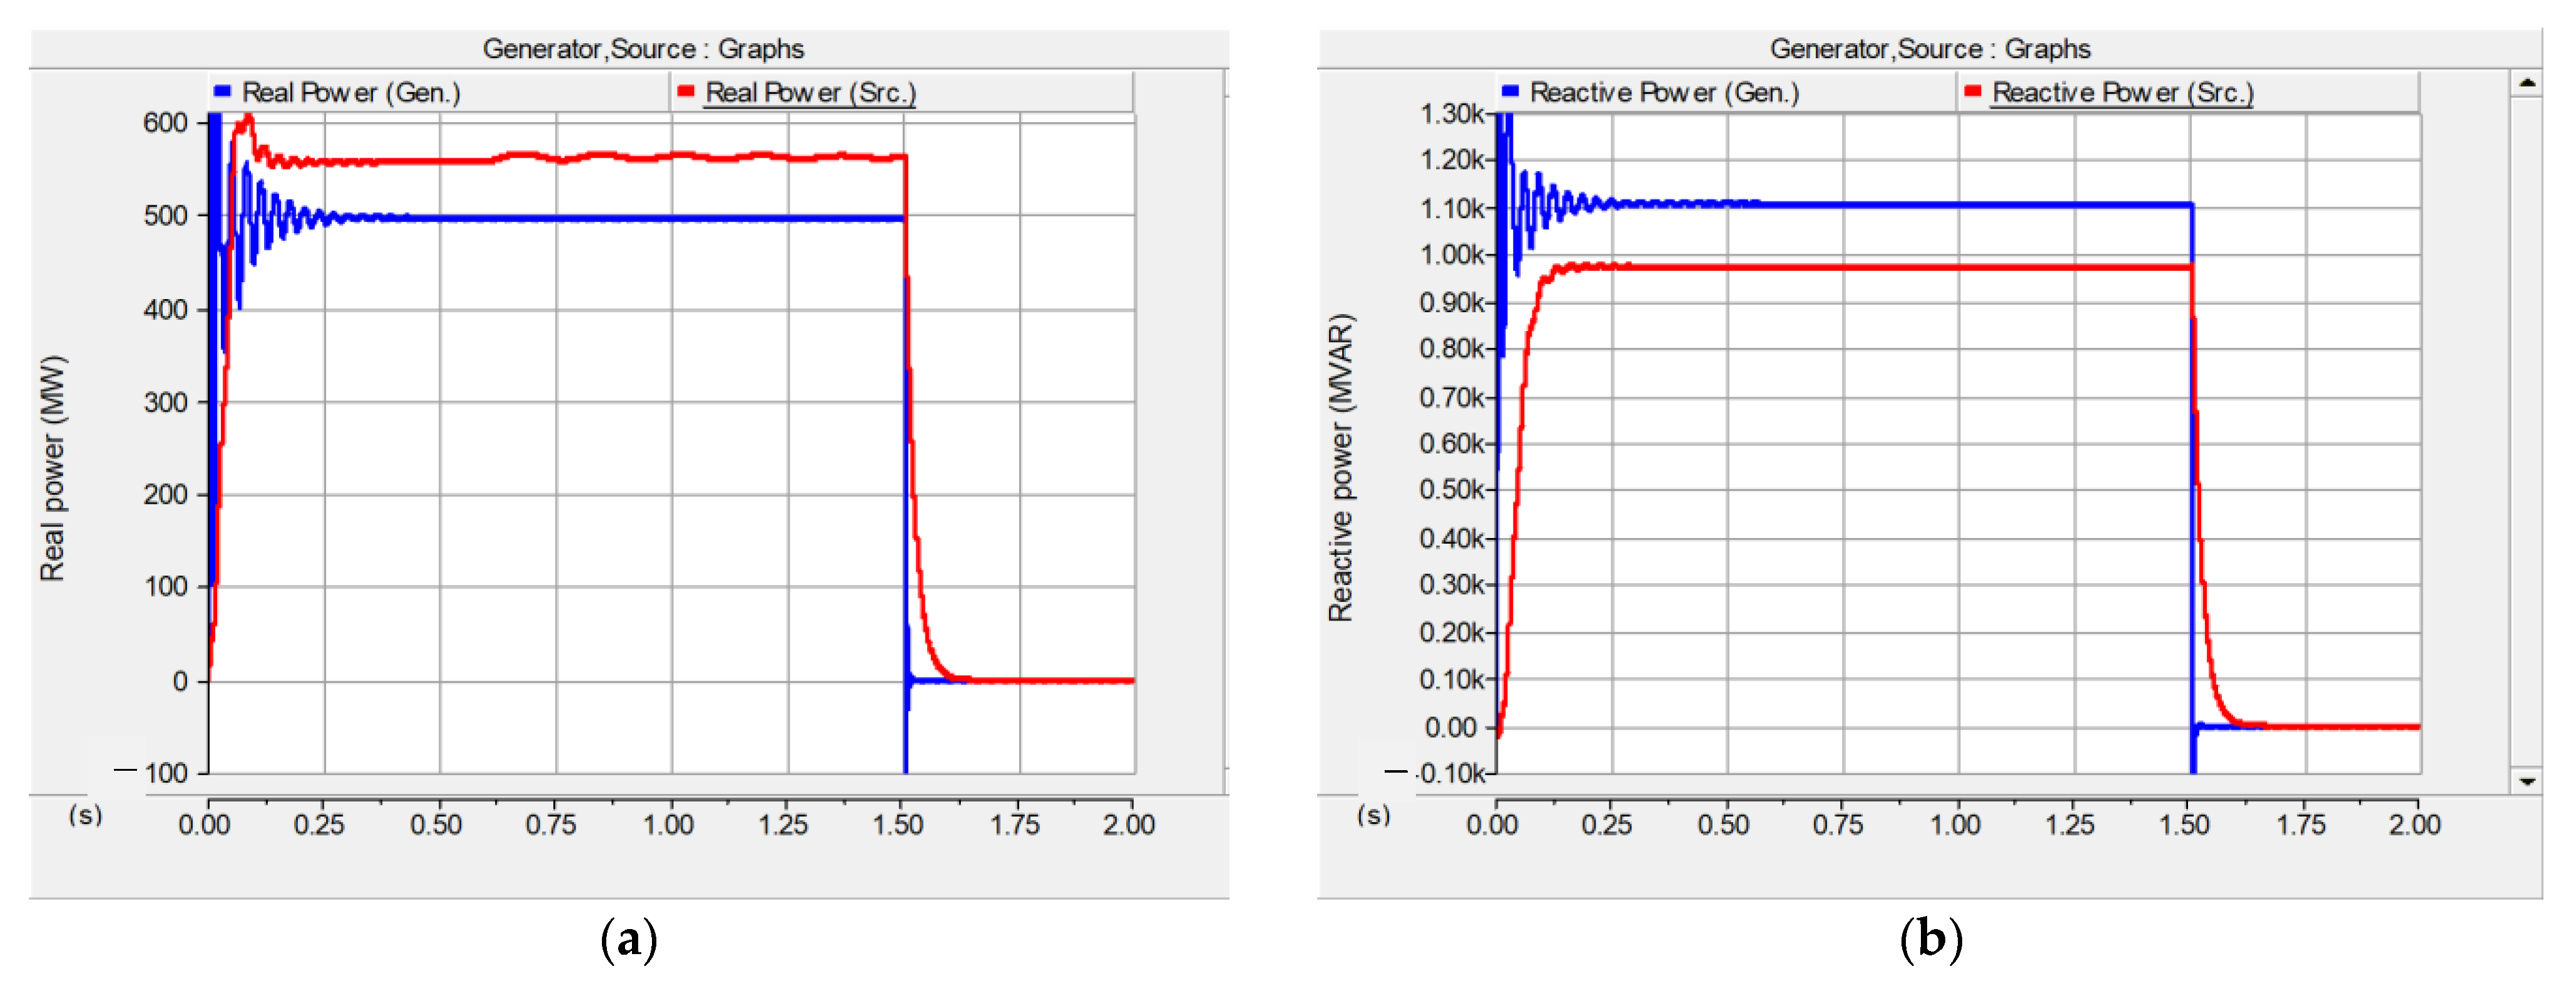
Case I: SEIG speed of 1.01 pu and source breaker opened at 1.5 s
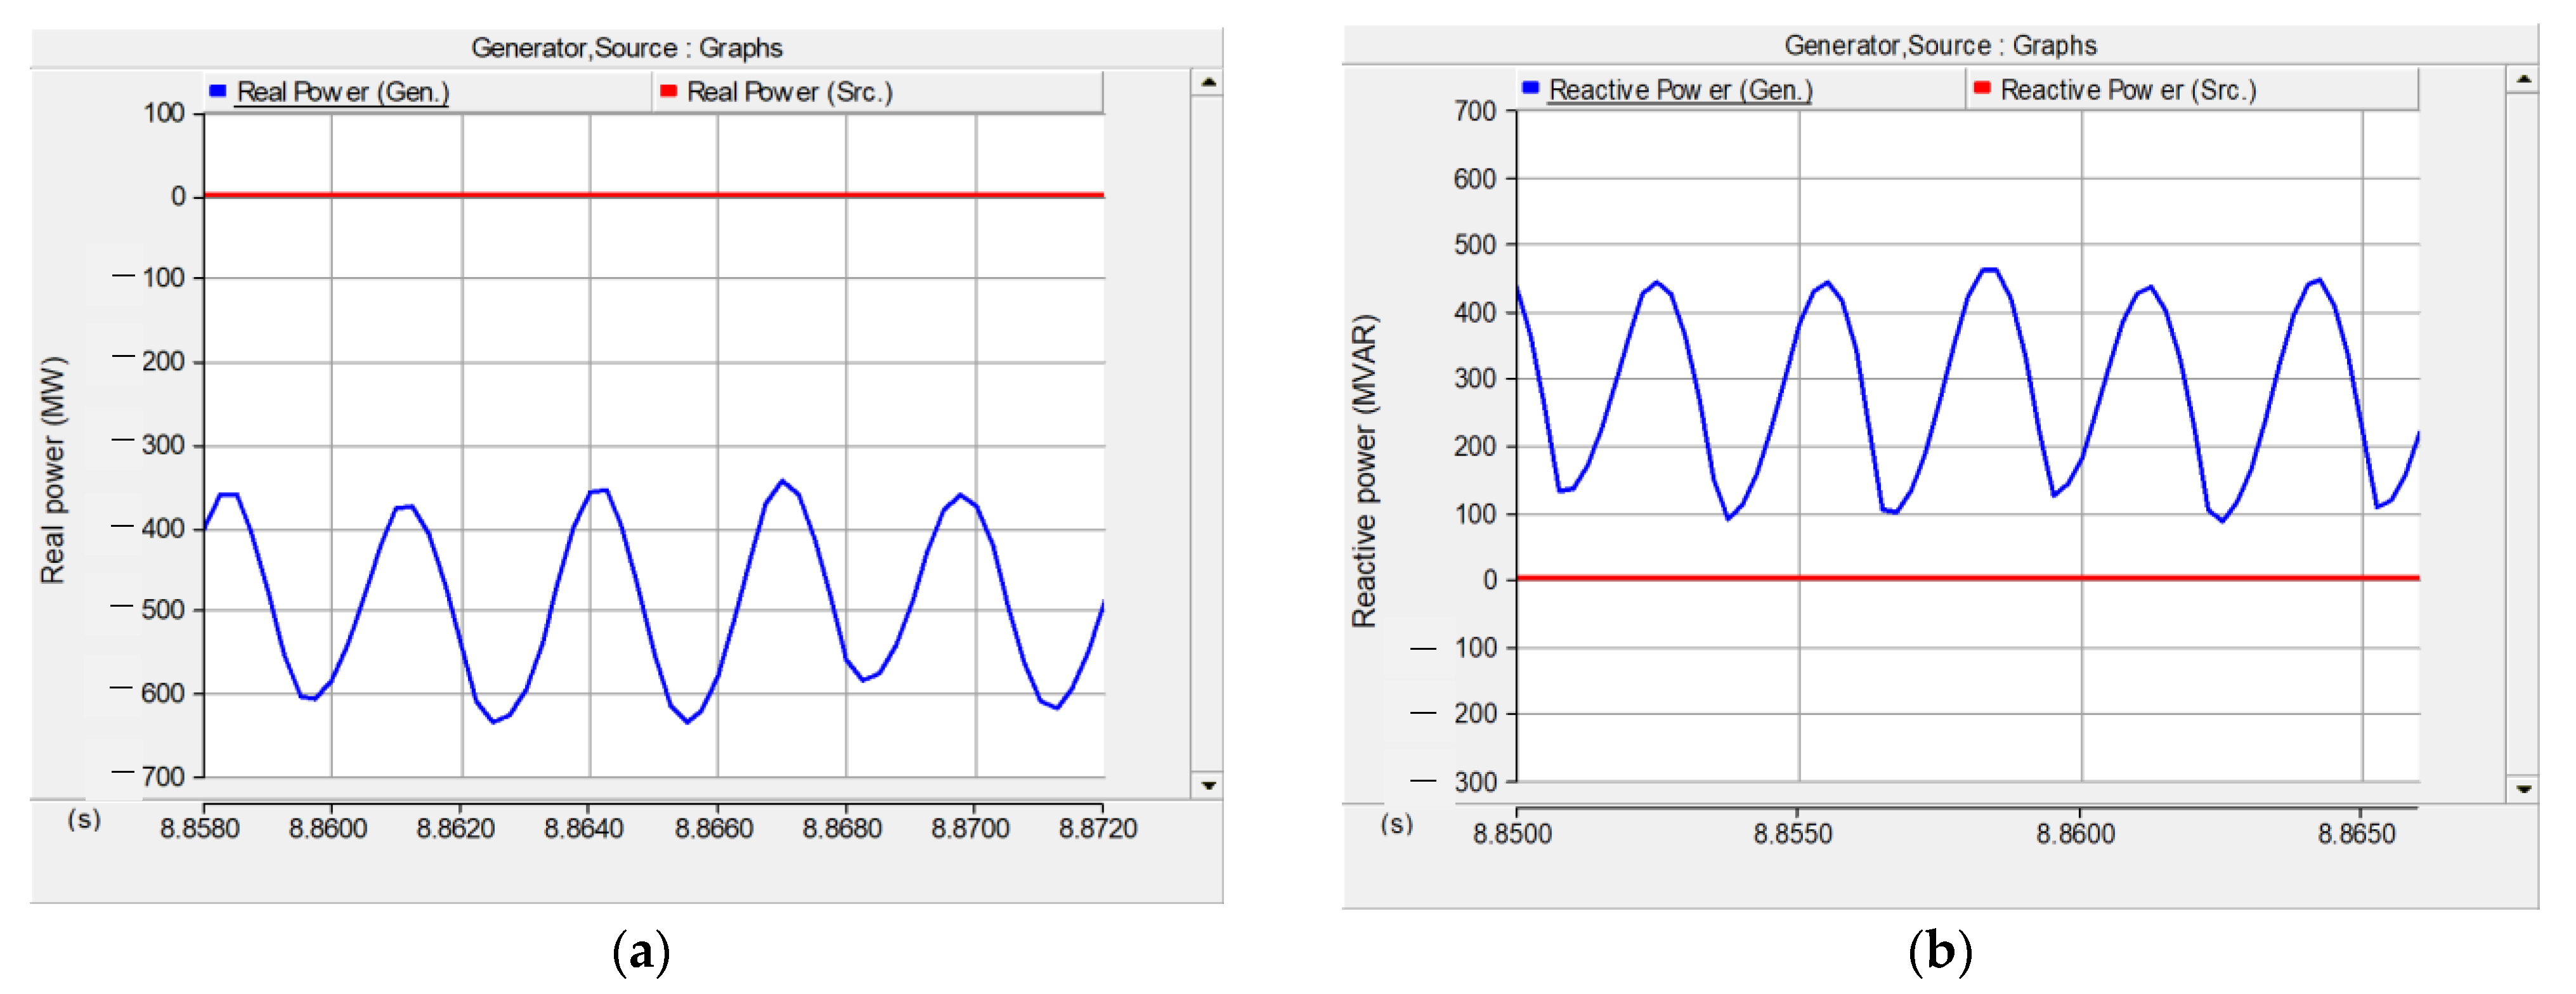
This section shows the simulation graphs for the first case. Figure 23 shows the real and reactive powers delivered from the SEIG and source. It can be seen from the real power graph that the SEIG fully supplies real and reactive powers to the electrolyzer circuit when the source is disconnected from the system as a result of the breaker action at 1.5 s, and the source power becomes zero.
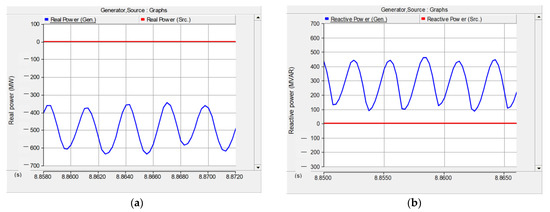
Figure 23.
(a) Real power; (b) reactive power.
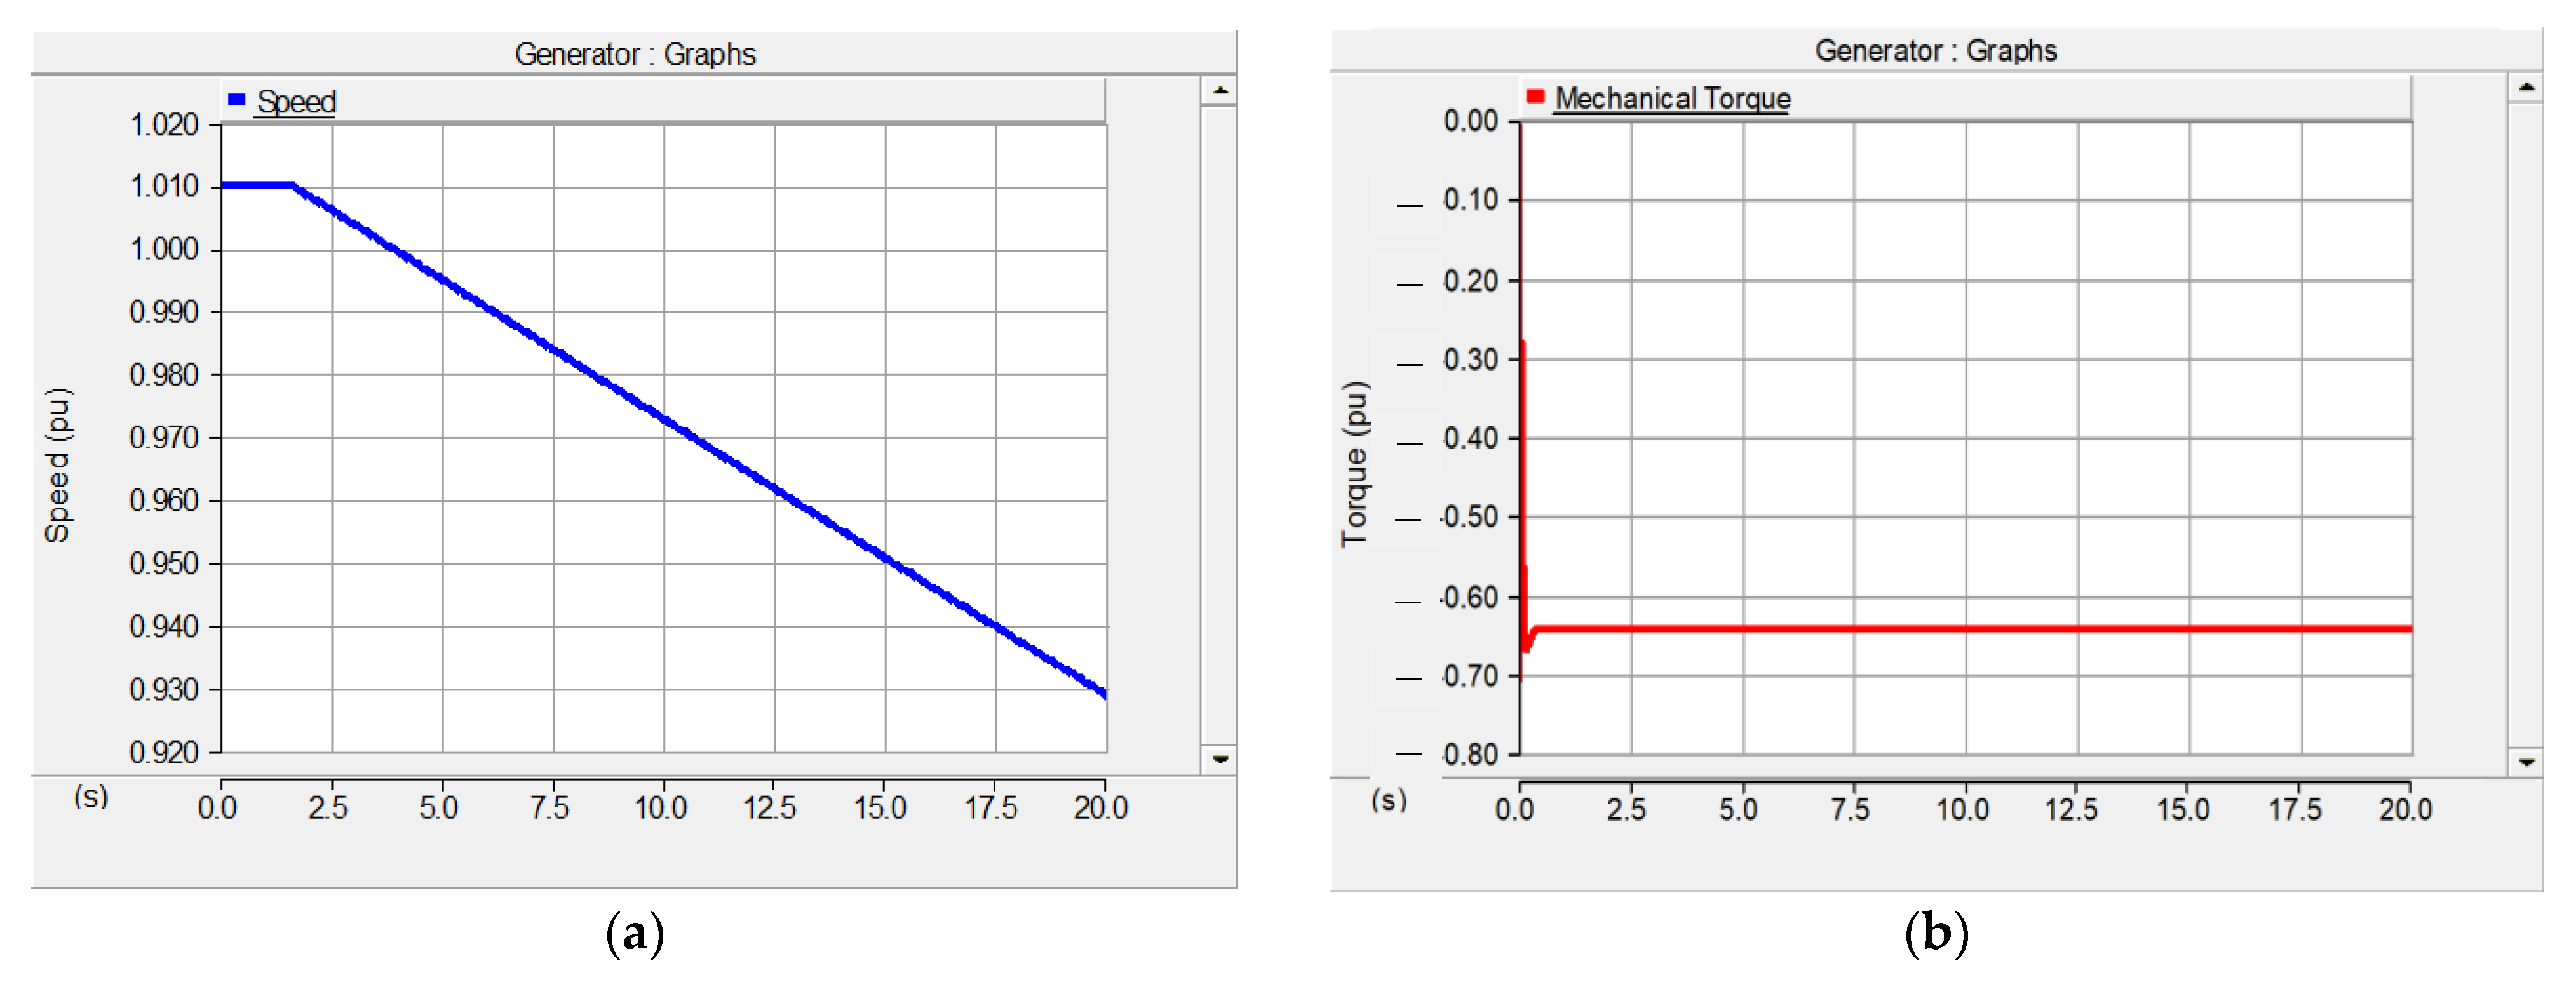
Figure 24 shows the speed and torque pu graphs. The system configuration breaker is open at 1.5 s, then the switch is turned to the torque input at 0.5 s. The torque is sampled and held when switched from constant speed to constant torque. The speed reduces linearly and steadily after 1.5 s, whereas the torque is constant.
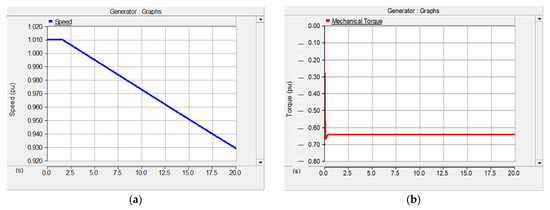
Figure 24.
(a) Speed; (b) torque.
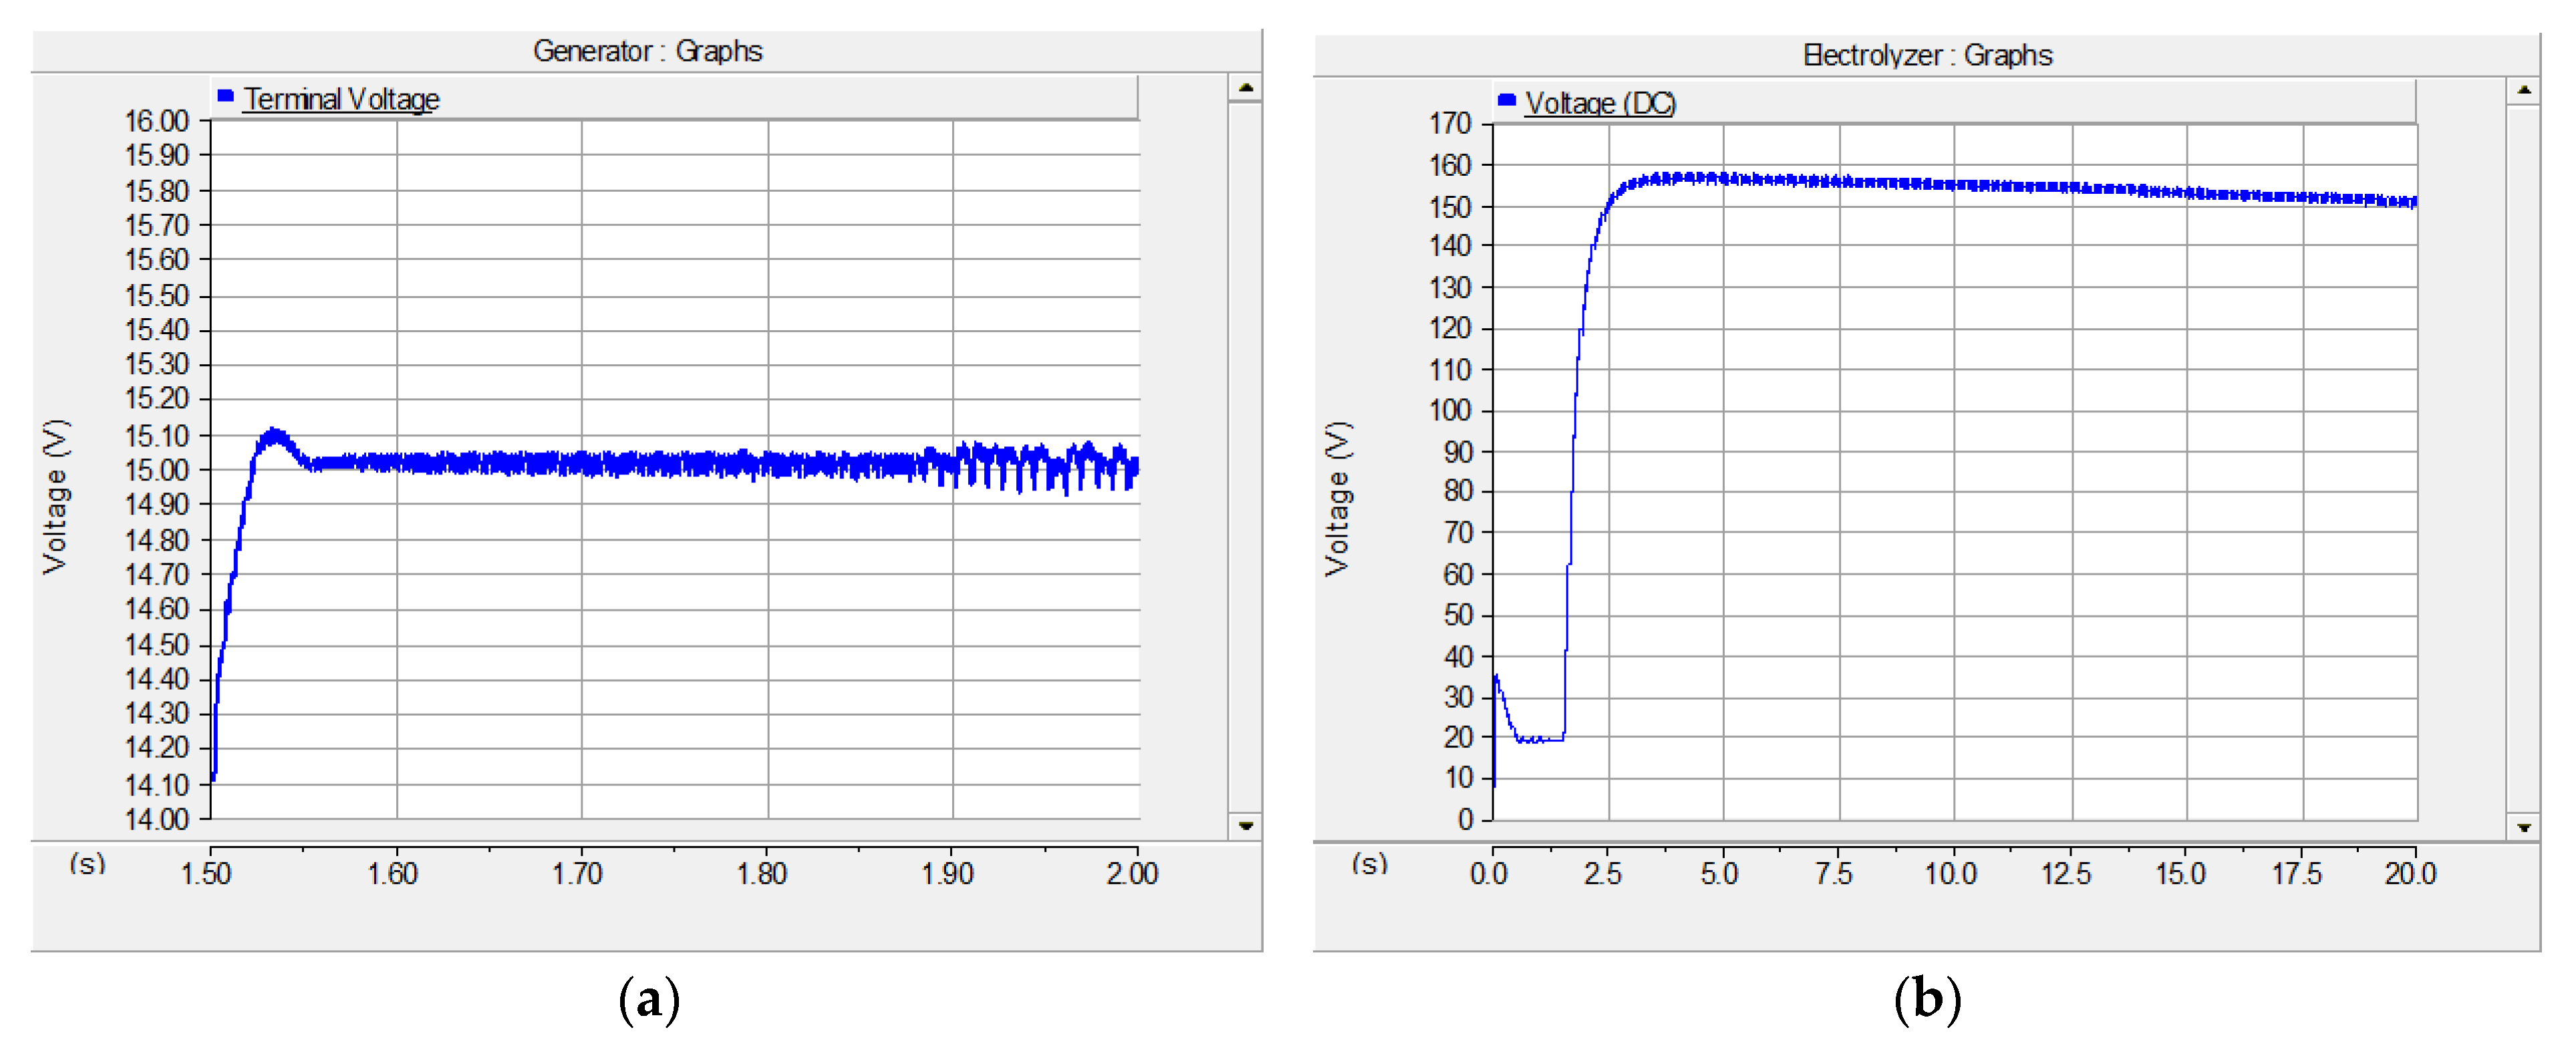
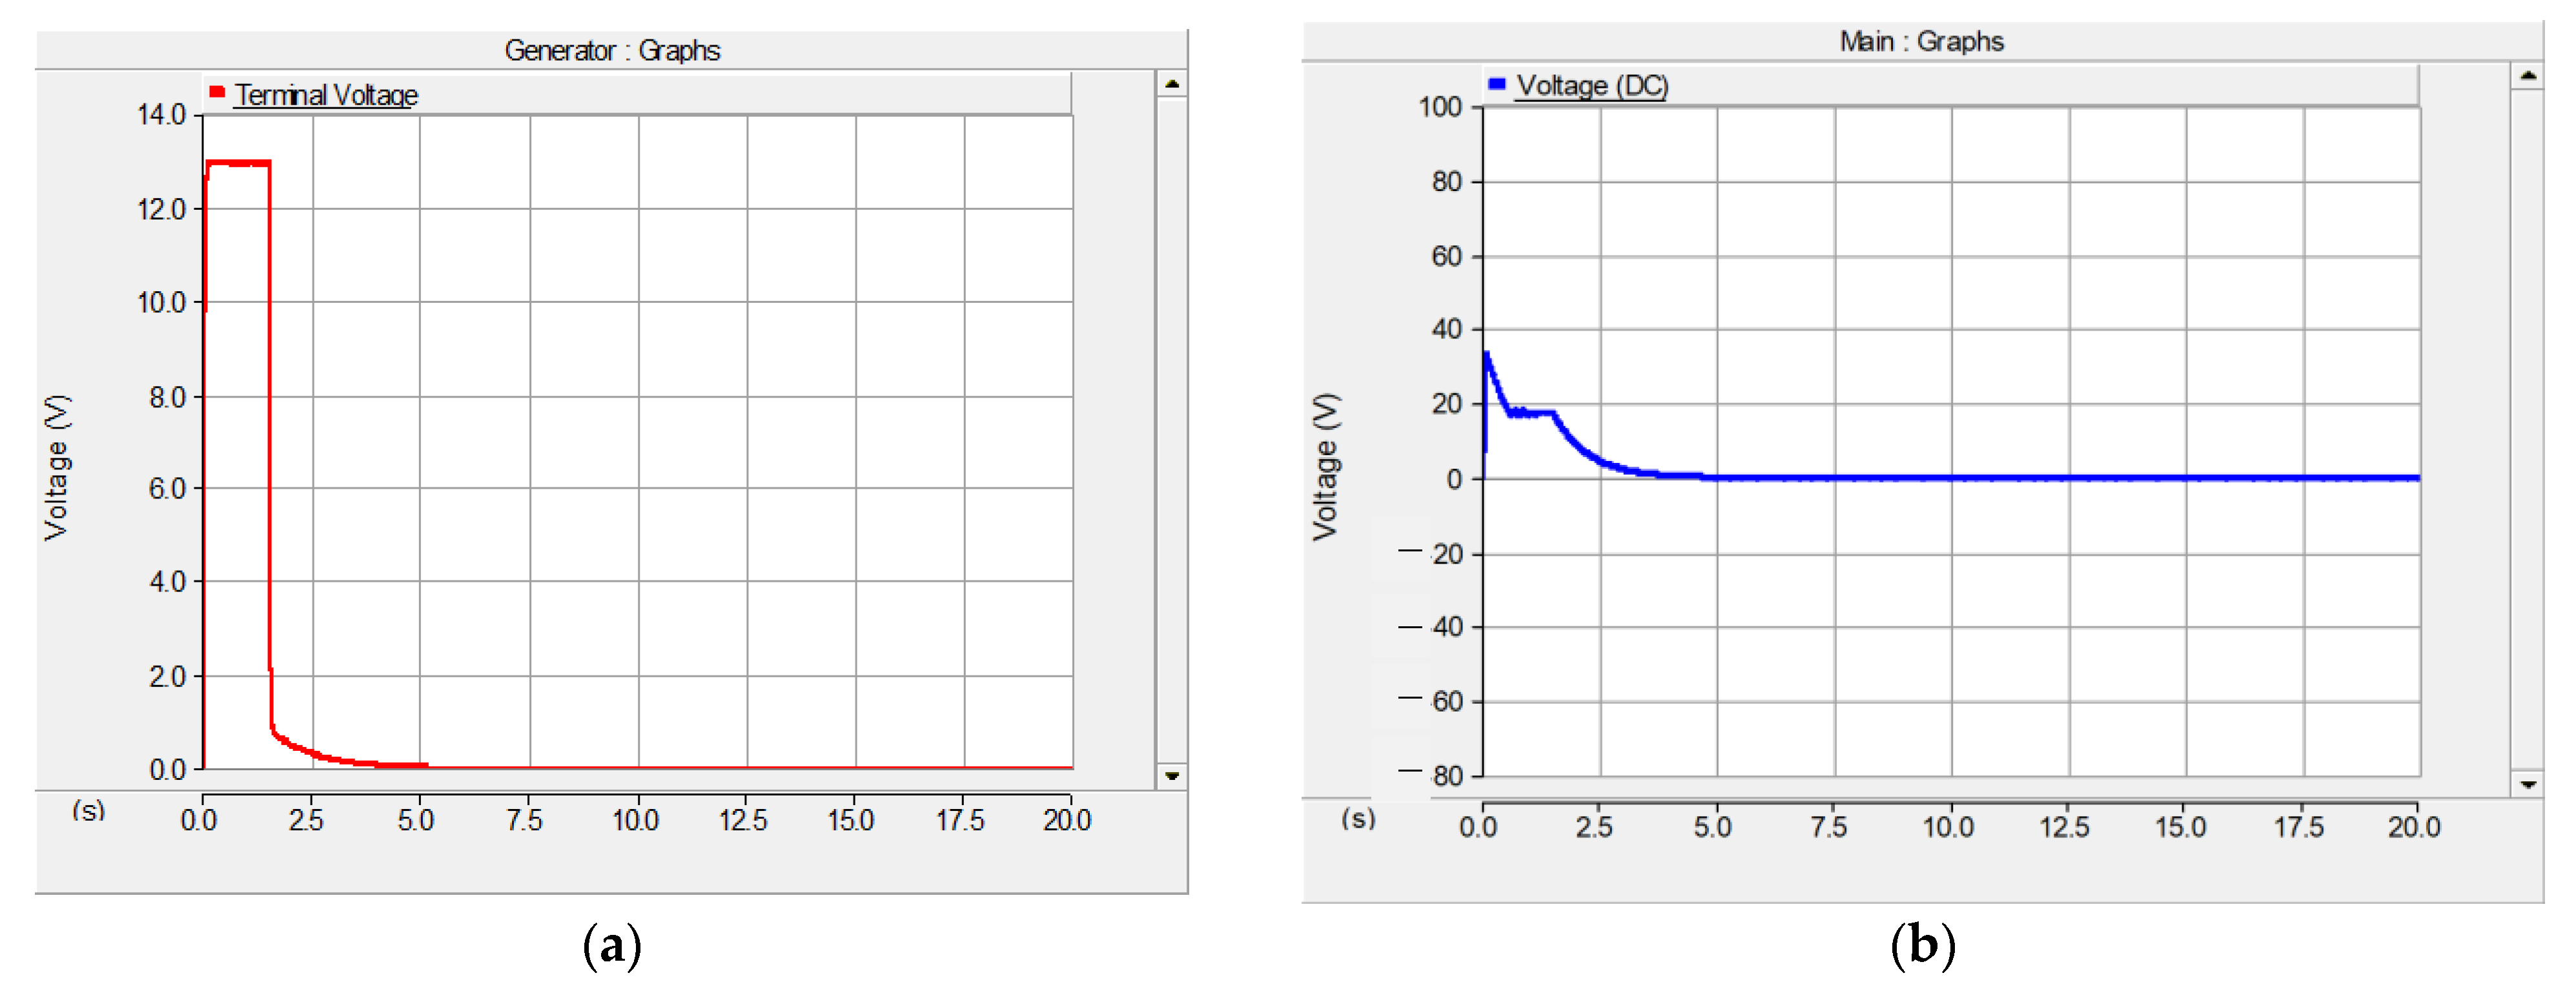
Figure 25 shows the system DC and terminal voltages graphs, respectively. The system DC voltage increases for supply to the load at a constant speed period; however, after the speed reduces and the torque is maintained constant, the system DC voltage slightly reduces due to the directly proportional relationship between speed and voltage throughout the system operation. From the control diagram in Figure 11, the terminal voltage is compared with a reference voltage of 15 V to be maintained at this voltage for the active power control of the converter. Thus, the magnitude of the terminal voltage increases and maintains its stable form at approximately 15 V after the speed and torque change through the system simulation. There are some slight system disturbances experienced in the terminal voltage signal, but the voltage is kept within ±0.1 V of the reference voltage for stability.
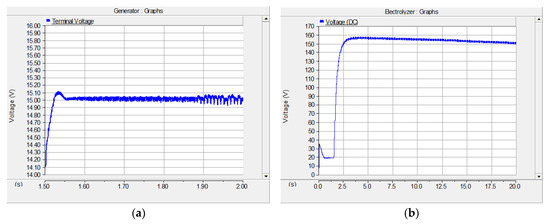
Figure 25.
(a) Terminal voltage; (b) DC voltage.
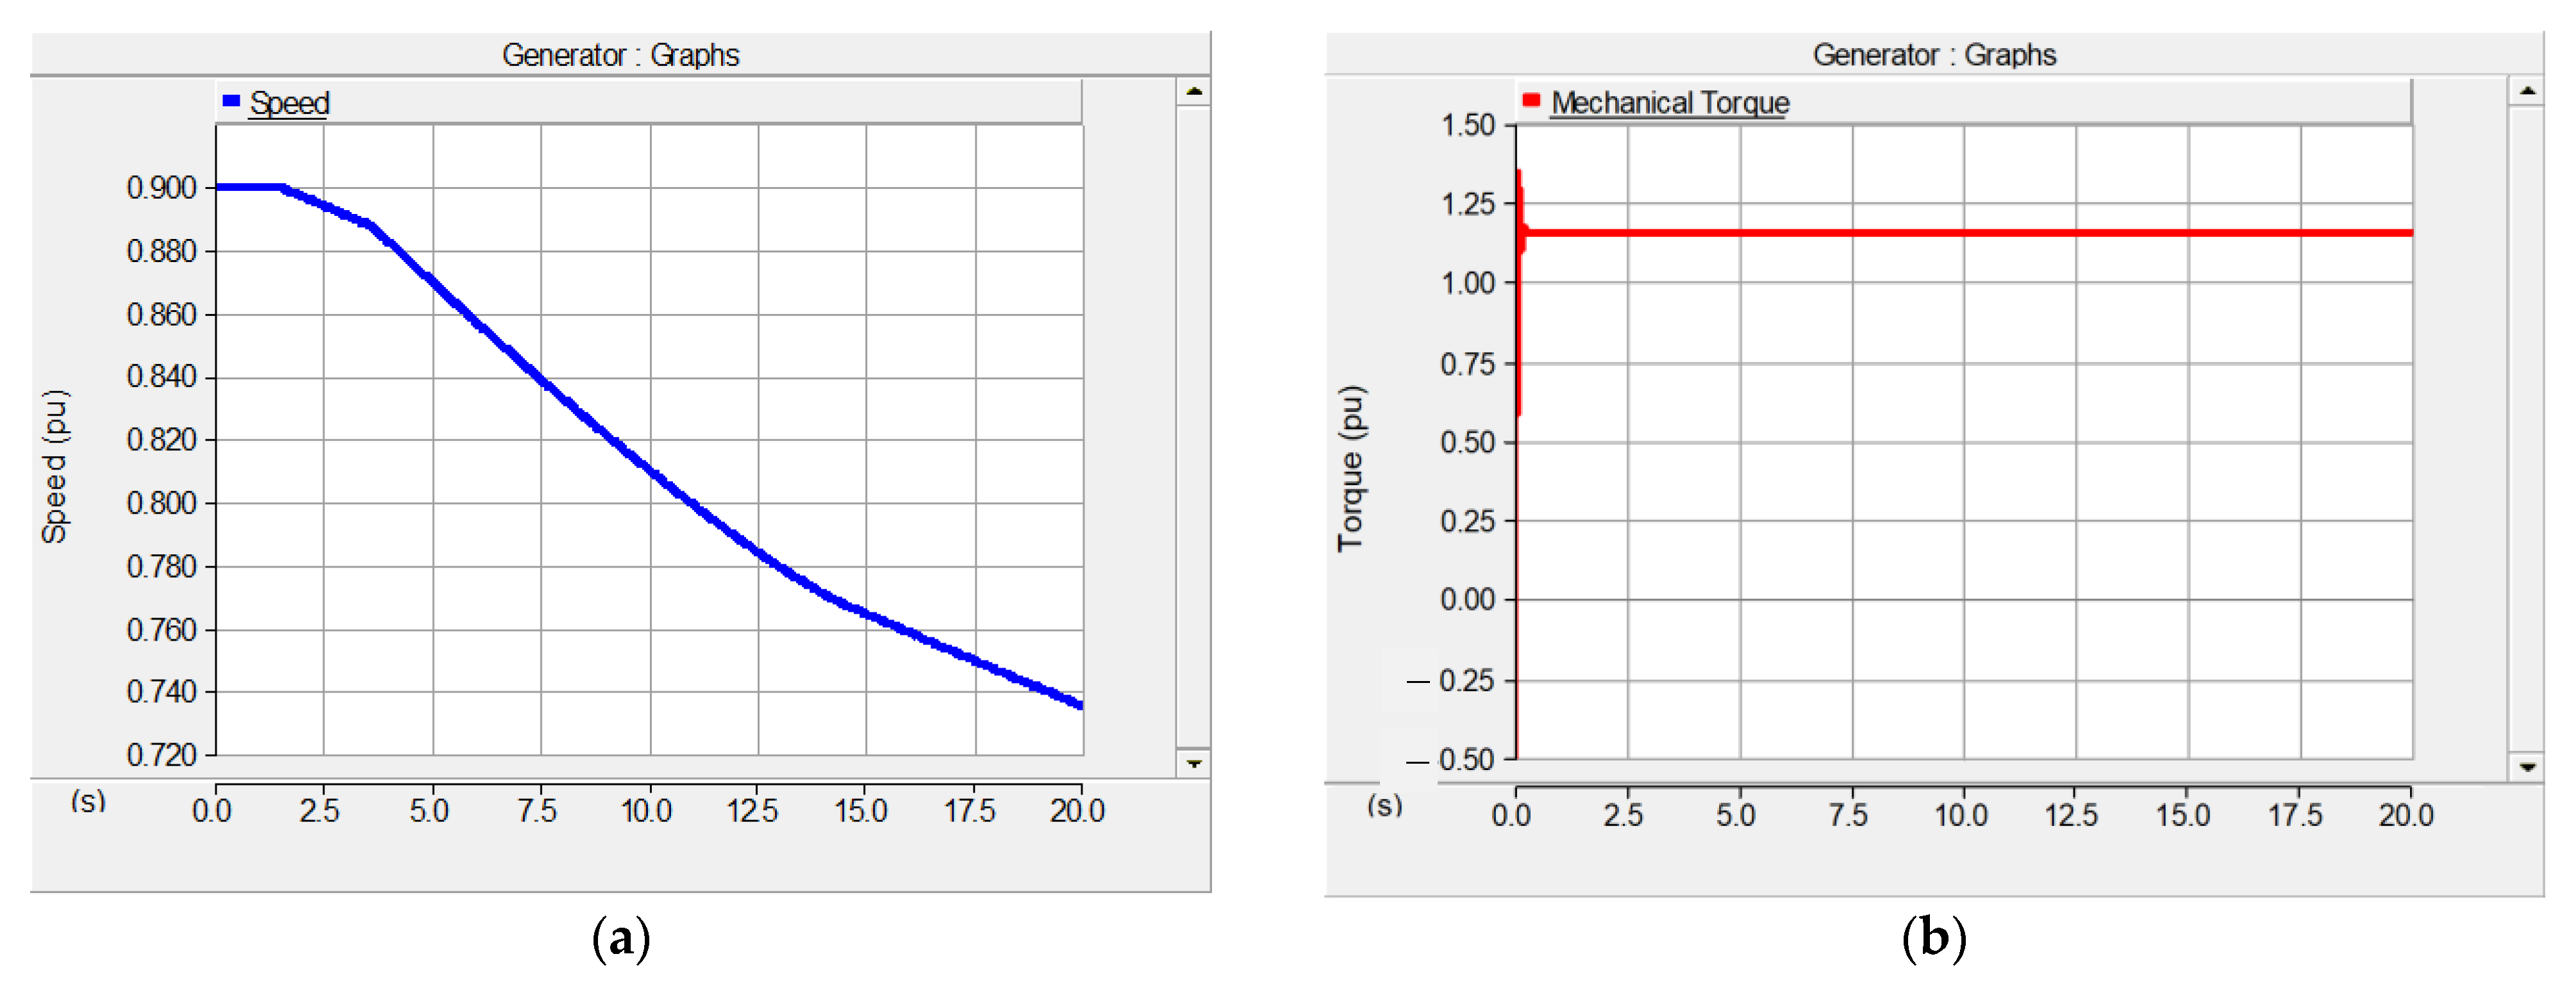
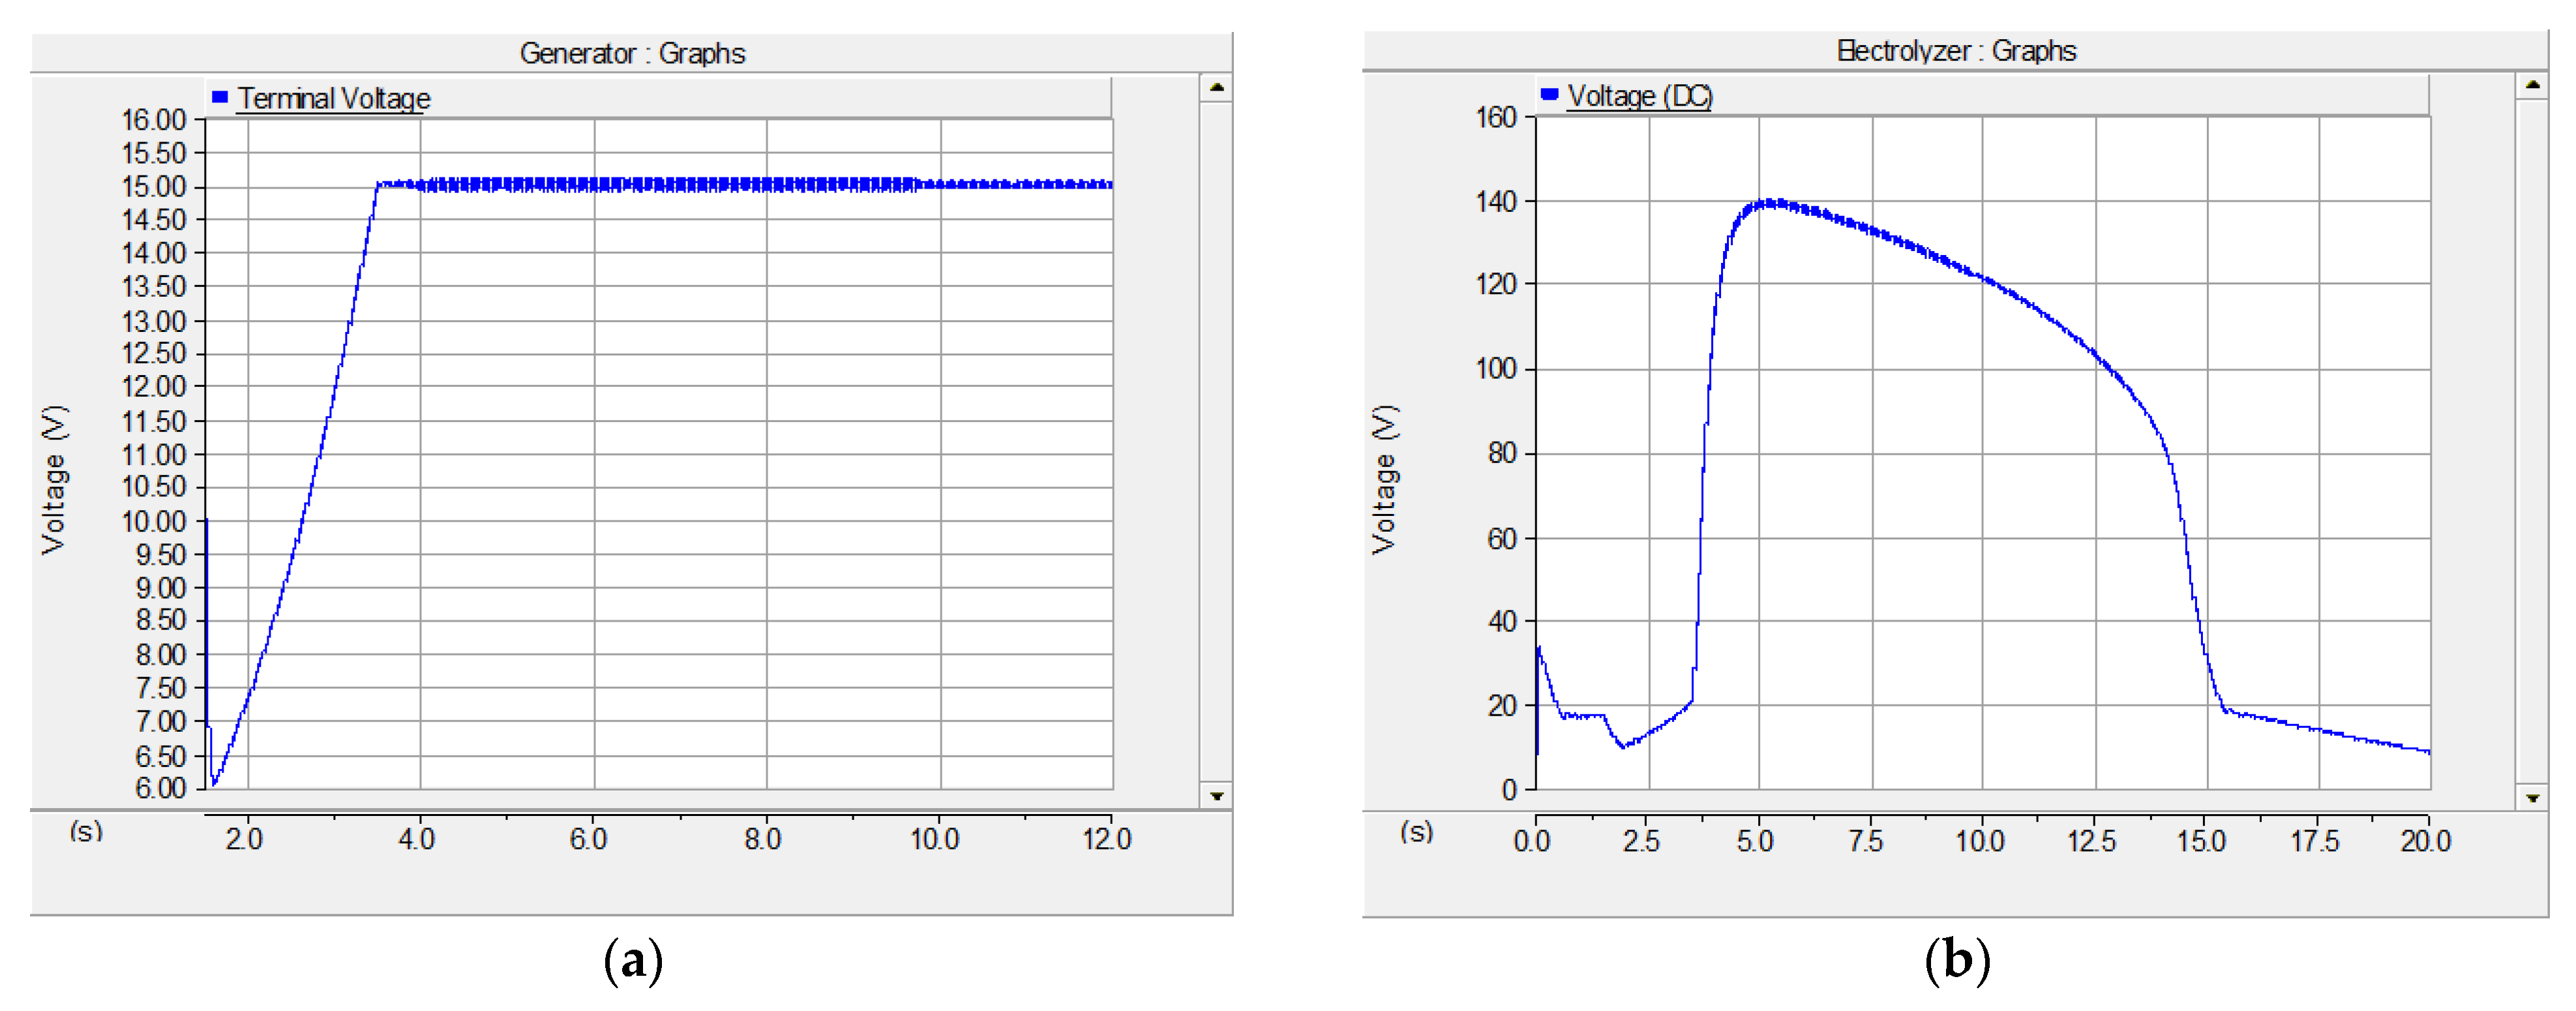
Case II: SEIG speed of 0.90 pu and source breaker opened at 10 s
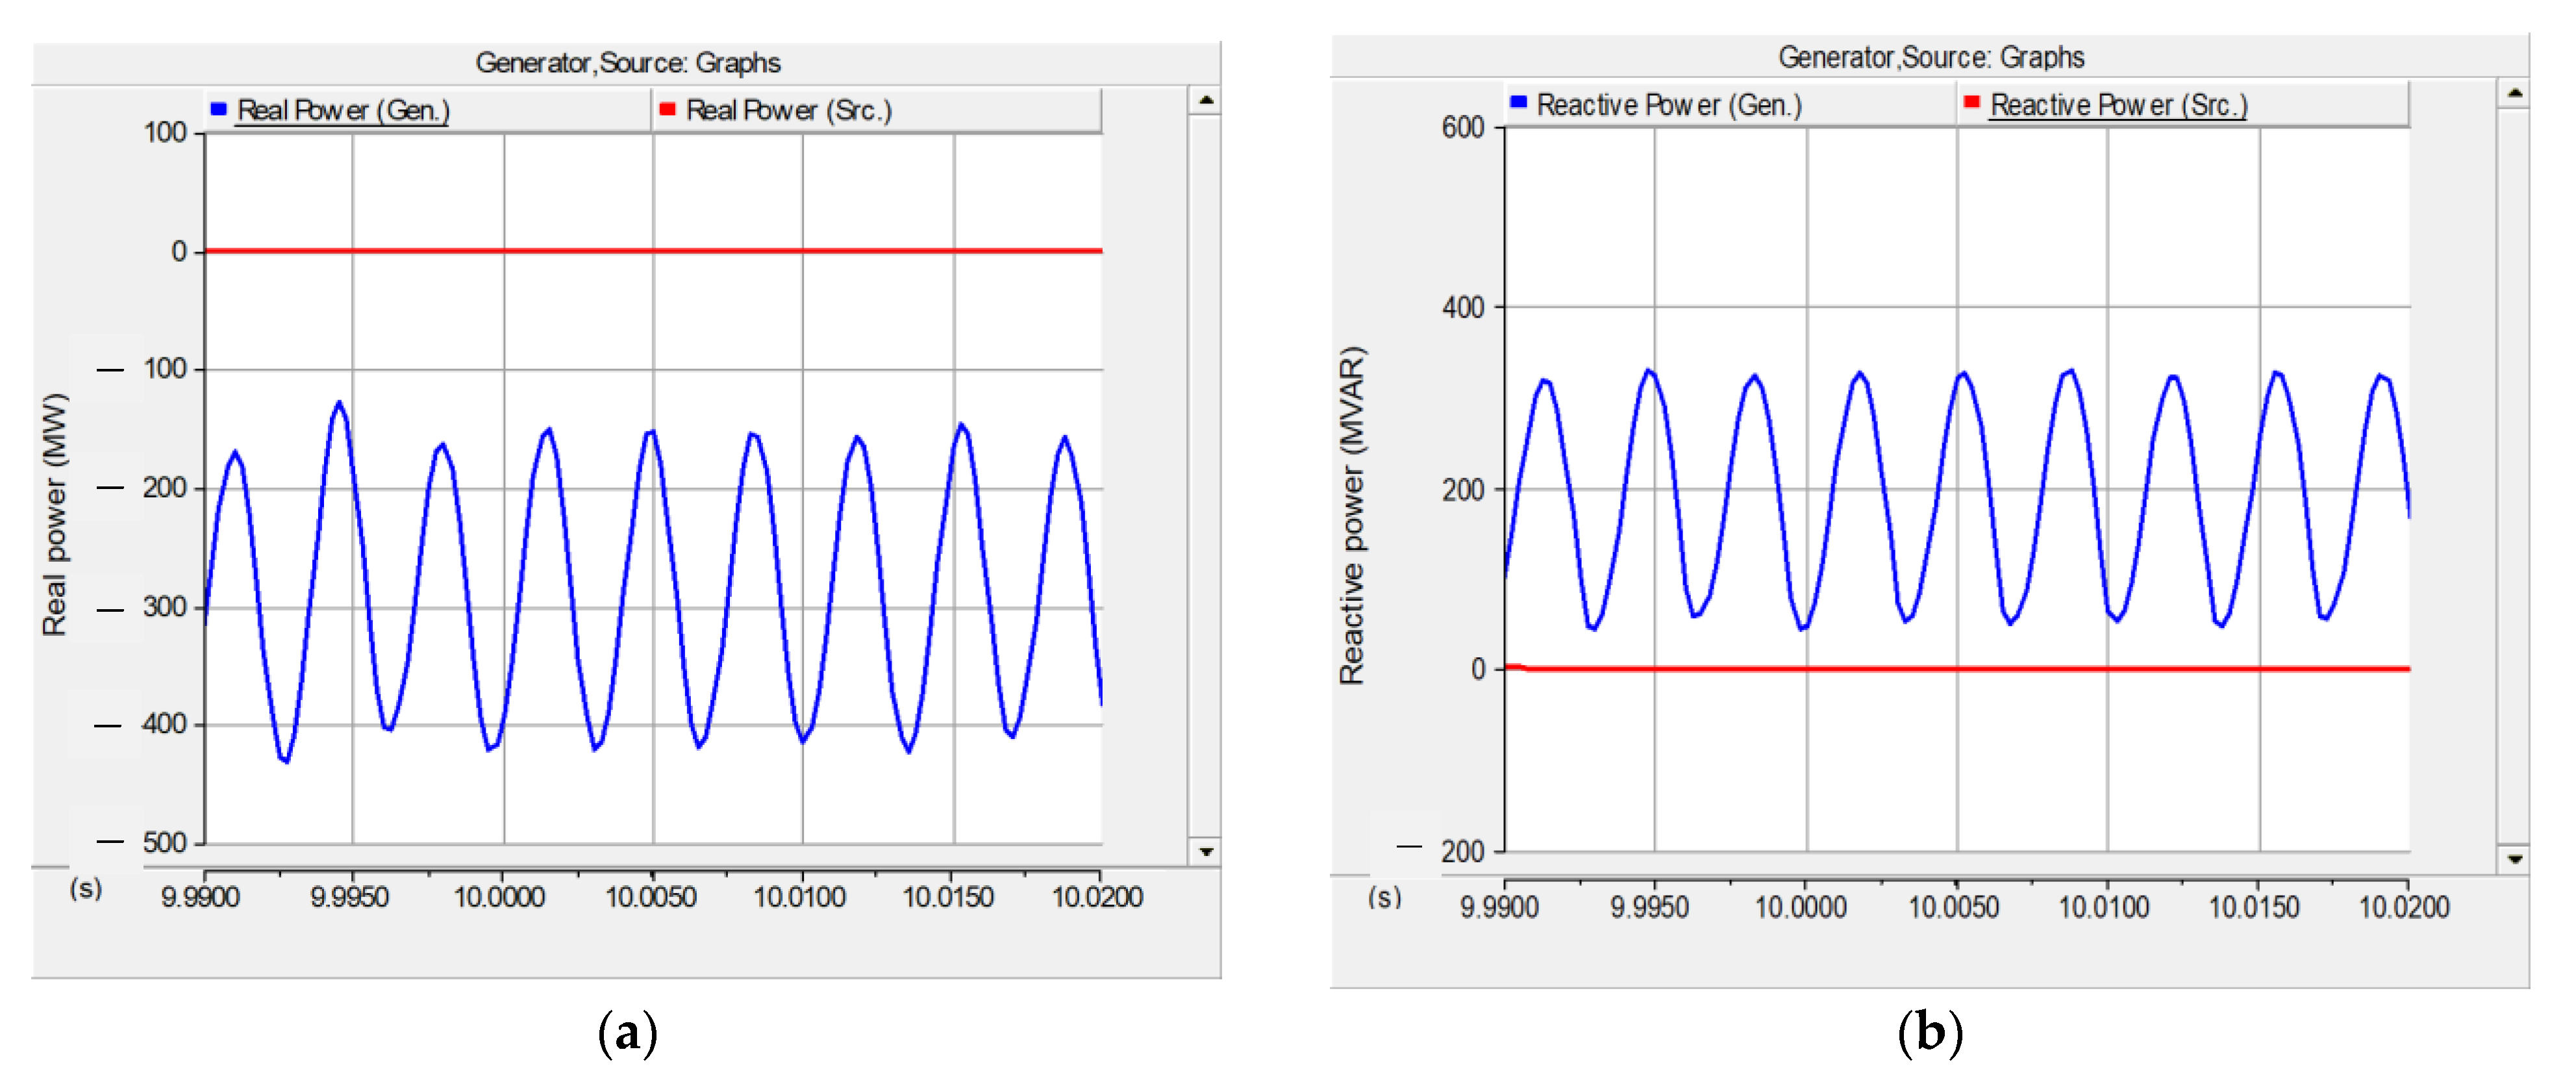
This section shows the simulation graphs for the second case with a decrease in speed. This case results and analysis are similar to that of Case I and this verifies the effective operation of the configuration when its practical possible implementation is executed. Figure 26 shows the real and reactive powers delivered from the SEIG and source. It can be seen from the real and reactive powers graph that the SEIG supplies power to the electrolyzer circuit when the source is disconnected from the system as a result of the breaker action at 10 s.
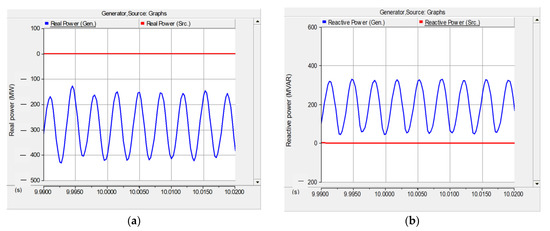
Figure 26.
(a) Real power; (b) reactive power.
Figure 27 shows the speed and torque pu graphs. The system configuration breaker is set to open at 10 s, and the switch is turned to the torque input at 9.0 s. The torque is sampled and held when switched from constant speed to torque. In addition, in this case, the speed reduces gradually decreases after, whereas the torque is constant, similarly to the first case.

Figure 27.
(a) Speed; (b) torque.
Figure 28 shows the system DC and terminal voltages graphs, respectively. The system DC voltage increases for supply to the load after the speed reduces and the torque is maintained constant. The magnitude of the terminal voltage increases and decreases after 15 s due to the speed and torque change, and also the source power supply contribution into the system throughout the whole operation. The terminal voltage in this case restores to its reference voltage of 15 V to ensure stability when the speed suddenly begins to decrease. Similarly, the terminal voltage is within ± 0.1 V of the reference voltage (14.9–15.1 V). In this case, the magnitudes of the voltage decreased with the decrease in the speed as compared with the first case, resulting in varying voltage experienced in the system.
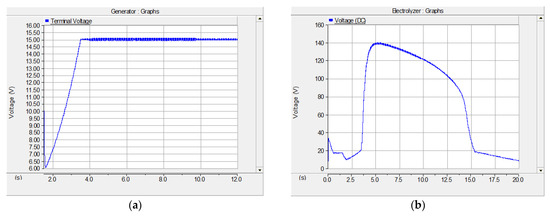
Figure 28.
(a) Terminal voltage; (b) DC voltage.
Generally, from Cases I and II, at a constant speed, voltage gradually builds up from a low value to the steady-state value on the capacitor switch and can be easily observed experimentally from the recorded voltage waveforms. The magnetizing reactance will assume different values from unsaturated to saturated, gradually decreasing as voltage builds up.
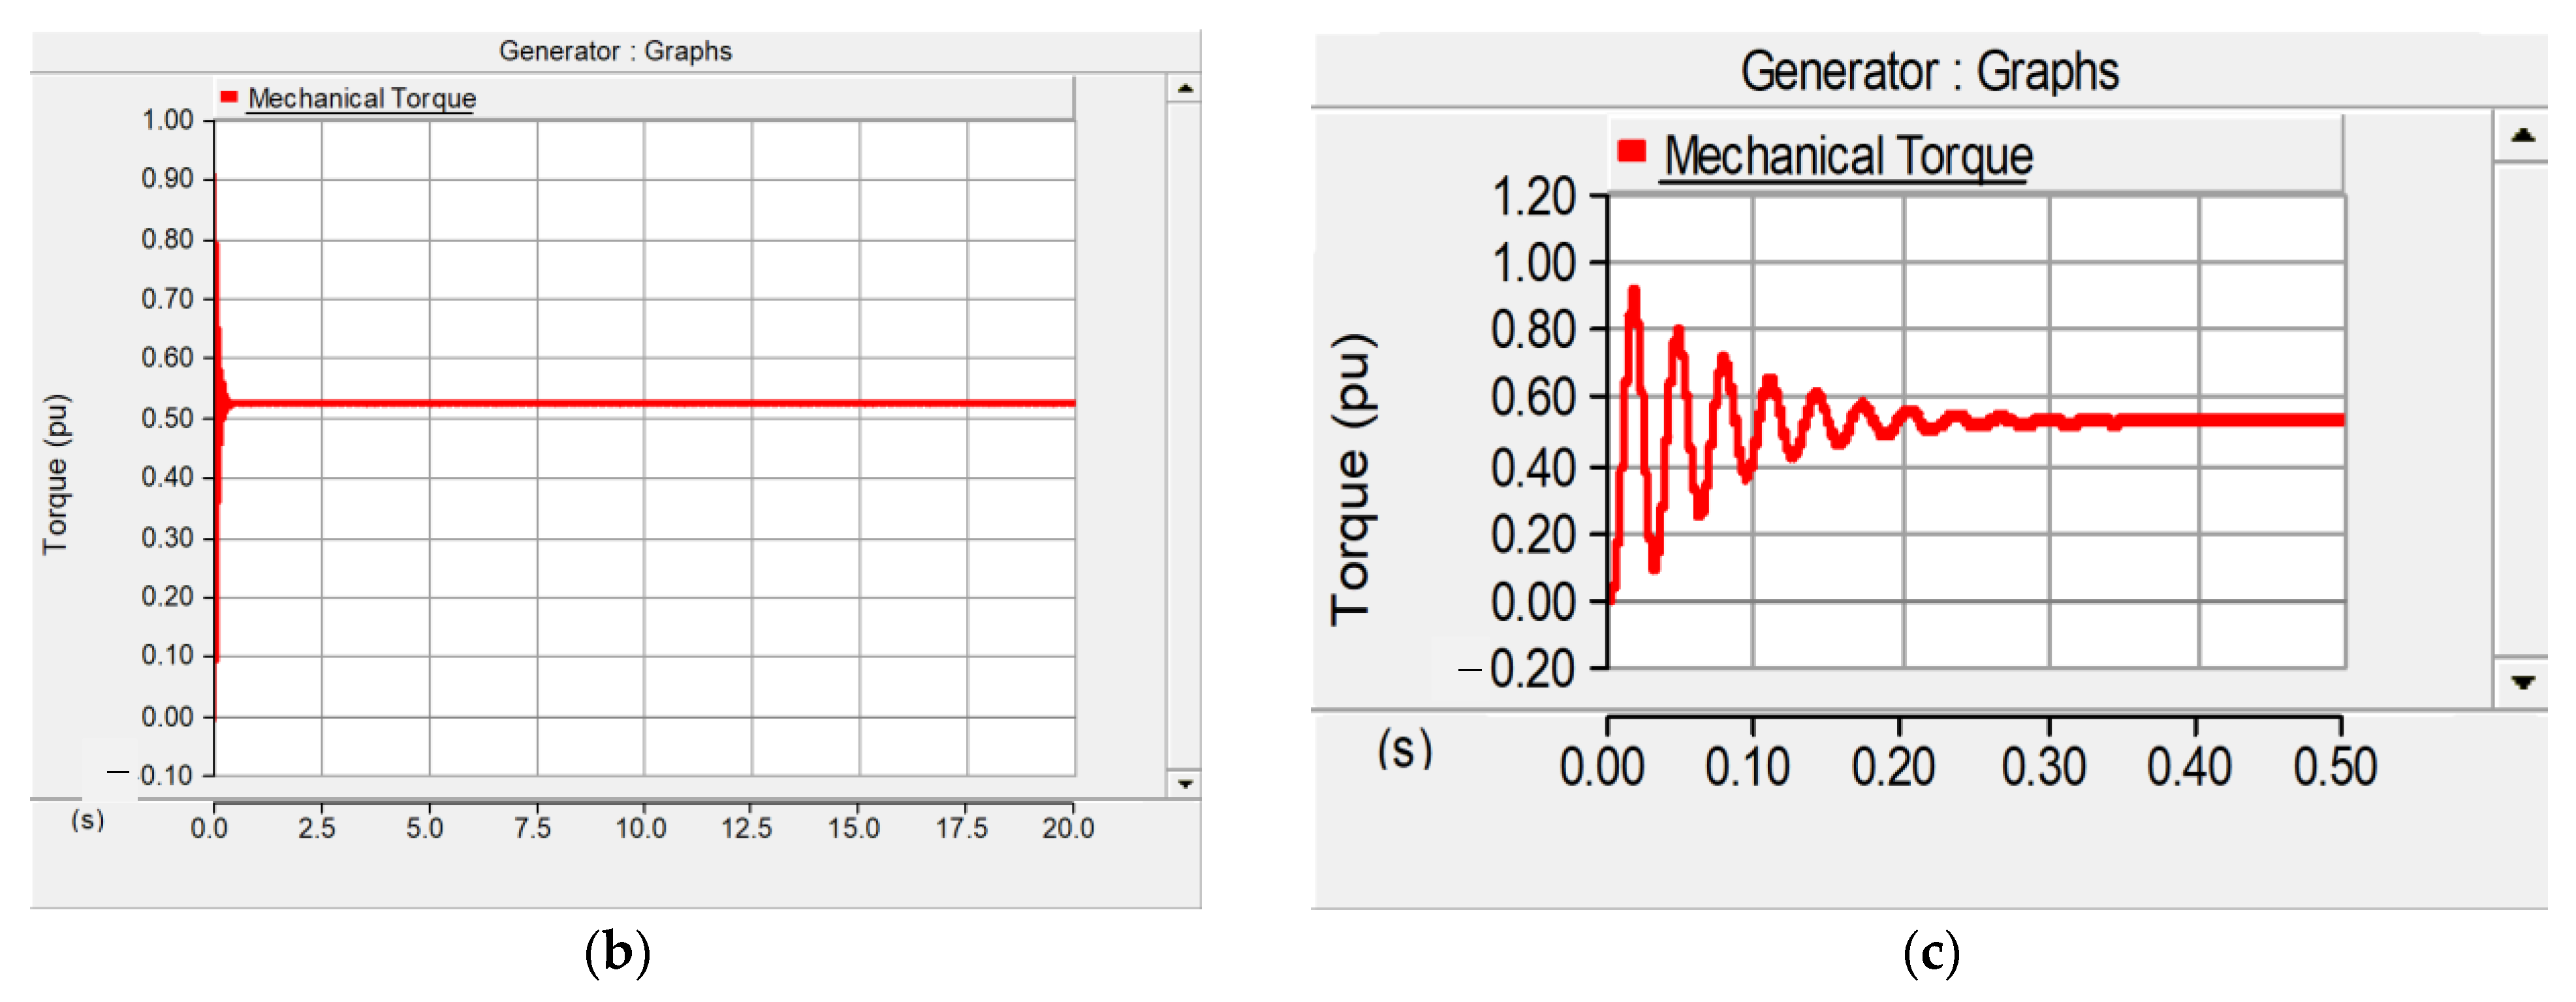
Case III: SEIG low speed of 0.5 pu with source breaker closed throughout system operation.
This section shows the simulation graphs for the third case with a low-speed condition of 0.5 pu. The source breaker is closed in this case, and the power contributions from both the SEIG and source are presented. Figure 29 shows the real and reactive powers delivered from the SEIG and source. It can be seen from the real power graph that the SEIG and source supply power to the electrolyzer circuit, but the source delivers more power to the electrolyzer system than the SEIG.
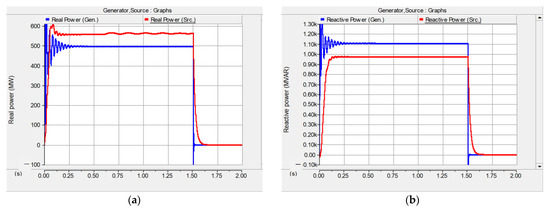
Figure 29.
(a) Real power; (b) reactive power.
Figure 30a shows the speed and Figure 30b,c show the torque graphs. The torque is sampled and held when switched from constant speed to torque. The torque expresses some fluctuations during the constant speed period and remains constant after the speed decreases linearly and steadily after 1.5 s, as shown in Figure 30c.
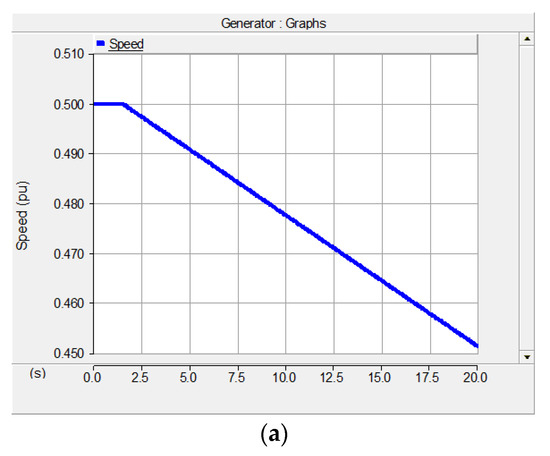

Figure 30.
(a) Speed; (b) entire system torque output; (c) torque fluctuations at starting during constant speed.
Figure 31a,b show the DC and terminal voltages graphs, respectively. The system DC voltage decreases in this low-speed case. The magnitude of the terminal voltage decreases sharply after 1.5 s due to the reduced speed and torque change. In this case, the magnitudes of the voltage decreased more with the decrease in the speed as compared with the first case.

Figure 31.
(a) Terminal voltage; (b) DC voltage.
As the rotor speed decreases, the control performances are degraded due to the unstable and not enough voltage generation from the SEIG, but the speed is still controllable with a ripple component caused by a PWM switching. From the speed variations in Figure 16, the capacitor values can be changed via switching the breakers seen in Figure 13 based on case conditions for the flux control, and power can be controlled via the DC/DC booster converter in Figure 13. The flux is well controlled with a slow time constant, approximately 5 s, due to the nature of the magnetizing saturation characteristics of the SEIG shown in Figure 12, while the power is properly controlled with the limited overshoot and fast transient response, less than 1s, in Figure 17. Figure 22 shows the PI controller output for the power control that is directly related to the duty cycle of the boost converter in Figure 8, increasing up to 45% during the speed variation.
4. Conclusions
In our study, the control analysis concerning power and flux controls for a SEIG was performed for a wind turbine connected to the electrolyzer applications. A simple electrolyzer model was utilized, with a resistor and ideal voltage source as a circuit model and a proper power scaling of 66 kW system. An efficient power control algorithm for the electrolyzer using a DC/DC converter has been proposed and validated through PSCAD and MATLAB simulations. In addition to power control, the selection method of the capacitors for the excitation has been proposed and validated throughout the simulation. A flux control was also validated through PSCAD simulation based on the proper connection of the parallel capacitor for the excitation. A modified system configuration is also presented, where a parallel equivalent connection was formed for an electrolyzer model. Three cases were considered under this configuration and the results showed the feasibility and performance of the system, indicating the potential of this power electronics circuit to be implemented for a SEIG and electrolyzer system. Furthermore, one feasible project currently under study for future implementation with a similar idea to this study is the H2Mare flagship project [23]. This project consists of wind turbines with an integrated electrolyzer to demonstrate sustainable hydrogen production at sea. The H2Mare flagship project aims to establish a new type of turbine at sea in the future, which will be a solution that integrates an electrolyzer into an offshore wind turbine optimally for direct conversion of electricity.
Author Contributions
Writing—original draft preparation, W.N. and R.K.T.; Conceptualization, W.N. and E.M.; Conceptualization, S.H. and J.K.; writing—review and editing, W.N. and R.K.T.; Supervision, E.M. and J.K. All authors have read and agreed to the published version of the manuscript.
Funding
This research is based on work supported by the National Science Foundation under grant no. 816197 and was conducted with the support of the Department of Energy Summer Visiting Faculty Program at National Renewable Energy Laboratory, Golden, CO, USA (2017).
Conflicts of Interest
The authors declare no conflict of interest.
References
- Bansal, R.C.; Bhatti, T.S.; Kothari, D.P. A bibliographical survey on induction generators for application of non-conventional energy systems. IEEE Trans. Energy Convers. 2003, 18, 433–439. [Google Scholar] [CrossRef]
- Bansal, R.C. Three-Phase Self Excited Induction Generators: An Overview. IEEE Trans. Energy Convers. 2005, 20, 292–299. [Google Scholar] [CrossRef]
- Na, W.; Muljadi, E.; Lengthy, B.; Kim, J. Active Power and Flux Control of a Self-Excited Induction Generator for a Variable-Speed Wind Turbine Generation. In Proceedings of the 2017 IEEE Annual Green Tech, Denver, CO, USA, 29–31 March 2017; pp. 177–181. [Google Scholar]
- Muljadi, E.; Gregory, B.; Broad, D. Self-Excited Induction Generator for Variable-Speed Wind Turbine Generation; NREL/CP-440-21436; National Renewable Energy Lab: Golden, CO, USA, 1996. Available online: https://www.nrel.gov/docs/legosti/old/21436.pdf (accessed on 3 March 2021).
- Nesba, A.; Ibtiouen, R.; Mekhtoub, S.; Touhami, O.; Bacha, S.; Riu, D.; Benhaddadi, M. Analysis of self-excited induction generator feeding DC loads for low-cost renewable energy applications. In Proceedings of the 2009 IEEE International Electric Machines and Drives Conference, Miami, FL, USA, 3–6 May 2009; pp. 812–817. [Google Scholar] [CrossRef]
- Kesler, S.; Tayyip, D. A voltage regulation system for independent load operation of standalone self-excited induction generators. J. Power Electron. 2016, 5, 1869–1883. [Google Scholar] [CrossRef] [Green Version]
- Khan, M.J.; Iqbal, M.T. Dynamic Modeling and Simulation of a small wind-fuel cell hybrid energy system. Renew. Energy 2005, 30, 421–439. [Google Scholar] [CrossRef]
- Sichilalu, A.; Tazvinga, H.; Xiaohua, X. Optimal control of a fuel cell/wind/PV/grid hybrid system with thermal heat pump load. Sol. Energy 2016, 135, 59–69. [Google Scholar] [CrossRef] [Green Version]
- Takahasi, R.; Kinoshita, H.; Murata, T.; Tamura, J.; Sugimasa, M.; Komura, A.; Futami, M.; Ichinose, M.; Ide, K. Output Power Smoothing and Hydrogen Production by Using Variable Speed Wind Generators. IEEE Trans. Ind. Electron. 2010, 57, 485–493. [Google Scholar] [CrossRef]
- Çalgan, H.; Ilten, E.; Demirtas, M. Thyristor controlled reactor-based voltage and frequency regulation of a three-phase self-excited induction generator feeding unbalanced load. Int. Trans. Electr. Energy Syst. 2020, 30, e12387. [Google Scholar] [CrossRef]
- Kalaivani, C.; Rajambal, K. Modeling of an Efficient High Power Wind Energy Conversion System using Self-excited Multi-phase Machines. Microproce. Microsys. 2020, 74, 103020. [Google Scholar] [CrossRef]
- Wang, B.; Xian, L.; Manandhar, U.; Ye, J.; Zhang, X.; Gooi, H.B.; Ukil, A. Hybrid energy storage system using bidirectional single-inductor multiple-port converter with model predictive control in DC microgrids. Electr. Power Syst. Res. 2019, 173, 38–47. [Google Scholar] [CrossRef]
- Wu, W.; Wang, H.; Liu, Y.; Huang, M.; Blaabjerg, F. A Dual-Buck-Boost AC/DC Converter for DC Nano grid With Three Terminal Outputs. IEEE Trans. Ind. Electron. 2017, 64, 295–299. [Google Scholar] [CrossRef]
- Shahidehpour, M.; Li, Z.; Gong, W.; Bahramirad, S.; Lopata, M. A Hybrid AC/DC Nano grid: The Keating Hall Installation at the Illinois Institute of Technology. IEEE Electrif. Mag. 2017, 9, 36–46. [Google Scholar] [CrossRef]
- Nayanar, V.; Kumaresan, N.; AmmasaiGounden, G. Wind-driven SEIG supplying DC microgrid through a single-stage power converter. Eng. Sci. Technol. Int. J. 2016, 19, 1600–1607. [Google Scholar] [CrossRef] [Green Version]
- Kumar, S.; Vijayakumar, K. Simulation and experimental comparative analysis of the DC-DC converter topologies for wind-driven SEIG fed DC nano grid. Electr. Power Syst. Res. 2020, 181, 106196. Available online: https://hvdc.ca/pscad (accessed on 21 March 2021). [CrossRef]
- Nie, J.; Chen, Y.; Boehm, R.F. Numerical modeling of two-phase flow in a bipolar plate of a PEM electrolyzer cell. In Proceedings of the ASME 2008 International Mechanical Engineering Congress and Exposition, Boston, MA, USA, 31 October–6 November 2008; pp. 783–788. [Google Scholar]
- Hernandez-Gomez, A.; Ramirez, V.; Guilbert, D. Investigation of PEM electrolyzer modeling: Electrical domain, efficiency, and specific energy consumption. Int. J. Hydrog. Energy 2020, 45, 14625–14639. [Google Scholar] [CrossRef]
- Sarrias-Mena, R.; Fernadez-Ramirez, L.; Andrés, C.; Jurado, F. Electrolyzer models for hydrogen production from wind energy systems. Int. J. Hydrog. Energy 2015, 40, 2927–2938. [Google Scholar] [CrossRef]
- Fang, R.; Liang, Y. Control strategy of electrolyzer in a wind-hydrogen system considering the constraints of switching times. Int. J. Hydrog. Energy 2019, 44, 25104–25111. [Google Scholar] [CrossRef]
- Alongae, F.; Collura, S.M.; D’lpopolito, F.; Guilbert, D.; Luna, M.; Vitale, G. Design of a robust controller for DC/DC converter-electrolyzer systems supplied by u WECSs subject to highly fluctuating wind speed. Cont. Eng. Pract. 2020, 98, 10483. [Google Scholar]
- Firtina-Ertis, I.; Acar, C.; Erturk, E. Optimal sizing design of an isolate stand-alone hybrid wind-hydrogen system for a zero-energy house. Appl. Energy 2020, 274, 115244. [Google Scholar] [CrossRef]
- Inna Eck Presse-und Öffentlichkeitsarbeit and Fraunhofer-Institut für Windenergiesysteme IWES. 2021. Wind Turbines with Integrated Electrolyzer Demonstrate Sustainable Hydrogen Production at Sea. Available online: https://idw-online.de/de/news774469 (accessed on 28 October 2021).


Publisher’s Note: MDPI stays neutral with regard to jurisdictional claims in published maps and institutional affiliations. |
© 2021 by the authors. Licensee MDPI, Basel, Switzerland. This article is an open access article distributed under the terms and conditions of the Creative Commons Attribution (CC BY) license (https://creativecommons.org/licenses/by/4.0/).