Abstract
Automatic pain recognition from facial expressions is a challenging problem that has attracted a significant attention from the research community. This article provides a comprehensive analysis on the topic by comparing some popular and Off-the-Shell CNN (Convolutional Neural Network) architectures, including MobileNet, GoogleNet, ResNeXt-50, ResNet18, and DenseNet-161. We use these networks in two distinct modes: stand alone mode or feature extractor mode. In stand alone mode, the models (i.e., the networks) are used for directly estimating the pain. In feature extractor mode, the “values” of the middle layers are extracted and used as inputs to classifiers, such as SVR (Support Vector Regression) and RFR (Random Forest Regression). We perform extensive experiments on the benchmarking and publicly available database called UNBC-McMaster Shoulder Pain. The obtained results are interesting as they give valuable insights into the usefulness of the hidden CNN layers for automatic pain estimation.
1. Introduction
The human face is a rich source for non-verbal information regarding our health [1]. Facial expression [2] can be considered as a reflective and spontaneous reaction of painful experiences. Most previous studies on facial expression are based on the Facial Action Coding System (FACS), which describes expressions by elementary Action Units (AUs) based on facial muscle activity. More recent works have mostly focused on the recognition of facial expressions linked to pain using either conventional machine learning (ML) or deep learning (DL) models. The studies showed the potential of conventional ML and DL models for pain estimation, especially when the models are trained on large fully annotated datasets, and tested under relatively controlled capturing conditions. However, the accuracy, robustness, and complexity of these models remain an issue when applied to real-world pain intensity assessment.
This article provides a comprehensive analysis on automatic pain intensity assessment from facial expressions using Off-the-Shell CNN architectures, including MobileNet, GoogleNet, ResNeXt-50, ResNet18, and DenseNet-161. The choice of these CNN architectures is motivated by their good performance in different vision tasks, as shown in the ImageNet Large Scale Visual Recognition Challenge [3]. These architectures have been trained on more than a million images to classify images into 1000 object categories. We use these networks in two distinct modes: stand alone mode or feature extraction mode. In stand alone mode, the networks are used for directly assessing the pain. In feature extraction mode, the features in the middle layers of the networks are extracted and used as inputs to classifiers, such as SVR (Support Vector Regression) and RFR (Random Forest Regression). We perform extensive experiments on the benchmarking and publicly available database called UNBC-McMaster Shoulder Pain Expression Archive Database [4], containing over 10,783 images. The extensive experiments showed interesting insights into the usefulness of the hidden layers in CNN for automatic pain estimation from facial expressions.
The main contributions of this paper include:
- We provide a comprehensive analysis on automatic pain intensity assessment from facial expressions using 5 popular and Off-the-Shell CNN architectures.
- We compare the performance of these different CNNs (including MobileNet, GoogleNet, ResNeXt-50, ResNet18, and DenseNet-161).
- We study the effectiveness of the hidden layers in these 5 Off-the-Shell CNN architectures for pain estimation by using features as inputs to two classifiers: SVR (Support Vector Regression) and RFR (Random Forest Regression).
- We provide extensive experiments on a benchmarking and publicly available database called UNBC-McMaster Shoulder Pain Expression Archive Database [4], containing 10,783 images.
- To support the principle of reproducible research and fair comparison, we plan to release (GitHub, under construction) all the code and material behind this work for the research community.
The rest of the article is organized as follows. Section 2 gives an overview of the recent works on pain estimation and deep learning models. Section 3 presents the different CNN architectures that are considered in this work, as well as our proposed framework. Section 4 describes the conducted experiments and the obtained results. Finally, Section 5 draws some conclusions and points out future directions.
2. Related Work
Automatic pain recognition from facial expressions has been widely investigated in the literature. The first task is the detection of the presence of pain (a binary classification). Some other works are not limited to binary classification but are mainly focused in assessing the pain level intensity. These works commonly use the Prkachin and Solomon’s Pain Intensity metric (PSPI) [5]. This can be calculated for each individual video frame, after coding the intensity of certain action units (AU) according to the Facial Action Coding System (FACS). Below, we review some of the existing works.
Several approaches have been proposed for pain recognition as a binary classification problem, aiming at discriminating between pain versus no pain expressions. For instance, Chen et al. [6] proposed a new framework for pain detection in videos. To recognize facial pain expression, the authors used Histogram of Oriented Gradients (HOG) as frame level features. Then, they trained an Support Vector Machine (SVM) classifier. Lucey et al. [4] addressed AUs (Action Units) and pain detection based on SVMs. They detected the pain either directly using image features or by applying a two-step approach, where first AUs are detected and then this output is fused by Logistical Linear Regression (LLR) in order to detect pain.
Other approaches focused on the estimation of pain level. Many of them are based on variants of machine learning methods. For instance, Lucey et al. [7] used SVM to classify three levels of pain intensity. In another study, four pain levels were identified using SVM classifier to estimate the pain intensity by Hammal and Cohn [8]. Chen et al. [6] proposed a framework for pain detection in videos, exploring spatial and dynamic features. These features are then used to train an SVM as a frame-based pain event detector. Recent work by Tavakolian et al. [9] also used a machine learning framework, namely a Siamese network. The authors proposed a self-supervised learning to estimate pain. In this work, the authors introduced a new similarity function to learn generalized representations using a Siamese network. The learned representations are fed into a fine-tuned CNN to estimate pain. The evaluation of the proposed method was done on two datasets (the UNBC-McMaster and the BioVid), showing very good results.
The recent works have shown considerable interest in automatic pain assessment from facial patterns using deep learning algorithms. Transfer learning was adopted by various image classification works. For instance, Bargshady et al. [10] propose to extract feature using the pre-trained CGG-Face model. Their approach consists of a hybrid deep model, including two-stream convolutional neural networks related to long short-term memory (CNN-BiLSTM). A pre-trained convolutional neural network (CNN) (VGG-Face) and long short-term memory (LSTM) algorithm were applied to detect pain from the face using the MIntPAIN dataset by Haque et al. [11]. In this work, a hybrid deep learning approach is employed. Actually, the combination of a CNN and a RNN allowed the use of spatio-temporal information of the collected data for each of the modalities (RGB, Depth, and Thermal). In this study, fusion strategies (early and late) between modalities were employed to investigate both the suitability of individual modalities and their complementarity.
Another study also extracted facial features using a pre-trained VGG-Face network [12]. Theses features are integrated into an LSTM to deploy the temporal relationships between the video frames. The study of Tavakolian et al. [13] aimed to represent the facial expressions as a compact binary code for classification of different pain intensity levels. They divided video sequences into non-overlapping segments with the same size. After that, they used a Convolutional Neural Network (CNN) to extract features from each segment. From these features, they extracted low-level and high-level visual patterns. Finally, the extracted patterns are encoded into a single binary code using a deep network. In Reference [14], the authors used two different Recurrent Neural Networks (RNN), which were pre-trained with VGGFace-CNN and then joined together as a network for pain assessment. Recent work of Huang et al. [15] proposed a hybrid network to estimate pain. In this paper, the authors proposed to extract multidimensional features from images. They extracted three type of features: spatiotemporal features using 3D convolutional neural networks (CNN), spatial features using 2D CNN, and geometric information with 1D CNN. These features are then fused together for regression. The proposed network was evaluated on the UNBC McMaster Shoulder dataset. Table 1 summarizes the mentioned state-of-the-art works, the corresponding methods, performances, and used databases.

Table 1.
Summary of some previous works on pain estimation.
It appears that many previous works on pain estimation using deep learning are mainly based on transfer learning and fine tuning of VGG-Face. In our present work, we explore five different CNN architectures for studying pain estimation with deep learning. The details are given in the next section.
3. Proposed Framework for Studying Pain Assessment Using Deep Features
Recently, transfer learning is increasingly applied for feature extraction [18], especially in computer vision [19]. It consists of adopting prior knowledge that has been previously learned in other tasks. Our studied models are also heavily based on transfer learning and fine tuning. Our methodology consists of exploring popular and Off-the-Shell CNN architectures, including MobileNet, GoogleNet, ResNeXt-50, ResNet18, and DenseNet-161. We use these networks in two distinct modes: stand alone mode or feature extraction mode. In stand alone mode, the models are fined-tuned and used for directly estimating the pain. In feature extraction mode, the features from 10 different layers are extracted and used as inputs to SVR (Support Vector Regression) and RFR (Random Forest Regression) classifiers. The model automatically extracts the most discriminative facial features from the training data. These features do not necessary have a clear visual interpretation, but they represent parts of the face that are more important for pain discrimination.
The considered 5 models were originally trained on the Imagnet dataset, containing 1000 classes [20]. We adapted these models to our task of pain estimation by replacing the final layer in each network with a fully connected layer with one class instead of 1000 classes. Figure 1 illustrates our proposed methodology.
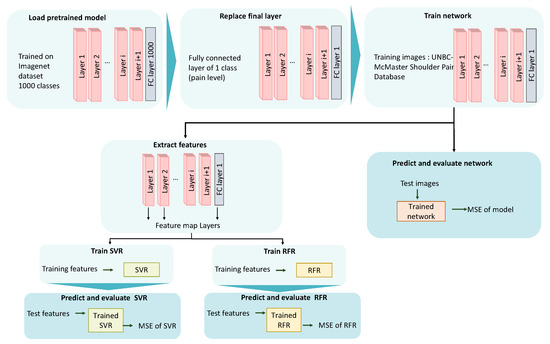
Figure 1.
Proposed framework for pain estimation.
Below, we give a short description of each of the five CNN architectures that we used in our experiments.
- MobileNet_v2 [21] trades off between latency, size, and accuracy, while comparing favorably with popular models from the literature. MobileNet_v2 gives a high accuracy with a Top-1 accuracy of 71.81% in an experiment on ImageNet-1k [20]. The MobileNet_v2 architecture is mainly based on the residual networks and MobileNet_v1 [22]. The main improvement of this architecture is that it proposes an inverted, bottleneck linear transformation of the residual structure. This bottleneck residual block is given in Table 2. In Table 3, we present the architecture of MobileNet_v2 containing the initial fully convolution layer with 32 filters, followed by 19 residual bottlenecks.
Table 2. Bottleneck residual block transforming from k to k channels, with stride s, and expansion factor t, height h, and width w [21].
Table 3. MobileNet_v2 architecture [21].
- GoogleNet [23] achieved top performance in object detection task. It mainly uses the inception module and architecture. It introduced the Inception module and emphasized that the layers of a CNN does not always have to be stacked up sequentially. GoogleNet is one of the winners of ILSVRC 2014 challenge with an error rate of 6.7%. GoogleNet’s architecture is based on inception module, which is shown in Figure 2. Figure 2a presents the naive version of Inception layer. Szegedy et al. [23] found that this naive form covers the optimal sparse structure, but it does it very inefficiently. To overcome this problem, the authors proposed the form shown in Figure 2b. It consists of adding 1 × 1 convolutions [23].
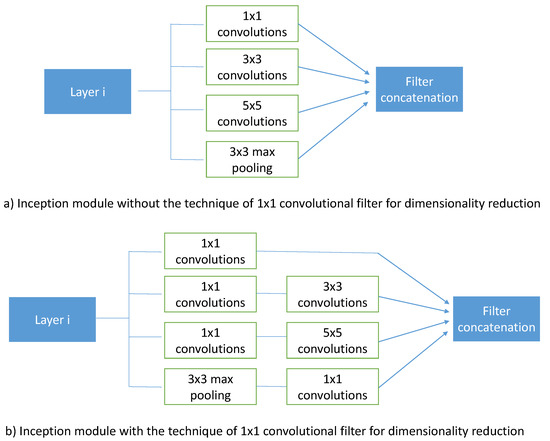 Figure 2. Inception module [23].
 - ResNeXt-50 [24] with a low computational complexity, reaches the highest Top-1 and Top-5 accuracy in image classification tasks [25]. ResNeXt-50 is also the winner of ILSVRC classification challenge. The architecture of ResNeXt-50 is given in Table 4. In our present work, we consider ResNeXt-50 architecture constructed with a template of cardinality = 32 and bottleneck width = 4 d.
Table 4. ResNet18 and ResNeXt-50 architectures [24,26].
- ResNet18 [26] is the winner of the 2015 ImageNet competition with an error rate of 3.57%. We considered ResNet18 for its high performance and low complexity [25]. The model achieves very good results on the Top-1 and Top-5 accuracy on the ImageNet dataset. ResNet18 also achieves real-time performances within a batch-size equal to 1. It can process up to 600 images per second, which makes it a fast model to use. The details of the architecture of ResNet18 are given in Table 4.
- DenseNet-161 [27] looks to overcome the problem of CNNs when they go deeper. This is because the path for information from the input layer until the output layer (and for the gradient in the opposite direction) becomes too large. Actually, DenseNet-161 simplifies the connectivity pattern between the layers introduced in other architectures. It simply connects every layer directly with each other [27]. In our work, we used the pre-trained architecture of DenseNet-161 on the ImageNet challenge database [3]. The architecture of DenseNet-161 is illustrated in Table 5.
Table 5. DenseNet-161 architecture [27].
4. Experimental Analysis
4.1. Experimental Data
For our experimental analysis, we considered the benchmark and publicly available UNBC McMaster dataset. The dataset is composed of 200 sequences of 25 subjects, with a total of 48,398 images. Figure 3 shows some of the images indicated by PSPI. The Prkachin and Solomon Pain Intensity (PSPI) [5] represents the scale for facial expression which is associated to the UNBC McMaster dataset. Imbalanced data is common problem in computer vision and is common in frame-based facial pain recognition, as well [28]. This problem is also present in the UNBC McMaster database. As illustrated in Figure 4, more than 80% of the database has a PSPI score of zero (meaning “no pain”). To overcome this imbalanced data problem, we balance the databaset applying under resampling technique to decrease the no-pain class. The same protocol is used by Bargshady et al. in Reference [10]. While every sequence starts and ends with a no-pain score, we excluded those two parts for every sequence. As a result, a total of 10,783 images were obtained and used in the experiments. Figure 4 illustrates the amount of PSPI for each pain level after data balancing.
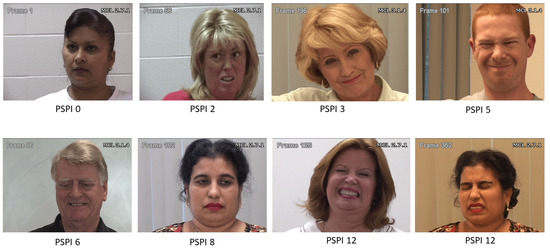
Figure 3.
Sample images from UNBC McMaster dataset [4].
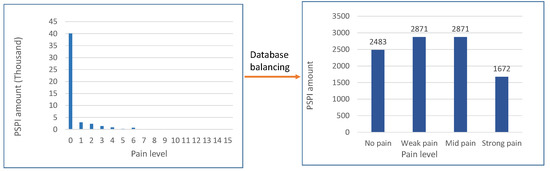
Figure 4.
Amount of PSPI for each pain level on both balanced and imbalanced UNBC McMaster dataset.
4.2. Experimental Setup
For evaluation, we used the Leave-one-subject-out-cross-validation. As the balanced database has the same number of subjects, we obtain 25 feature vectors for each layer. We used data augmentation to further increase the size of the dataset. In all the experiments, we used the MSE (Mean Square Error) as the loss function, and Adam as the optimizer. Moreover, we fixed the number of epochs to 200. This setup was kept similar for all the models through all experiments. To measure the performance of the models, we calculate the Mean Square Error metric. The metric is defined as the sum of squares of prediction errors which is ground-truth (y) value minus predicted value (y) and then divided by the number of data points (N). The formula of the MSE is defined in Equation (1). MSE is used to check how close estimates or predicted values are to actual values. The lower the MSE, the closer it is predicted to the actual. This is used as a model evaluation measure for regression models, and the lower value indicates a better fit.
4.3. Results and Discussion
As already explained above, we used the images from UNBC-McMaster Shoulder Pain Database for the experiments. The images are fed into the feature extraction pipeline of each CNN model. We report the MSE results in stand alone mode (i.e., for the whole model) or feature extractor mode. In stand alone mode, the network (i.e., the model) is used for directly estimating the pain. In feature extractor mode, the features from 10 different layers are extracted and used as inputs to SVR and RFR classifiers.
Figure 5 shows the MSE obtained for each model evaluated after training and testing on the UNBC-McMaster shoulder database. The figure also shows the MSE of both SVR and RFR classfier for each of the 10 layers.
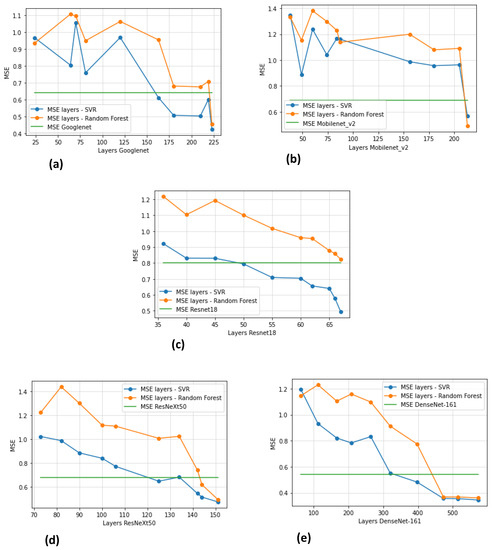
Figure 5.
MSE (Mean Square Error) of pain estimation of each model ((a) GoogleNet, (b) MobileNEt, (c) ResNet18, (d) ResNeXt-50, (e) DenseNet-161) and their corresponding 10 layers when used as inputs to SVR and RFR.
Overall, the best performance (i.e., the lowest MSE) is obtained when using the features from the last CNN layers as inputs to SVR, as can be seen in Table 6. Focusing on the last layers of each model, SVR seems to give better results than RFR. The best performing model is DenseNet-161. This observation is interesting, since DenseNet-161 is the deepest network we utilized. It is worth noting that the performance of the studied models seems to increase with the total number of layers.
Table 6.
Corresponding MSE of the model and the last layer of each model and total layers.
Regarding the computational costs of each model, Table 7 shows the number of parameters, training time, and average test time for each model. The training and testing are calculated based on Leave-one-subject-out-cross-validation on the balanced UNBC McMaster Shoulder dataset. All the experiments were carried out on Pytorch with a NVIDIA Quadro RTX 5000. As precised in Section 4.2, all the networks were trained with 200 epochs, using Adam optimizer. As shown in Table 7, ResNet18 with 11 millions parameters seems to train faster than other models. MobileNet_v2 and GoogleNet have the minimum number of parameters (3.4 and 7 millions) with an acceptable training time. Although DenseNet-161 achieves the best results, it takes over 6 days for training. This can be explained by it large number of parameters (30 millions). Regarding the average test time, we used 100 images from the database for calculation. The average time that it takes for a model to estimate the pain on one single image is shown in the last column of Table 7.
Table 7.
Comparative analysis regarding the computation costs (number of parameters, training time, and average test time) of different models.
For comprehensive analysis, we have also compared the results of our models against the results of the state of the art on the UNBC-McMaster database. The comparative results are given in Table 8. The results show that best performances are indeed obtained when extracting features from the last layer of existing pre-trained architectures. The models using features from the last layers and SVR classifier seem to perform better than some previous works of Bargshady et al. [14], Rodriguez et al. [12], and Tavakolian et al. [9,13]. Although our obtained results are significantly better than many state-of-the-art methods, our results are still not optimal. In fact, Tavakolian et al. [16] reported a very low MSE of 0.32 using a Spatiotemporal Convolutional Network. Moreover, Bargshady et al. [10] achieved an MSE of 0.20.
Table 8.
Comparative analysis using state of the art methods on the UNBC-McMaster database. The indication (star *) precises data balancing is used.
To gain more insights into the behavior of different models, Figure 6 shows the performance of different models at frame level for one video. The figure also shows the ground truth. This figure illustrates how the performance of different models are compared to the ground truth for the pain prediction for each frame. The results confirm, once again, the good performance of all models, especially DensNet-161.
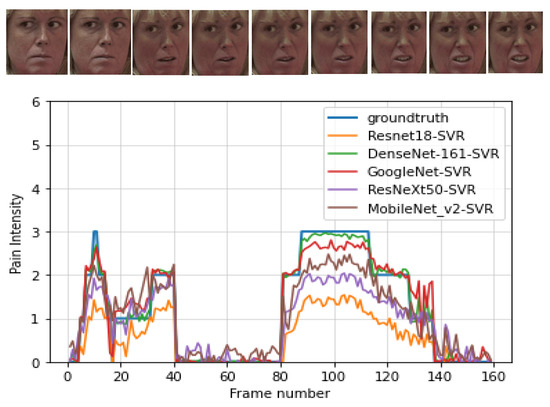
Figure 6.
An example of continuous pain intensity estimation using all the considered CNN architectures on a sample video from the UNBC-McMaster database.
5. Conclusions
In this work, we conducted a comprehensive analysis on pain estimation by comparing some popular and Off-the-Shell CNN architectures, including MobileNet [21], GoogleNet [23], ResNeXt-50 [24], ResNet18 [26], and DenseNet-161 [27]. We used these networks in two distinct modes: stand alone mode or feature extractor mode. Features were extracted from 10 different layers. Predictions were done with SVR (Support Vector Regression) and RFR (Random Forest Regression) classifiers. The results are given in terms of Mean Square Error. We conducted an evaluation with balanced data from UNBC-McMaster Shoulder Pain Database [4]. The database contains 10783 images and consists of 4 pain levels (no pain, weak pain, mid pain, and strong pain). The obtained results indicated the importance of feature extraction from the last layers of pre-trained architectures to estimate pain. Most of the used architectures achieved significantly better results compared to many state-of-the-art methods.
This work is by no mean complete. The conclusions are specific to the considered models and data. It is, therefore, important to validate the generalization of the findings on other databases and other models, as well. To this end, and to support the principle of reproducible research and fair comparison of future works, we plan to release (GitHub, San Francisco, CA, USA (https://github.com/safaa-el/safaa-el), under construction) all the code and material behind this work for the research community. The code will be available by 1 October 2021.
Author Contributions
Conceptualization, A.T.-A. and A.H.; methodology, S.E.M., M.-E.-n.Z., A.H. and A.T.-A.; software, S.E.M. and M.-E.-n.Z.; validation, A.H. and A.T.-A.; formal analysis, S.E.M., A.H. and A.T.-A.; investigation, S.E.M., A.H. and A.T.-A.; data curation, S.E.M. and M.-E.-n.Z.; writing—original draft preparation, S.E.M.; writing—review and editing, A.H., M.-E.-n.Z., A.T.-A., A.R. and A.O.; visualization, S.E.M.; supervision, A.R. and A.T.-A.; project administration, A.R. and A.T.-A. All authors have read and agreed to the published version of the manuscript.
Funding
This research received no external funding.
Data Availability Statement
The used dataset (The UNBC-McMaster Shoulder Pain Expression Archive Database) was obtained after signing and returning an agreement form available from https://sites.pitt.edu/~emotion/um-spread.htm, accessed on 1 July 2019.
Acknowledgments
We thank the Valenciennes Hospital (CHV) for the support.
Conflicts of Interest
The authors declare that there is no conflict of interest.
References
- Adjabi, I.; Ouahabi, A.; Benzaoui, A.; Taleb-Ahmed, A. Past, present, and future of face recognition: A review. Electronics 2020, 9, 1188. [Google Scholar] [CrossRef]
- Bendjillali, R.I.; Beladgham, M.; Merit, K.; Taleb-Ahmed, A. Improved facial expression recognition based on dwt feature for deep CNN. Electronics 2019, 8, 324. [Google Scholar] [CrossRef] [Green Version]
- Krizhevsky, A.; Sutskever, I.; Hinton, G.E. Imagenet classification with deep convolutional neural networks. Adv. Neural Inf. Process. Syst. 2019, 25, 1097–1105. [Google Scholar] [CrossRef]
- Lucey, P.; Cohn, J.F.; Prkachin, K.M.; Solomon, P.E.; Matthews, I. Painful data: The UNBC-McMaster shoulder pain expression archive database. In Proceedings of the 2011 IEEE International Conference on Automatic Face & Gesture Recognition (FG), Santa Barbara, CA, USA, 21–25 March 2011; pp. 57–64. [Google Scholar]
- Prkachin, K.M.; Solomon, P.E. The structure, reliability and validity of pain expression: Evidence from patients with shoulder pain. Pain 2008, 139, 267–274. [Google Scholar] [CrossRef] [PubMed]
- Chen, J.; Chi, Z.; Fu, H. A new framework with multiple tasks for detecting and locating pain events in video. Comput. Vis. Image Underst. 2017, 155, 113–123. [Google Scholar] [CrossRef]
- Lucey, P.; Cohn, J.F.; Prkachin, K.M.; Solomon, P.E.; Chew, S.; Matthews, I. Painful monitoring: Automatic pain monitoring using the UNBC-McMaster shoulder pain expression archive database. Image Vis. Comput. 2012, 30, 197–205. [Google Scholar] [CrossRef]
- Hammal, Z.; Cohn, J.F. Automatic detection of pain intensity. In Proceedings of the 14th ACM International Conference on Multimodal Interaction, Santa Monica, CA, USA, 22–26 October 2012; pp. 47–52. [Google Scholar]
- Tavakolian, M.; Lopez, M.B.; Liu, L. Self-supervised pain intensity estimation from facial videos via statistical spatiotemporal distillation. Pattern Recognit. Lett. 2020, 140, 26–33. [Google Scholar] [CrossRef]
- Bargshady, G.; Zhou, X.; Deo, R.C.; Soar, J.; Whittaker, F.; Wang, H. Enhanced deep learning algorithm development to detect pain intensity from facial expression images. Expert Syst. Appl. 2020, 149, 113305. [Google Scholar] [CrossRef]
- Haque, M.A.; Bautista, R.B.; Noroozi, F.; Kulkarni, K.; Laursen, C.B.; Irani, R.; Bellantonio, M.; Escalera, S.; Anbarjafari, G.; Nasrollahi, K. Deep multimodal pain recognition: A database and comparison of spatio-temporal visual modalities. In Proceedings of the 2018 13th IEEE International Conference on Automatic Face & Gesture Recognition (FG 2018), Xi’an, China, 15–19 May 2018; pp. 250–257. [Google Scholar]
- Rodriguez, P.; Cucurull, G.; Gonzàlez, J.; Gonfaus, J.M.; Nasrollahi, K.; Moeslund, T.B.; Roca, F.X. Deep pain: Exploiting long short-term memory networks for facial expression classification. IEEE Trans. Cybern. 2017. [Google Scholar] [CrossRef] [Green Version]
- Tavakolian, M.; Hadid, A. Deep binary representation of facial expressions: A novel framework for automatic pain intensity recognition. In Proceedings of the 2018 25th IEEE International Conference on Image Processing (ICIP), Athens, Greece, 7–10 October 2018; pp. 1952–1956. [Google Scholar]
- Bargshady, G.; Soar, J.; Zhou, X.; Deo, R.C.; Whittaker, F.; Wang, H. A joint deep neural network model for pain recognition from face. In Proceedings of the 2019 IEEE 4th International Conference on Computer and Communication Systems (ICCCS), Singapore, 23–25 February 2019; pp. 52–56. [Google Scholar]
- Huang, Y.; Qing, L.; Xu, S.; Wang, L.; Peng, Y. HybNet: A hybrid network structure for pain intensity estimation. Vis. Comput. 2021, 1–12. [Google Scholar] [CrossRef]
- Tavakolian, M.; Hadid, A. A spatiotemporal convolutional neural network for automatic pain intensity estimation from facial dynamics. Int. J. Comput. Vis. 2019, 127, 1413–1425. [Google Scholar] [CrossRef] [Green Version]
- Presti, L.L.; La Cascia, M. Boosting Hankel matrices for face emotion recognition and pain detection. Comput. Vis. Image Underst. 2017, 156, 19–33. [Google Scholar] [CrossRef]
- Tan, C.; Sun, F.; Kong, T.; Zhang, W.; Yang, C.; Liu, C. A survey on deep transfer learning. In Proceedings of the International Conference on Artificial Neural Networks, Rhodes, Greece, 4–7 October 2018; pp. 270–279. [Google Scholar]
- Akhand, M.A.H.; Roy, S.; Siddique, N.; Kamal, M.A.S.; Shimamura, T. Facial Emotion Recognition Using Transfer Learning in the Deep CNN. Electronics 2021, 10, 1036. [Google Scholar] [CrossRef]
- Deng, J.; Dong, W.; Socher, R.; Li, L.J.; Li, K.; Fei-Fei, L. Imagenet: A large-scale hierarchical image database. In Proceedings of the 2009 IEEE conference on computer vision and pattern recognition, Miami, FL, USA, 20–25 June 2009; pp. 248–255. [Google Scholar]
- Sandler, M.; Howard, A.; Zhu, M.; Zhmoginov, A.; Chen, L.C. Mobilenetv2: Inverted residuals and linear bottlenecks. In Proceedings of the IEEE Conference on Computer Vision and Pattern Recognition, Salt Lake City, UT, USA, 18–22 June 2018; pp. 4510–4520. [Google Scholar]
- Howard, A.G.; Zhu, M.; Chen, B.; Kalenichenko, D.; Wang, W.; Weyand, T.; Andreetto, M.; Adam, H. Mobilenets: Efficient convolutional neural networks for mobile vision applications. arXiv 2017, arXiv:1704.04861. [Google Scholar]
- Szegedy, C.; Liu, W.; Jia, Y.; Sermanet, P.; Reed, S.; Anguelov, D.; Erhan, D.; Vanhoucke, V.; Rabinovich, A. Going deeper with convolutions. In Proceedings of the IEEE Conference on Computer Vision and Pattern Recognition, Boston, MA, USA, 7–12 June 2015; pp. 1–9. [Google Scholar]
- Xie, S.; Girshick, R.; Dollár, P.; Tu, Z.; He, K. Aggregated residual transformations for deep neural networks. In Proceedings of the IEEE Conference on Computer Vision and Pattern Recognition (CVPR), Honolulu, HI, USA, 21–26 July 2017; pp. 1492–1500. [Google Scholar]
- Bianco, S.; Cadene, R.; Celona, L.; Napoletano, P. Benchmark analysis of representative deep neural network architectures. IEEE Access 2018, 6, 64270–64277. [Google Scholar] [CrossRef]
- He, K.; Zhang, X.; Ren, S.; Sun, J. Deep residual learning for image recognition. In Proceedings of the IEEE Conference on Computer Vision and Pattern Recognition (CVPR), Las Vegas, NV, USA, 27–30 June 2016; pp. 770–778. [Google Scholar]
- Huang, G.; Liu, Z.; Van Der Maaten, L.; Weinberger, K.Q. Densely connected convolutional networks. In Proceedings of the IEEE Conference on Computer Vision and Pattern Recognition, Honolulu, HI, USA, 21–26 July 2017; pp. 4700–4708. [Google Scholar]
- Werner, P.; Lopez-Martinez, D.; Walter, S.; Al-Hamadi, A.; Gruss, S.; Picard, R. Automatic recognition methods supporting pain assessment: A survey. IEEE Trans. Affect. Comput. 2017. [Google Scholar] [CrossRef]
Publisher’s Note: MDPI stays neutral with regard to jurisdictional claims in published maps and institutional affiliations. |
© 2021 by the authors. Licensee MDPI, Basel, Switzerland. This article is an open access article distributed under the terms and conditions of the Creative Commons Attribution (CC BY) license (https://creativecommons.org/licenses/by/4.0/).