Abstract
The current rise in hacking and computer network attacks throughout the world has heightened the demand for improved intrusion detection and prevention solutions. The intrusion detection system (IDS) is critical in identifying abnormalities and assaults on the network, which have grown in size and pervasiveness. The paper proposes a novel approach for network intrusion detection using multistage deep learning image recognition. The network features are transformed into four-channel (Red, Green, Blue, and Alpha) images. The images then are used for classification to train and test the pre-trained deep learning model ResNet50. The proposed approach is evaluated using two publicly available benchmark datasets, UNSW-NB15 and BOUN Ddos. On the UNSW-NB15 dataset, the proposed approach achieves 99.8% accuracy in the detection of the generic attack. On the BOUN DDos dataset, the suggested approach achieves 99.7% accuracy in the detection of the DDos attack and 99.7% accuracy in the detection of the normal traffic.
1. Introduction
Cyberattacks and cybersecurity risks have skyrocketed in new technologies such as cloud computing, fog computing, edge computing, and the Internet of Things (IoT). These assaults are capable of infiltrating computer network-related environments and cloud-based services and causing financial and reputational damage. Network intrusion detection systems (NIDSs) play a significant role in every computer network defense system as they are used to detect and prevent malevolent activities [1,2]. A NIDS detects the presence of malicious or undesired packets or malicious software in a computer network [3,4]. This technique employs real-time traffic monitoring to determine whether or not any unexpected activity exists in the network. An intrusion detection system (IDS) is a tool that can identify or detect invasive activity. In a wider sense, this includes all procedures involved in detecting the illegal usage of network devices, computers, or embedded physical units in Internet of Things [5].
Artificial neural networks (ANNs) have been used in anomaly detection to determine if data behavior is normal or aberrant. With reasonable performance, this network can identify both known and unknown threats. Neural networks allow us to build a system capable of self-learning and detection of previously unknown types of network attacks, in contrast to existing systems based on signature analysis. Another advantage of neural networks is their ability to detect unknown attacks, functioning in a noisy environment, preserving operability with incomplete or distorted data, forecasting user behavior, and the emergence of new attacks. The main advantages of using systems based on neural networks are as follows. 1) The adaptive and flexible algorithms are capable of analyzing data from a network, even if distorted or incomplete. These are important factors as, for example, information is very often subject to random system errors and the ability to process data in a non-linear form will help when several attackers carry out an attack at the same time. 2) The data processing speed is high enough and ensures operability in real time. 3) It can carry out the analysis of attacks and the identification of new ones that differ from those already observed earlier. Early detection of attacks allows us to respond to attacks before irreparable damage is done to the system. Convolutional neural networks (CNNs) have produced outstanding achievements in many detection and recognition tasks—for example, in the proposed fault diagnosis method of hydraulic systems by designing a deep learning (DL) model [6].
Several studies have concentrated on building intrusion, botnet, and malware detection systems based on deep learning networks (DLNs) [7,8,9]. DLN is based on the original ANN design, which features a multilayer structure as well as activation and optimization algorithms. To develop attack detection rules, deep learning-based intrusion detection does not require many attack signatures or a list of typical activities. Through empirical data training, the deep learning model identifies network attacks on its own using a measurable property of a network traffic feature (NTF) that is being observed. Because of their great efficiency and ease of implementation, DL models have steadily been applied to intrusion detection to improve classification classifiers in recent years. When detecting network intrusions in real time, the issue of class imbalance has a significant impact on classification outcomes [10]. Models that exclusively anticipate dominant classes are incapable of identifying lesser classes. Resampling techniques are commonly used to solve class imbalance issues. However, oversampling techniques have their drawbacks. Oversampling can violate the original data. When employing oversampling approaches, training the model may take longer. Inadequate sampling can result in the loss of critical information, affecting the capacity to categorize.
A conventional machine learning-based NIDS consists of four main modules [11]:
- A packet decoder using a sniffing tool intercepts raw network traffic packets, extracts NTFs to represent the packet length, inter-arrival time, flow size, and other network traffic parameters within a specific time-window and sends them as NTF records to the pre-processing module.
- The pre-processing module accepts a set of NTF records and entails procedures for learning-based NIDS, such as feature reduction, transformation, and normalization.
- The purpose of the classifier module is to create a model based on the pre-processed data that distinguishes normal from malicious behavior.
- The detection and recognition module detects malicious instances, sends an alert for action, and then recognizes various types of attack.
In general, NIDS is evaluated using publicly available network anomaly datasets, which include a mix of normal and malicious records and reflect the estimation of NIDS efficiency. Various data pre-processing approaches are used to supply machine learning techniques with adequate NTF record values in order to extract and prepare informative features from these datasets for the classification module. Frequently, after pre-processing, the numerical values of NTF records are used to classify intrusions.
The majority of machine learning experiments include image classification challenges. Their important applications in medical diagnostics, digital photography, and a variety of other fields have urged researchers to develop models that can anticipate the target item with near-perfect accuracy. Transfer learning has shown perfect results not only in image recognition but also in other domains, such as speech recognition and natural language processing.
Our novelty and main idea is to implement a multistage deep learning image recognition system employing transfer learning to detect contemporary malicious behavior (network attack) and to recognize the attack type.
The main contributions of this paper are:
- A novel pre-processing approach for NTFs’ transformation into four-channel (Red, Green, Blue, and Alpha) images for further use in the classifier module to train and test the pre-trained deep learning model;
- The detailed experimental analysis of the proposed pre-processing approach for the deep learning training process using transfer learning for network intrusion detection performed on the classification of various network attack types with UNSW-NB15 and BOUN DDoS datasets;
- Empirical quantification of the attack type recognition and proposed two-stage recognition of NTFs transformed into four-channel ARGB images allows us to achieve an improvement in detection accuracy: 99.8% accuracy in the detection of the generic attack on the UNSW-NB15 dataset, and 99.7% accuracy in the detection of the DDos attack on the BOUN DDos dataset.
2. Related Works
2.1. Publicly Available Network-Based Intrusion Benchmark Datasets
The effectiveness of methods to detect network intrusion is measured by their ability to notice the attack, which necessitates the use of a network dataset that includes both regular and abnormal network traffic. For measuring the accuracy of network attack recognition, benchmark datasets are widely used. A few old benchmark datasets such as KDDCup’99 and NSL-KDD have been regularly employed. However, as network technologies advance and new cybersecurity risks and network attack types emerge, these datasets have become obsolete. Because the two realms have vastly different properties, well-known datasets designed for wired environments will not lead to the development of efficient algorithms for 802.11 contexts. The AWID dataset [12] could be a useful tool for study on different wireless technologies or alternative 802.11 settings because several of the attacks are based on similar concepts. Some of the network-based benchmark datasets were synthetically constructed; in others, network flow data were taken from a carefully controlled environment, making them unrepresentative of real-world network flows. To categorize known attacks in supervised datasets, each observation must be labeled. Unsupervised network intrusion detection aims to detect aberrant network node behavior that could indicate a network intrusion or cyberattack. A summary of the benchmark open access network intrusion datasets is presented in Table 1.

Table 1.
Summary of publicly available benchmark network-based intrusion datasets.
2.2. Methods and Approaches for Network-Based Intrusion Detection
IDS systems strongly depend on the quality of the dataset used for machine learning. There are popular datasets designed for wired environments widely used for machine learning, such as DARPA/KDD Cup99, CAIDA, NSL-KDD, ISCX 2012, ADFA-LD, ADFA-WD, UNSW-NB15, CICIDS2017, Bot-IoT, LITNET-2020 [13]. For handling and analyzing very large volumes of data in real time, the framework [14] used a distributed deep learning model with DNNs that was chosen after a thorough evaluation of its performance against traditional machine learning classifiers on publicly available network-based intrusion datasets such as KDDCup 99, NSL-KDD, Kyoto, UNSW-NB15, WSN-DS, and CICIDS. Using the UNSW-NB15 dataset achieved 0.784 accuracy for binary class classification. For multiclass classification, the achieved accuracy ranged from 0.637 to 0.999.
The most recent real-time big data processing methods for anomaly detection have been reviewed and the issue of identifying abnormalities in real time has been addressed [15,16]. An anomaly occurs when data patterns do not conform to expected behavior. Three types of modes are typically employed in anomaly detection: supervised anomaly detection (classification-based), semi-supervised anomaly detection (models only normal records), and unsupervised anomaly detection (data that do not contain any labeling information). Use of the improved hashing-based Apriori algorithm implemented on the Hadoop MapReduce framework on the KDD dataset [17] achieved accuracy of 98.2% for DOS attacks and accuracy of 96.91% for PRB attacks.
A proposed hybrid real-time protection system (HRSP) for online social networks (OSN) [18] has three components: a user-level security protocol (OSN’s cryptography services) and two classification models (one classifies URLs into Benign, Risk, and Inappropriate classes, and another one classifies content into Benign, Hate speech, and Inappropriate classes). The authors achieved overall accuracy of 93.2% for the URL model and 84.4% for the content model.
A machine learning-based classification module for video streaming traffic as a solution for network systems that demand proper real-time traffic handling was proposed and tested to evaluate whether a network traffic classifier could be built utilizing packet header information [19]. The goal of these experiments was to evaluate the feasibility of a network traffic classifier using packet header information. Despite achieving 90% accuracy with the selected features, the Gaussian Naive Bayes algorithm produced the lowest precision rate of just 66.28% of the Class C samples, which are equally significant for the restoration scheme.
Morfino et al. [20] used supervised machine learning algorithms, i.e., logistic regression (LR), decision tree (DT), random forest (RF), gradient boosted tree (GBT), and linear support vector machine (SVM), for identifying SYN-DOS attacks on IoT systems. Results showed that all the Spark algorithms used resulted in very good identification accuracy of more than 99%. Pan et al. [21] used a K-means approach based on relative density and distance that had a somewhat higher recognition rate than other techniques. The experimental results of the proposed distributed real-time network abnormal traffic detection system showed good high availability and stability. The test results revealed that the Spark Streaming-based network abnormal traffic detection system can detect all types of real-time network abnormal traffic.
2.3. Methods and Approaches for Network Flow Feature Transformation
A common approach to analyzing network flow data is to treat them as time-series data, which are submitted to a recurrent neural network for classification [22]. The Feature as a Counter (FaaC) approach presented in [23] is utilized to provide a functional solution to the challenge of learning from huge heterogeneous datasets. In a particular time interval, it combines and converts multiple data sources (structured or unstructured) of information and their variables into new variables that are just counters of the original ones.
Kim et al. [24] create two kinds of picture datasets. The first is an RGB set with three color channels (Red, Green, and Blue), while the second is a grayscale set with a single channel. An RGB picture is an overlay structure of the three forms of color images that are eventually transformed into an array of M × N × 3 pixels (Figure 1). M and N denote the number of columns and rows, correspondingly. Then, they use a CNN and perform binary and multiclass classification.
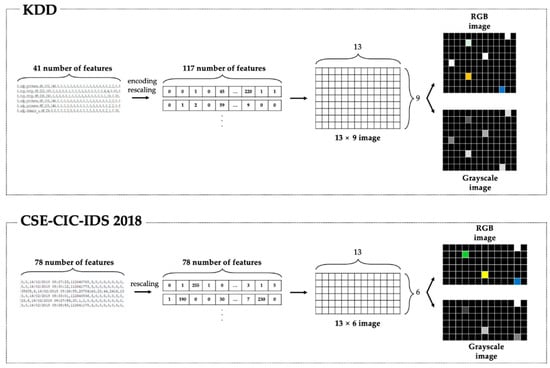
Figure 1.
Kim et al.’s [24] approach for NTF transformation into two kinds of picture datasets.
The experimental results on the KDD dataset show that the RNN model has 99% accuracy in binary classification, almost the same as that of the CNN model. In multiclass classification, the RNN model has accuracy of 100% in smurf detection while the accuracies of the neptune and benign are 80% and 85%, respectively.
Zhang et al. [25] suggested a dynamic multilayer IDS model based on CNN and GcForest. They also suggested a new PZigzag method for converting two-dimensional grayscale pictures from raw data. For initial detection, they employed the improved CNN model (GoogLeNetNP) in a coarse-grained layer. Then, in the fine-grained sheet, gcForest was used to further define irregular groups in N-1 subclasses. The experimental results on the combined UNSW-NB15 and CIC-IDS2017 datasets showed that the model had improved accuracy and recognition rate when compared to other algorithms.
Wang et al. [26] employed CNNs with supervised feature learning to detect malware or botnet traffic from 728-dimensional raw traffic data. Li et al. [27] provided techniques for converting pictures using NSL-KDD data and assessed how CNN models learn transformed incursion data automatically. They discovered that the CNN model was adaptable to data picture modification and may be utilized for intrusion detection approaches.
Potluri et al. [28] first transformed a vector function into an image. The nominal features were one-hot-coded and the dimensions of the features increased from 41 to 464. Then, every 8-byte chunk was converted into a single pixel. The white pixels were lined with 0. The result was that the vector features were converted into 8 × 8 pixel images. Finally, a three-layer CNN was designed to identify the attacks.
Bazgir et al. [29] used a Bayesian version of metric MDS (BMDS) to create a feature map that maintained feature distances in the 2D space. This feature map was used as an image to train a deep neural network. As an alternative, they also employed principal component analysis (PCA) for image generation. Each data sample is represented on a 2D plane and aligned with the first two principal components (PCs) of the data covariance matrix.
A separate research stream focuses on the detection of malware using images constructed from malware features [30]. Many malware feature visualization methods are useful and could be adopted for network intrusion detection as well. Catak et al. [31] used the windowing technique to create 3-channel (RGB) images from malware features.
Ni et al. [32] converted malware codes into grayscale images using the SimHash algorithm. SimHash is a locally sensitive hashing function that assumes that if its input values are similar, then the output values also will be similar. A similar method was also used by Han et al. [33]. Cui [34], who proposed a system that combines CNN and the Bat algorithm to improve model accuracy, also used similar techniques. Their established approach also uses space-filling curves to transform the harmful code into grayscale pictures.
Ren et al. [35] suggested using the Markov Dot Plot (MDP) method to visualize the bi-gram characteristics and associated statistical information of byte sequences such as pixel coordinates and brightness. Every two consecutive bytes in a file are mapped to a pixel on the picture using the technique. In other words, the contents of the two bytes represent the pixel’s x and y coordinates. This conversion function may be thought of as a sliding window scan with a window size of two bytes and a step size of one byte.
Vu et al. [36] encode semantic information as entropy information stored in the green channel of an RGB picture, whereas the red and blue channels store it. They divide byte streams into blocks, compress each byte in the chunks into a few classes, and then compute byte entropy across a sliding window of these chosen blocks. They project the sequence of bytes into a Hilbert curve traversal of the RGB color cube to balance the competing requirements of color difference and byte distance. Sun et al. [37] employ minhash to handle each harmful piece of code. The minhash is a type of locality-sensitive hash that hashes input items so that related items have a high likelihood of mapping to the same output. This hash value in the feature picture means that the pixel grey value at in the image is .
2.4. Transfer Learning for Image Classification and Model Creation
As discussed in Section 2.3, many methods have been proposed to transform NTF records into images. Image classification, object detection, and text analysis are probably the most common tasks in deep learning, which is a subset of machine learning. Image classification models are typically trained using DL models. Image classification is a computer vision problem and is widely and successfully used in some scenarios: facial recognition, medical diagnosis, landmark detection, emotion detection, etc.
If we need to make predictions for a very large, specialized domain with its image classes training a deep network from scratch, we need a large labeled dataset and hundreds of CPU or GPU hours. In such cases, to minimize training time and resources used, the training process using transfer learning reuses knowledge obtained from learning how to solve another related problem [38]. The classification starts the training process by loading a pre-trained model. As shown in Figure 2, the training process consists of two steps: 1) the bottleneck phase and 2) the training phase.
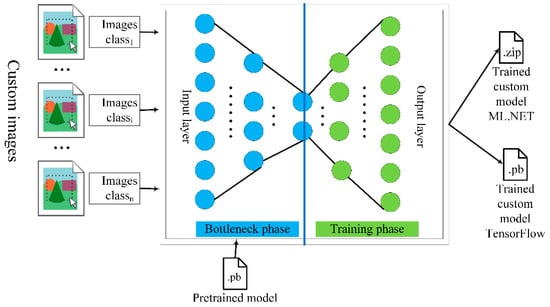
Figure 2.
The training process using transfer learning.
In the bottleneck phase, first, a base network is trained on a pretrained model, and then the learned features are transferred to a second target network (training phase) to be trained on a target dataset. Once the output values from the bottleneck phase have been computed, they are utilized as input to retrain the model’s final layer. This procedure is iterative and repeats as many times as the model parameters specify. The loss and accuracy are calculated for each run. The model is then improved by making the necessary modifications to reduce loss and increase accuracy. The collection of training images is loaded during the bottleneck phase, and the weights of the pretrained model are used. After the training process is completed, two model files are created. One is the Tensor Flow model (pb file), while the other is the ML.NET serialized model (zip file). When working on systems that support ML.NET, it is recommended that the zip version of the model is utilized. If ML.NET is not available in the environment, the pb version can be used instead.
3. Materials and Methods
3.1. Dataset for Proposed Approach Implementation
For our approach, we have selected UNSW-NB15 [39], one of the popular benchmark labeled datasets for supervised machine learning, and it has nine types of attacks:
- Fuzzers—used to crash the applications sending invalid data as inputs;
- Analysis—traffic analysis attacks are based on determining the location of key nodes, the routing structure, and even application behavior patterns;
- Backdoors—used to install the malware through unsecured points left behind after applications’ entry;
- DoS—used for flooding or crashing services;
- Exploits—make use of networks, systems, applications, and hardware vulnerabilities;
- Generic—against a cryptography, primitives attempt to decrypt a ciphertext;
- Reconnaissance—knowledge-gathering including port scanning, ping sweeping, packet sniffing, information queries, social engineering, and phishing;
- Shellcode—takes control of a compromised machine using a set of instructions that executes malicious code;
- Worms—malicious software that can spread across devices within a network through rapid replication.
Every UNSW-NB15 dataset record has 45 features; three features are optional, namely, id (integer record number), attack_cat (nominal name of each attack category, e.g., Analysis, Backdoors, DoS Exploits, Fuzzers, Generic, Reconnaissance, Shellcode, Worms, and Normal), and Label (binary 0 for normal and 1 for attack records). The last 42 features describe a row of NTF records and are used for the recognition of traffic as normal or an attack. Feature names, categories, and types in the UNSW-NB15 dataset are presented in Table 2.
Table 2.
Features, categories, and types in the UNSW-NB15 dataset.
Table 3.
The number of labeled records in UNSW_NB15 training and testing datasets.
3.2. Network Intrusion Detection Using Multistage Deep Learning Image Recognition
The proposed approach for network intrusion detection using multistage deep learning image recognition is depicted in Figure 3.
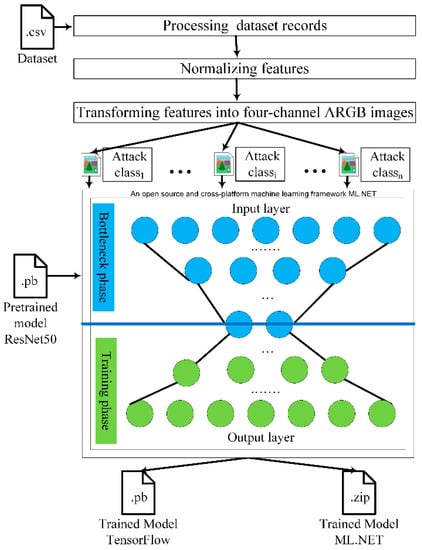
Figure 3.
Proposed approach for network intrusion detection using multistage deep learning image recognition.
Algorithms of stages (see Figure 4) are developed using the C# language. C# supports the predefined integral types; one of them is the unsigned 32-bit integer, which ranges from zero to 4,294,967,295. Because, in our proposed approach, we decided to use the ARGB image format, the unsigned 32-bit integer value can be one-to-one mapped into 4-bytes ARGB image pixels. In assessing the above assumption, all NTF values should be converted into the unsigned 32-bit integer type.

Figure 4.
Algorithm of proposed NTFs’ transformation into four-channel ARGB image.
The first stage is used to process the NTF records from the csv file dataset and to convert and parse the NTF values into C# types. All integer numerical NTFs are parsed into C# unsigned 32-bit integer variables. Categorical NTFs are encoded to integer numerical values and then parsed into C# unsigned 32-bit integer variables.
The second stage, the normalization stage, may be applied or not for float NTFs. Without the normalization rule, we use C# cast expression to perform an explicit conversion from float to 32-bit unsigned integer when the fractional portion of the values is truncated. With the normalization rule, we use our proposed min–max normalization rule with min = 0 and max = 65,535, which, in C#, is as follows:
decimal.TryParse(loadedValues[r, c], NumberStyles.Any, CultureInfo.InvariantCulture, out tempDecimal);
tempDecimal = tempDecimal * 1000000;
tempdecimalMinMax = (tempDecimal − min)/(max − min);
tempUint = (uint)tempdecimalMinMax;
At the third stage, the unsigned 32-bit integer variables processed from NTFs are mapped to the byte array. As a result, from every dataset record, we obtain an array of 168 bytes (42 × 4 = 168), where each of the four bytes represents one ARGB image pixel. The next array of 168 bytes is converted into one four-channel ARGB image that is placed in the directory with the attack name for further ML classification. The corresponding image is created for every record in the dataset.
Finally, we have as many image files as there are records in the dataset, and images are saved in the directories and named according to the attack label. The proposed image transformation process (Figure 5) is applied to the UNSW_NB15 training and testing datasets accordingly.
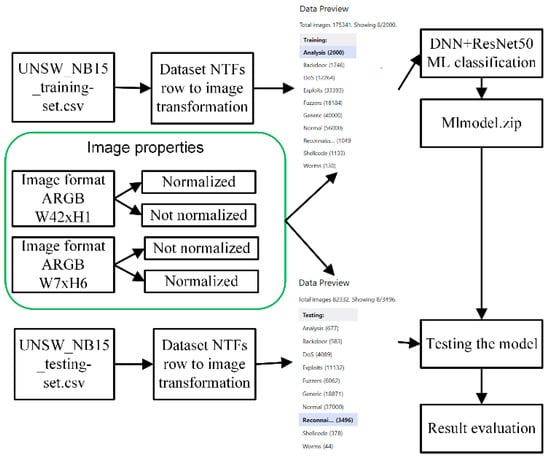
Figure 5.
Proposed image transformation process for network intrusion detection using multistage deep learning image recognition.
In our approach, images have two dimensions:
- W42xH1 image dimension: width 42 pixels and height 1 pixel;
- W7xH6 image dimension: width 7 pixels and height 6 pixels.
The deep-layer variation of the Residual Network 50 (ResNet50) is the pre-trained model utilized in ML.NET. The original model was taught to categorize photos into a thousand different groups. The model takes a 224 × 224 picture as input and outputs class probabilities for each of the classes it has been trained on. A portion of this model is utilized to train a new model that makes predictions between two classes using bespoke images.
4. Experimental Results
4.1. Experimental Settings
The pre-processing application for NTFs’ transformation into four-channel (Red, Green, Blue, and Alpha) images for machine learning is realized in C#. At the pre-processing stage, NTF records from the UNSW-NB15 and BOUN DDoS datasets are transformed into four-channel images using the developed pre-processing application. At the classification stage, machine learning models are trained on the transformed images using Visual Studio 2019 and ML.NET image classification API. All experiments were performed on a desktop computer with 64-bit Windows 10 OS with Intel(R) Xeon(R) CPU E5-2630 v2 @ 2.60GHz (2 processors) with 96GB RAM and NVIDIA GeForce GTX 1650 SUPER.
4.2. Experimental Results Evaluatinon
In all experiments on the UNSW-NB15 dataset to train and create the ML.NET serialized model (Mlmodel.zip), as the training set, we used UNSW_NB15_training-set.csv with 175,341 NTF records, and to test the created model, we used the testing set UNSW_NB15_testing-set.csv with 82,332 records [39]. All NTF records from the UNSW-NB15 dataset were transformed into images using the proposed approach and developed pre-processing application. Images transformed from the training dataset NTF records were saved in the training directory, saving images in the subdirectories named by attack label (see Figure 5). Images transformed from the testing dataset NTF records were saved in the testing directory, saving images in the subdirectories named by attack label (see Figure 5). UNSW-NB15 dataset NTFs record id was used as the image file name. As a result, after the pre-processing stage was completed, a tree directory was created with the transformed images that will be used to train and test the ML.NET serialized models.
For experimental result evaluation, we used a confusion matrix that, in the field of machine learning, permits visualization of the performance of a supervised learning algorithm (in particular, the problem of statistical classification) and a receiver operating characteristic curve (ROC) as a graphical representation that shows how a binary classifier system’s diagnostic performance changes as the discrimination thresholds are changed.
Precision is defined as follows:
Precision = TP/(TP + FP),
The true positive (TP) rate is plotted against the false positive (FP) rate at various threshold values to form the ROC curve.
For confusion matrix representation, we used a standard plot produced using MATLAB function confusionchart. The confusion matrix displays the total number of observations in each cell. The rows of the confusion matrix correspond to the true class, and the columns correspond to the predicted class. Diagonal and off-diagonal cells correspond to correctly and incorrectly classified observations, respectively.
A row-normalized row summary displays the percentages of correctly and incorrectly classified observations for each true class. A column-normalized column summary displays the percentages of correctly and incorrectly classified observations for each predicted class.
4.2.1. Attack Detection on UNSW-NB15 Dataset
In the first scenario for the UNSW-NB15 dataset, we use our proposed normalization rule (see Section 3.2) and NTF transformation into ARGB images with a width of 42 pixels and height of 1 pixel (W42 × H1).
The precision of image recognition transformed from the UNSW-NB15 dataset records is low, which we consider to be because of an imbalance in the various attack types, as shown in Table 4. As an example, in the Worms directory, we have 130 images (according to the number of Worms-labeled records in the UNSW-NB15 training dataset); otherwise, there are 33,393 images in the Exploits directory (according to the number of Exploits-labeled records in the UNSW-NB15 training dataset). Our experimental results show that the precision of image classification on the testing dataset is high only for generic (98%) and normal (88.7%) features. The confusion matrix is depicted in Figure 6, and the ROC curve is depicted in Figure 7.
Table 4.
Precision of recognized images using ML.NET created model on UNSW-NB15 training dataset.
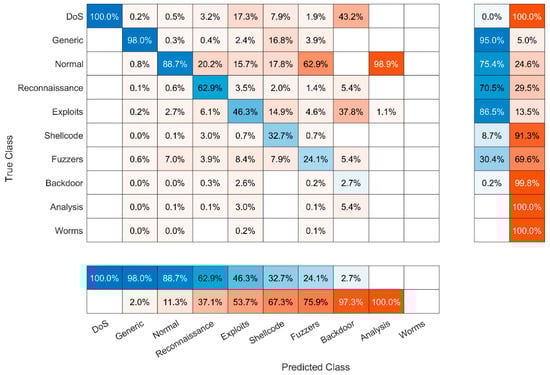
Figure 6.
Confusion matrix of detected attacks using ML.NET created model on UNSW-NB15 training dataset.
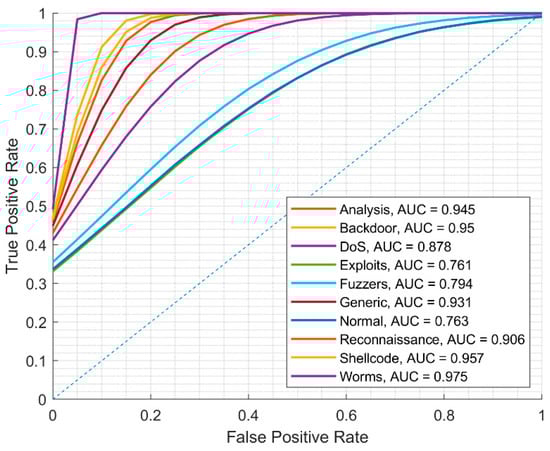
Figure 7.
ROC curve of detected attacks using ML.NET created model on UNSW-NB15 training dataset.
4.2.2. Attack Detection on UNSW-NB15 Dataset Employing Oversampling Approach
In the second scenario for the UNSW-NB15 dataset, we use our proposed normalization rule (see Section 3.2) and NTF transformation into ARGB images with a width of 42 pixels and height of 1 pixel (W42 × H1) employing the oversampling approach. Making image file copies according to the attack directories, we approximately balance the number of images (see Table 5). The precision of image classification on the testing dataset when the ML.NET model was created on the UNSW-NB15 training dataset after employing the oversampling approach remains low. Our experimental results show that the precision is better only for generic (99.3%), normal (92.3%), and Exploits (72.2%) attacks. The confusion matrix is depicted in Figure 8 and the ROC curve is depicted in Figure 9.
Table 5.
Precision of recognized images using ML.NET created model on UNSW-NB15 training dataset employing oversampling approach.
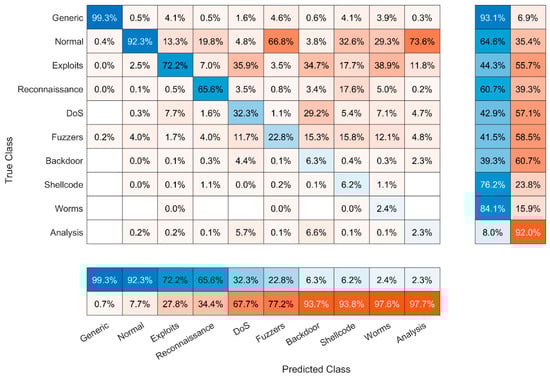
Figure 8.
Confusion matrix of detected attacks using ML.NET created on UNSW-NB15 training dataset employing oversampling approach.
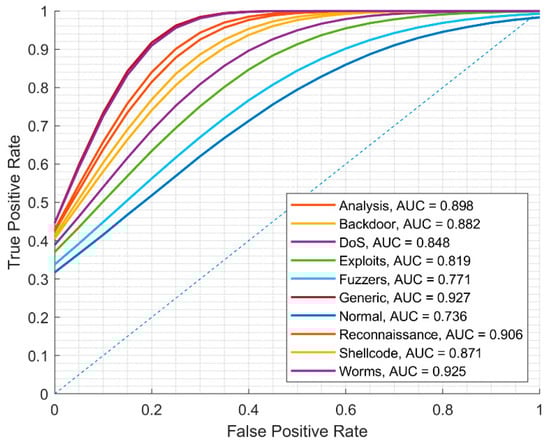
Figure 9.
ROC curve of detected attacks using ML.NET created model on UNSW-NB15 training dataset employing oversampling approach.
4.2.3. Attack Detection on UNSW-NB15 Dataset Employing Binary Classification Approach
In the third scenario for the UNSW-NB15 dataset, we use our proposed normalization rule (see Section 3.2) and NTF transformation into ARGB images with a width of 42 pixels and height of 1 pixel (W42xH1) employing the binary classification approach. Based on the empirical results presented in Section 4.2.1 and Section 4.2.2, we consider that the precision of image classification on the testing dataset when the ML.NET model was created on the UNSW-NB15 training dataset may be distributed and the detection process would require two stages. The first stage is for making decisions from image classification regarding whether there is an attack or whether we have normal traffic, as shown in Table 6. Our experimental results show that precision in such cases is very high for normal (93.4%) traffic features. The confusion matrix is depicted in Figure 10 and the ROC curve is depicted in Figure 11.
Table 6.
Precision of recognized images using ML.NET created model on UNSW-NB15 training dataset employing binary classification.
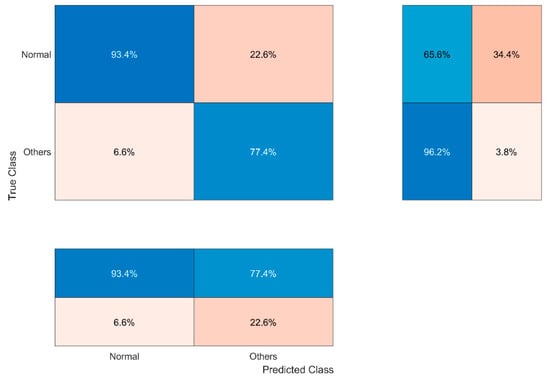
Figure 10.
Confusion matrix of the first stage using ML.NET created model on UNSW-NB15 training dataset employing binary classification.

Figure 11.
ROC curve of the first stage using ML.NET created model on UNSW-NB15 training dataset employing binary classification.
Therefore, we can successfully filter abnormal or attack traffic for the second stage, where the type of attack will be detected. Let us consider that all attack images (and slightly more) were successfully detected.
4.2.4. Attack Type Recognition on UNSW-NB15 Dataset after Attack Was Detected
In the fourth scenario for the UNSW-NB15 dataset, we use our proposed normalization rule (see Section 3.2) and NTF transformation into ARGB images with a width of 42 pixels and height of 1 pixel (W42 × H1), taking into account that an attack was detected and attack type recognition is needed.
Based on the empirical results presented in Section 4.2.3, images that were recognized as an attack proceeded to the second stage for recognition and attack type detection. Our experimental results (see Table 7) show that when detecting a concrete type of attack, the precision of image classification on the testing dataset when the ML.NET model was created on the UNSW-NB15 training dataset is very high for generic attack (99.8%) traffic features. Other types of attack are difficult for recognition; only for Reconnaissance (86%) and Exploits (67.9%) attacks do we have adequate precision for attack type recognition. The confusion matrix is depicted in Figure 12 and the ROC curve is depicted in Figure 13.
Table 7.
Precision of recognized images using ML.NET created model on UNSW-NB15 training dataset for attacks only.

Figure 12.
Confusion matrix using ML.NET created model on UNSW-NB15 training dataset for attacks only.
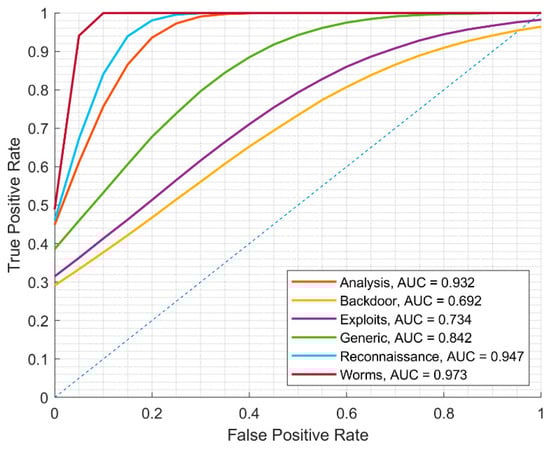
Figure 13.
ROC curve using ML.NET created model on UNSW-NB15 training dataset for attacks only.
4.2.5. DDos Attack Detection on BOUN DDos Dataset
As the experimental results above show, the best attack recognition classification result was achieved using binary classification (attack or not accordingly). We continue our experiment with the newest dataset, BOUN DDoS [40], that has two classes: DDos attack traffic by flooding TCP SYN and attack-free user traffic. This is a good way to test network-based DDoS intrusion detection methods or systems. The dataset-collected attacks are aimed at a single victim server that is connected to the campus’s backbone router. Spoofed source IP addresses were randomly generated in attack packets. Over 4000 active hosts were included in the data trace, which was recorded on the backbone.
The BOUN DDoS dataset has a huge number of NTF records, totaling more than nine million records (total 9,335,605). The training for such a number of images may take a great deal of time, so we randomly select a smaller number of NTF records for the experiment and form two clusters from them. The first cluster contains NTF records for training—19,035 DDos attack traffic NTF records and 39,073 attack-free user traffic NTF records. The second cluster contains NTF records for testing—12,411 DDos attack traffic NTF records and 34,412 attack-free user traffic NTF records. In our experiments on the BOUN DDos dataset to train and create the ML.NET serialized model (Mlmodel.zip), as the training set, we used BOUN_DDos_training-set.csv with 58,108 NTF records, and to test the created model, we used the testing set BOUN_DDos_testing-set.csv with 46,823 records.
Every BOUN DDos dataset record has 12 NTFs; two of them are optional, namely Time (conditional time of row features recorded) and Frame number (the frame number of each row of features recorded). In our approach, the frame number is used as a unique image name. The last ten NTFs describe DDos attack or attack-free user traffic records and are used for recognition. These ten NTFs are as follows: Frame_length, Source_ip, Destination_IP, Source_Port, Destination_Port, SYN, ACK, RST, TTL, TCP_Protocol. For IP addresses, in our approach, we use an encoding practice in which each IPv4 address is mapped to a C# unsigned 32-bit integer variable, and IPv6 addresses are encoded as numerical integer values. Other NTFs, namely SYN, ACK, RST, and TCP_Protocol from categorical values, are encoded as numerical integer values. The normalization rule is not needed on the BOUN DDos dataset NTFs, because all values are in the C# 32-bit unsigned integer range. When the NTFs of all BOUN DDos dataset records are encoded and parsed, each row is transformed into a four-channel ARGB image whose width is ten and height is one.
Based on our empirical results (see Table 8), images successfully were recognized as DDoS attack traffic and as attack-free user traffic. Our experimental results show that when detecting two classes of traffic, precision is very high for DDos attack traffic (99.7%) and attack-free user traffic (99.7%). The confusion matrix is depicted in Figure 14 and the ROC curve is depicted in Figure 15.
Table 8.
Precision of recognized images using ML.NET created model on BOUN DDos training dataset.
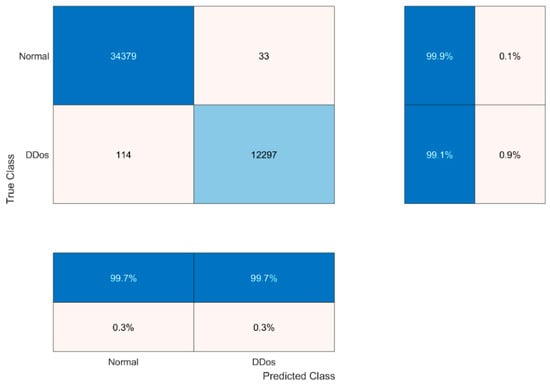
Figure 14.
Confusion matrix of attack recognition using ML.NET created model on BOUN DDoS training dataset.
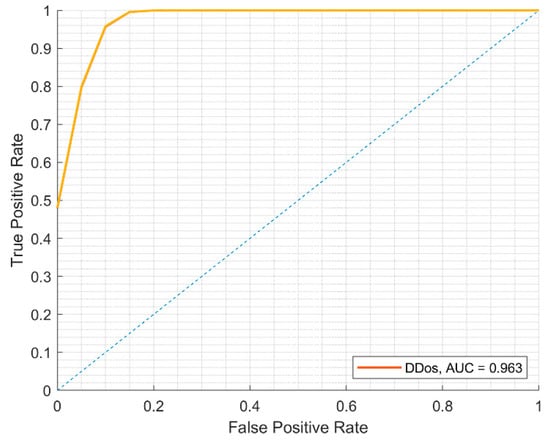
Figure 15.
ROC curve of attack recognition using ML.NET created model on BOUN DDoS training dataset.
4.2.6. Comparison of Intrusion Detection Precision
We evaluate our results against other authors’ results [24] using a DL model for image recognition on the KDD and CSE-CIC-IDS2018 datasets (see Table 9).
Table 9.
Comparison of intrusion detection precision of recognized images using ML.NET created model on UNSW-NB15 training dataset employing oversampling approach.
4.2.7. Summary of Visual Studio 2019 ML.NET Training Classification Results
We use the following evaluation metrics for multiclass classification.
Micro-accuracy computes the average metric by aggregating the contributions of all classes. It is the proportion of properly anticipated cases. The micro-average does not take into account class membership. The accuracy measure is equally weighted for each sample–class pair. If we detect a class imbalance in a multiclass classification task, micro-accuracy is preferred over macro-accuracy. Macro-accuracy is the mean accuracy at the class level. Each class’s accuracy is calculated, and the macro-accuracy is the average of these accuracies. Essentially, each class contributes the same amount to the accuracy metric. Minority classes receive the same amount of attention as the larger classes. The macro-average metric gives each class the same weight, regardless of how many instances of that class are in the dataset. A value as near to 1.00 as possible is ideal. Macro-accuracy calculates the metric separately for each class and then averages the results.
Our experimental results regarding the micro-accuracy and macro-accuracy of the UNSW-NB15 and BOUN DDos training datasets using image classification DNN + ResNet50 with Visual Studio 2019 ML.NET are shown in Table 10. Image dimensions in Table 8 are as follows: W42 × H1 (width 42 pixels, height 1 pixel), W7 × H6 (width 7 pixels, height 6 pixels), W10 × H1 (width 10 pixels, height 1 pixel). Abbreviations in Table 10: NRM—proposed normalization rule applied, Not NRM—proposed normalization rule not applied.
Table 10.
Summary of Visual Studio 2019 ML.NET training classification results.
5. Conclusions
Machine learning is one of the most popular current technologies in the fourth industrial revolution since it allows systems to learn and improve from experience, without having to be explicitly coded. Machine learning methods are being widely used in NIDS. To classify intrusions, publicly available datasets are used with many NTF records. Analyzing related works, we noticed that many authors propose NTF records’ transformation into grayscale and RGB images. Some of them propose various techniques to create image pixels. Where NTFs are transformed into images, the images are then used for ML classification and model creation.
This study offers a unique approach for detecting network intrusions through multistage deep learning image recognition. The network features are converted into four-channel pictures (Red, Green, Blue, and Alpha). The pictures are used to train and evaluate the deep learning model, which has been pretrained. On the benchmark UNSW-NB15 network intrusion dataset, the suggested method in the first stage achieves 93.4% accuracy in the detection of normal traffic. On the benchmark UNSW-NB15 network intrusion dataset, the suggested method in the second stage, when detecting the type of attack, achieves 99.8% accuracy in the detection of a generic attack, 86% accuracy in the detection of a Reconnaissance attack, and 67.9% accuracy in the detection of an Exploits attack. On the benchmark BOUN DDoS network intrusion dataset, the suggested method achieves 99.7% accuracy in the detection of a DDoS attack, and 99.7% accuracy in the detection of normal traffic.
Author Contributions
Conceptualization, A.V., J.T., R.D., Š.G.; formal analysis, J.T., A.V., R.D., N.M.; investigation, Š.G., N.M., E.B.; methodology, J.T., A.V., R.D., N.M., E.B.; project administration, A.V.; resources, Š.G.; software, J.T., E.B.; supervision, A.V.; validation, J.T., Š.G., E.B.; visualization, R.D., N.M.; writing—original draft, J.T., R.D.; writing—review and editing, J.T., R.D., A.V. All authors have read and agreed to the published version of the manuscript.
Funding
This paper is supported in part by the European Union’s Horizon 2020 research and innovation program under Grant Agreement No. 830892, project “Strategic programs for advanced re-search and technology in Europe” (SPARTA).
Conflicts of Interest
The authors declare no conflict of interest. The funders had no role in the design of the study; in the collection, analyses, or interpretation of data; in the writing of the manuscript, or in the decision to publish the results.
References
- Folino, G.; Sabatino, P. Ensemble based collaborative and distributed intrusion detection systems: A survey. J. Netw. Comput. Appl. 2016, 66, 1–16. [Google Scholar] [CrossRef]
- Khraisat, A.; Gondal, I.; Vamplew, P.; Kamruzzaman, J. Survey of intrusion detection systems: Techniques, datasets and challenges. Cybersecurity 2019, 2, 1–22. [Google Scholar] [CrossRef]
- Azeez, N.A.; Odufuwa, O.E.; Misra, S.; Oluranti, J.; Damaševičius, R. Windows PE malware detection using ensemble learning. Informatics 2021, 8, 10. [Google Scholar] [CrossRef]
- Damaševičius, R.; Venčkauskas, A.; Toldinas, J.; Grigaliūnas, Š. Ensemble-based classification using neural networks and machine learning models for windows pe malware detection. Electronics 2021, 10, 485. [Google Scholar] [CrossRef]
- Yong, B.; Wei, W.; Li, K.; Shen, J.; Zhou, Q.; Wozniak, M.; Damaševičius, R. Ensemble machine learning approaches for webshell detection in internet of things environments. Trans. Emerg. Telecommun. Technol. 2020, e4085. [Google Scholar] [CrossRef]
- Huang, K.; Wu, S.; Li, F.; Yang, C.; Gui, W. Fault Diagnosis of Hydraulic Systems Based on Deep Learning Model With Multirate Data Samples. IEEE Trans. Neural Netw. Learn. Syst. 2021, 1–13. [Google Scholar] [CrossRef]
- Alharbi, A.; Alosaimi, W.; Alyami, H.; Rauf, H.T.; Damaševičius, R. Botnet attack detection using local global best bat algorithm for industrial internet of things. Electronics 2021, 10, 1341. [Google Scholar] [CrossRef]
- Wozniak, M.; Silka, J.; Wieczorek, M.; Alrashoud, M. Recurrent neural network model for IoT and networking malware threat detection. IEEE Trans. Ind. Inform. 2021, 17, 5583–5594. [Google Scholar] [CrossRef]
- Hemalatha, J.; Roseline, S.A.; Geetha, S.; Kadry, S.; Damaševičius, R. An efficient densenet-based deep learning model for malware detection. Entropy 2021, 23, 344. [Google Scholar] [CrossRef] [PubMed]
- Bagui, S.; Li, K. Resampling imbalanced data for network intrusion detection datasets. J. Big Data 2021, 8, 1–41. [Google Scholar] [CrossRef]
- Rabbani, M.; Wang, Y.; Khoshkangini, R.; Jelodar, H.; Zhao, R.; Bagheri Baba Ahmadi, S.; Ayobi, S. A Review on Machine Learning Approaches for Network Malicious Behavior Detection in Emerging Technologies. Entropy 2021, 23, 529. [Google Scholar] [CrossRef]
- Kolias, C.; Kambourakis, G.; Stavrou, A.; Gritzalis, S. Intrusion Detection in 802.11 Networks: Empirical Evaluation of Threats and a Public Dataset. IEEE Commun. Surv. & Tutor. 2016, 18, 184–208. [Google Scholar] [CrossRef]
- Damasevicius, R.; Venckauskas, A.; Grigaliunas, S.; Toldinas, J.; Morkevicius, N.; Aleliunas, T.; Smuikys, P. Litnet-2020: An annotated real-world network flow dataset for network intrusion detection. Electronics 2020, 9, 800. [Google Scholar] [CrossRef]
- Vinayakumar, R.; Alazab, M.; Soman, K.P.; Poornachandran, P.; Al-Nemrat, A.; Venkatraman, S. Deep Learning Approach for Intelligent Intrusion Detection System. IEEE Access 2019, 7, 41525–41550. [Google Scholar] [CrossRef]
- Al-Hadhrami, Y.; Hussain, F.K. Real time dataset generation framework for intrusion detection systems in IoT. Future Gener. Comput. Syst. 2020, 108, 414–423. [Google Scholar] [CrossRef]
- Ariyaluran Habeeb, R.A.; Nasaruddin, F.; Gani, A.; Targio Hashem, I.A.; Ahmed, E.; Imran, M. Real-time big data processing for anomaly detection: A survey. Int. J. Inf. Manag. 2019, 45, 289–307. [Google Scholar] [CrossRef] [Green Version]
- Azeez, N.A.; Ayemobola, T.J.; Misra, S.; Maskeliūnas, R.; Damaševičius, R. Network intrusion detection with a hashing based apriori algorithm using hadoop MapReduce. Computers 2019, 8, 86. [Google Scholar] [CrossRef] [Green Version]
- Bani Yassein, M.; Aljawarneh, S.; Wahsheh, Y. Hybrid real-time protection system for online social networks. Found. Sci. 2019, 25, 1095–1124. [Google Scholar] [CrossRef]
- Dias, K.L.; Pongelupe, M.A.; Caminhas, W.M.; de Errico, L. An innovative approach for real-time network traffic classification. Comput. Netw. 2019, 158, 143–157. [Google Scholar] [CrossRef]
- Morfino, V.; Rampone, S. Towards near-real-time intrusion detection for IoT devices using supervised learning and apache spark. Electronics 2020, 9, 444. [Google Scholar] [CrossRef] [Green Version]
- Pan, F.; Han, D.; Hu, Y. Design and application of real-time network abnormal traffic detection system based on spark streaming. Int. J. Embed. Syst. 2019, 11, 562–572. [Google Scholar] [CrossRef]
- Ben Fredj, O.; Mihoub, A.; Krichen, M.; Cheikhrouhou, O.; Derhab, A. CyberSecurity Attack Prediction: A Deep Learning Approach. In Proceedings of the 13th International Conference on Security of Information and Networks, Merkez, Turkey, 4–7 November 2020. [Google Scholar] [CrossRef]
- Magán-Carrión, R.; Urda, D.; Díaz-Cano, I.; Dorronsoro, B. Towards a Reliable Comparison and Evaluation of Network Intrusion Detection Systems Based on Machine Learning Approaches. Appl. Sci. 2020, 10, 1775. [Google Scholar] [CrossRef] [Green Version]
- Kim, J.; Kim, J.; Kim, H.; Shim, M.; Choi, E. CNN-Based Network Intrusion Detection against Denial-of-Service Attacks. Electronics 2020, 9, 916. [Google Scholar] [CrossRef]
- Zhang, X.; Chen, J.; Zhou, Y.; Han, L.; Lin, J. A multiple-layer representation learning model for network-based attack detection. IEEE Access 2019, 7, 91992–92008. [Google Scholar] [CrossRef]
- Wang, Z. Deep Learning-Based Intrusion Detection With Adversaries. IEEE Access 2018, 6, 38367–38384. [Google Scholar] [CrossRef]
- Li, Z.; Qin, Z.; Huang, K.; Yang, X.; Ye, S. Intrusion detection using convolutional neural networks for representation learning. In Neural Information Processing (ICONIP 2017), Lecture Notes in Computer Science; Liu, D., Xie, S., Li, Y., Zhao, D., El-Alfy, E.S., Eds.; Springer: Cham, Switzerland, 2017; Volume 10638, pp. 858–866. [Google Scholar] [CrossRef]
- Potluri, S.; Ahmed, S.; Diedrich, C. Convolutional Neural Networks for Multi-class Intrusion Detection System. Min. Intell. Knowl. Explor. 2018, 225–238. [Google Scholar] [CrossRef]
- Bazgir, O.; Zhang, R.; Dhruba, S.R. Representation of features as images with neighborhood dependencies for compatibility with convolutional neural networks. Nat. Commun. 2020, 11, 4391. [Google Scholar] [CrossRef]
- Mohd Shaid, S.Z.; Maarof, M.A. Malware behavior image for malware variant identification. Int. Symp. Biom. Secur. Technol. (ISBAST) 2014, 238–243. [Google Scholar] [CrossRef]
- Catak, F.O.; Ahmed, J.; Sahinbas, K.; Khand, Z.H. Data augmentation based malware detection using convolutional neural networks. Peer J. Comput. Sci. 2021, 7, e346. [Google Scholar] [CrossRef]
- Ni, S.; Qian, Q.; Zhang, R. Malware identification using visualization images and deep learning. Comput. Secur. 2018, 77, 871–885. [Google Scholar] [CrossRef]
- Han, K.; Kang, B.; Im, E.G. Malware analysis using visualized image matrices. Sci. World J. 2014, 2014. [Google Scholar] [CrossRef] [Green Version]
- Cui, Z.; Xue, F.; Cai, X.; Cao, Y.; Wang, G.; Chen, J. Detection of Malicious Code Variants Based on Deep Learning. IEEE Trans. Ind. Inform. 2018, 14, 3187–3196. [Google Scholar] [CrossRef]
- Ren, Z.; Chen, G.; Lu, W. Malware visualization methods based on deep convolution neural networks. Multimed. Tools Appl. 2020, 79, 10975–10993. [Google Scholar] [CrossRef]
- Vu, D.; Nguyen, T.; Nguyen, T.V.; Nguyen, T.N.; Massacci, F.; Phung, P.H. HIT4Mal: Hybrid image transformation for malware classification. Trans. Emerg. Telecommun. Technol. 2019, 31, e3789. [Google Scholar] [CrossRef]
- Sun, G.; Qian, Q. Deep Learning and Visualization for Identifying Malware Families. IEEE Trans. Dependable Secur. Comput. 2021, 18, 283–295. [Google Scholar] [CrossRef]
- Yosinski, J.; Clune, J.; Bengio, Y.; Lipson, H. How transferable are features in deep neural networks? In Proceedings of the 27th International Conference on Neural Information Processing Systems—Volume 2 (NIPS’14), Montreal Canada, 8–13 December 2014; pp. 3320–3328. [Google Scholar] [CrossRef]
- Moustafa, N.; Slay, J. UNSW-NB15: A comprehensive data set for network intrusion detection systems (UNSW-NB15 network data set). In Proceedings of the 2015 Military Communications and Information Systems Conference (MilCIS), Canberra, Australia, 10–12 November 2015. [Google Scholar] [CrossRef]
- Erhan, D.; Anarım, E. Boğaziçi University distributed denial of service dataset. Data Brief. 2020, 32, 106187. [Google Scholar] [CrossRef] [PubMed]
Publisher’s Note: MDPI stays neutral with regard to jurisdictional claims in published maps and institutional affiliations. |
© 2021 by the authors. Licensee MDPI, Basel, Switzerland. This article is an open access article distributed under the terms and conditions of the Creative Commons Attribution (CC BY) license (https://creativecommons.org/licenses/by/4.0/).