Article

Detection of Malicious Software by Analyzing Distinct Artifacts Using Machine Learning and Deep Learning Algorithms

1
Department of Computer Science and Engineering, SCMS School of Engineering and Technology, Ernakulam 682011, India
2
Department of Computer Science and Engineering, Cochin University of Science and Technology, Cochin 682001, India
3
Institute for Informatics and Telematics, National Research Council of Italy, 56124 Pisa, Italy
4
Department of Medicine and Health Sciences “Vincenzo Tiberio”, University of Molise, 86100 Campobasso, Italy
*
Author to whom correspondence should be addressed.
Electronics 2021, 10(14), 1694; https://doi.org/10.3390/electronics10141694
Submission received: 19 April 2021 / Revised: 7 July 2021 / Accepted: 9 July 2021 / Published: 15 July 2021
(This article belongs to the Special Issue High Accuracy Detection of Mobile Malware Using Machine Learning)

Abstract

:
Malware is one of the most significant threats in today’s computing world since the number of websites distributing malware is increasing at a rapid rate. Malware analysis and prevention methods are increasingly becoming necessary for computer systems connected to the Internet. This software exploits the system’s vulnerabilities to steal valuable information without the user’s knowledge, and stealthily send it to remote servers controlled by attackers. Traditionally, anti-malware products use signatures for detecting known malware. However, the signature-based method does not scale in detecting obfuscated and packed malware. Considering that the cause of a problem is often best understood by studying the structural aspects of a program like the mnemonics, instruction opcode, API Call, etc. In this paper, we investigate the relevance of the features of unpacked malicious and benign executables like mnemonics, instruction opcodes, and API to identify a feature that classifies the executable. Prominent features are extracted using Minimum Redundancy and Maximum Relevance (mRMR) and Analysis of Variance (ANOVA). Experiments were conducted on four datasets using machine learning and deep learning approaches such as Support Vector Machine (SVM), Naïve Bayes, J48, Random Forest (RF), and XGBoost. In addition, we also evaluate the performance of the collection of deep neural networks like Deep Dense network, One-Dimensional Convolutional Neural Network (1D-CNN), and CNN-LSTM in classifying unknown samples, and we observed promising results using APIs and system calls. On combining APIs/system calls with static features, a marginal performance improvement was attained comparing models trained only on dynamic features. Moreover, to improve accuracy, we implemented our solution using distinct deep learning methods and demonstrated a fine-tuned deep neural network that resulted in an F1-score of 99.1% and 98.48% on Dataset-2 and Dataset-3, respectively.

1. Introduction

Malware or malicious code is harmful code injected into legitimate programs to perpetrate illicit intentions. With the rapid growth of the Internet and heterogeneous devices connected over the network, the attack landscape has increased and has become a concern, affecting the privacy of users [1]. The primary source of infection, causing malicious programs to enter the systems without users’ knowledge. Mostly freely downloadable software’s are a primary source of malware, which include freeware comprising of games, web browsers, free antivirus, etc. Largely financial transactions are performed using the Internet, these have caused huge financial losses for organizations and individuals. Malware writing has transformed into profit-making industries, thus attracting a large number of hackers. Current malware is broadly classified as polymorphic or metamorphic, and they remain undetected by a signature-based detector [2].
Malware writers employ diverse techniques to generate new variants that commonly include (a) instruction permutation, (b) register re-assignment, (c) code permutation using conditional instructions, (d) no-operation insertion, etc. Malware analysis is the process aimed to inspect and understand a malicious behavior [3]. Normally malware are analyzed by extracting strings, opcodes, sequence of bytes, APIs/system call, and the network trace.
In this paper, we conduct a comprehensive analysis using multiple datasets by exploiting machine learning and deep learning approaches. Classifiers are trained independently using the static, dynamic feature, and their combinations. We employ dynamic instrumentation tools like Ether [4], a sandbox approach for analyzing malware. In addition, we also make use of sandbox [5]. The motivation behind using the aforesaid sandboxes are to stop side-effects induced to the host environment and to permit malware to exhibit its capabilities, which can be used as features for developing detection models. Ether in particular is based on the application of a hardware virtualization extension, such as Intel VT [6] and resides entirely outside of the target OS environment. In addition to providing anti-debugging facilities, Ether can also be used for software de-armoring dynamically.
Starting from these considerations, we propose a malware detector, exploiting machine learning and deep learning techniques. The experiments were conducted on malware and benign Portable Executables (PE), Android applications, and metamorphic samples created using virus kits. The motivation for using these types of files was arrived at by monitoring the submissions received over the Virus Total [7], a service that performs online scanning of malicious samples. In particular, we consider a set of features obtained from benign and malicious executables like mnemonics, instruction opcodes, and API/system calls for automatically discriminating legitimate and malicious samples. In summary, we list below the contributions of our proposal:
  • Comprehensive analysis of machine learning and deep learning-based malware detection system using four datasets comprising of PE files, collection of ransomware, Android apps, and metamorphic samples;
  • We show that information-theoretic and statistical feature selection methods improve the detection rate of traditional machine learning algorithms. However, the former approach exhibited better results in all cases comparing the statistical approach;
  • Evaluation of classification models on different types of features such as the opcode sequence and API/system calls. Here, we investigate the performance of models trained on independent attribute categories and unifying static and dynamic features. We show that combining static features with dynamic attributes does not significantly improve classifier outcomes;
  • Exhaustive analysis demonstrates an enhanced F1 score generated by deep learning methods on comparing machine learning algorithms. Furthermore, a detailed analysis of code obfuscation on samples developed using virus kits was performed. We conclude that malware kits generate metamorphic variants which employ simple obfuscation transformation easily identified using the local sequence alignment approach. Besides, we show that machine learning algorithms can precisely separate instances generated through virus kits using generic features like an opcode bigram.
The rest of the paper is organized as follows: In the next section we provide an overview about the current state of the art in the malware detection context; in Section 3 we present the proposed method for malware detection; experimental analysis is discussed in Section 4; and, finally, in Section 5 a conclusion and future research plan are presented.

2. Related Work

To highlight the novelty of our work, we examine malware detection techniques topics for which the proposed method is related: The technique for malware detection and classification through machine learning and deep learning algorithms, and other techniques.

2.1. Machine Learning-Based Malware Detection Techniques

Krugel et al. [8] used dynamic analysis to detect obfuscated malicious code using a mining algorithm. Authors in [9] proposed a hybrid model for the detection of malware using different features like byte n–gram, assembly n–gram, and library functions to classify an executable as malware or benign. The work [10] considers the system call subsequence as an element and regards the co-occurrence of system calls as features to describe the dependent relationship between system calls.
Furthermore, the work in [11] extracted 11 types of static features and employed multiple classifiers in a majority vote fusion approach where classifiers such as SVM, k-NN, naive Bayes, Classification and Regression tree (CART), and Random Forest were used. Nataraj et al. [12] consider the Gabor filter and evaluated it on 25 × 86 malicious families. Thus, they built a model using the k-nearest Neighbors approach with Euclidean distance.

2.2. Deep Learning-Based Malware Detection Techniques

Recently in [13], applications were represented in the form of an image to discriminate between malicious and benign applications. The solution considered static features extracted by reverse-engineering the malicious code and encoding it by SimHash. The DroidDetector tool [14] discriminates between legitimate and malicious samples in an Android environment by exploiting a deep learning network, relying on required permissions, sensitive APIs, and dynamic behaviors features. A deep convolutional neural network for malware detection is proposed by McLaughin et al. [15], starting from the analysis of raw opcode sequence obtained by a reverse engineering Android applications. MalDozer [16] is a tool aimed at Android malware detection and family identification by analyzing API method calls. Furthermore, the study in [17] proposes a malware detector focused on the Android environment, aimed to discriminate between malicious and legitimate samples and to identify malware belonging to the family.

2.3. Malware Detection Using Other Techniques

API calls have been used in the past for modeling program behavior [18,19] and for detecting malware [20,21]. This paper relies on the fact that the behavior of malicious programs in a specific malware class differs considerably from programs in other malware classes and benign programs. Sathyanarayan et al. [22] used static extraction to extract API calls from known malware to construct a signature for an entire class. In [23], authors use static analysis to detect system call locations and run-time monitoring to check all system calls made from a location identified during static analysis.
Damodaran et al. [24] compared malware detection techniques based on static, dynamic, and hybrid analysis. Authors in [25] used Hidden Markov Models (HMMs)to represent the statistical properties of a set of metamorphic virus variants. The metamorphic virus data set was generated from metamorphic engines: Second Generation virus generator (G2), Next Generation Virus Construction Kit (NGVCK), Virus Creation Lab for Win32 (VCL32), and Mass Code Generator (MPCGEN). Vinod et al. [26] proposed a method to find the metamorphism in malware constructors like NGVCK, G2, IL_SMG, and MPCGEN by executing each malware sample in a controlled environment like QEMU and monitoring API calls using STraceNTX. Suarez-Tangil et al. [27] focus their efforts to discern malicious components from the legitimate ones in repackaged Android malware. They consider control flow graphs generated from code fragments of the application under analysis. They highlight that most research papers on Android malware detection are focused on outdated repositories, such as the MalGenome project [28] and the Drebin [29] datasets.
DroidScope [30] uses a customized Android kernel to reconstruct semantic views to collect detailed application execution traces. An approach aimed at detecting Android malware families was presented in [10,31]. The method is based on the analysis of system calls sequences and is tested obtaining an accuracy of 97% in mobile malware identification using a 3-gram syscall as a feature. Android malware detection exploiting a set of static features was addressed in [32]. Unsupervised machine learning techniques were used to build models with the considered feature set, statically obtained from permission invocations, strings, and code patterns. Furthermore, the Alde [33] framework employs static analysis and dynamic analysis to detect the actions of users collected by analytics libraries. Moreover, Alde analyses gives insight into what private information can be leaked by apps that use the same analytics library. Casolare et al. [34] also focused on the Android environment by proposing a model checking-based approach for detecting colluding between Android applications. A comparison of existing techniques is given in Table 1.

3. Proposed Methodology

In the following subsections, we discuss our proposed methods for detecting malicious files. We prepare four datasets (a) the first dataset (dataset-I) comprises malicious executables collected from VX-Heavens [35] along with legitimate files, (b) the second dataset (dataset-II), which is the collection of malicious files including ransomware’s downloaded from virusshare [36] along with goodware gathered from diverse sources finally, (c) malicious Android applications acquired from the Drebin project [37] and benign apks (dataset-III), and (d) synthetic malware samples created using virus generation kits. To improve readability, we present the expansion of abbreviations and meaning of symbols in abbreviations and mathematical symbols.
To predict unknown samples, we used malwares from a collection of sources such as the VX Heavens repository [35], ransomware downloaded from virusshare [36], synthetic malware samples created using a virus kit, and malicious Android apps. Additionally, we gathered legitimate samples from diverse sources. The generation of feature space of features like mnemonic, instruction opcode, API calls [38], and 4-gram mnemonic are extracted after unpacking the files. The basic idea of dynamic analysis is to monitor the program while in execution. Dynamic analysis of malware needs a virtual environment to avoid infection on the host system. We thus used different types of sandboxes each for a different dataset. For VX-Heavens samples, the executable files were made to run on a hardware virtualized machine such as Xen [39]. The advantage of using an emulator is that the actual host machine is not infected by the viruses during the dynamic API tracing step. Ransomware dataset were analyzed in the Parsa sandbox [5] which hooks the API calls to provide the requested resources to the executable matching an environment condition. Finally, malicious Android apps were executed in an emulator and system call traces were logged using strace utility and each application was subjected to random events such as clicks, swipes, change of battery level, update of geo-location, etc.
API Call tracing requires that the samples are unpacked or unarmored, as explained earlier since the packers generally try to destroy the import table [40] of the malware or benign program. To unpack samples, we used Ether patched XEN. Ether patched XEN is transparent to malware. Hence the anti-debugging techniques like Virtual Machine Detection [4], Debugger Detection (IsDebuggerPresent() API Call, EFLAGS bitmask) and Timing Attacks (analyzed values of RDTSC before and after) could be avoided due to a hardware virtualized environment. We have used XEN as a virtual environment running on top of Debian Lenny (Debian 5.0.8). Xen is a generic and open source virtualizer. XEN achieves near native performances by executing the guest code directly on the host CPU. In our process, we followed these steps:
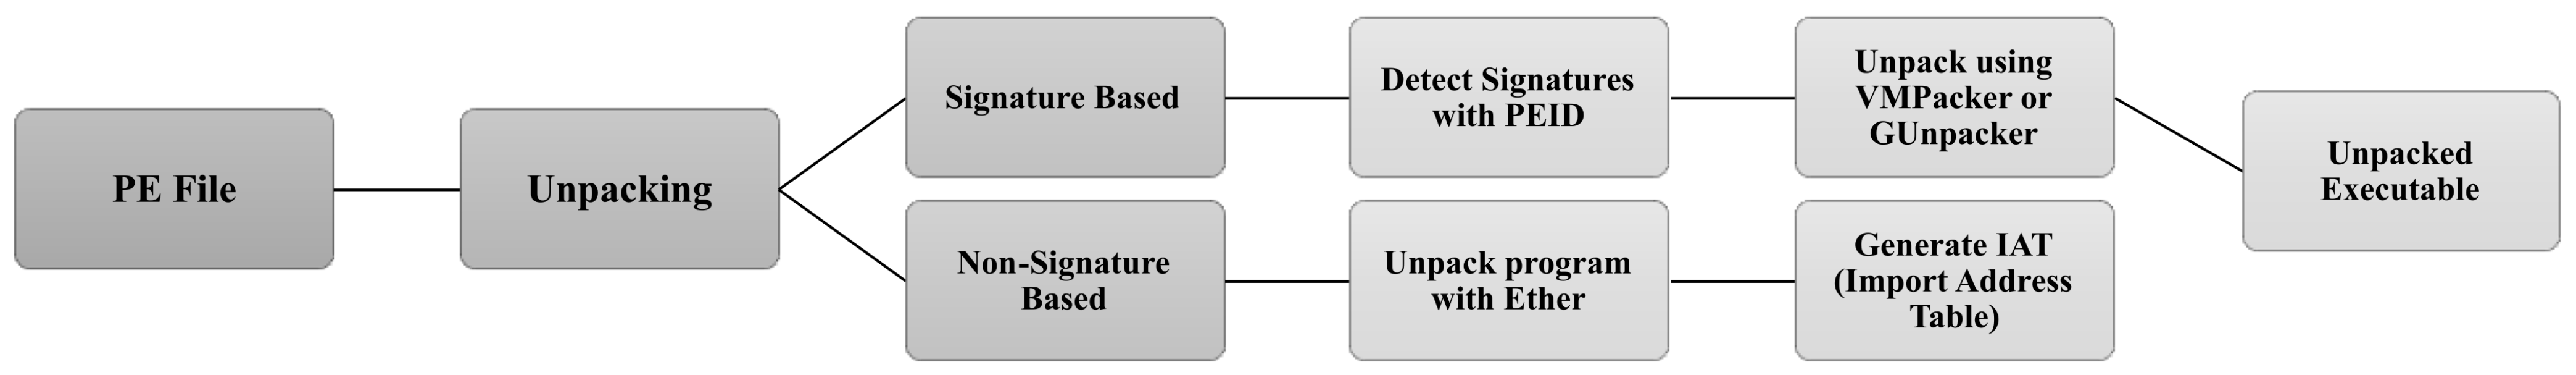
  • Disk Image Creation: We created a disk image, this disk image works as a separate hard disk;
  • Windows XP Installation: Once the disk image was created, we installed Windows XP on that disk image. We chose Windows XP Service Pack 2 as most of the viruses, written for Windows environments only. Another reason to choose Windows XP Service Pack 2 is that the ether patched version of Xen has been tested with XP SP2 as guest OS and Debian Lenny as host OS;
  • Running Ether Patched Xen: Once we have installed the Operating System on Ether patched XEN, we run the machine using the vncviewer [41];
  • Unpacking using Ether Patched Xen: To analyze the malware dynamically, the malware is executed on the DomU machine (XP SP2) and its footprints are recorded on the Dom0 system (Debian Lenny).
Ether dumps the sample by finding the Original Entry Point using the memory writes a program does. The dumped sample could be found in the images directory of ether. Once we have unpacked malware samples, they execute in an emulated environment and API tracing achieved using  Veratrace.

3.1. Software Armoring

Software armouring or executable packing, as shown in Figure 1, is the process of compressing/encrypting an executable file and prepending a stub that is responsible for decompressing/decrypting the executable for execution [42,43]. When execution starts, the stub will unpack the original executable code and transfer control to it. Today most malware authors use packed executables to hide from detection. Due to software armoring, malware writers can defeat malicious applications from detection.
Before beginning with the analysis of the malware, we should check whether the malware is armored or not. We use Ether as a tool for de-armoring since it is not signature-based and also due to its transparency to malware. Ether detects all the writes to memory a program does and dumps the program back in the binary executable form. It creates a hash-table for all the memory maps, and whenever there is a write to a slot in the hash table, it reports that as the Original Entry Point, which is the starting point of execution of a packed executable.

3.2. Feature Extraction

In our approach, we used API calls (dynamic malware analysis), and mnemonic/opcode, instruction opcode, and 4-gram mnemonic (static malware analysis). The process of feature extraction is briefly explained in Figure 2. To extract these features the various open-source tools used are listed below:
  • API Call tracing using Veratrace. Veratrace is an Intel PIN-based API call tracing program for Windows. This program can trace API calls of only de-armored programs obtained from Ether. The output of Veratrace is parsed, and each executable is represented in the form of a vector. The collection of vectors of all applications is represented in the form of a two-dimensional matrix referred to us as the Frequency Vector Table (FVT) of API traces;
  • Mnemonics and instruction opcode are extracted using ObjDump [44]. A custom-developed parser transforms the sample to FVT of mnemonics and instruction opcode.
In the following paragraphs, we briefly introduce the features extracted from malware and legitimate executables.

3.3. API Calls Tracing

The Windows API, informally WinAPI, is Microsoft’s core set of application programming interfaces (APIs) available in the Microsoft Windows operating systems. In Windows, an executable program to perform its assigned work needs to make a set of API calls. For example, for file management, some of the API calls are OpenFile: Creates, opens, reopens, or deletes a file; DeleteFile: Deletes an existing file; FindClose: Closes a file search handle that is opened by FindFirstFile, FindFirstFileEx, or FindFirstStreamW function; FindFirstFile: Searches a directory for a file or subdirectory name that matches a specified name; and GetFileSize: Retrieves the size of a specified file, in bytes. Thus no executable program can run without the API calls. Hence, the API calls made by an executable is a good measure to record its behavior.
To extract APIs, we use Veratrace an API Call Tracer for Windows. It can trace all calls made by a process to the imported functions from a DLL. For extracting APIs, Veratrace mandates unpacking the samples. If packed, the import table would be populated with API calls like GetProcAddress() and LoadLibrary(), which are also common to legitimate executables. We have designed a parser to parse all the traces and filter out API names without argument, which is considered a feature in our work.

3.4. Mnemonic, Instruction Opcode, and 4-Gram Mnemonic Trace

We performed static analysis using the open-source ObjDump tool to obtain assembly language code. From these files, mnemonics, instruction opcode, and 4-gram mnemonic are extracted. An independent parser is developed to filter out mnemonics and instruction opcodes.
Each file is represented in the form of a vector, where the elements of the vector are the occurrence of an attribute. Since attribute values have different ranges, we normalize the data to a common scale. In our approach, we utilized a standard scalar approach “ZScore”. Besides, the normalized feature space is then discretized into three bins and used as an input to the Minimum Redundancy Maximum Relevance (mRMR) feature selection algorithm.

3.5. Feature Selection

In earlier studies, it has been reported that the feature selection is an integral component [45] in a machine learning pipeline. Many feature selection algorithms have been designed specifically for the application domain, furthermore every algorithm uses different criteria (such as information gain, Gini index, etc.) for extracting prominent attributes. In the presence of irrelevant features, the detection model learns complex hypothesis functions, and learning models cannot generalize in identifying a new sample. Fundamentally, the role of a feature selection approach is to extract a prominent subset of attributes to improve classifier performance. The advantages of feature selection are listed below:
  • Dimension reduction to haul down the computational cost;
  • Reduction of noise to boost the classification accuracy;
  • Introduce more interpretable features that can help identify and monitor the unknown sample.
We observe that the initial feature space obtained contained irrelevant attributes. By irrelevance, we mean set of feature which cannot identify a class and can never influence detection. In particular, these attributes appear equally in all samples of the target class. As a result, we selected discriminant features using maximal statistical dependency criterion based on mutual information known as Minimum Redundancy Maximum Relevance (mRMR), and by comparing means of two or more features using the ANOVA [46] as shown in Figure 3.
The training process can be either supervised, unsupervised, and semi-supervised. Supervised feature selection determines feature relevance by evaluating the correlation of attributes with the class. As our training data is labeled, we used supervised feature selection algorithms and filter methods to determine the correlation of the features with the class label. Using Filter methods, features are selected based on their intrinsic characteristics, their relevance, or controlling power concerning the target class. Such methods are based on mutual information, statistical test (t-test, F-test). A feature can become redundant due to the existence of other large volumes of relevant attributes in the feature space.

3.5.1. Minimum Redundancy Maximum Relevance

Maximum relevance criteria select features that highly correlated to the target class. mRMR is a filter method demanding the feature space to be discretized into states. However, this feature set is not a comprehensive representation of the characteristics of the target variable due to two essential aspects, as cited in [47]:
  • Efficiency: If a feature set of 50 samples contains many mutually highly correlated features, the representative features are very few, say 30, which means that 20 features are redundant, increasing the computational cost;
  • Broadness: According to their discriminative powers, we select some attributes, but such feature space is not maximally representative of the original space covered by the entire data set. The feature set may represent one or several dominant characteristics of an unknown sample, but it could also be a narrow region of relevant space. Thus the generalization ability could be limited.
To expand the representative power of the attribute set features while maintaining minimum pair-wise correlation, the minimum redundancy criterion supplements the maximum relevance criteria such as mutual information with target class. The mutual information of two features x and y is defined as the joint probabilistic distribution P(x,y) and their respective marginal probabilities P(x) and P(y) (refer to Equation (1)).
I ( x , y ) = i , j S P ( x i , y j ) log P ( x i , y j ) P ( x i ) P ( y j ) ,
where x, y is the feature, namely mnemonic, instruction opcode, api call, 4-gram mnemonic, P ( x i , y j ) is the joint probabilistic distribution of feature x and y, P ( x i ) , P ( y j ) are the marginal probabilities, I ( x , y ) is the mutual information between feature x and y, i indicates the level or state of feature x and j indicates the state of feature y, and S is the set obtained from cross product of set of states of x and y. Subsequently, we compute the relevance and redundancy value of attributes discussed below.
  • Relevance value of an attribute x, V ( x ) is computed using Equation (2):
    V ( x ) = I ( h , x ) ,
    where h is the target variable or class, I ( h , x ) is the mutual information between class and feature x.
  • Redundancy value, W ( x ) of feature x is obtained using Equation (3):
    W ( x ) = j N I ( y j , x ) ,
    where N is the total number of attributes, I ( y j , x ) is the mutual information of features y j and x respectively.
Using Equations (2) and (3), minimum redundancy and maximum relevance of an attribute is computed, which is discussed below:
  • Mutual Information Difference (MID): Is defined as the difference between the relevance value ( V ( x ) ) and the redundancy value ( W ( x ) ). To optimize the minimum redundancy and maximum relevance criteria, the difference between the relevance and redundancy value (see Equation (4)) was computed.
    M I D ( x ) = V ( x ) W ( x ) ,
    Hence, the feature with maximum M I D value indicates the mRMR feature;
  • Mutual Information Quotient (MIQ): Is obtained by dividing the relevance value with the redundancy value, thus optimizing the mRMR criteria (refer to Equation (5)):
    M I Q ( x ) = V ( x ) W ( x ) + 0.001 .
Hence, the feature with a maximum M I Q value indicates the mRMR feature. Our approach use both these criteria, i.e.,  M I D and M I Q , for selecting features, and compare classifier performance trained on the set of M I D and M I Q attributes.

3.5.2. Analysis of Variance

Analysis of Variance (ANOVA) is a statistical method to compare the means of two or more groups. Depending upon the features and the level of features, ANOVA can be classified as follows:
  • One way ANOVA: Requires one feature with at least two levels such that the levels are independent;
  • Repeated Measures ANOVA: It commands one feature with at least two levels such that the levels are dependent;
  • Factorial ANOVA: This approach demands two or more features, each of which with at least two levels either dependent, independent, or mixed.
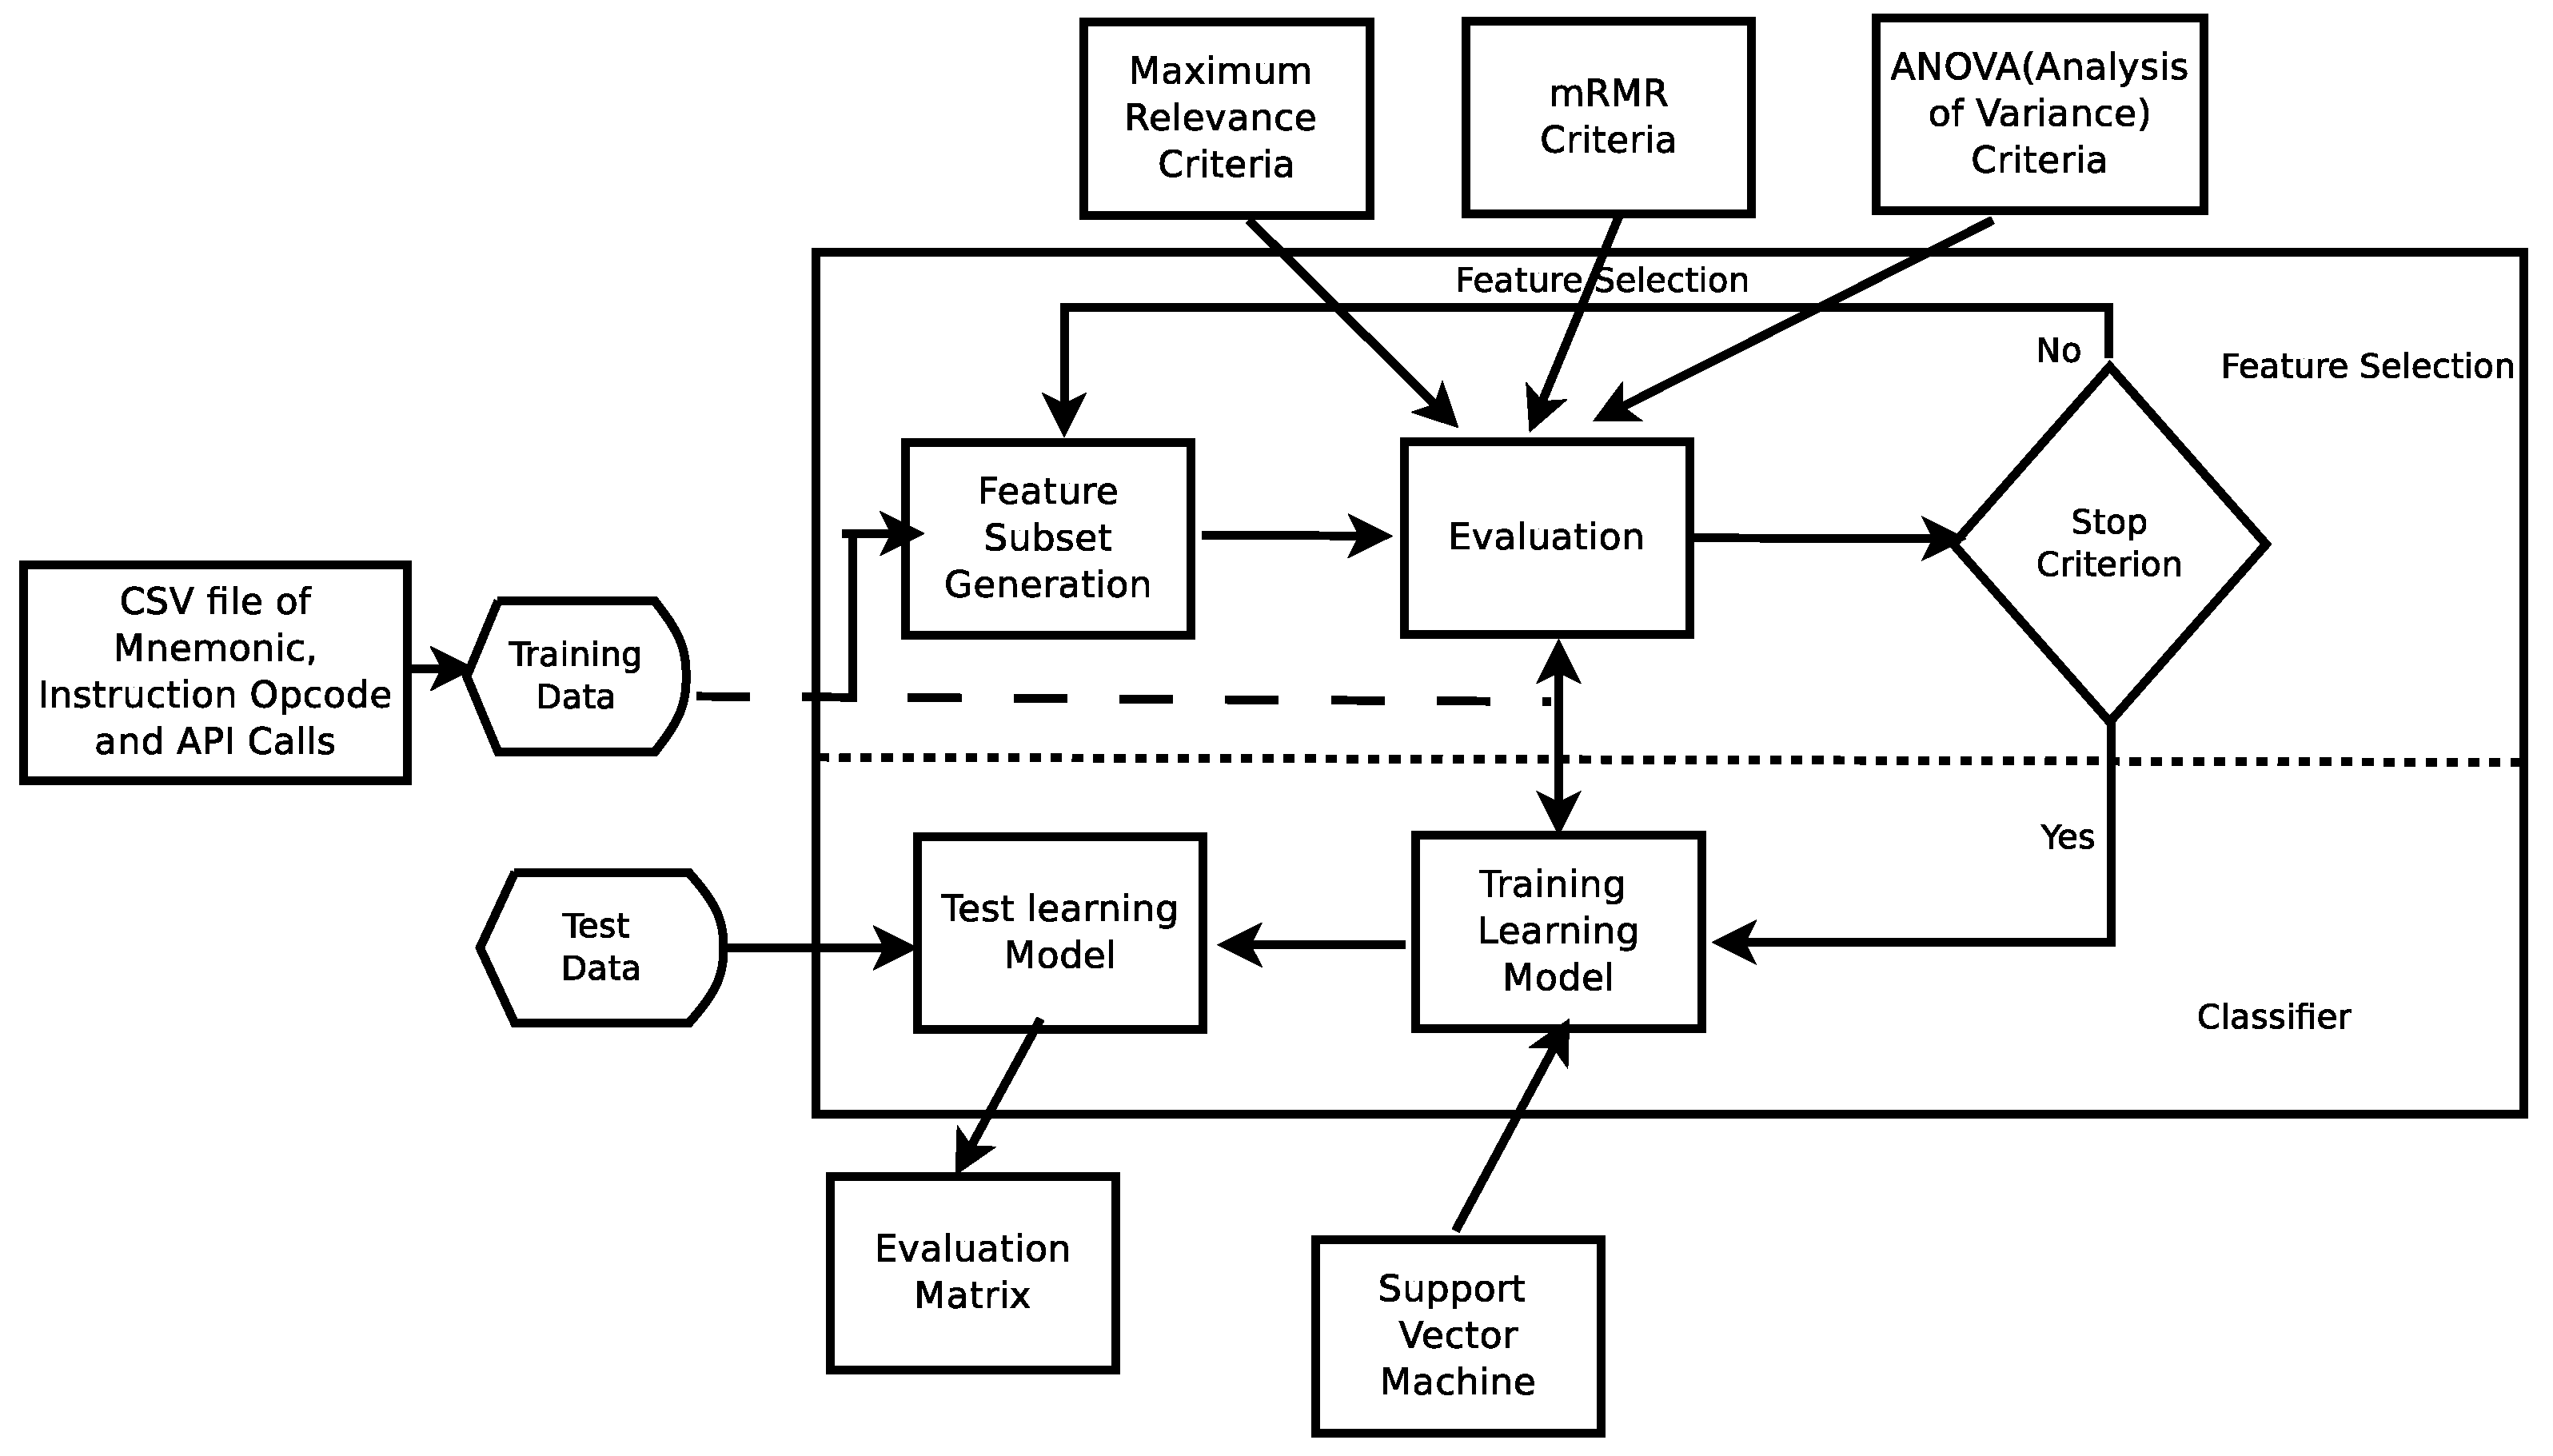
Our proposed approach uses factorial ANOVA criteria for feature selection. In doing so, attributes highly correlated to the target class are determined. In particular, using ANOVA we estimate the impact of one or more independent variables on the dependent variable (i.e., class label). Feature influence is computed using variance, furthermore, it indicates separability between the class. Specifically, if the variance of an attribute is low then it has less impact on the target class. Using ANOVA, we choose a subset of independent variables having a stronger affinity towards classes. Generally, Post Hoc tests such as “F” statistics is performed to analyze the results of experiments. “F–Statistic” has its tailed distribution and is always positive. Variation in data can be due to two critical aspects (a) variation within the group and (b) variation between the group. Prominent features are derived using the procedure discussed below:
S S T p = S S B p + S S W p ,
where S S T is the total sum of squares of feature p.
S S T p = i = 1 k j = 1 l ( X i j μ p ) 2 ,
Here, k is the number of classes (malware/benign), l is the number of states of feature p,
μ p = 1 k l i = 1 k j = 1 l X i j ,
μ p is the mean of frequencies of feature p.
S S W p = i = 1 l j = 1 k ( X j i μ i p ) 2 ,
where S S W p is the sum of squares of within the group of feature p, and μ i p is the mean of frequencies of feature p in i th discretization state.
D F W p = ( k l ) p l p ,
where D F W p is the degree of freedom of feature p within the group, and ( k l ) p is the number of observations of feature p, l p is the number of samples of feature p:
D F B p = l p 1 ,
where D F B p is the degree of freedom of feature p between the group. Finally, FScore is defined as:
F ( D F B p , D F W p ) = ( S S B P / D F B P ) ( S S W P / D F W P ) .
Eventually a feature p, with the highest FScore is selected as a candidate member of the feature set.

3.6. Classification

A classification is a form of data analysis that can be used to extract models describing classes. It predicts categorical (discrete, unordered) labels. In our work, we utilized various machine learning and deep learning algorithms, such as Support Vector Machine (SVM) [45,48], Naïve Bayes [49], J48 [50], Random Forest (RF) [51], and XGBoost [52]. In addition, we also evaluate the performance of the collection of deep neural networks like the Deep Dense network, One-Dimensional Convolutional Neural Network (1D-CNN) and CNN-LSTM in classifying unknown samples. The hyperparameters of all deep neural networks were tuned using the random search cross-validation approach. The above-mentioned classification algorithms were chosen as they have been extensively used in prior research work, and a subset of these classifiers have demonstrated to produce improved detection of unknown malware files [53,54,55].
In real-world applications, the size of the dataset is massive, data appears in a different form. The shallow network has a limited generalization capability. For obtaining better results, the shallow networks must be presented with features that are handpicked or suitably chosen after several iterations of the feature selection algorithms. Thus, the entire process is computationally expensive, also error-prone if attributes are extracted by humans. In contrast, deep neural networks employ a myriad of hidden layers, with each layer consisting of many neurons. Each neuron act as a processing unit to output complex features of input data. The lower layers extract features that are gradually amplified in the subsequent layers (higher layers). A deeper layer derives important aspects of the input data by omitting irrelevant details needed for classification. Thus, deep networks does not require feature extraction from scratch. In general, classification is a two step process as discussed below:
  • In the first step, we built a classifier describing a predetermined set of classes or concepts, also known as the learning step (or training phase). In this stage, a classification algorithm builds the classifier by analyzing or learning from a training set and their associated class labels. A tuple or feature, X, is represented by an n-dimensional attribute vector, X =   A 1 & A 2 & A n , where, n depicts measurements made on the tuple from n database attributes, respectively, A 1 , A 2 ,…, A n . Each tuple, X, is assumed to belong to a predefined class determined by the class label. The labels corresponding to the class attribute is discrete valued and unordered. The individual tuples making up the training set are referred to as training tuples and are randomly selected from the dataset. The class label of each training tuple is known to the classifier already, thus this approach is known as supervised learning;
  • In the second step, we use the classification model and predict the test data. This reserved set of samples is never used in the training phase. Eventually, the performance of the model on a given test set is estimated, generally evaluated as the percentage of test set tuples that are correctly classified by the classifier.

4. Experimental Evaluation and Results

4.1. Evaluation Metrics
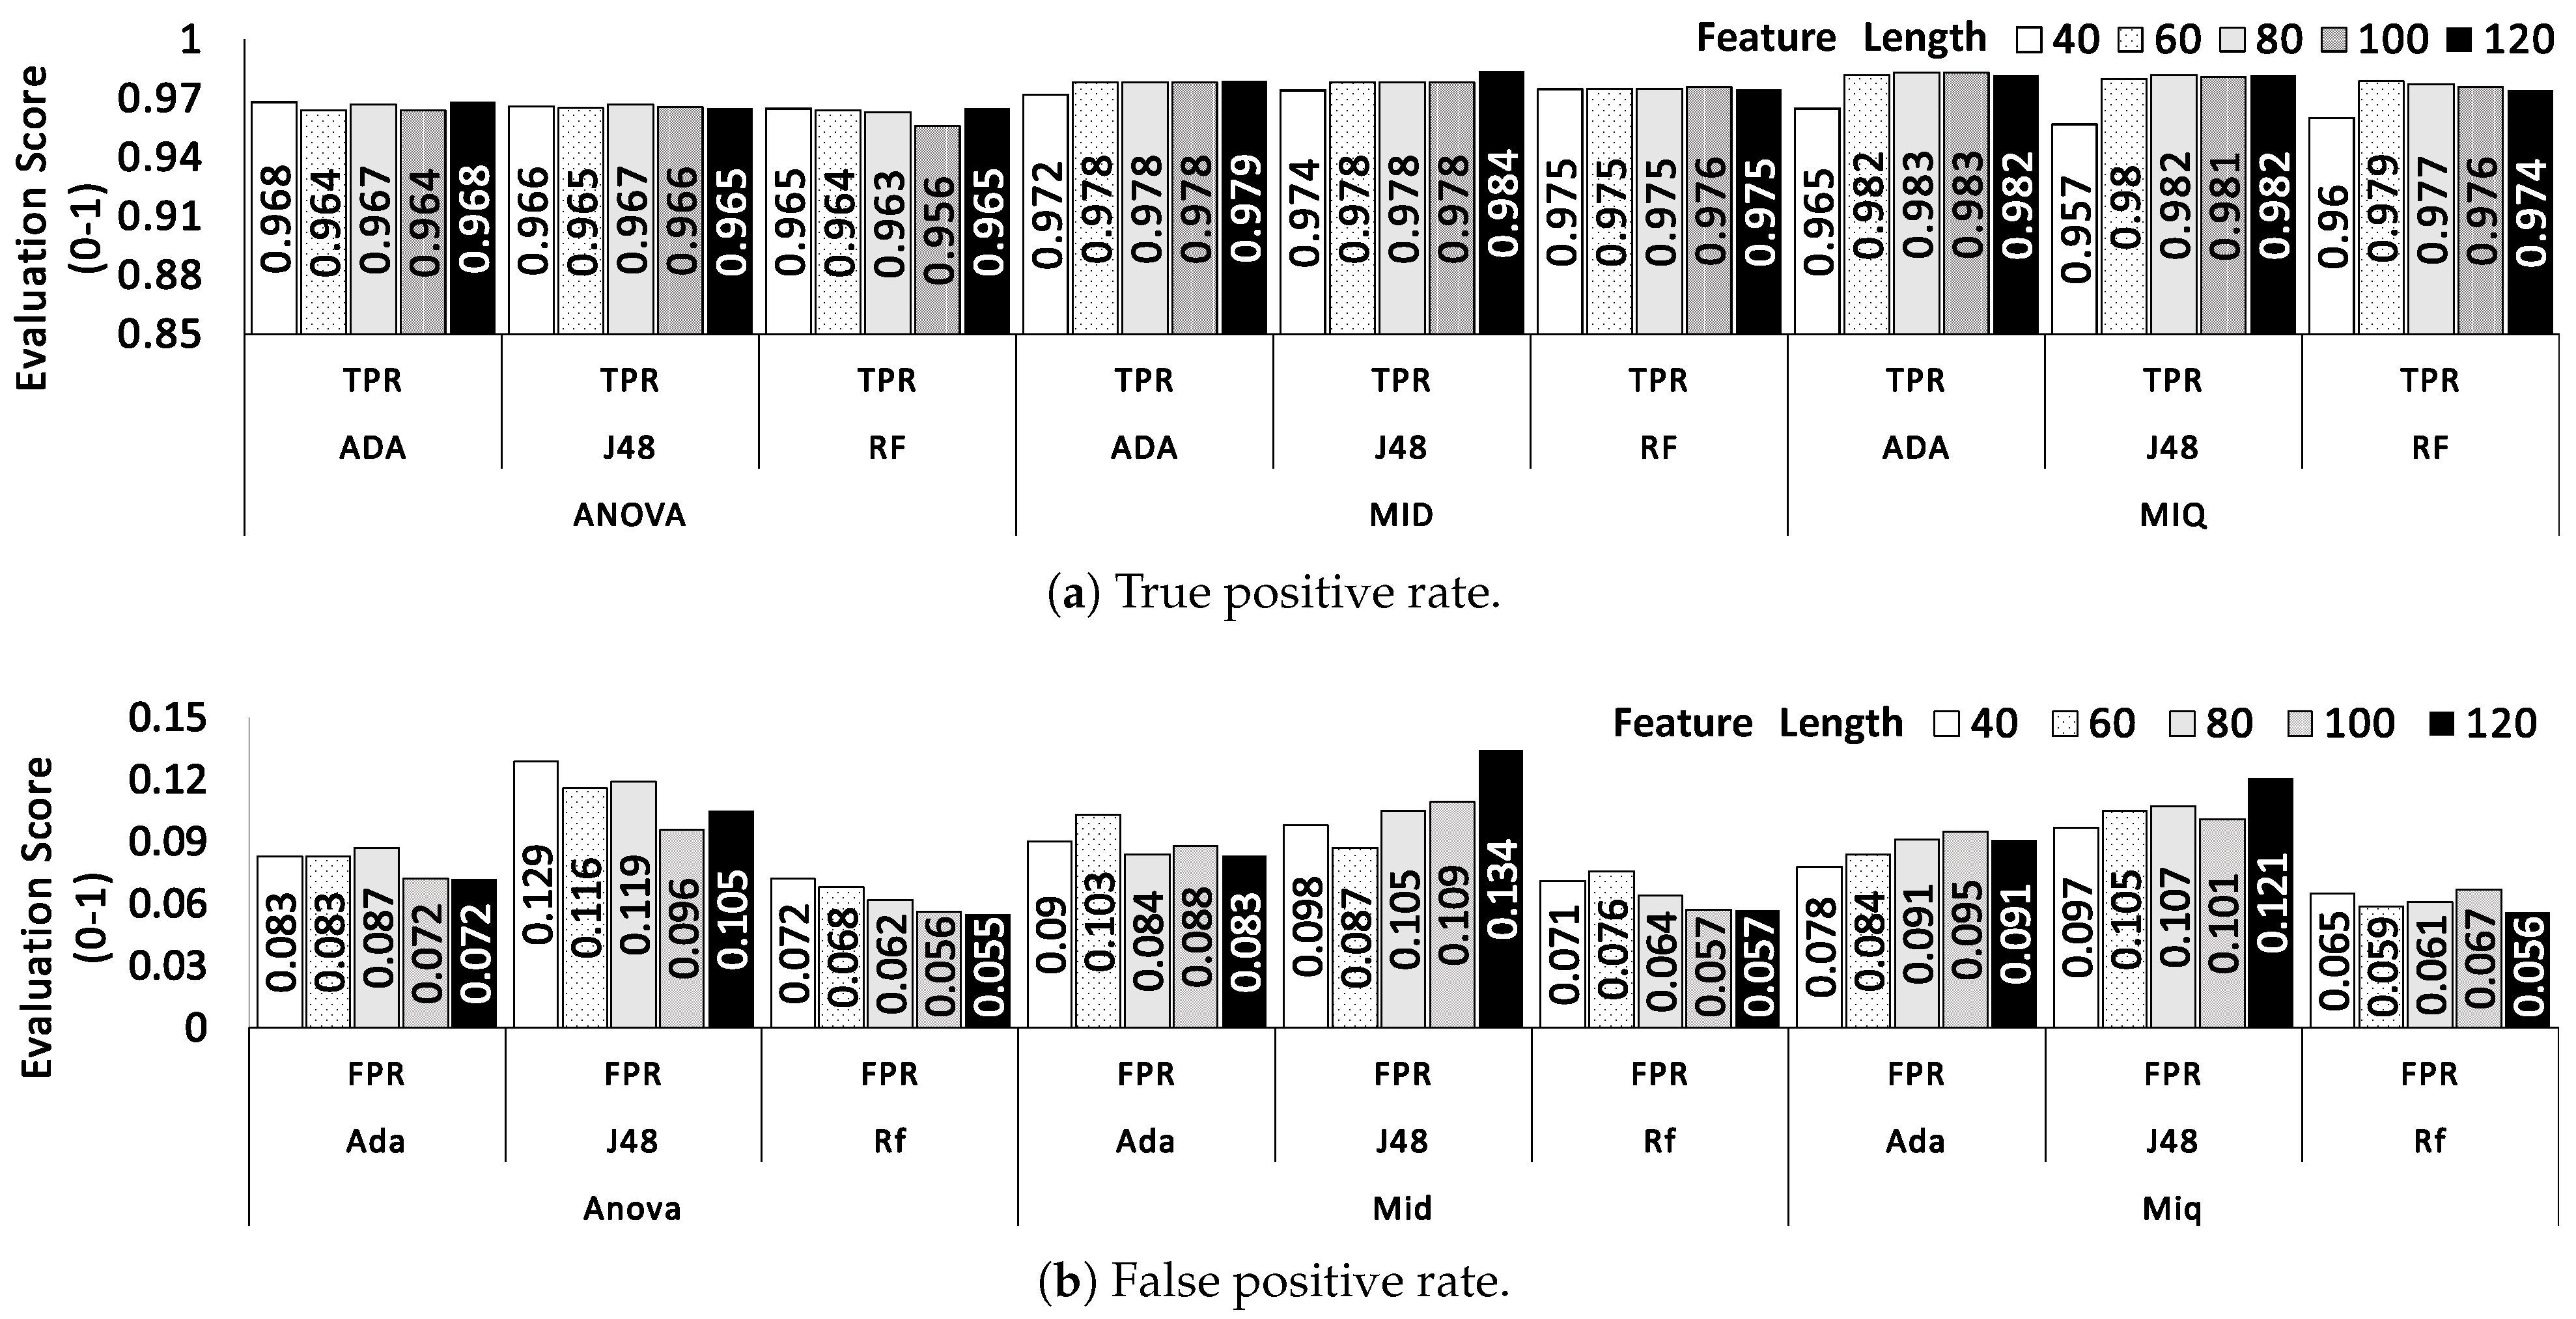
We used following evaluation metrics:
  • True Positive Rate ( T P R ) or Recall (R) = T P T P   +   F N ;
  • Precision (P) = T P T P   +   F P
Using Recall and Precision F-measure is estimated;
  • F-measure = 2   ×   P   ×   R P   +   R
Finally accuracy can be computed as shown below;
  • Accuracy (A) = T P   +   T N T P   +   F N   +   T N   +   F P
True Positive ( T P ) is number of samples correctly identified as malware. True Negative ( T N ) is the count of files identified as legitimate. False Negative ( F N ) is the number of malicious files misclassified as benign. False Positive ( F P ) is the number of benign files wrongly labeled as malware by the classifier.

4.2. Experiments Results

In this section, we discuss the experiment’s setup, results obtained and the analysis of the result. The primary objective of this work is to perform analysis on different types of a dataset using various machine learning algorithms. For this purpose we created four datasets discussed below:
  • Dataset-1 (VX-Dataset): A total of 2000 Portable Executables were collected which consists of 1000 malware samples gathered from sources VxHeaven (650) [35], User Agency (250), and Offensive Computing (100), and benign samples were collected from Windows XP System32 Folder (450), Windows7 System32 Folder (100), MikTex/Matlab Library (400), and Games (50);
  • Dataset-2 (Virusshare-Dataset): A total of 622 executables were downloaded from virusshare [36], these belong to malware families like Mediyes, Locker. Intallcore, CryptoRansom, Citadel Zeus, and APT1_293. In addition, we collected 118 benign files from the freshly installed Windows operating system. These samples were used to evaluate the classifier performance on multi-label classification;
  • Dataset-3 (Android-Dataset): A total 4000 applications were considered, out of which 2000 malicious samples were randomly chosen from the Derbin project [37], and 2000 legitimate applications were downloaded from the Google Playstore. Each benign application was submitted to the VirusTotal service to validate its genuinity;
  • Dataset-4 (Synthetic Samples): VX Heavens reports nearly 152 synthetic kits and a few metamorphic engines to generate functionally equivalent malware code. Phalcon/Skin Mass-Produced Code generator (PS-MPCs), Second Generation virus-generator (G2), Mass Code Generator (MPCGEN), Next Generation Virus Creation Kit (NGCVK), and Virus Creation Lab for Win32 (VCL32) are widely used to generate synthetic malware. A total of 320 viruses were generated with virus constructors and used as training samples. A separate test set is considered which includes 95 viruses (20 viruses from each generator and 15 real metamorphic) and 20 benign samples.
For experimenting on Dataset-1 and Dataset-4, we used a machine installed with Debian Lenny (Debian 5.08) as the host operating system, Windows XP Service Pack 2 as the guest operating system, i7 processor with 8GB RAM and 1TB HDD. Experiments on Dataset-2 and Dataset-3 were performed on Intel core i7, 10th generation with 16GB RAM, and 1TB HDD. Before executing samples in the system, we freshly installed the operating system and a snapshot of virtual environment was taken. After executing the sample, we restore the sandbox to its clean state, otherwise it would have a negative impact on the feature extraction phase.

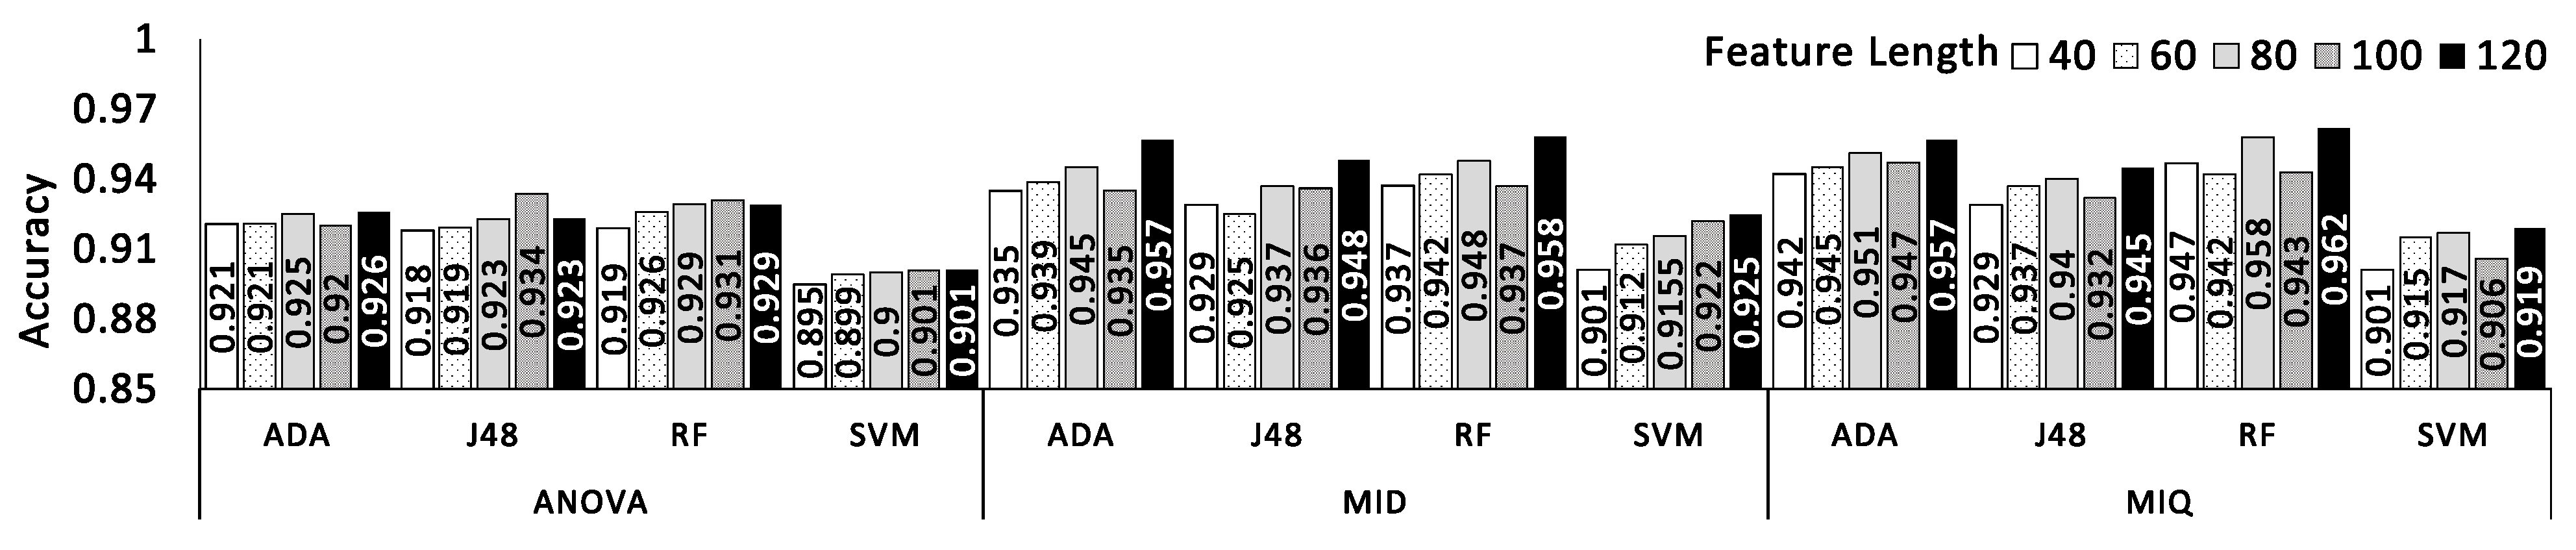
4.3. Investigation of Relevant Feature Type-Dataset-1

We extracted mnemonics from 2000 samples. The experimental results obtained from feature reduction using mRMR (MID and MIQ) and ANOVA are as shown in Figure 4. We obtained these outcomes after classifying the samples using SVM, AdaBoost, Random Forest, and J48. Five mnemonic-based models were constructed at a variable length, starting from 40 to 120 at an interval of 20. Among these five models, ANOVA provides the best result with a strong positive likelihood ratio of 16.38 for the feature length of 120 mnemonics using AdaBoostM1 (J48 as base classifier). The main advantages of this model are its low error rate and speed. However, mnemonic-based features can be easily modified using code obfuscation techniques.
The dynamic API features initially had a feature length of 4480. We use reduction algorithms like mRMR (MID), mRMR (MIQ), and ANOVA to obtain a reduced feature-length of 40, 60, 80, and 120 as illustrated in Figure 5. When we compare the different feature lengths, we observe that the likelihood for returning positive values is the highest in the case of mRMR (MIQ) at a feature-length of 120 prominent APIs using Random Forest.
Next, we derived 4-grams from a total feature space consisting of 1249 features. The features effectively reduced with mRMR (MID) methods, mRMR (MIQ), and ANOVA. The classification model’s performance is estimated over variable feature-length starting from 40 until 120 in steps of 20 as shown in Figure 6. For the above-mentioned five-feature length, mRMR(MIQ) produces the best result with over 96% accuracy for feature-length 120 with Random Forest. However, the limitation stated in [56] is applicable in the current scenario. Generation of 4-grams are computationally expensive, exhibit diminishing returns with more data, are prone to over-fitting, and do not seem to carry vital information from discriminating samples. At the same time, 4-grams do exhibit some merits as it partially depicts the behavioral snapshot of a program and sometimes produces comparable results to other approaches.
Finally, we derived the opcode-based feature set and reduced these features with mRMR (MID), mRMR (MIQ), and ANOVA, where the performance of the model is evaluated over a feature-length between 40 and 120 in increments of 20 as shown in Figure 7. Among these five-feature lengths, we observed that ANOVA attains the highest performance with a positive likelihood ratio of 19 for feature-length 100 using Random Forest. However, the results obtained with mRMR is very close to the ANOVA features.
Hence, from the results we obtained, we observe that API features had a higher detection rate of 97.4% with only a fallout of 1.7% as against 4-gram’s 93.15% accuracy. Again, when we compare the results obtained from API features as opposed to the results gathered from mnemonic features and opcode features, we see that opcode features had the highest likelihood ratio of 19 as against mnemonic features, and API features having a L R + ratio of 16.38 and 15.69, respectively.
To summarize experiments on Dataset-1 considering each feature independently on four classification algorithms, namely J48, Support Vector Machine (SVM), AdaBoostM1 (with J48 as a base classifier), and Random Forest (RF), we observe that Random Forest and AdaBoost produced the best results. We can attribute this accuracy of Random Forest as it is an ensemble-based technique that derives its output from the sample by accumulating votes from multiple forests. We can credit the boosting technique that AdaBoost employs for improving its accuracy. AdaBoost cascades multiple weak classifiers to give a strong learner, ensuring a high degree of precision. The J48 classifier comes next in terms of the results produced in comparison to the other classifiers. The output produced by J48 is close to the best classifiers in some cases but is consistently inferior compared to the other two classifiers. SVM produces poor results among the four classifiers, which can be explained by SVM’s tendency for over-fitting when the number of features is higher than the number of samples.
We further evaluate the performance of machine learning models generated by combining different feature categories. We consider such a feature space as a multimodal attribute set. The term modality means the particular mode in which something is expressed. In this context, it refers to the various features obtained with feature extraction, as shown in Figure 2. In the unimodal architecture, we perform classification based on a single modality and thus, this framework is limited to operating on a single attribute type. To investigate if blending different features from diverse feature categories could improve classification accuracy, we furthered our experiment using multimodal architecture.
Multimodal architecture involves learning based on multiple modalities. This solution is based on utilizing the relationship existing between the various features of the data available. This network can be used in converting data from one modality to another or in using one attribute set to assist the learning of another attribute set etc. We have achieved multimodal fusion in our experiment by carrying out feature selection (as shown in Figure 3) on the relevant attributes from diverse categories (4-gram, mnemonics, API, and opcodes) and then fusing them as shown in Figure 8.
As each feature has a different representation and correlation structure, the fusion of all these relevant features helps to extract maximum performance. Furthermore, after fusing these features, we were able to obtain a new feature space comprising of promising attributes. Additionally, we considered the new feature space for creating diverse classification models.
The presence of irrelevant features or redundancy in the data set might degrade the performance of the multimodal classification. Since we present the feature sets through various feature selection methods before performing feature fusion, our classifier is less susceptible to problems induced due to redundancy and extraneous features.
The ensemble classifier demonstrated the maximum accuracy of 97.98% with a feature-length of 240 using Random Forest, as shown in Figure 9. Among the unimodal classifiers, the API features demonstrated the highest detection rate of 97.4% with a FPR of 1.7%. Moreover, the opcode features displayed a detection rate of 91.6% and 0.48% FPR. By analyzing the results of both the unimodal and multimodal architectures, the results obtained using the multimodal architecture illustrate significant improvement compared to the results gained from the unimodal classifiers (as shown in Figure 4, Figure 5, Figure 6 and Figure 7). Since the ensemble classifier was developed by concatenating prominent features from various feature sets, it is evident from the results that each modality considered for fusion has contributed to the overall performance of the classifier. Furthermore, this demonstrates that multimodal learning can be promising for increasing the detection in the malware detection task.
Summary: Experiments on VX-Dataset demonstrates that combining prominent mRMR features results in improved results on comparing individual features. The highest detection rate is obtained with Random Forest and AdaBoost models, due to ensemble, bagging, and boosting strategies. APIs play a significant role in predicting examples, with poor outcomes obtained using opcodes. Another important trend noticed is that the results of multimodal feature space and API unimodal classifier marginally differ. This is because the opcode attribute in combined attribute space does not contribute towards classification, as they introduce more sparsity in feature vectors. Hence, we conclude that dynamic feature, i.e., API plays a critical role in discriminating malware and benign files.

4.4. Evaluation on Virusshare Samples Dataset-2

In this experiment, we perform a comprehensive evaluation on samples downloaded from Virusshare. As we saw inferior performance using static features, we performed analysis on APIs by running samples in the Parsa sandbox. The transition from Ether to an alternative sandbox (Parsa sandbox) arrived as many executables crashed while running in Ether. We observed that Parsa sandbox provides the requested resources to the executing samples by logging the API calls. This sandbox delivers the resources by matching the API used by executable with an API list which corresponds to a distinct set of operations corresponding to a mouse event, browser activities, file operations, etc. In this, the program is given an illusion of being run in a real environment as opposed to the virtual environment. While a program is executing, we log all APIs, extract call names, and select prominent calls using mRMR to create a machine learning model. In addition, we perform experiments using different deep learning models without feature engineering and compare the outcomes of both ML models and deep neural networks. Table 2 compares the average of the results of different models. We observe that the best results are obtained with a deep neural network, followed by one-dimensional convolutional neural network and XGBOOST. Table 3 exhibit the network topology and hyperparameters of deep neural network models. In all intermediate layers, we use ReLU activation function and randomly drop some neurons (i.e., dropout) to attain the best outcome for a particular neural network configuration.

4.5. Evaluation on Android Applications Dataset-3

In this experiment, we identify malicious Android applications (also known as app.) using machine learning and deep learning techniques. Here, we use system calls as a feature for representing each application. First, we create an Android virtual device and install applications to be inspected. A total of 2000 malware applications are randomly chosen from Drebin dataset [37], and 2000 legitimate applications are downloaded from the Google Playstore. While running applications, system calls are recorded using strace utility, during this event we employ Android Monkey (a utility in Android SDK for fuzz testing application) to simulate the collection of events (e.g., changing the location, battery charging status, sending SMS, dialling to a number, swipes, clicking on widgets of an app, etc.). In particular, in this work we execute an application with 1500 random events for one minute, however, the analysis could also be performed with varying events.
Relevant system calls are selected using the mRMR feature selection approach, and further each app. is represented using a numerical vector employing Term Frequency Inverse Document Frequency (TF-IDF). The performance of machine learning classifiers on the sequence of system call (two calls considered in sliding window fashion) is shown in Table 4. It was observed that distinguishing feature vectors were obtained by considering two consecutive system calls. Some examples of system call sequence are shown in Figure 10.
We considered 40% of top system calls from the list of unique calls extracted from entire training set.
From Table 4, we can visualize the best outcome for the XGBoost classifier. However, this result is obtained with an extra effort i.e., feature engineering which is a critical task in the machine learning pipeline. To eliminate the task of feature engineering, we make use of deep neural network architecture, which is a collection of layers, with each layer consisting of several neurons. A neuron acts as a processing unit that collects multiple inputs, multiplies weight, and finally applies the activation function. We use a deep neural network with an input layer consisting of 500 neurons and the second layer contains 250 neurons. In all layers, we use the Rectified Linear Unit (ReLU) activation function. The sigmoid activation function was used in the output layer since malware identification is a binary classification problem. For faster convergence and to avoid overfitting, the Adam optimizer and cross-entropy loss function are utilized. Table 5 is the results obtained at varying values of dropout, the best results are obtained with a dropout rate of 0.1.

4.6. Evaluation on Synthetic Samples Dataset-4

Malware constructors generate variants from the base virus by inserting equivalent instructions, reordering, and subroutine permutations as code obfuscation techniques. The segments mutate from one generation to another where mutant code is transformed by the metamorphic engine to evade AntiVirus (AV) signature detection. This motivates the use of machine learning techniques to explore metamorphism among variants and within different families among synthetic samples, and to understand the extent of obfuscation induced by the virus kits. Malware data set comprising of 800 NGVCK viruses were used. Prior studies in [57] reported that the NGVCK samples could easily bypass strong statistical detectors based on HMM by using the opcode sequence. Likewise, 1200 benign executables were downloaded from different sources, which include games, web browsers, media players, and executables of system 32 from a fresh installation of the Windows XP operating system. As in previous experiments, we scan all benign with VirusTotal to assure that none of the benign samples is infected. The complete data set was divided such that 80% of samples are used for training and the remaining 20% are used as a test set. In this experiment, executables based on API calls were analyzed.
We extracted unique opcode bigrams from the training set and found 733 of them. Prominent opcodes are filtered out using the mRMR approach. We also studied the impact of varying feature lengths beginning with 50 bigram opcode until 250 bigrams are included. The feature space is extended in increments of 50 opcodes at a time. We found that an increase in bigrams had a marginal influence on the classifier performance. As we progressively extend the feature vector, the informative attributes begin to appear, which eventually improves the results. However, if we further increase the features beyond a certain limit there is a drop in accuracy, primarily due to the addition of noise. We developed a classification model using different algorithms such as J48, AdaBoostM1 with J48 as a base classifier, and Random Forest. Table 6 compares the best outcome of classifiers attained at a feature length of 150 bigrams.
To understand the extent of metamorphism in virus generation kits, 677 viruses were created using different infection mechanisms to form malware families. In particular, we generated using virus kits (NGVCK, MPCGEN, G2, and PSMPC) and also downloaded real malware samples downloaded from VX Heavens. Data set description is given in Table 7.
Mnemonics are extracted from each malware sample and aligned using the global and local sequence alignment method. Sequence alignment places one opcode sequence over another to determine if sequences are identical. In the process of alignment, two opcode sequence gaps may be inserted. We have adopted a simple scoring scheme where a match is assigned a value of +1, and every mismatch and gap score is assumed as −1. A similarity matrix is constructed using pairwise alignment of malware samples within the family. We record minimum, average, and highest similarity distance for all malware samples. Likewise, the similarity distance of base malware across malware families is computed.
Two families are said to overlap if the similarity distance computed for base malware samples B a s e i and B a s e j is within the range of minimum and average similarity distance determined for families i or j. This means the greater the distance of a sample from the base malware, the lesser the similarity. Conversely, a high score depicts a higher similarity between any two samples. Table 8 depict a segment of pairwise alignment of two samples generated using the NGVCK constructor. Each row preceded with a hash symbol represents a gap and an asterisk designate a mismatch of an opcode for any two malware samples.
The local alignment technique is employed to identify a common code among obfuscated samples as the code varies in the subsequent generation to identify conserved code regions. We found variants generated from MPCGEN are similar to G2 and PSMPC. In Figure 11, MPCGEN-F1 and MPCGEN-F3 have high similarities with a base malware of G2 and PSMPC (G2-F1, G2-F3, PSMPC-F1, and PSMPC-F3).
To examine obfuscation techniques using malware constructors, we calculated alignments of sequences and recorded mismatch among mnemonics. There was a visible instruction replacement for NGVCK samples in comparison to other synthetic generators. In Table 9, prominent mismatch opcodes are shown for four generators as the rest has shown a similar trend. mov, push, lea, pop, and jmp are primarily used as replacement instructions.
To ascertain overlap among real malware samples of VX-Heavens and the obfuscated families, we studied the overlapping of the opcode sequence of real malware samples with synthetic ones. Initially, we determine base malware alignment (a sample that is closer to all samples in a family). Figure 12 shows the overlap of Win32.Agent with NGVCK indicating real samples that also use code modification similar to synthetic constructors. Win32.Bot and Win32.Downloader overlap Win32.Autorun, Win32.Downloader, Win32.Mydoom, and Win32.Xorer families indicating that worm families preserve the common base code to differ in syntactic structure due to obfuscation or an extension of malevolence.

5. Conclusions and Future Work

In this paper, we address the detection of malicious files using diverse datasets comprising of real and synthetic malware samples. The solution employs a collection of machine learning and deep learning approaches. Machine learning models were trained on prominent features derived using mRMR and ANOVA. Our results show that the Random Forest classifier attained better results, comparing all other machine learning algorithms used in this work. We also conclude that models trained on static features did not attain good results due to the sparse vectors. We demonstrate the efficacy of APIs and system call sequence in identifying samples. Moreover, to improve accuracy, we implemented our solution using distinct deep learning methods, and demonstrate fine-tuned a deep neural network that resulted in an F1-score of 99.1% and 98.48% on Dataset-2 and Dataset-3, respectively. Finally, we performed an exhaustive analysis of code obfuscation on variants generated using NGVCK and other virus kits. We found that NGVCK samples are appropriately detected by using a simple feature, such as opcode bigram. We also demonstrated that there exists inter-constructor overlaps especially amongst G2, MPCGEN, and PSMPC indicating the use of a generic code for infection. Our results also show that malware constructors employ naive obfuscation techniques, particularly they utilize junk instructions, a replacement of equivalent instructions involving mov, push, pop, jump, and lea.
In future, we would like to analyze malware and benign samples using an ensemble of features and classify unseen samples using ensembles of classifiers employing majority voting. We would also like to experiment on multi-class classification, i.e., labeling malware to its respective family. Moreover, we plan to investigate the efficacy of the machine learning and deep learning models on evasive samples generated through feature manipulations, and propose a countermeasure against adversarial attacks.

Author Contributions

Conceptualization, M.A., A.J., S.A., P.V., F.M. (Francesco Mercaldo), F.M. (Fabio Martinelli) and A.S.; methodology, M.A., A.J., S.A., P.V., F.M. (Francesco Mercaldo), F.M. (Fabio Martinelli) and A.S.; software, M.A., A.J., S.A., P.V., F.M. (Francesco Mercaldo), F.M. (Fabio Martinelli) and A.S.; validation, M.A., A.J., S.A., P.V., F.M. (Francesco Mercaldo), F.M. (Fabio Martinelli) and A.S. All authors have read and agreed to the published version of the manuscript.

Funding

This research received no external funding.

Acknowledgments

This work has been partially supported by MIUR-SecureOpenNets, EU SPARTA, CyberSANE and E-CORRIDOR projects.

Conflicts of Interest

The authors declare no conflict of interest.

Abbreviations

The following abbreviations are used in this manuscript:
List of Abbreviations
1D-CNNOne-Dimensional Convolutional Neural Network
ANOVAAnalysis of Variance
APIApplication Programming Interface
AVAntiVirus
CARTClassification and Regression Tree
CNNConvolutional Neural Network
CNN-LSTMCNN Long Short-Term Memory Network
DNNDeep Neural Network
FNFalse Negative
FPFalse Positive
FPRFalse Positive Rate
FVTFrequency Vector Table
G2Second Generation Virus Generator
HMMsHidden Markov Models
k-NNK-Nearest Neighbors
MIDMutual Information Difference
MIQMutual Information Quotient
MPCGENMass Produced Code Generation Kit
mRMRMinimum Redundancy and Maximum Relevance
NGVCKNext Generation Virus Construction Kit
OSOperating System
PEPortable Executables
PSMPCPhalcon/Skin Mass–Produced Code generator
QEMUQuick EMUlator
ReLURectified Linear Activation Function
RFRandom Forest
SMSShort Message Service
SVMSupport Vector Machine
syscallSystem Call
TF-IDFTerm Frequency Inverse Document Frequency
TPRTrue Positive Rate
RRecall
RDTSCRead Time Stamp Counter
PPrecision
TPTrue Positive
TNTrue Negative
FPFalse Positive
FNFalse Negative
VCL32Virus Creation Lab for Win32
XGBoosteXtreme Gradient Boosting
List of Mathematical Symbols
Summation notation
logLogarithm
x , y Features or Attributes
P ( x ) Probability distribution of x
I ( x , y ) Mutual information between feature x and y
P ( x i , y j ) Joint probabilistic distribution of feature x and y
P ( x i ) , P ( y j ) Marginal probabilities of x and y
iLevel or state of feature x
jLevel or state of feature y
SSet obtained from cross product of set of states of x and y
V ( x ) Relevance value of an attribute x
hTarget variable or class
I ( h , x ) Mutual information between class h and feature x.
W ( x ) Redundancy value of feature x
NTotal number of attributes
I ( y j , x ) Mutual information of features y j and x respectively
M I D ( x ) Difference between the relevance value V ( x ) and the redundancy value W ( x )
M I Q ( x ) Obtained by dividing the relevance value with the redundancy Value
S S B p Sum of squares of feature p belonging to group B
S S W p Sum of squares of feature p belonging to group W
S S T p Total sum of squares of feature p
kNumber of classes (malware/benign)
lNumber of states of feature p
μ p Mean of frequencies of feature p
X i j Feature at class I and state j
μ i p Mean of frequencies of feature p in ith discretization state
D F W p Degree of freedom of feature p within the group W
( k l ) p Number of observations of feature p
l p Number of samples of feature p
D F B p Degree of freedom of feature p between the group B
F ( D F B p , D F W p ) F-score
XA tuple or feature represented by an n-dimensional attribute vector

References

  1. Saraiva, D.A.; Leithardt, V.R.Q.; de Paula, D.; Sales Mendes, A.; González, G.V.; Crocker, P. Prisec: Comparison of symmetric key algorithms for iot devices. Sensors 2019, 19, 4312. [Google Scholar] [CrossRef] [PubMed] [Green Version]
  2. Bulazel, A.; Yener, B. A survey on automated dynamic malware analysis evasion and counter-evasion: Pc, mobile, and web. In Proceedings of the 1st Reversing and Offensive-Oriented Trends Symposium, Vienna, Austria, 16–17 November 2017; pp. 1–21. [Google Scholar] [CrossRef]
  3. Mandiant. Available online: https://www.fireeye.com/mandiant.html (accessed on 6 July 2021).
  4. Dinaburg, A.; Royal, P.; Sharif, M.; Lee, W. Ether: Malware analysis via hardware virtualization extensions. In Proceedings of the 15th ACM Conference on Computer and Communications Security, Alexandria, VA, USA, 27–31 October 2008; ACM: New York, NY, USA, 2008; pp. 51–62. [Google Scholar] [CrossRef]
  5. Alaeiyan, M.; Parsa, S.; Conti, M. Analysis and classification of context-based malware behavior. Comput. Commun. 2019, 136, 76–90. [Google Scholar] [CrossRef]
  6. Intel. Available online: http://www.intel.com/ (accessed on 6 July 2021).
  7. Virus Total. Available online: https://www.virustotal.com/en/statistics/ (accessed on 6 July 2021).
  8. Christodorescu, M.; Jha, S.; Kruegel, C. Mining specifications of malicious behavior. In Proceedings of the the 6th Joint Meeting of the European Software Engineering Conference and the ACM SIGSOFT Symposium on the Foundations of Software Engineering, Dubrovnik, Croatia, 3–7 September 2007; ACM: New York, NY, USA, 2007; pp. 5–14. [Google Scholar] [CrossRef]
  9. Alzaylaee, M.K.; Yerima, S.Y.; Sezer, S. DL-Droid: Deep learning based android malware detection using real devices. Comput. Secur. 2020, 89, 101663. [Google Scholar] [CrossRef]
  10. Canfora, G.; Medvet, E.; Mercaldo, F.; Visaggio, C.A. Detecting Android malware using sequences of system calls. In Proceedings of the 3rd International Workshop on Software Development Lifecycle for Mobile, Bergamo, Italy, 31 August 2015; pp. 13–20. [Google Scholar] [CrossRef]
  11. Wang, W.; Li, Y.; Wang, X.; Liu, J.; Zhang, X. Detecting Android malicious apps and categorizing benign apps with ensemble of classifiers. Future Gener. Comput. Syst. 2018, 78, 987–994. [Google Scholar] [CrossRef] [Green Version]
  12. Nataraj, L.; Karthikeyan, S.; Jacob, G.; Manjunath, B. Malware images: Visualization and automatic classification. In Proceedings of the 8th International Symposium on Visualization for Cyber Security, Pittsburgh, PA, USA, 20 July 2011; pp. 1–7. [Google Scholar] [CrossRef]
  13. Ni, S.; Qian, Q.; Zhang, R. Malware identification using visualization images and deep learning. Comput. Secur. 2018, 77, 871–885. [Google Scholar] [CrossRef]
  14. Yuan, Z.; Lu, Y.; Xue, Y. Droiddetector: Android malware characterization and detection using deep learning. Tsinghua Sci. Technol. 2016, 21, 114–123. [Google Scholar] [CrossRef]
  15. McLaughlin, N.; Martinez del Rincon, J.; Kang, B.; Yerima, S.; Miller, P.; Sezer, S.; Safaei, Y.; Trickel, E.; Zhao, Z.; Doupé, A.; et al. Deep android malware detection. In Proceedings of the Seventh ACM on Conference on Data and Application Security and Privacy, Scottsdale, AZ, USA, 22–24 March 2017; pp. 301–308. [Google Scholar] [CrossRef] [Green Version]
  16. Karbab, E.B.; Debbabi, M.; Derhab, A.; Mouheb, D. Android malware detection using deep learning on API method sequences. arXiv 2017, arXiv:1712.08996. [Google Scholar]
  17. Iadarola, G.; Martinelli, F.; Mercaldo, F.; Santone, A. Towards an Interpretable Deep Learning Model for Mobile Malware Detection and Family Identification. Comput. Secur. 2021, 105, 102198. [Google Scholar] [CrossRef]
  18. Zhang, B.; Yin, J.; Hao, J. Using Fuzzy Pattern Recognition to Detect Unknown Malicious Executables Code. In Fuzzy Systems and Knowledge Discovery; Lecture Notes in Computer Science; Springer: Berlin/Heidelberg, Germany, 2005; Volume 3613, pp. 629–634. [Google Scholar] [CrossRef]
  19. Sun, H.M.; Lin, Y.H.; Wu, M.F. API Monitoring System for Defeating Worms and Exploits in MS-Windows System. In Information Security and Privacy; Springer: Berlin/Heidelberg, Germany, 2006; Volume 4058, pp. 159–170. [Google Scholar] [CrossRef]
  20. Bergeron, J.; Debbabi, M.; Erhioui, M.M.; Ktari, B. Static Analysis of Binary Code to Isolate Malicious Behaviors. In Proceedings of the 8th Workshop on Enabling Technologies on Infrastructure for Collaborative Enterprises, Palo Alto, CA, USA, 16–18 June 1999; IEEE Computer Society: Washington, DC, USA, 1999; pp. 184–189. [Google Scholar] [CrossRef]
  21. Zhang, Q.; Reeves, D.S. MetaAware: Identifying Metamorphic Malware. In Proceedings of the Twenty-Third Annual Computer Security Applications Conference (ACSAC 2007), Miami Beach, FL, USA, 10–14 December 2007; pp. 411–420. [Google Scholar] [CrossRef] [Green Version]
  22. Sathyanarayan, V.S.; Kohli, P.; Bruhadeshwar, B. Signature Generation and Detection of Malware Families. In Proceedings of the 13th Australasian Conference on Information Security and Privacy, Wollongong, Australia, 7–9 July 2008; Springer: Berlin/Heidelberg, Germany, 2008; pp. 336–349. [Google Scholar] [CrossRef]
  23. Rabek, J.C.; Khazan, R.I.; Lewandowski, S.M.; Cunningham, R.K. Detection of injected, dynamically generated, and obfuscated malicious code. In Proceedings of the 2003 ACM Workshop on Rapid Malcode, Washington, DC, USA, 27 October 2003; ACM: New York, NY, USA, 2003; pp. 76–82. [Google Scholar] [CrossRef]
  24. Damodaran, A.; Di Troia, F.; Visaggio, C.A.; Austin, T.H.; Stamp, M. A comparison of static, dynamic, and hybrid analysis for malware detection. J. Comput. Virol. Hacking Tech. 2017, 13, 1–12. [Google Scholar] [CrossRef]
  25. Wong, W.; Stamp, M. Hunting for metamorphic engines. J. Comput. Virol. 2006, 2, 211–229. [Google Scholar] [CrossRef]
  26. Nair, V.P.; Jain, H.; Golecha, Y.K.; Gaur, M.S.; Laxmi, V. MEDUSA: MEtamorphic malware dynamic analysis using signature from API. In Proceedings of the 3rd International Conference on Security of Information and Networks, Taganrog, Russia, 7–11 September 2010; ACM: New York, NY, USA, 2010; pp. 263–269. [Google Scholar] [CrossRef]
  27. Suarez-Tangil, G.; Stringhini, G. Eight years of rider measurement in the android malware ecosystem: Evolution and lessons learned. arXiv 2018, arXiv:1801.08115. [Google Scholar]
  28. Zhou, Y.; Jiang, X. Dissecting Android Malware: Characterization and Evolution. In Proceedings of the 33rd IEEE Symposium on Security and Privacy (Oakland 2012), San Francisco, CA, USA, 21–23 May 2012. [Google Scholar] [CrossRef] [Green Version]
  29. Arp, D.; Spreitzenbarth, M.; Huebner, M.; Gascon, H.; Rieck, K. Drebin: Efficient and Explainable Detection of Android Malware in Your Pocket. In Proceedings of the 21st Annual Network and Distributed System Security Symposium (NDSS), San Diego, CA, USA, 23–26 February 2014. [Google Scholar]
  30. Yan, L.K.; Yin, H. DroidScope: Seamlessly Reconstructing the OS and Dalvik Semantic Views for Dynamic Android Malware Analysis. In Proceedings of the 21st USENIX Conference on Security Symposium, Bellevue, WA, USA, 8–10 August 2012; USENIX Association: Berkeley, CA, USA, 2012; p. 29, ISBN 978-931971-95-9. [Google Scholar]
  31. Canfora, G.; Mercaldo, F.; Visaggio, C.A. A classifier of Malicious Android Applications. In Proceedings of the 2nd International Workshop on Security of Mobile Applications, in Conjunction with the International Conference on Availability, Reliability and Security, Regensburg, Germany, 2–6 September 2013. [Google Scholar] [CrossRef]
  32. Su, D.; Liu, J.; Wang, W.; Wang, X.; Du, X.; Guizani, M. Discovering communities of malapps on Android-based mobile cyber-physical systems. Ad Hoc Netw. 2018, 80, 104–115. [Google Scholar] [CrossRef] [Green Version]
  33. Liu, X.; Liu, J.; Zhu, S.; Wang, W.; Zhang, X. Privacy risk analysis and mitigation of analytics libraries in the android ecosystem. IEEE Trans. Mob. Comput. 2019, 19, 1184–1199. [Google Scholar] [CrossRef] [Green Version]
  34. Casolare, R.; Martinelli, F.; Mercaldo, F.; Santone, A. Detecting Colluding Inter-App Communication in Mobile Environment. Appl. Sci. 2020, 10, 8351. [Google Scholar] [CrossRef]
  35. VX Heavens. Available online: https://vx-underground.org/archive/VxHeaven/index.html (accessed on 6 July 2021).
  36. Virusshare. Available online: https://virusshare.com/ (accessed on 6 July 2021).
  37. Drebin. Available online: https://www.sec.cs.tu-bs.de/~danarp/drebin/download.html (accessed on 6 July 2021).
  38. Alkhateeb, E.; Stamp, M. A Dynamic Heuristic Method for Detecting Packed Malware Using Naive Bayes. In Proceedings of the 2019 International Conference on Electrical and Computing Technologies and Applications (ICECTA), Ras Al Khaimah, United Arab Emirates, 19–21 November 2019; pp. 1–6. [Google Scholar] [CrossRef]
  39. Xen Project. Available online: http://www.xen.org (accessed on 6 July 2021).
  40. Windows API Library. Available online: https://docs.microsoft.com/en-us/windows/win32/apiindex/windows-api-list (accessed on 6 July 2021).
  41. Vnc Viewer. Available online: https://www.realvnc.com/en/connect/ (accessed on 6 July 2021).
  42. You, I.; Yim, K. Malware obfuscation techniques: A brief survey. In Proceedings of the 2010 International Conference on Broadband, Wireless Computing, Communication and Applications, Fukuoka, Japan, 4–6 November 2010; pp. 297–300. [Google Scholar] [CrossRef]
  43. Borello, J.M.; Mé, L. Code obfuscation techniques for metamorphic viruses. J. Comput. Virol. 2008, 4, 211–220. [Google Scholar] [CrossRef]
  44. ObjDump. Available online: https://web.mit.edu/gnu/doc/html/binutils_5.html (accessed on 6 July 2021).
  45. Witten, I.; Frank, E. Practical Machine Learning Tools and Techniques with Java Implementation; Morgan Kaufmann: Burlington, MA, USA, 1999; ISBN 1-55860-552-5. [Google Scholar]
  46. Factorial Anova. Available online: http://en.wikipedia.org/wiki/Analysis_of_variance (accessed on 6 July 2021).
  47. Ding, C.; Peng, H. Minimum Redundancy Feature Selection from Microarray Gene Expression Data. In Proceedings of the IEEE Computer Society Conference on Bioinformatics, Stanford, CA, USA, 11–14 August 2003; p. 523. [Google Scholar] [CrossRef]
  48. Cortes, C.; Vapnik, V. Support-vector networks. Mach. Learn. 1995, 20, 273–297. [Google Scholar] [CrossRef]
  49. Rish, I. An empirical study of the naive Bayes classifier. In Proceedings of the IJCAI 2001 Workshop on Empirical Methods in Artificial Intelligence, Seattle, WA, USA, 4 August 2001; Volume 3, pp. 41–46. [Google Scholar]
  50. Quinlan, J.R. C4.5: Programs for Machine Learning; Elsevier: Amsterdam, The Netherlands, 2014; ISBN 1-55860-238-0. [Google Scholar]
  51. Breiman, L. Random forests. Mach. Learn. 2001, 45, 5–32. [Google Scholar] [CrossRef] [Green Version]
  52. Chen, T.; Guestrin, C. Xgboost: A scalable tree boosting system. In Proceedings of the 22nd Acm Sigkdd International Conference on Knowledge Discovery and Data Mining, San Francisco, CA, USA, 13–17 August 2016; pp. 785–794. [Google Scholar] [CrossRef] [Green Version]
  53. Narudin, F.A.; Feizollah, A.; Anuar, N.B.; Gani, A. Evaluation of machine learning classifiers for mobile malware detection. Soft Comput. 2016, 20, 343–357. [Google Scholar] [CrossRef]
  54. Singh, J.; Singh, J. A survey on machine learning-based malware detection in executable files. J. Syst. Archit. 2021, 112, 101861. [Google Scholar] [CrossRef]
  55. Mahdavifar, S.; Ghorbani, A.A. Application of deep learning to cybersecurity: A survey. Neurocomputing 2019, 347, 149–176. [Google Scholar] [CrossRef]
  56. Raff, E.; Zak, R.; Cox, R.; Sylvester, J.; Yacci, P.; Ward, R.; Tracy, A.; McLean, M.; Nicholas, C. An investigation of byte n-gram features for malware classification. J. Comput. Virol. Hacking Tech. 2018, 14, 1–20. [Google Scholar] [CrossRef]
  57. Lin, D.; Stamp, M. Hunting for undetectable metamorphic viruses. J. Comput. Virol. 2011, 7, 201–214. [Google Scholar] [CrossRef] [Green Version]
Figure 1. Software de-armoring.
Electronics 10 01694 g001
Figure 2. Feature extraction.
Electronics 10 01694 g002
Figure 3. Feature selection process.
Electronics 10 01694 g003
Figure 4. Performance of classifiers on mnemonic features.
Electronics 10 01694 g004
Figure 5. Performance of classifiers trained on API features.
Electronics 10 01694 g005
Figure 6. Performance of 4-gram features.
Electronics 10 01694 g006
Figure 7. Performance of classifier trained on opcode features.
Electronics 10 01694 g007
Figure 8. Multimodal architecture for feature fusion classification.
Electronics 10 01694 g008
Figure 9. Performance of feature fusion.
Electronics 10 01694 g009
Figure 10. System call sequence.
Electronics 10 01694 g010
Figure 11. Overlapping MPCGEN malware families.
Electronics 10 01694 g011
Figure 12. Overlapping families of real malware with other families.
Electronics 10 01694 g012
Table 1. Comparison of existing techniques.
Machine Learning-Based Techniques
AuthorApproachDrawback
M. Christodorescu  et al.  [8]Mine malicious behavior present in a known malware.The impact of test program choices on the quality of mined malware behavior was not clear.
M. K. Alzaylaee  et al.  [9]Deep learning system that detects malicious Android applications through dynamic analysis using stateful input generation.Investigation on recent intrusion detection systems were not available.
G. Canfora  et al.  [10]Android malware detection method based on sequences of system calls.Assumption that malicious behaviors are implemented by specific system calls sequences.
W. Wang  et al.  [11]Framework to effectively and efficiently detect malicious apps and benign  apps.Require datasets of features extracted from malware and harmless samples in order to train their models.
L. Nataraj  et al.  [12]Effective method for visualizing and classifying malware using image processing techniques.Path to a broader spectrum of novel ways to analyze malware was not fully explored.
Deep Learning-Based Techniques
AuthorApproachDrawback
S. Ni  et al.  [13]Classification algorithm that uses static features called Malware Classification using SimHash and CNN.Time required for malware detection and classification was comparatively more.
Z. Yuan  et al.  [14]An online deep learning-based Android malware detection engine (DroidDetector).The semantic-based features of Android malware were not considered.
N. McLaughlin  et al.  [15]A novel Android malware detection system that uses a deep convolutional neural network.The same network architecture cannot be applied to malware analysis on different platforms.
E. B. Karbab  et al.  [16]Android malware detection using deep learning on API method sequences.Less affected by the obfuscation techniques because they only consider the API method calls.
G. Iadarola  et al.  [17]Deep learning model for mobile malware detection and family identification.Model needs to be trained with large sets of labeled data.
Other Techniques
AuthorApproachDrawback
B. Zhang  et al.  [18]Detect unknown malicious executables code using fuzzy pattern recognition.Fuzzy pattern recognition algorithm suffers from a low detection and accuracy rate.
H. M. Sun  et al.  [19]Detecting worms and other malware by using sequences of WinAPI calls.Approach is limited to the detection of worms and exploits the use of hard-coded addresses of API calls.
J. Bergeron et al. [20]Proposed a slicing algorithm for disassembling binary executables.Graphs created are huge in size, thus the model is not computationally feasible.
Q. Zhang et al. [21]Approach for recognizing metamorphic malware by using fully automated static analysis of executables.Absence of analysis of the parameters passed to library or system functions.
V. S. Sathyanarayan et al. [22]Static extraction to extract API calls from known malware in order to construct a signature for an entire class.Detection of malware families does not work for packed malware.
J. C. Rabek et al. [23]Host-based technique for detecting several general classes of malicious code in software executables.Not applicable for detecting all malicious code in executable.
A. Damodaran et al. [24]Comparison of malware detection techniques based on static, dynamic, and hybdrid analysis.Disadvantage is that it is thwarted easily by obfuscation techniques.
W. Wong et al. [25]Method for detecting metamorphic viruses using Hidden Markov models.Model can be defeated by inserting a sufficient amount of code from benign files into each virus
V. P. Nair et al. [26]Tracing malware API calls via dynamic monitoring within an emulator to extract critical APIs.Applicability of the method to detection of new malware families are limited.
G. Suarez-Tangi et al. [27]Differential analysis to isolate software components that are irrelevant to study the behavior of malicious riders.Study is vulnerable to update attacks since the payload is stored in a remote host.
Y. Zhou et al. [28]Android platform with the aim to systematize or characterize existing Android malware.Detection of Android malware that shows the rapid development and increased sophistication, posing significant challenges to this system.
L. K. Yan et al. [30]DroidScope, an Android analysis platform that continues the tradition of virtualization-based malware analysis.Overall performance of the model is less, compared to others.
G. Canfora et al. [31]Method for detecting malware based on the occurrences of a specific subset of system calls, a weighted sum of a subset of permissions.Precise patterns and sequences of system calls that could be recurrent in malicious code fragments were ignored.
D. Su et al. [32]Automated community detection method for Android malware apps by building a relation graph based on their static features.This method for malware app family classification is not as precise as supervised learning approaches.
X. Liu et al. [33]Collect and analyze users action (API) on an Android platform to detect privacy leakage.Fail when tracking APIs used by other apps that are not listed in the configure file.
R. Casolare et al. [34]Static approach, based on formal methods, which exploit the model checking technique.Limitations of method is that the generation of the first heuristic is not automatic.
Table 2. Results of models on Virusshare dataset.
ModelPrecision (%)Recall (%)F1-Score (%)Accuracy (%)
DNN99.199.199.199.1
1D-CNN97.997.997.997.9
CNN-LSTM69.479.673.479.6
XGBOOST97.897.897.597.8
Random Forest97.397.2596.8997.35
AdaBoostM196.897.896.497.0
SVM89.2888.2488.7286.8
J4887.5488.0887.686.53
Table 3. Network architecture and hyperparameters of deep neural network models.
ModelTopology
DNNDense1_units = 100; Dropout = 0.2; Activation = relu; Dense2_units = 50;
Dropout = 0.2; Activation = relu; dense_final_units: 6; Activation = softmax; Optimizer: Adam; Learning rate: 0.001; batch size = 128, epoch = 40
1D-CNNConv1D: (num_filters = 15, filter_size: 2); Activation = relu; Maxpooling1D; Conv1D: (num_filters = 15, filter_size = 2); Activation = relu; Maxpooling1D; Flatten; Dense units = 100; Activation: relu; dropout = 0.05; dense_ final_units = 6; Activation = Softmax; optimizer = Adam, epoch = 15
SVMkernel = rbf; gamma = 1; max_iter = 500; decision_function_shape = ovo
XGBOOSTXGBClassifier()
CNN-LSTMConv1D: ( num_filters = 15, filter_size = 2); Activation: relu; maxpooling1D; LSTM_units = 100; Dense_units = 100; Activation = relu; Dropout = 0.05; Dense_units = 50; Activation = relu; Dropout = 0.05; Dense_final_units = 6; Activation = softmax; Optimizer = adam
Table 4. Performance matrix of machine learning classifiers on system call sequence.
ClassifierAccuracyF1-MeasureTPRAUC
Random Forest97.80%97.8%97.7%0.998
AdaBoostM197.37%96.4%96.8%0.97
J4895.12%95.1%96.0%0.965
SVM95.02%95.3%95.1%0.963
XGBoost99.82%99.82%99.71%0.998
Table 5. Performance of multi-level perceptron on varying the dropout rate.
DropoutAccuracy (%)F1-Score (%)Precision (%)Recall (%)
0.198.4898.4898.4898.48
0.297.9297.9297.9797.87
0.398.3898.3898.4898.28
0.498.1398.1497.4198.89
0.598.0398.0497.5098.58
0.697.9797.9698.5797.37
Table 6. Performance metrics of machine learning models.
ClassifierAccuracy (%)F-Measure (%)Precision (%)Recall (%)
J4899.599.499.599.3
AdaboostMI(J48)99.599.499.599.3
Random Forest99.799.699.599.7
Table 7. Data set description with samples, number of families, and number of variants of each family.
ConstructorsNumber of FamiliesNumber of Variants
NGVCK521
G2521
PSMPC521
MPCGEN521
Real Malware Samples115–77
Table 8. Pairwise alignment of two samples generated using the NGVCK constructor. The sequence shows match, mismatch, and gaps inserted for aligning the samples.
Sample 1Sample 2
pushpush
retnretn
# -mov
# -sub
andand
lealea
movmov
movmov
# -popa
# -sub
jmpjmp
* incmov
* shrand
* rormov
* cmpdec
Table 9. Replacement of opcodes for malware generator (NGVCK, G2, PSMPC, and MPCGEN). For all generators, mov, push, pop, and jmp instructions are replaced.
NGVCKG2PSMPCMPCGEN
add movint calljnz loopmov pop
push movmov pop-cmp mov
mov poplea mov-int mov
call movxor cwd-mov lea
mov submov movsb-jmp int
push addrep movsb-call add
mov xorxor mov-add movsw
and movcwd mov-lea jmp
mov jzint inc-movsw mov
mov cmpmovsb movsw-push pop
Publisher’s Note: MDPI stays neutral with regard to jurisdictional claims in published maps and institutional affiliations.

