Abstract
The State of Wisconsin is located in an unusually water-rich portion of the world in the western part of the Great Lakes region of North America. This article presents an overview of the major groundwater quantity and quality concerns for this region in a geologic context. The water quantity concerns are most prominent in the central sand plain region and portions of a Paleozoic confined sandstone aquifer in eastern Wisconsin. Water quality concerns are more varied, with significant impacts from both naturally occurring inorganic contaminants and anthropogenic sources. Naturally occurring contaminants include radium, arsenic and associated heavy metals, fluoride, strontium, and others. Anthropogenic contaminants include nitrate, bacteria, viruses, as well as endocrine disrupting compounds. Groundwater quality in the region is highly dependent upon local geology and land use, but water bearing geologic units of all ages, Precambrian through Quaternary, are impacted by at least one kind of contaminant.
1. Introduction
The State of Wisconsin, United States, is located in the western Great Lakes region of North America (Figure 1). This region experiences humid continental climates with warm to hot summers, but cold winters [1]. Rainfall and snowfall are abundant, with total annual precipitation that varies significantly across the state, ranging from a high in the south of 96.72 cm (38.08 inches) to a low of 71.93 cm (28.32 inches) in the northeast [2]. The population of Wisconsin is just under 5.7 million people [3], with the largest density in the eastern and southeastern portions of the state.
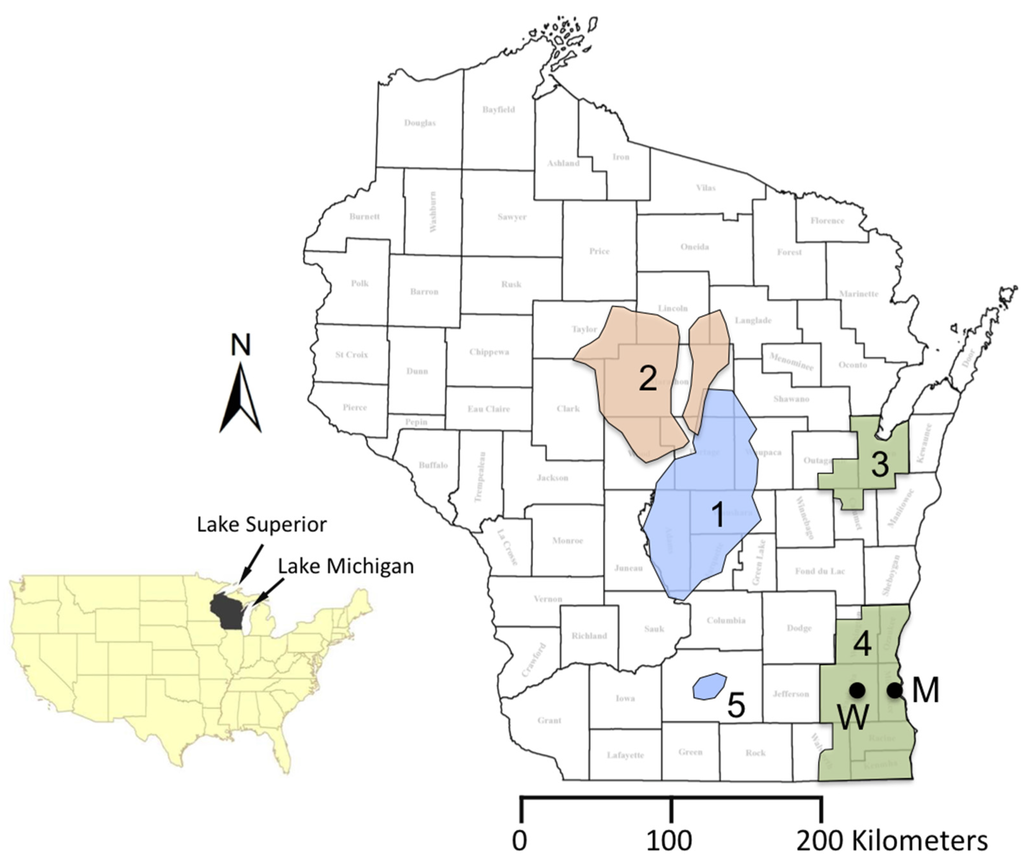
Figure 1.
Map showing the location of Wisconsin counties with important regions of the state highlighted. Inset map shows the location of Wisconsin in the lower 48 contiguous United States. Numbered regions are as follows: (1) Central sand plain; (2) Groundwater deficient portion of north-central Wisconsin; (3) Northeast Groundwater Management Area; (4) Southeast Groundwater Management Area; (5) Area of declining water levels in Dane County. Lettered points refer to locations of Milwaukee (M) and Waukesha (W) [4,5,6,7,8].
Wisconsin is located in an unusually water-rich portion of the world, and it borders two of the Great Lakes, Lake Superior and Lake Michigan (Figure 1). It also contains 15,074 documented inland lakes [9], most of which were formed as great lobes of ice from the Laurentide Ice Sheet receded from the northern and eastern portions of the state during the Late Pleistocene Epoch about 13,000 years ago [10]. Wisconsin is also extremely fortunate to have abundant supplies of fresh groundwater in Paleozoic age sedimentary rocks and Pleistocene glacial sediments, which are present throughout a large portion of the state. Historically, very few areas in the region have faced water quantity limitations, but expanding water use, coupled with long-term aquifer drawdown, has resulted in some noteworthy water supply challenges in certain areas of the state.
About 88% of water withdrawal in Wisconsin is from surface water supplies, with the remaining 12% from groundwater [11]. Total water use statistics are skewed toward surface water withdrawals because of mostly non-consumptive water use for cooling purposes during power generation (74 percent). The largest users of surface water (excluding power generation) include paper production (33 percent) and municipal public supply (29 percent). The largest consumers of groundwater include municipal water supply systems (37 percent) and agricultural irrigation (40 percent) [11]. It is estimated that 90% of groundwater withdrawal for irrigation purposes is consumed and not returned to the basin via surface water or groundwater [12].
In 2013, there were approximately 950 billion liters (250 billion gallons) of groundwater withdrawn, with the majority of water used for agricultural and municipal water supply (Table 1). There are approximately 800,000 small private wells statewide, plus an additional 14,000 high capacity wells that serve industry, municipal, and agricultural purposes as of 2013 [13]. Approximately 8408 of the high capacity wells are capable of producing above the state defined threshold of 265 liters per minute (70 gallons per minute), and the rest are statutory high capacity wells. Since 1950, nearly 60% of high capacity wells in Wisconsin have been installed for irrigation purposes [14].

Table 1.
Total groundwater withdrawals by water use for Wisconsin in 2013 was approximately 950 billion liters (250 billion gallons) [11].
| Water Use | Percentage of Total |
|---|---|
| Agricultural Irrigation | 40% |
| Municipal Public Water | 37% |
| Industrial | 5% |
| Aquaculture | 3% |
| Cranberry Production | 4% |
| All other uses | 11% |
Wisconsin is also fortunate to have had relatively good groundwater quality throughout much of its history. A rigorous understanding of groundwater quality and quantity issues that began a century ago [15] has contributed to keeping groundwater safe and available. In most areas, abundant precipitation, thick aquifers, and relatively little saline groundwater have resulted in a high quality water supply for most of the state’s residents [16]. However, ongoing land use changes, aquifer drawdown, and recognition of emerging contaminants over the past 25 years have shifted the focus of much of the groundwater research toward water quality issues. This article presents a review of the water quality and quantity issues faced in one of the most water-rich areas of the world.
2. Geologic Setting
Although regional climate is important, the geology and geologic history of Wisconsin play a critical role in understanding the water quality and quantity issues that the region faces. A general overview of the geology of Wisconsin is presented here for context, but the reader is directed toward other publications that provide a greater level of detail [17,18,19,20,21,22,23,24].
The physiographic setting of Wisconsin lies at the junction of the Superior uplands in the north, and several subsections of the Central Lowlands Province in the United States. A veneer of unconsolidated Quaternary deposits overlies bedrock throughout much of the region [24]. Bedrock consists of a complex array of eroded Precambrian rocks, overlain by a sequence of marine rocks related to ocean transgression-regression cycles. Bedrock units dip radially away from the Wisconsin Arch, toward the Michigan basin in the east, the Illinois basin in the south, and gently toward Iowa and Minnesota in the west. Wisconsin’s geologic history is preserved in rocks and unconsolidated sediments from three distinctly different periods of time, with long intervals of erosion or nondeposition occurring between each [20].
2.1. Precambrian Geology
Rocks from the first of these three time intervals were deposited episodically over a long interval of Precambrian time from late in the Archean Eon (~2.8 billion years ago) to around 1 billion years ago. Many of these rocks consist of crystalline igneous and metamorphic rock, with significant amounts of sedimentary rocks that have been subjected to varying degrees of metamorphism after deposition. Rocks of the Precambrian “basement” are present beneath the entire state, but are concealed in the southern portion of the state by Paleozoic sedimentary rocks, and in much of the northern portion of the state by Pleistocene sediments. While Precambrian rocks serve as important aquifers in parts of central and northwestern Wisconsin, most usage is restricted to domestic well use in areas with relatively low populations.
2.2. Paleozoic History
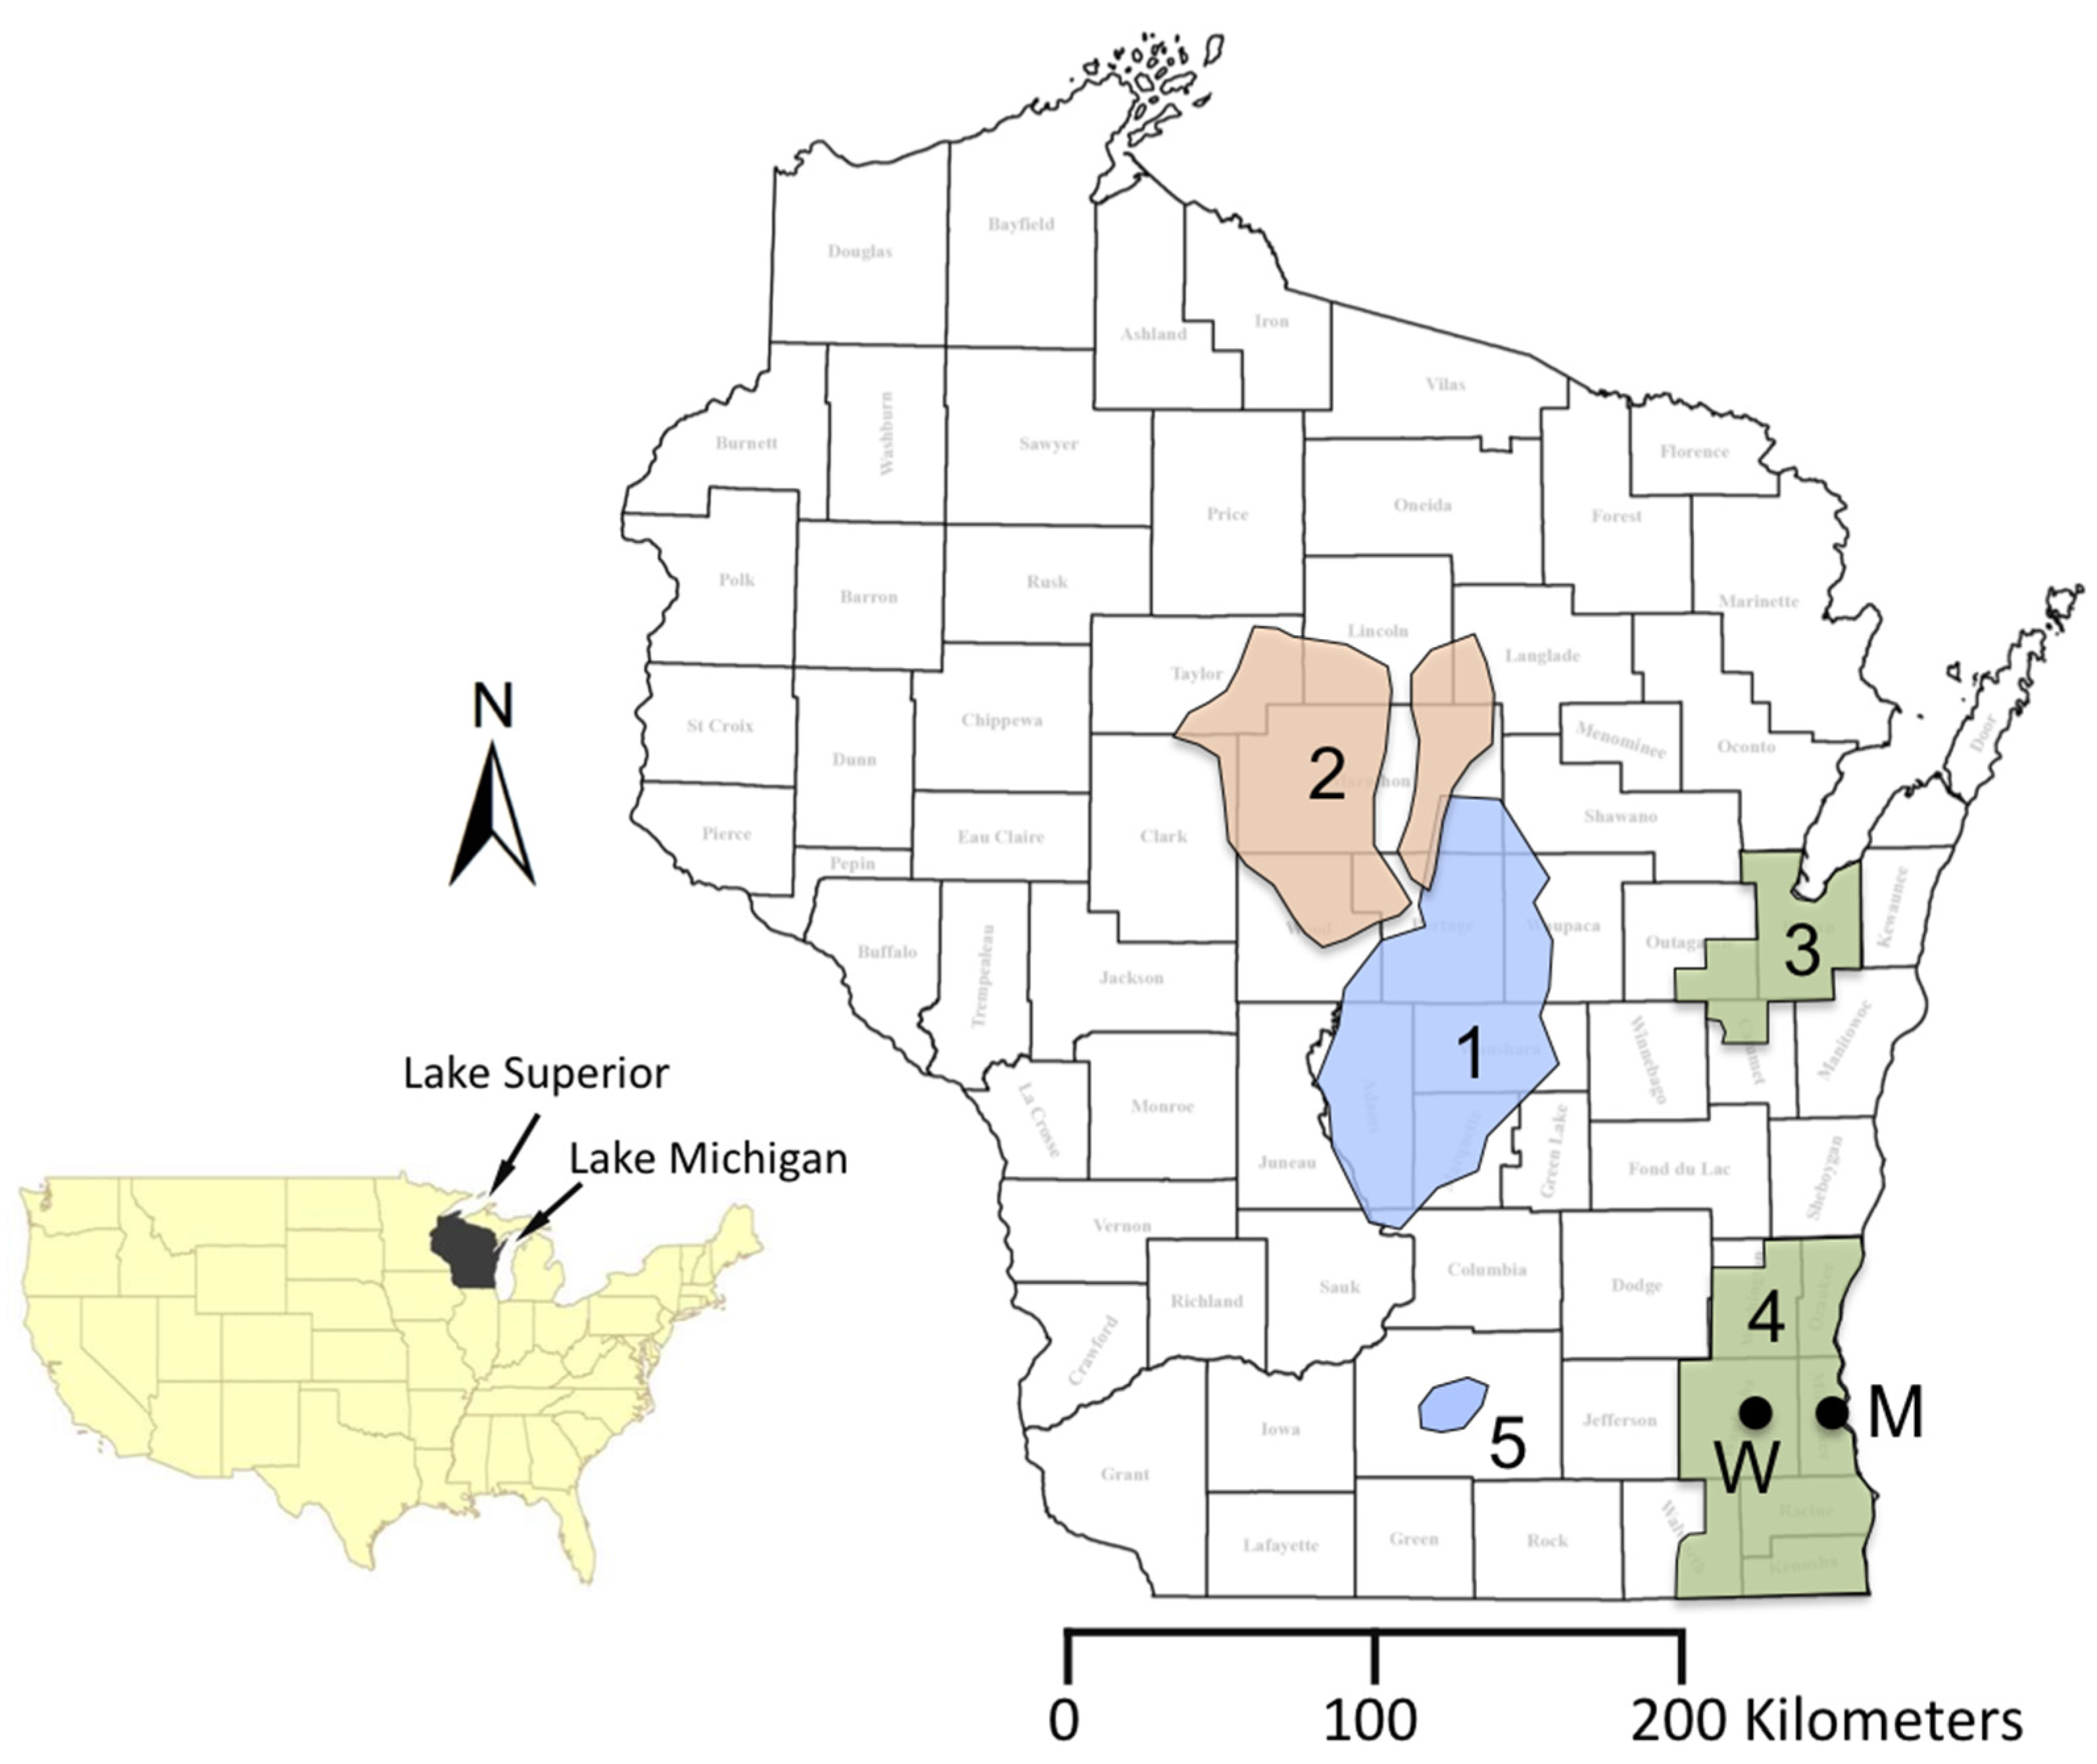
The second interval of Earth’s history that is recorded in Wisconsin includes sedimentary rocks deposited during the Early to Middle Paleozoic Era. Rocks deposited during this interval consist mainly of sandstone, dolostone, and shale, and form the bedrock throughout much of the southern two-thirds of the state (Figure 2). Nearly all of these rocks are marine or marginal marine, deposited during some of the highest sea levels of the Paleozoic Era. These rocks range in age from Late Cambrian to Late Devonian, with the Devonian rocks only preserved along the Lake Michigan shoreline north of Milwaukee. Paleozoic sedimentary rocks range in thickness from 0 m thick to at least 700 meters (2300 feet) thick in parts of eastern and southeastern Wisconsin. These strata thicken significantly toward the ancestral Michigan basin, where younger Paleozoic and Mesozoic sedimentary rocks overlie them [25,26]. Key events in the history of development of Wisconsin’s aquifers included formation of the ancestral Michigan basin to the east (Figure 2), as well as the Illinois basin to the south. Later fluid flow events emanating from these basins appear to have influenced the mineralogy of much of the Paleozoic bedrock, which has important implications for its present day groundwater quality [26].
Paleozoic rocks in Wisconsin and adjacent states are only slightly deformed, with gentle folding and faulting occurring during the Paleozoic Era (e.g., [25,26]). Subsidence of the Michigan basin, a classic intracratonic sedimentary basin, had the most pronounced effect on the structure of these rocks, with development beginning during the Late Cambrian and occurring simultaneously with sedimentation throughout the Paleozoic Era. The subsidence of the ancestral Michigan basin is centered over a portion of the Proterozoic Midcontinent rift system [25]. This subsidence resulted in a significant dip of the strata toward the center of the basin, which resulted in a concentric “bull’s-eye” pattern on bedrock geologic maps (Figure 2). Paleozoic strata in eastern portions of Wisconsin typically dip eastward between about 5 and 7.5 m/km (25 and 40 ft/mi) [20].

Figure 2.
Simplified bedrock geologic map for the western U.S. Great Lakes region showing Wisconsin and Michigan, USA. Geologic systems of rock are as follows: pϵ = Precambrian, ϵ = Cambrian, O = Ordovician, S = Silurian, D = Devonian, M = Mississippian, Pn = Pennsylvanian, J = Jurassic. Modified from [20].
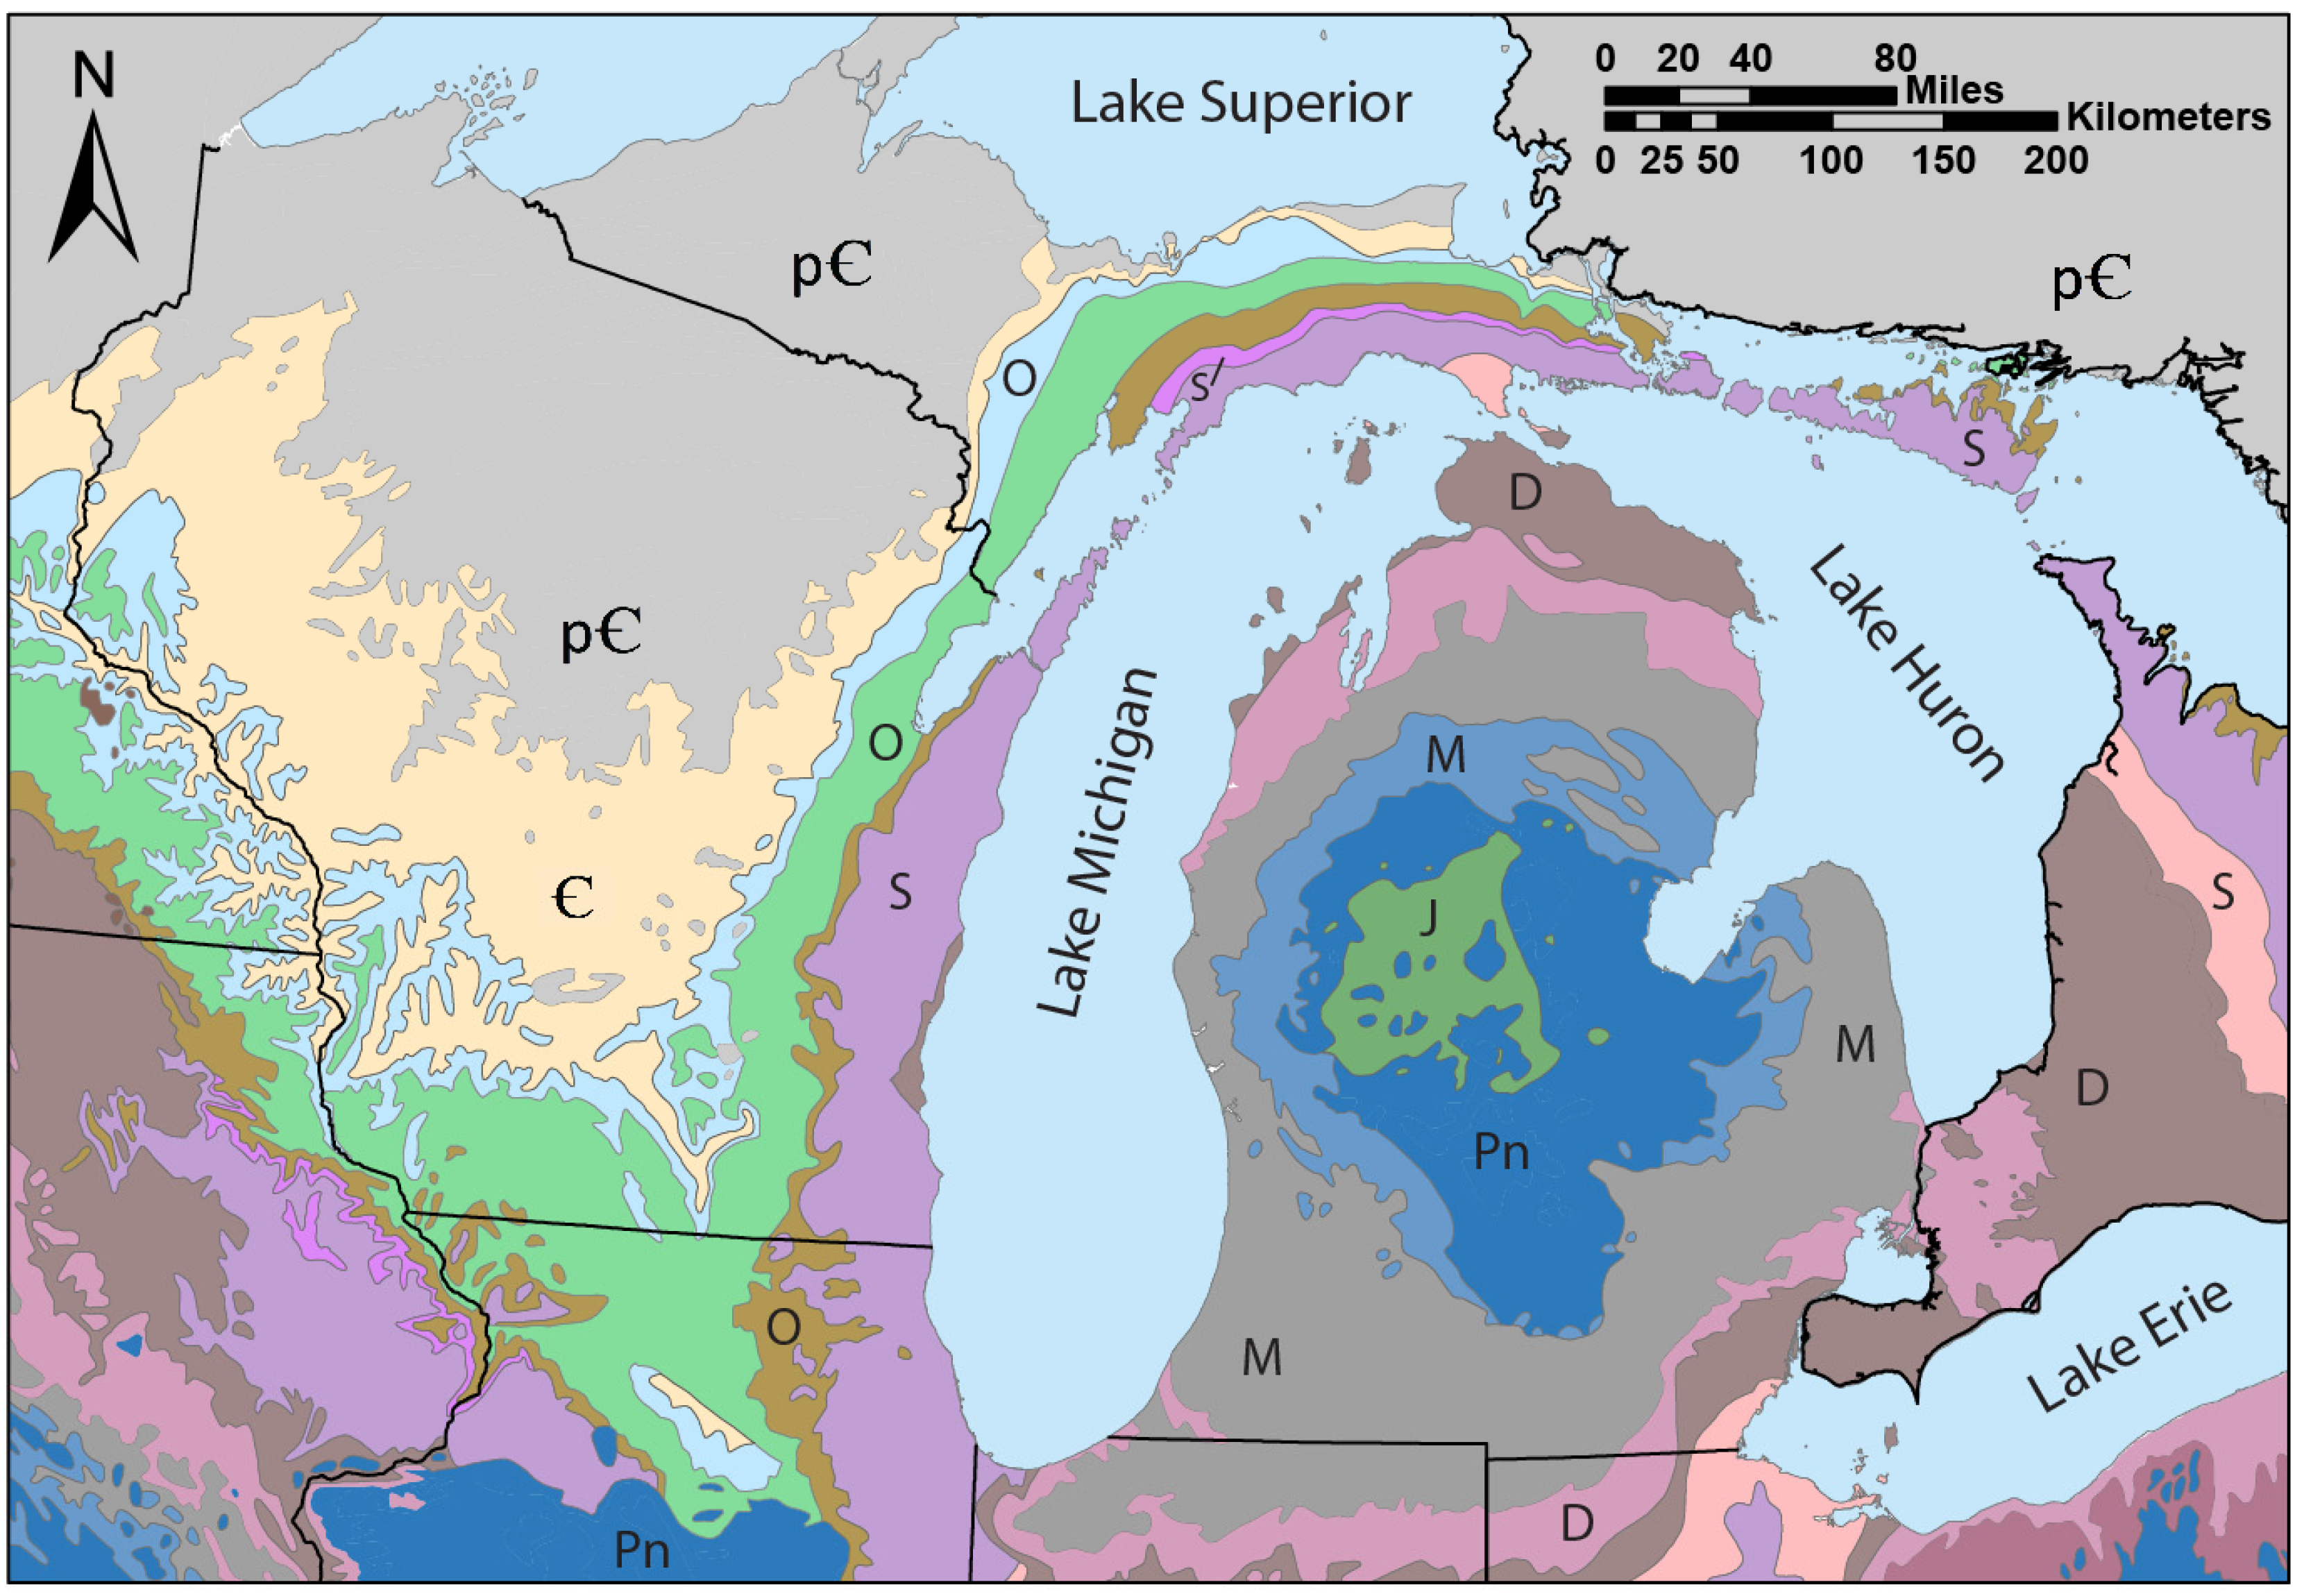
Figure 3 presents a generalized stratigraphy of Paleozoic sedimentary rocks in Wisconsin, with only a generalized overview of the stratigraphy presented here. The lowermost Paleozoic rocks in Wisconsin are Middle to Upper Cambrian sandstones (~520 to 485 million years ago), which were deposited as sea level gradually rose to cover most of the North American craton [27]. They are exposed over a large portion of western and central Wisconsin, and they form the principal portion of the deep confined aquifer system in eastern and southern Wisconsin. These sandstones have average thicknesses of about 120 m [5,6,28,29]. These rocks have been extensively studied along the Mississippi River Valley in western Wisconsin (e.g., [27]), but their poor exposure beneath glacial sediments in eastern and southeastern Wisconsin has impeded research on these rocks, despite their regional importance as aquifers. A lack of economic deposits of petroleum or natural gas in the region has further limited our understanding of these units.
The Ordovician Period (485 to 443 million years ago) saw variable deposition of carbonate rocks, sandstones, and shale. Rocks of this age generally mimic the outcrop pattern of Cambrian rocks (Figure 2) and are exposed along a narrow horseshoe-shaped band stretching from the Mississippi River Valley in the west, south to the Illinois Border, and then northeastward along the eastern portion of the state where they border younger Silurian rocks. The lower half of the Ordovician section includes carbonate rocks of the Prairie du Chien Group, sandstones and minor shale of the Ancell Group, and carbonates from the Sinnipee Group (Figure 3). The vast majority of the carbonates in Wisconsin have been transformed from limestone to dolostone, with most limestone restricted to the southwestern portion of the state [26]. The most important aquifer within the Ordovician section is the Ancell Group, which consists mainly of the St. Peter Sandstone and a few other relatively thin units. The upper-half of the Ordovician section is dominated by the Maquoketa Shale, which is the most important regional confining unit and only present in eastern Wisconsin.

Figure 3.
Simplified stratigraphic column for Paleozoic rocks in northeastern Wisconsin. Pleistocene sedimentary and younger Silurian and Devonian strata for southeastern Wisconsin are not shown here for simplicity, but can be found elsewhere [30,31].
Figure 3.
Simplified stratigraphic column for Paleozoic rocks in northeastern Wisconsin. Pleistocene sedimentary and younger Silurian and Devonian strata for southeastern Wisconsin are not shown here for simplicity, but can be found elsewhere [30,31].
The Middle and Late Paleozoic Era is recorded mainly in eastern Wisconsin by a sequence of Silurian (443 to 419 million years old) dolostone units as much as 240 m thick that were deposited in both open and marginal marine environments. These rocks form the backbone of the Niagara cuesta that forms the uplands of eastern Wisconsin. Numerous stratigraphic and bedrock investigations have been conducted on northeastern Wisconsin’s Silurian rocks (see [20,31] and references therein). Younger Devonian rocks are only locally important along a narrow band near Lake Michigan and are not a focus of this article. There is a region-wide erosional disconformity throughout the Midwestern United States between the Late Paleozoic and the Jurassic Period, known as “The Lost Interval” [32]. This interval is significant, despite the lack of strata from this period, because regional denudation and likely significant karst development occurred in certain carbonate rocks in the region during this time.
2.3. Quaternary History
The youngest of the three geologic intervals in Wisconsin was recorded during the later part of the Pleistocene Epoch of the Quaternary Period (2.6 million to 11,700 years ago). These sediments range in age from at least 780,000 years old in parts of central and northwestern Wisconsin, to about 13,000 years old, with the vast majority of these sediments deposited during the last three advances of ice lobes during the Wisconsin Glaciation (between about 32,000 and 13,000 years before present [10,24]). Only about three-fourths of Wisconsin was glaciated, leaving a region of the southwestern portion of the state known as “The Driftless Area.”
The absence of major mountain-building events in the region for at least 1.5 billon years, coupled with extensive Paleozoic deposition and several Pleistocene glacial advances, has resulted in a relatively gentle topography throughout most of Wisconsin. The maximum topographic relief in the state is less than 425 meters (1400 feet) [33]. The most significant local relief results from the erosional resistance of castellated mounds of well-cemented Cambrian quartz sandstone, along with several large quartzite monadnocks that result in hills up to 150 to 200 meters high. Additional topographic relief of up to 70 meters occurs along regional glacially sculpted erosional ridges, such as the Niagara Escarpment in eastern Wisconsin, and an extensive array of end moraines from lobes of the Laurentide ice sheet that invaded Wisconsin during the Late Pleistocene.
2.4. Hydrostratigraphy
The hydrostratigraphy in the state is relatively straightforward overall, but locally complex due to significant variation in the geology of Precambrian bedrock and Pleistocene glacial sediments. In contrast, the hydrostratigraphy of the Paleozoic rocks is relatively consistent throughout the region. Table 2 presents a generalized hydrostratigraphy for Wisconsin. In general, Precambrian basement rocks have relatively low porosity and permeability, with fracture flow providing the most significant permeability in most rocks, with the exception of some sandstones of the Midcontinent Rift System in northwestern Wisconsin [34]. In some areas, water is extracted principally from a single hydrostratigraphic unit. However, in some regions, multiple aquifers may be accessed by wells in close proximity. In southeastern Wisconsin, at least three aquifers are used. In other regions, such as the Niagara Escarpment region of northeastern Wisconsin, as many as 3 or 4 aquifers are used by domestic wells in close proximity. The well depth varies based on a number of factors, including well driller, water quality concerns, cost, and water quantity needs.
Paleozoic sedimentary rocks supply a large proportion of the water wells in the state. The most prolific bedrock aquifers include the Cambrian sandstones and the Ordovician St. Peter Sandstone (Ancell Group), which are present across at least half of the area of the state. These sandstones form the principal portion of the deep confined aquifer system in parts of Wisconsin and are about 120 m thick on average, but can be substantially thicker in some areas (e.g., [5,7,28]). Ordovician dolostones that overlie each of these sandstone aquifers (Figure 3, Table 2) form important aquifers for some domestic water wells, but the vast majority of high capacity wells in these areas are open to one or both of the sandstone aquifers.
Throughout a narrow band of eastern Wisconsin, and in parts of adjacent states, the overlying Late Ordovician Maquoketa Shale acts as a regional aquitard (e.g., [28,35,36]). East of this boundary, which is well defined in places by the topographic expression of the Niagara Escarpment [20], dolostones of Silurian age form the majority of the remaining bedrock stratigraphic section in eastern Wisconsin. In southeastern Wisconsin, the Silurian bedrock aquifer is particularly important in regions not served by municipal supplies [7]. These rocks typically contain well-developed karst features, especially in parts of east-central and northeastern Wisconsin where the thickness of unconsolidated sediments is low. Karst development in these rocks began as early as the Devonian Period, but the timing of most karst features is not well known. Recent radiometric age dates on bones and charcoal from caves in the region shows that sediment fills are at least 6000 to 8000 years old, suggesting that the karst development likely occurred prior to the Holocene [37,38]. The karst-enhanced fractured Silurian dolostones provide an important regional aquifer for residents east of the Niagara Escarpment, and many high-capacity wells are open to this aquifer system.
In eastern Wisconsin, the Cambrian-Ordovician aquifer is unconfined to the west of the Maquoketa boundary throughout eastern Wisconsin and into northeastern Illinois, with the primary recharge area to the west of the boundary [7,28,39,40]. Radiocarbon dating, stable isotope analysis and noble gas data for deep aquifer waters in southeastern and northeastern Wisconsin reveal 14C ages for groundwater between 5000 and 26,000 years old [36,41].
The Pleistocene sediments in the region are divided into four major classes, including glacial till (ground and end moraines), glaciolacustrine (lake) sediments, outwash (sands and gravels), and pitted outwash with local ice contact deposits (e.g., [24]). The complex regional and stratigraphic variation of these deposits is beyond the scope of this article, but they are an important aquifer system, and they play a crucial role in some of Wisconsin’s major groundwater quantity and quality problems. One portion of the Pleistocene sediments that is particularly important to describe is known as the “central sand plain” region, which covers a multi-county region in the central portion of the state. This region consists of thick glacial outwash overlying Precambrian and Paleozoic bedrock. This region has seen extensive development of groundwater resources for irrigation, and significant groundwater quality impacts have occurred there.
Table 2.
Simplified hydrostratigraphy for Wisconsin (after [5,6,7,28]).
| Geologic Age | Geologic Unit (Thickness, Meters) | Lithology | Hydrostratigraphic Unit | |
|---|---|---|---|---|
| Cenozoic | Quaternary (Pleistocene) | Unconsolidated deposits (0–60 meters) Locally >150 m | Lacustrine silt and clay, glacial till, fluvial sand and gravel, and other deposits. | Local unconfined aquifer (sand and gravel) or regional confining unit (lacustrine clays and tills). |
| Paleozoic | Devonian | Black shale locally over limestone and dolostone. | Upper Aquifer; only present in southeastern Wisconsin along Lake Michigan Shoreline. | |
| Silurian | Undifferentiated (0–240 m) | Dolostone; fractured and karsted in many locations. | Upper Aquifer; Karsted in many locations of northeastern Wisconsin. | |
| Ordovician | Maquoketa Formation (0–150 meters) | Shale, dolomitic shale, and dolomite. | Confining Units; Sinnipee Group Carbonates are locally used as aquifers for domestic use. | |
| Sinnipee Group (120 meters) | Dolostone with some shale. Limestone in portions of southwestern Wisconsin. | |||
| Ancell Group (0–90 meters) | Silty sandstone, fine- to medium-grained sandstone, sandy shale. | Confined Deep Aquifer. | ||
| Prairie du Chien Group (0–60 meters) | Dolostone with varying amounts of oolitic chert and minor interbedded sandstone. | Generally an aquitard relative to the adjacent sandstones in eastern Wisconsin; effective aquifer in western Wisconsin. | ||
| Cambrian | Trempealeau Group (0–15 m) | Fine- to medium-grained sandstone with some silty glauconitic dolomite. | Confined Deep Aquifer. | |
| Tunnel City Group (30–46 m) | Fine- to medium-grained sandstone, silty sandstone to sandy dolomite. Abundant glauconite commonly observed. | |||
| Elk Mound Group (75–90 m) | Very-fine to coarse-grained sandstone. | |||
| Precambrian | Precambrian | Undifferentiated | Crystalline rock, predominantly red granite, contains igneous and metamorphic rock. Limited sedimentary rocks (sandstones, dolostones). | Yields little to no water in many cases. Local aquifers, especially in Midcontinent Rift System rocks of northwestern Wisconsin. |
3. Groundwater Quantity Concerns
3.1. Overview
Wisconsin receives on average about 25 cm (10 inches) of precipitation above and beyond the evapotranspiration demands of its climate and vegetation [42]. As a result, the state’s rivers and streams receive the majority of streamflow from groundwater, and lake levels are often similar to the local groundwater elevation. Wisconsin has limited regions with major groundwater quantity concerns compared to most regions of the world. Although Wisconsin is generally considered to be a water rich state, there is increasing attention being paid to issues of water quantity. In addition to the previously mentioned groundwater deficient areas, groundwater withdrawal effects are contributing to significant drawdown of confined aquifer systems as well as the effect of high capacity wells on lake levels and reduced streamflow and spring discharge (e.g., [4,43]).
Unlike western states that practice a prior-appropriation system of water regulation, many eastern states including Wisconsin follow what is known as a reasonable use doctrine [4]. The reasonable use doctrine historically has allowed a landowner to withdraw any amount of water as long as it goes towards some beneficial use on the overlying landscape. Water quantity concerns over the past two decades have compelled Wisconsin to revisit the way in which the state regulates groundwater. In 2003, the state passed Wisconsin Act 310 that legally recognized the interaction between surface and groundwater and the impact that individual wells may have on lakes, rivers, streams, springs and wetlands. The law allowed the state’s regulatory agency to consider the environmental impact of a high capacity well located within 365 meters (1200 feet) of an Outstanding or Exceptional Resource Water or trout stream or springs with a flow greater than 1 cubic foot per second (0.0283 m3/sec) [44]. This law also allowed for the designation of Groundwater Management Areas to encourage coordinated management and address problems related to groundwater pumping at a regional scale between state and local units of government. A Wisconsin Supreme Court Case in 2011 concerning Lake Beulah in southeastern Wisconsin found that the state had a general duty to consider the impact of proposed wells when presented with sufficient evidence of potential harm to any water of the state, regardless of its distance from a water body [45]. More recently in 2014, an administrative law judge ruled that the state must consider the “cumulative impacts” of existing wells and reasonable expected cumulative impacts of other users when making determinations regarding significant adverse environmental impacts [46]. It remains to be seen what effect this ruling will have on future groundwater management decisions.
In 2008, Wisconsin along with the other Great Lake states and two Canadian provinces ratified the Great Lakes Compact [47]. The agreement expanded high capacity well registration and reporting requirements and placed additional water conservation and efficiency goals on water users in the Great Lakes Basin [48]. In addition, it discourages the diversion of water outside the boundaries of the Great Lakes Basin; limited exceptions exist for straddling communities as long as water is returned to the basin. The Great Lakes Compact has had significant implications for the City of Waukesha (Figure 1), because it does not reside inside the boundaries of the Great Lakes basin, despite being located near Lake Michigan. The municipal water supply has seen increased levels of radium as a result of the significant drawdown in the confined aquifer. Limited options exist to expand groundwater use. As a result, the city hopes to partner with a community water system in the Great Lakes Basin to access Lake Michigan water. However, it must receive approval from ratifying states and provinces of the Compact if it is to be granted access.
3.2. Groundwater Management Areas in the Confined Sandstone Aquifer
Recent groundwater legislation, 2003 Wisconsin’s Groundwater Protection Act 310, addressed concerns about groundwater as a resource and provided the Wisconsin Department of Natural Resources (WDNR) with additional groundwater management tools [5,6,29]. The WDNR has designated parts of northeastern and southeastern Wisconsin as Groundwater Management Areas (GMAs) due to the fact that water levels in the confined sandstone aquifers have declined by more than 150 feet from pre-development levels in the late 1800s [44] (Figure 1). In the Lower Fox River Valley in northeastern Wisconsin, this northeast GMA includes Brown County and portions of Outagamie and Calumet counties, while in Southeastern Wisconsin the southeast GMA includes Waukesha, Kenosha, Racine, Milwaukee, and Ozaukee counties, along with portions of Washington and Walworth counties.
Groundwater use in these regions began in the late nineteenth century. Flowing artesian wells were common in parts of eastern Wisconsin for wells that penetrated the Cambrian-Ordovician confined aquifer (Figure 3, Table 2). The Southeast GMA has experienced the greatest drawdown levels observed in the state, with water levels in the confined aquifer dropping as much as 150 meters (500 feet) by the year 2000 [49]. The major pumping center in southeastern Wisconsin has shifted westward from the city of Milwaukee to the city of Waukesha due to cessation of pumping by communities now using Lake Michigan water, along with increased pumping by growing communities farther away from the Lake Michigan shoreline. A recent model [49] predicts an additional 30 meters (100 feet) of drawdown between 2000 and 2020.
The Northeast GMA has also experienced significant drawdowns, with some areas of central Brown County dropping at least 120 meters (400 feet) between predevelopment conditions and 2005 [5,6,29]. The Northeast GMA contains two distinct cones of depression in the confined aquifer, one of which is located near Green Bay and De Pere in central Brown County, with the other located farther south near the “Fox Cities” region of Kimberly, Kaukauna, and Little Chute along the Fox River. The southern Fox Cities cone of depression has seen consistent drawdown during the last century. However, the northern cone has seen substantial changes in pumping as communities expanded and later switched to surface water supplies in 1957 and 2007.
Most recently, the opportunity to switch to surface water was possible due to state legislation passed in 1998, which allowed communities to combine efforts to address water problems. Six smaller communities surrounding Green Bay formed the Central Brown County Water Authority (CBCWA) in 1999. After evaluating options that included water quality and long term water quantity concerns, an agreement was signed by the CBCWA to purchase water from the City of Manitowoc’s Public Water Utility about 65 miles to the southeast along the Lake Michigan shoreline. Two other communities decided to purchase their municipal water from the City of Green Bay beginning in 2006, with another community adding in 2011. These communities currently use their wells as a backup in case of pipeline interruptions, and some of the high capacity municipal wells in the region have been abandoned. The recent decisions to switch to surface water were driven by concerns regarding radium levels in groundwater (see Section 4.1.1 below).
The response to these communities switching from groundwater to surface water supplies has resulted in a dramatic recovery of the potentiometric surface in the confined aquifer of central Brown County. During 2006–2007, pumping in central Brown County decreased from about 60 million liters per day (16 million gallons per day) to about 16 million liters per day (4.2 million gallons per day). Water levels increased by as much as 60 meters (200 feet) in some parts of the region, resulting in some flowing artesian wells and a deep quarry flooding [5,6,29,50]. Water levels have continued to rise through early 2015. A more complete and up to date history of the northeastern GMA is forthcoming [29].
3.3. The Central Sand Plains
The central sand plains region is located near the center of Wisconsin (Figure 1). The soil properties make it unique from the surrounding areas of the state. Comprised of approximately 6400 km2, the region is composed mainly of unconsolidated sandy deposits often >30 m thick with nearly level topography. The surface horizons average 93% sand and the subsurface horizons are 98% sand, which results in high infiltration rates and very little runoff [8]. As a result, most areas are extremely well drained and groundwater recharge is high [51]. Groundwater is intimately connected to surface waters, with baseflow representing upwards of 90% of annual streamflow of headwater streams [52]; while many of the region’s kettle lakes are classified as groundwater flow-through systems with no surface water inlet or outlet.
Formed during the Pleistocene Epoch, the central sand plains region is sandwiched between the terminal moraine of the Green Bay Lobe of the Laurentide ice sheet and the driftless region, an area of the state untouched by the last ice age. As the glaciers advanced westward, the ice blocked the southern drainage route for glacial meltwater, and Glacial Lake Wisconsin was formed. Although the glacier never covered the central sand plains region, it served as the storage pond for the glacial meltwater and sediment. The glacier’s eventual retreat reopened the southern drainage route and released the water of Lake Wisconsin southward, carrying with it some sediment, but leaving behind small amounts of clay, silt, and much of the sand that form the present day outwash plain [53].
It was observed early in Wisconsin’s history that the central sand plain region was poorly suited for agricultural development, and as a result people were slow to settle in the region. The land in the sand plain was some of the last to be given away under the Homestead Act of 1862 [54]. Around the early 1900’s wetland drainage districts were established, which taxed local landowners for the cost of the drainage efforts. Receiving little if any benefit from the draining of the wetlands, many farmers were left unable to pay the taxes on their land [54]. As a result, it was not uncommon for farmers to abandon their homesteads after only a few years of work.
In the early 1950’s technological advances in irrigation and industrial fixation of nitrogen available as commercial fertilizer improved farming in the region. The area is well suited for irrigation; highly permeable soils sit upon large aquifers of easily accessible groundwater. Farmers who once relied solely on rainfall now watered crops with water that previously escaped below the plants’ roots. Since 1950, over 3000 high capacity wells have been installed in the central sands region, mostly for irrigation purposes.
In 2012, approximately one-third of all groundwater withdrawals occurred in a three county area within the central sands [11]. Concerns over groundwater pumping go back decades when researchers first began studying the effects of high capacity wells on ground and surface waters. Weeks and Stangland [42] predicted that headwater streams would dry up in the summer of drought years and water levels at groundwater divides would be lowered by 1.2–1.5 m (4–5 ft) if 50% of the land in the region were to eventually be irrigated. More recently Kraft et al. [43] revisited this issue, and using modern groundwater modeling techniques the researchers concluded that present irrigation rates account for a 30%–40% reduction in annual streamflow of headwater streams and a 1.2 m decline of groundwater levels under steady-state model simulations.
Herein lies a major difference between water quantity concerns in arid climates versus more humid climates such as Wisconsin. At present, the current precipitation and evapotranspiration rates in the central sands region of Wisconsin do not suggest that the aquifer is in danger of running dry or being depleted in its entirety. Instead, the concern revolves around the effects irrigation is having on the upper portion of the aquifer that interacts intimately with the region’s lakes, rivers, streams and wetlands. While the decline attributed to groundwater pumping is only a small portion of a >30 m thick aquifer, a 1–2 m decline in water levels is noticed by area residents who have expressed concern over low lake levels and reductions in streamflows in the region [55]. Balancing water use for irrigation, while maintaining the integrity of surface water ecosystems and property values of those businesses and homes that depend on lakes and rivers, is an ongoing groundwater management concern in Wisconsin [56]. The expansion of irrigation beyond the boundaries of the central sand plains region could result in similar concerns in other regions of the upper Midwestern United States.
3.4. Crystalline Bedrock
Groundwater yield can be limited to less than 7.5 liters per minute (2 gallons per minute) in portions of north-central Wisconsin where wells may extend into near-surface crystalline Precambrian rock as a groundwater supply (Figure 1). Water for public and industrial use in this region can be a limiting factor, and these aquifers have been classified as groundwater deficient [4,57]. Domestic wells in parts of central and northern Wisconsin may reach depths of 120 to 210 meters (400 to 700 feet). However, parts of northern Wisconsin have extensive Pleistocene cover that provides adequate water supply in most areas.
3.5. Groundwater Flooding
Several communities have been affected episodically by elevated groundwater levels leading to significant problems of oversupply of groundwater. The most noteworthy recent case was in Spring Green, Wisconsin. In 2008, about 1770 hectares (4378 acres) of land were flooded for over 5 months along the Wisconsin River outside of areas designated as floodplain by the U.S. Federal Emergency Management Administration (FEMA). This occurred as a result of large precipitation events during 2007 and 2008 [58], but the Wisconsin River did not overflow its banks at any time during the 2008 flooding. Overall, these cases are rare, but they have significant economic and human impact on a local scale.
4. Groundwater Quality Concerns
Groundwater quality has received significant attention over the past 25 to 30 years in Wisconsin. For example, recognition of a regional arsenic problem, new U.S. EPA maximum contaminant levels (MCLs), and a growing anthropogenic impact from non-point source land use activities have attracted the attention of regulators, academics, and the general public. Significant attention has been given to the study of arsenic levels and other quality issues. For example, during the period 2007–2010, Wisconsin health departments tested about 4000 rural drinking water supplies for coliform bacteria, nitrate, fluoride, and 13 metals as part of a state-funded program. The results were surprising, in that 47% of those wells exceed one or more health-based water quality standards [59].
This article focuses on problems specific to the region, and does not address ubiquitous problems such as leaking underground storage tanks, landfills, or localized industrial sites. Groundwater quality issues faced by the residents of Wisconsin are divided into both natural and anthropogenic sources. Naturally occurring contaminants are presented first below because an introduction to the geochemical and water-rock interaction history of these rocks provides an important lead-in to anthropogenic topics discussed later.
4.1. Naturally Occurring Inorganic Contaminants
It is important to recognize that the geochemical signature of an aquifer system is a function of the mineralogy of aquifer host rocks, as well as the source and history of fluids that have flowed through the aquifer. Both of these variables have had an effect on groundwater quality in Wisconsin, especially in the deep confined Paleozoic sandstone aquifers of eastern Wisconsin. Naturally occurring inorganic contaminants that have been recognized in Wisconsin include radium, arsenic, nickel, cobalt, fluoride, strontium, aluminum, and manganese. Some of these, such as radium and arsenic (along with associated metals nickel and cobalt) have been widely studied in the region since the 1980s. Some attention has been given to fluoride and strontium, but research on aluminum and manganese in Wisconsin’s aquifers is not as well documented. The discussion below provides a general overview of each contaminant, along with its geologic distribution and relevant literature.
4.1.1. Radium in Sandstone Aquifers of Eastern Wisconsin
Radium is a chemical element with naturally occurring radioactive isotopes that are produced as part of the uranium-to-lead and thorium-to-lead decay series. Numerous regulatory agencies, including the World Health Organization (WHO) and the U.S. EPA have established drinking water limits for radium [60,61]. The limits used by the WHO are 1 Bq/L (27 pCi/L) for 226Ra and 0.1 Bq/L (2.7 pCi/L) 228Ra [60]. The MCL used by the U.S. EPA is 5 pCi/L (0.185 Bq/L) combined for both isotopes of radium. Radium is metabolized by the human body much like calcium. Long-term ingestion of radium over time can result in the accumulation of radium in the skeleton, which has the potential to increase the chance of bone and sinus cancer [62].
Two geologic regions of the United States have been identified as having notably high radium content in groundwater. One region includes the Piedmont and Coastal Plain provinces of New Jersey, the Carolinas, and Georgia. The second region includes parts of Wisconsin, Minnesota, Iowa, Illinois, and Missouri [63]. Elevated dissolved radium is recognized as a significant water quality issue in the Cambrian-Ordovician aquifer system of eastern Wisconsin and northeastern Illinois [35,39,40,62,64]. However, one study did not find radium levels in Wisconsin Groundwater to be significantly associated with osteosarcoma [62]. In Wisconsin, more than two-dozen municipal wells exceed the EPA MCL for dissolved radium or gross alpha emissions [65], requiring them to solve the problem through water treatment options, source blending, or alternative water sources.
In eastern Wisconsin, the Cambrian-Ordovician aquifer is unconfined to the west of the Maquoketa boundary throughout eastern Wisconsin and into northeastern Illinois, with the primary recharge area to the west of the boundary [40]. Elevated radium activities of ≥5 pCi/L (≥0.185 Bq/L) are present throughout much of eastern Wisconsin, especially in locations where the aquifer transitions from unconfined to confined conditions (Figure 4). Weaver and Bahr [39,40] concluded that 226Ra in the Cambrian-Ordovician aquifer of eastern Wisconsin originated from low levels of 238U in the shaley portions of the aquifer. Grundl and Cape [35] provide the most recent assessment of the geochemical factors that control the radium activity in the deep aquifer. They considered three ultimate sources of radioactivity in the aquifer: (1) material in the aquifer solids themselves, either in shaley zones [39] or as rinds enriched in parent isotopes [66,67]; (2) in the Maquoketa Shale that overlies the aquifer or (3) uranium or thorium transported into the aquifer by deep-seated brines originating from the Michigan basin [68]. Unfortunately, they were not able to definitively identify the set of geochemical processes controls the radium activities in the confined portion of the aquifer [35].

Figure 4.
Region of the state with the majority of wells that exceed the U.S. EPA maximum containment levels (MCL) for combined Radium of 5 pCi/L (0.185 Bq/L). Pattern mimics the outcrop distribution of the western edge of the Michigan sedimentary basin (Figure 2) and reflects the region where water is drawn from the confined sandstone aquifers of eastern Wisconsin [65].
In 2000 December, the National Primary Drinking Water Regulations; Radionuclides; Final Rule was published [61]. The U.S. EPA promulgated a final radionuclide rule that required communities to analyze their water for 226Ra, 228Ra, uranium, and gross alpha emitters, and to assess the vulnerability for beta and photon activity. The most significant of these was radium, and an MCL of 5 pCi/L (0.185 Bq/L) was established for combined radium, with enforcement beginning during 2006. In 2006, 42 of Wisconsin’s public water supply systems were in violation of the U.S. EPA MCL for combined radium. Three different strategies have been employed by different communities to tackle this problem, at a substantial cost to the public. These include water treatment systems, blending of water supplies, and switching to surface water supplies.
As described above, the most substantial radium-related project involved a switch from deep aquifer wells to surface water by numerous communities surrounding Green Bay, Wisconsin during 2006 and 2007 [5,6]. Some backup wells in the region still exceed the U.S. EPA MCL for combined radium, but are typically only in use when interruptions occur due to pipeline breaks. The initial cost of this pipeline was $80 million US Dollars in 2007, with substantial ongoing maintenance and repair costs [69]. The final cost was around $130 million US Dollars.
By 2009, some communities were still struggling to reach compliance. For example, the City of Fond du Lac, with only 43,000 residents, ended up spending $32.4 million US Dollars to upgrade its water supply [70]. The city also agreed to pay $35,000 US Dollars to settle claims with the Justice Department.
The City of New Berlin, a suburb of Milwaukee, got final approval from the Wisconsin DNR in 2009 to connect with the City of Milwaukee to use up to 8.1 million liters per day (2.142 million gallons per day) in areas outside the Great Lakes Basin to replace the volume supplied by deep aquifer wells that exceed the combined radium MCL. This was allowed because the City of New Berlin straddles the Great Lakes drainage divide, and all of the water used will return to Lake Michigan [71].
The City of Waukesha had radium exceedances as recently as 2011 and 2013 when pumps in one of the city’s deep wells failed [72]. The city agreed to come into compliance with the standard at all times at each entry point by 2018. Waukesha blends water from both shallow and deep wells and uses Hydrous Manganese Oxide treatment plants to achieve compliance with drinking water standards [73]. The City of Waukesha has recently declared that it will not be able to achieve compliance by the court ordered 2018 date [74]. Waukesha currently has an application pending to divert water from Lake Michigan, despite the fact that it lies outside the Lake Michigan drainage basin.
4.1.2. Arsenic and Associated Heavy Metals
Dissolved arsenic has been recognized as a significant water quality problem that affects millions of people in parts of the world. Chronic consumption of high levels of arsenic can lead to several health problems, including lung, bladder and skin cancers. The most widely known region for arsenic contamination in groundwater is Bangladesh, where the situation has been described as a public health emergency (e.g., [75]). A similar, but less dramatic problem has been known in parts of Wisconsin for over two decades.
Discovery of the arsenic problem occurred in 1987 as part of a routine feasibility study for a landfill proposed in Winnebago County [76]. Over the past 28 years, several thousand wells have been analyzed for arsenic in parts of eastern Wisconsin. Arsenic concentrations vary from less than 1 µg/L to over 15,000 µg/L [77,78] over a region that includes several tens of thousands of private drinking water wells. In some townships, 20% or more of wells can exceed the 10 µg/L EPA MCL for arsenic. There are at least three regions in the state that contain elevated levels of dissolved arsenic in groundwater (Figure 5), each of which has a different potential geologic origin. These include the Paleozoic bedrock wells in eastern Wisconsin along the Fox River Valley, Pleistocene glacial sediment in southeastern Wisconsin, and wells in Precambrian bedrock with Pleistocene glacial sediment cover in Florence County (northern Wisconsin).

Figure 5.
Three regions in the state have elevated arsenic in different aquifers. Region 1 represents the portion of the Paleozoic bedrock aquifer with elevated dissolved arsenic due to oxidation of sulfide minerals [78,79]. Region 2 represents elevated arsenic in the Pleistocene glacial sediments and the Silurian bedrock aquifer of southeastern Wisconsin [80]. Region 3 represents a region in Florence County with elevated arsenic in which Precambrian bedrock is overlain by Pleistocene glacial sediments [79].
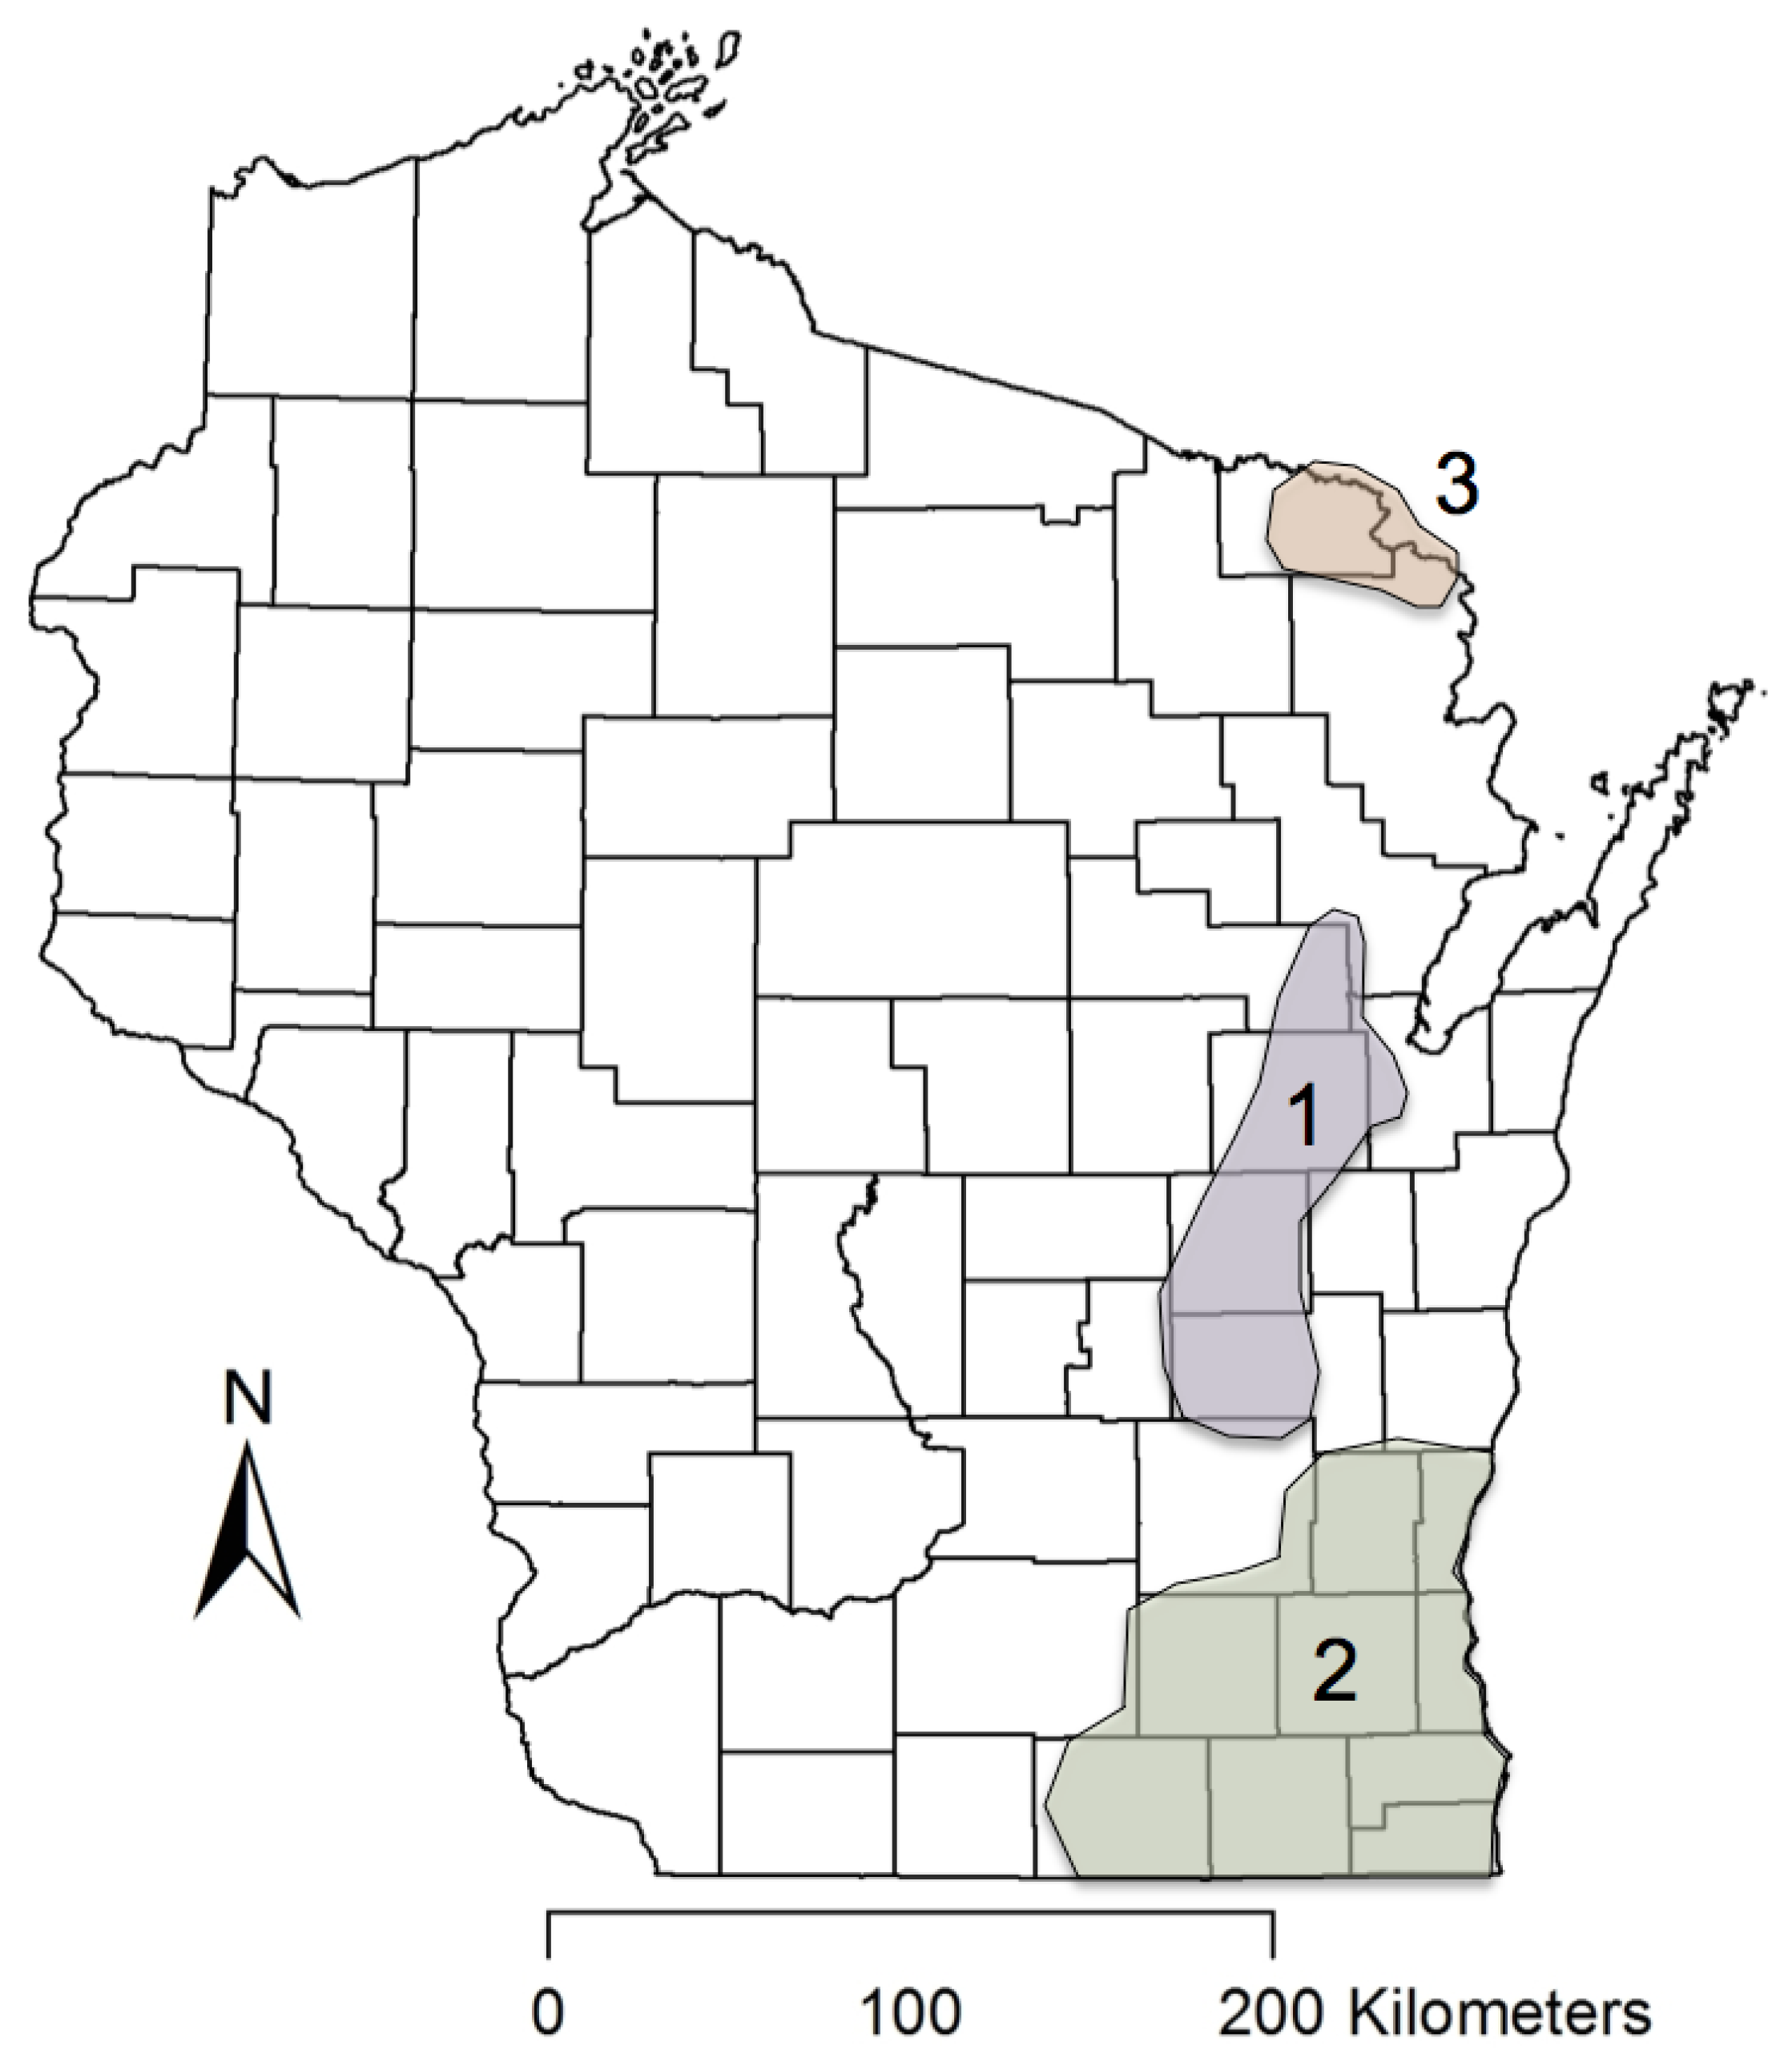
The region in which this problem has been most thoroughly documented is in the Paleozoic bedrock of eastern Wisconsin (e.g., [76,78,81,82,83,84]). Much of this focus has been to characterize the distribution of arsenic and associated metals (Ni, Co, etc.) in well waters and aquifer rocks, primarily in parts of Winnebago and Outagamie Counties, but this problem extends from as far south as Fond du Lac County to as far north as the Michigan border in Marinette County (e.g., [59,76,77,84,86]). Arsenic concentrations as high as 15,000 µg/L have been encountered in wells open to the Paleozoic aquifer of eastern Wisconsin, and in some townships 20%–40% of the wells tested were above 10 µg/L (the EPA MCL for arsenic). Fewer wells have been tested for nickel and cobalt, but these metals are closely associated with arsenic in the region due to the host mineralogy of a regionally extensive sulfide cement horizon (SCH) at the top of the Ancell Group. One well in Outagamie County, Wisconsin had the following chemistry documented: pH = 2.05, As = 4300 μg/L, Co = 5500 μg/L, Cd = 220 μg/L, Cr = 84 μg/L, Ni = 11,000 μg/L, Al = 15,000 μg/L, and Pb = 400 μg/L [85].
Portions of this aquifer contain abundant sulfide mineralization associated with Cambrian and Ordovician sedimentary rocks (Figure 3). The most abundant sulfide-rich cement horizon (SCH) is a zone of pyrite, marcasite, and associated minerals that occurs near the interface of the St. Peter Sandstone (Ancell Group) and the Platteville Dolomite (Sinnipee Group) [26,78,86,87].
The SCH has been documented to occur across eastern Wisconsin from the Illinois border in the south to the Michigan border in the north [26,86]. The mineralogy and mechanisms of arsenic release differ in different settings. Oxidative release is thought to be the most important mechanism in eastern Wisconsin (e.g., [87]). Although most attention has been given to the St. Peter Sandstone aquifer, other units in the region, such as the Cambrian sandstones, also contain abundant sulfide mineralization. Oxidative release of arsenic and nickel during aquifer storage and recovery (ASR) testing has resulted in substantial volumes of groundwater contamination near test wells [85].
Another region of the state with significant arsenic problems is southeastern Wisconsin. This area has up to 150 meters of glacial till and outwash of Pleistocene age overlying Silurian age dolomite. This region has had arsenic concentrations up to 100 µg/L documented in portions of the lower sand and gravel aquifer beneath organic-rich glacial till units [80]. In contrast to the Paleozoic rocks of eastern Wisconsin, there appears to be a different mechanism for arsenic release in southeastern Wisconsin. The presence of reducing conditions, low sulfate concentrations, and solid-phase organic matter led Root et al. [80] to conclude that arsenic is released to ground water in the lower sand and gravel/dolomite aquifer via microbially mediated reductive dissolution of arsenic-bearing Mn and/or Fe-(hydr)oxides.
A third region with a recognized arsenic problem is Florence County (Figure 5). The origin of arsenic in this area is less understood, but dozens of wells are impacted in the region, and ongoing research is investigating the geologic mechanisms and stratigraphic relationships in the region.
The public health impact of high dissolved arsenic was recently investigated by Knobeloch et al. [77] in a study that associated arsenic-contaminated drinking water with the prevalence of skin cancer in eastern Wisconsin. They documented arsenic concentrations and surveyed several thousand residents using over 2200 wells in the region. Their results indicated that for residents over age 35 who had consumed arsenic-contaminated water for at least 10 years, those residents were significantly more likely to report a history of skin cancer than other residents.
In response to public health concern over arsenic in the Fox River Valley region of eastern Wisconsin, the Wisconsin DNR implemented special well casing requirements for wells in Winnebago and Outagamie counties that became effective on 1 October 2004. These requirements are in place to avoid the most sulfide-rich portion of the aquifer near the SCH. However, additional requirements were included that limited the types of well construction methods and disinfection methods that can be used.
It is important to note that while much attention has been given to these two counties, the geologic strata and sulfide mineral distribution are similar throughout eastern Wisconsin [26,86]. Wells drilled in the same units in Marinette, Oconto, Brown, Shawano, and Fond du Lac counties have significant percentages of wells that exceed the 10 µg/L of arsenic in drinking water standard.
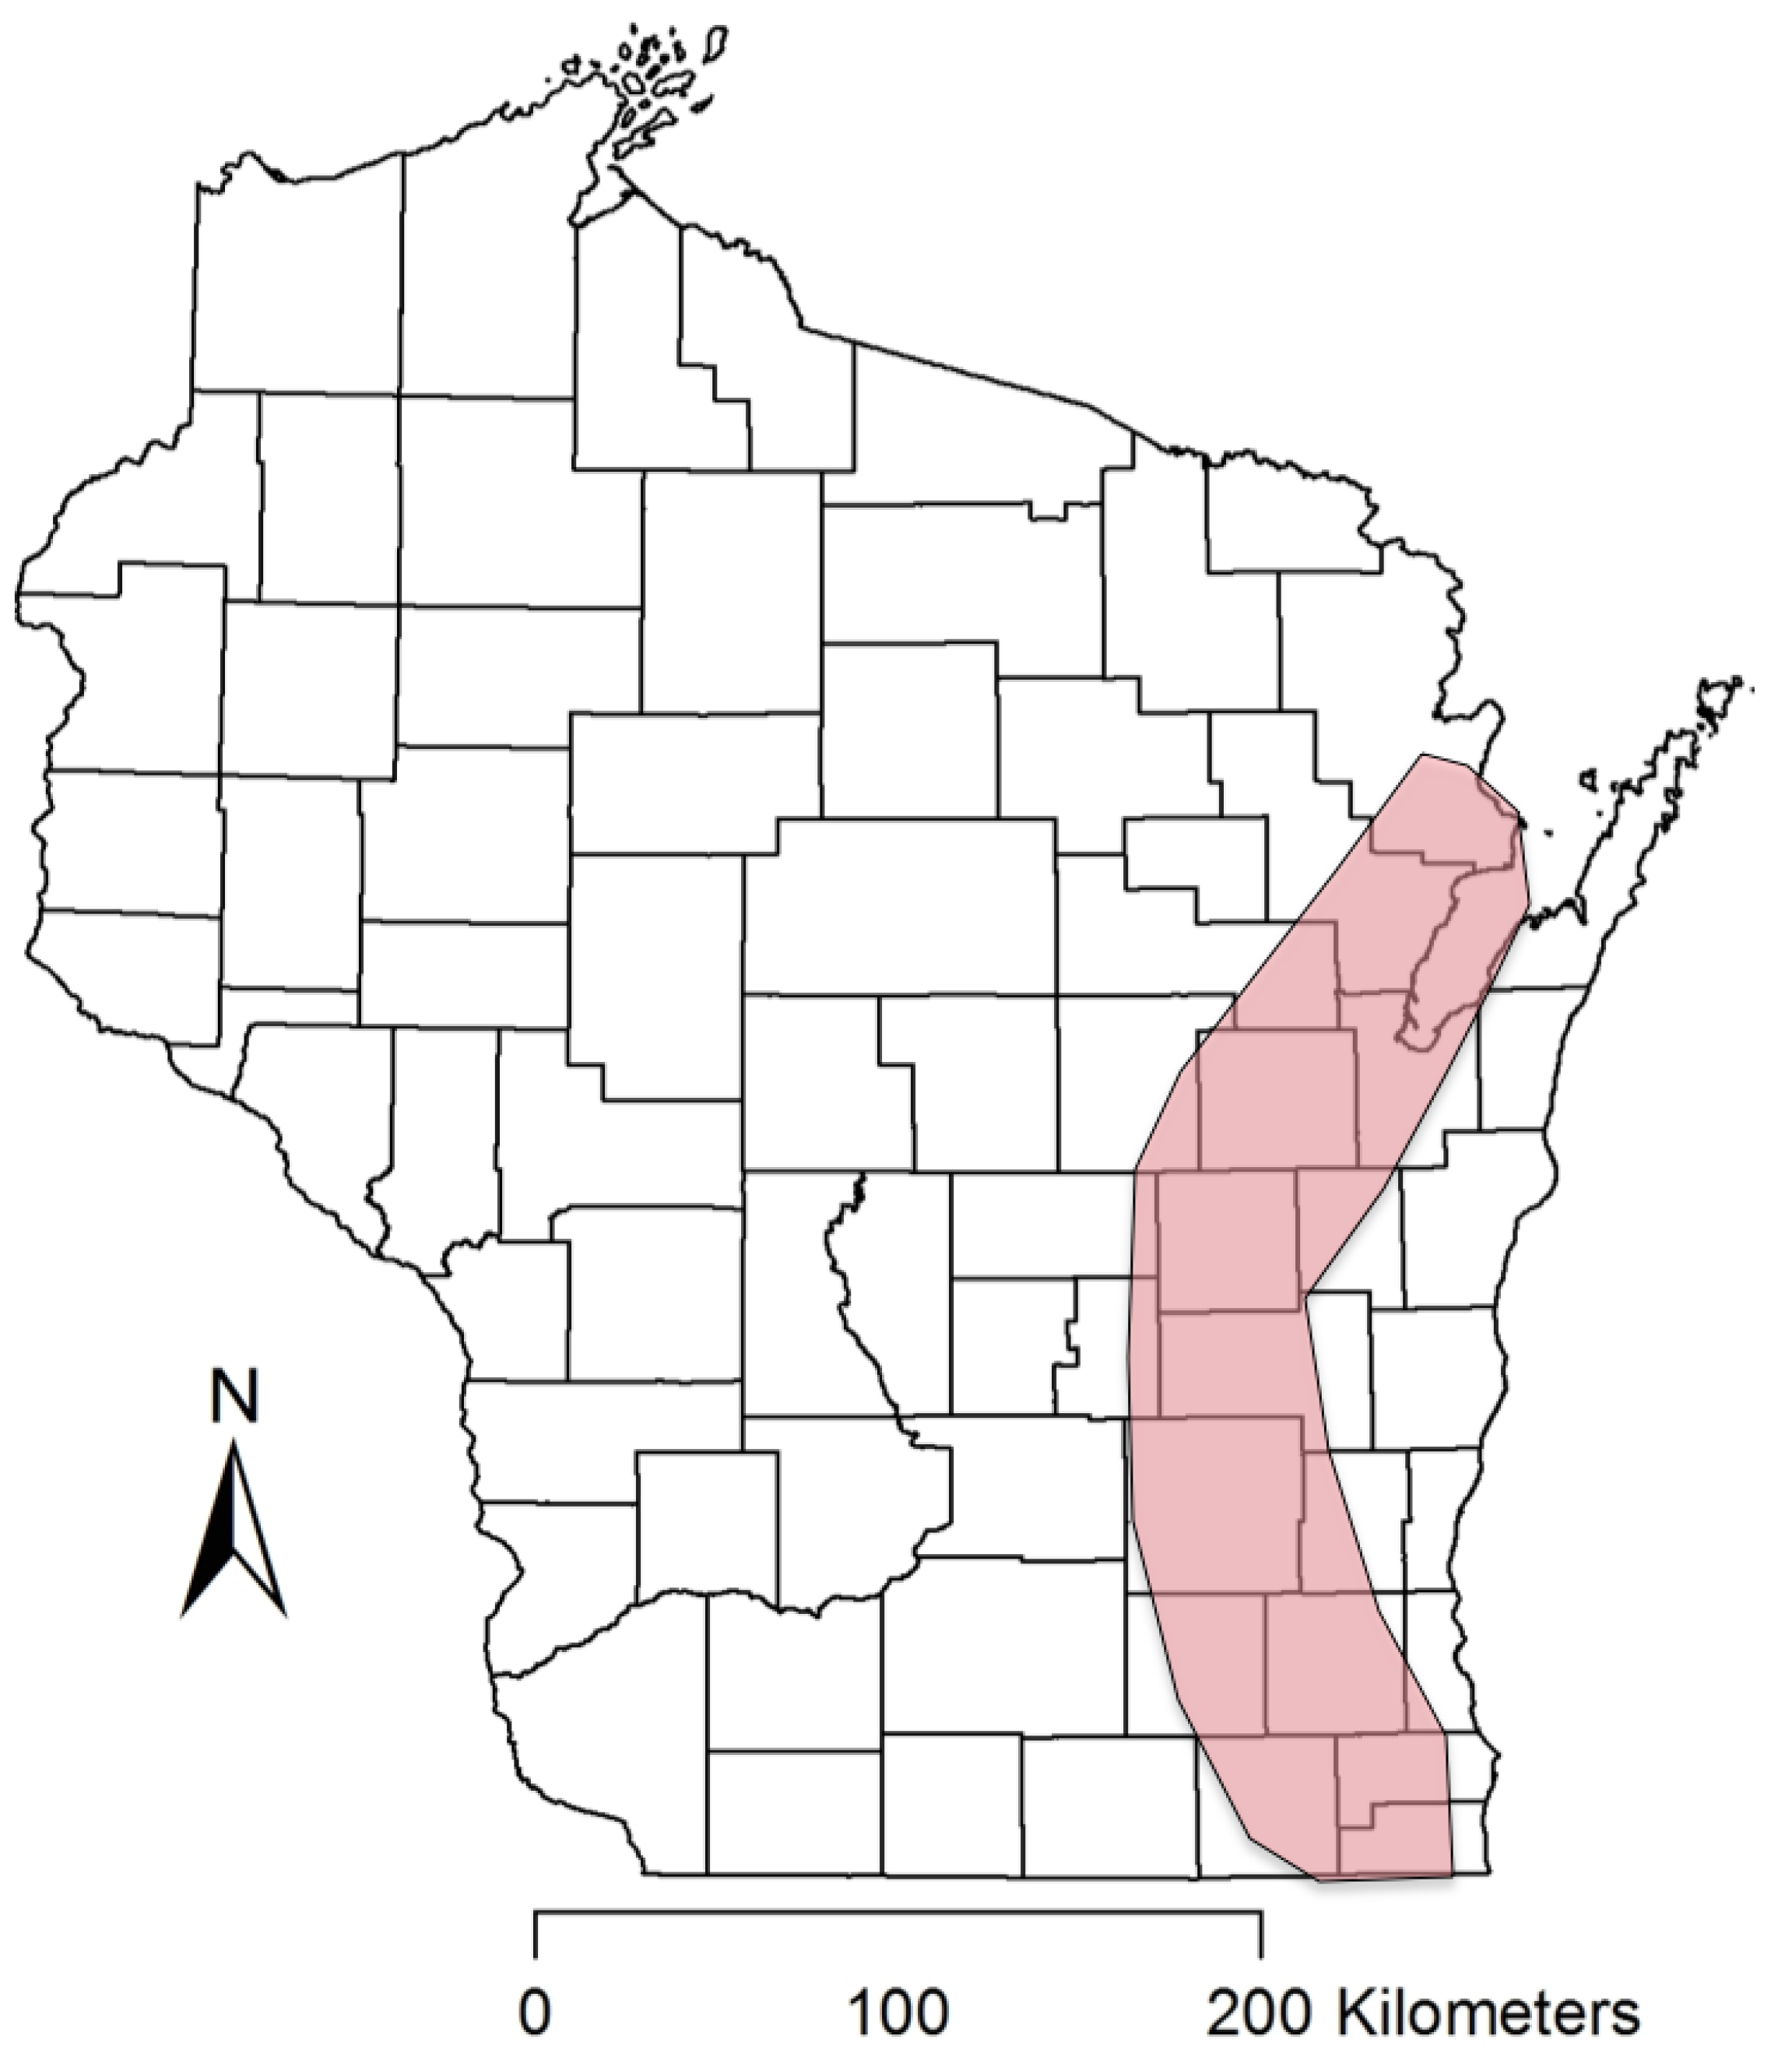
4.1.3. Fluoride Problems in Two Distinct Geologic Provinces
Fluoride at optimal levels (0.7 to 1.2 ppm) can reduce the incidence of dental caries. However, excess fluoride can produce dental fluorosis and negatively impact bone health, especially in children [88]. As such, the US EPA has set a MCL for dissolved fluoride of 4.0 mg/L, with a secondary (advisory) MCL of 2.0 mg/L. This value is intended to reduce the risk of severe enamel fluorosis and to minimize the risk of bone fractures and skeletal fluorosis in the adult population [59]. In 2011, the U.S. Department of Health and Human Services proposed to reduce the recommended level to 0.7 mg/L [89].
Wisconsin contains three distinct regions with elevated levels of dissolved fluoride above 1.2 mg/L in groundwater (Figure 6). One of these areas occurs in parts of Marathon County and the adjacent areas of central Wisconsin. Groundwater in this region is obtained principally from Precambrian crystalline bedrock aquifers and Quaternary glacial and alluvial sediments. A recent study focusing on Marathon County wells indicates that fluoride in this region ranges from <0.01 mg/L to at least 7.6 mg/L [90]. In that study, approximately 0.6% of the wells exceeded the EPA MCL of 4 mg/L, and 8.6% exceeded the secondary MCL of 2.0 mg/L. The source of fluoride in groundwater in this region appears to be fluorite and fluorapatite in felsic intrusive rocks, specifically syenite and Na-plagioclase bearing granites [90].

Figure 6.
Map showing dissolved fluoride in Wisconsin aquifers. The highest concentrations are present in areas of shallow Precambrian bedrock of central Wisconsin. Another broad region of elevated fluoride occurs in the Cambrian-Ordovician confined aquifer of northeastern Wisconsin. A third region of elevated fluoride occurs in glacial sediments and Silurian bedrock in eastern and southeastern Wisconsin. Data sources include [91,92,93,94].
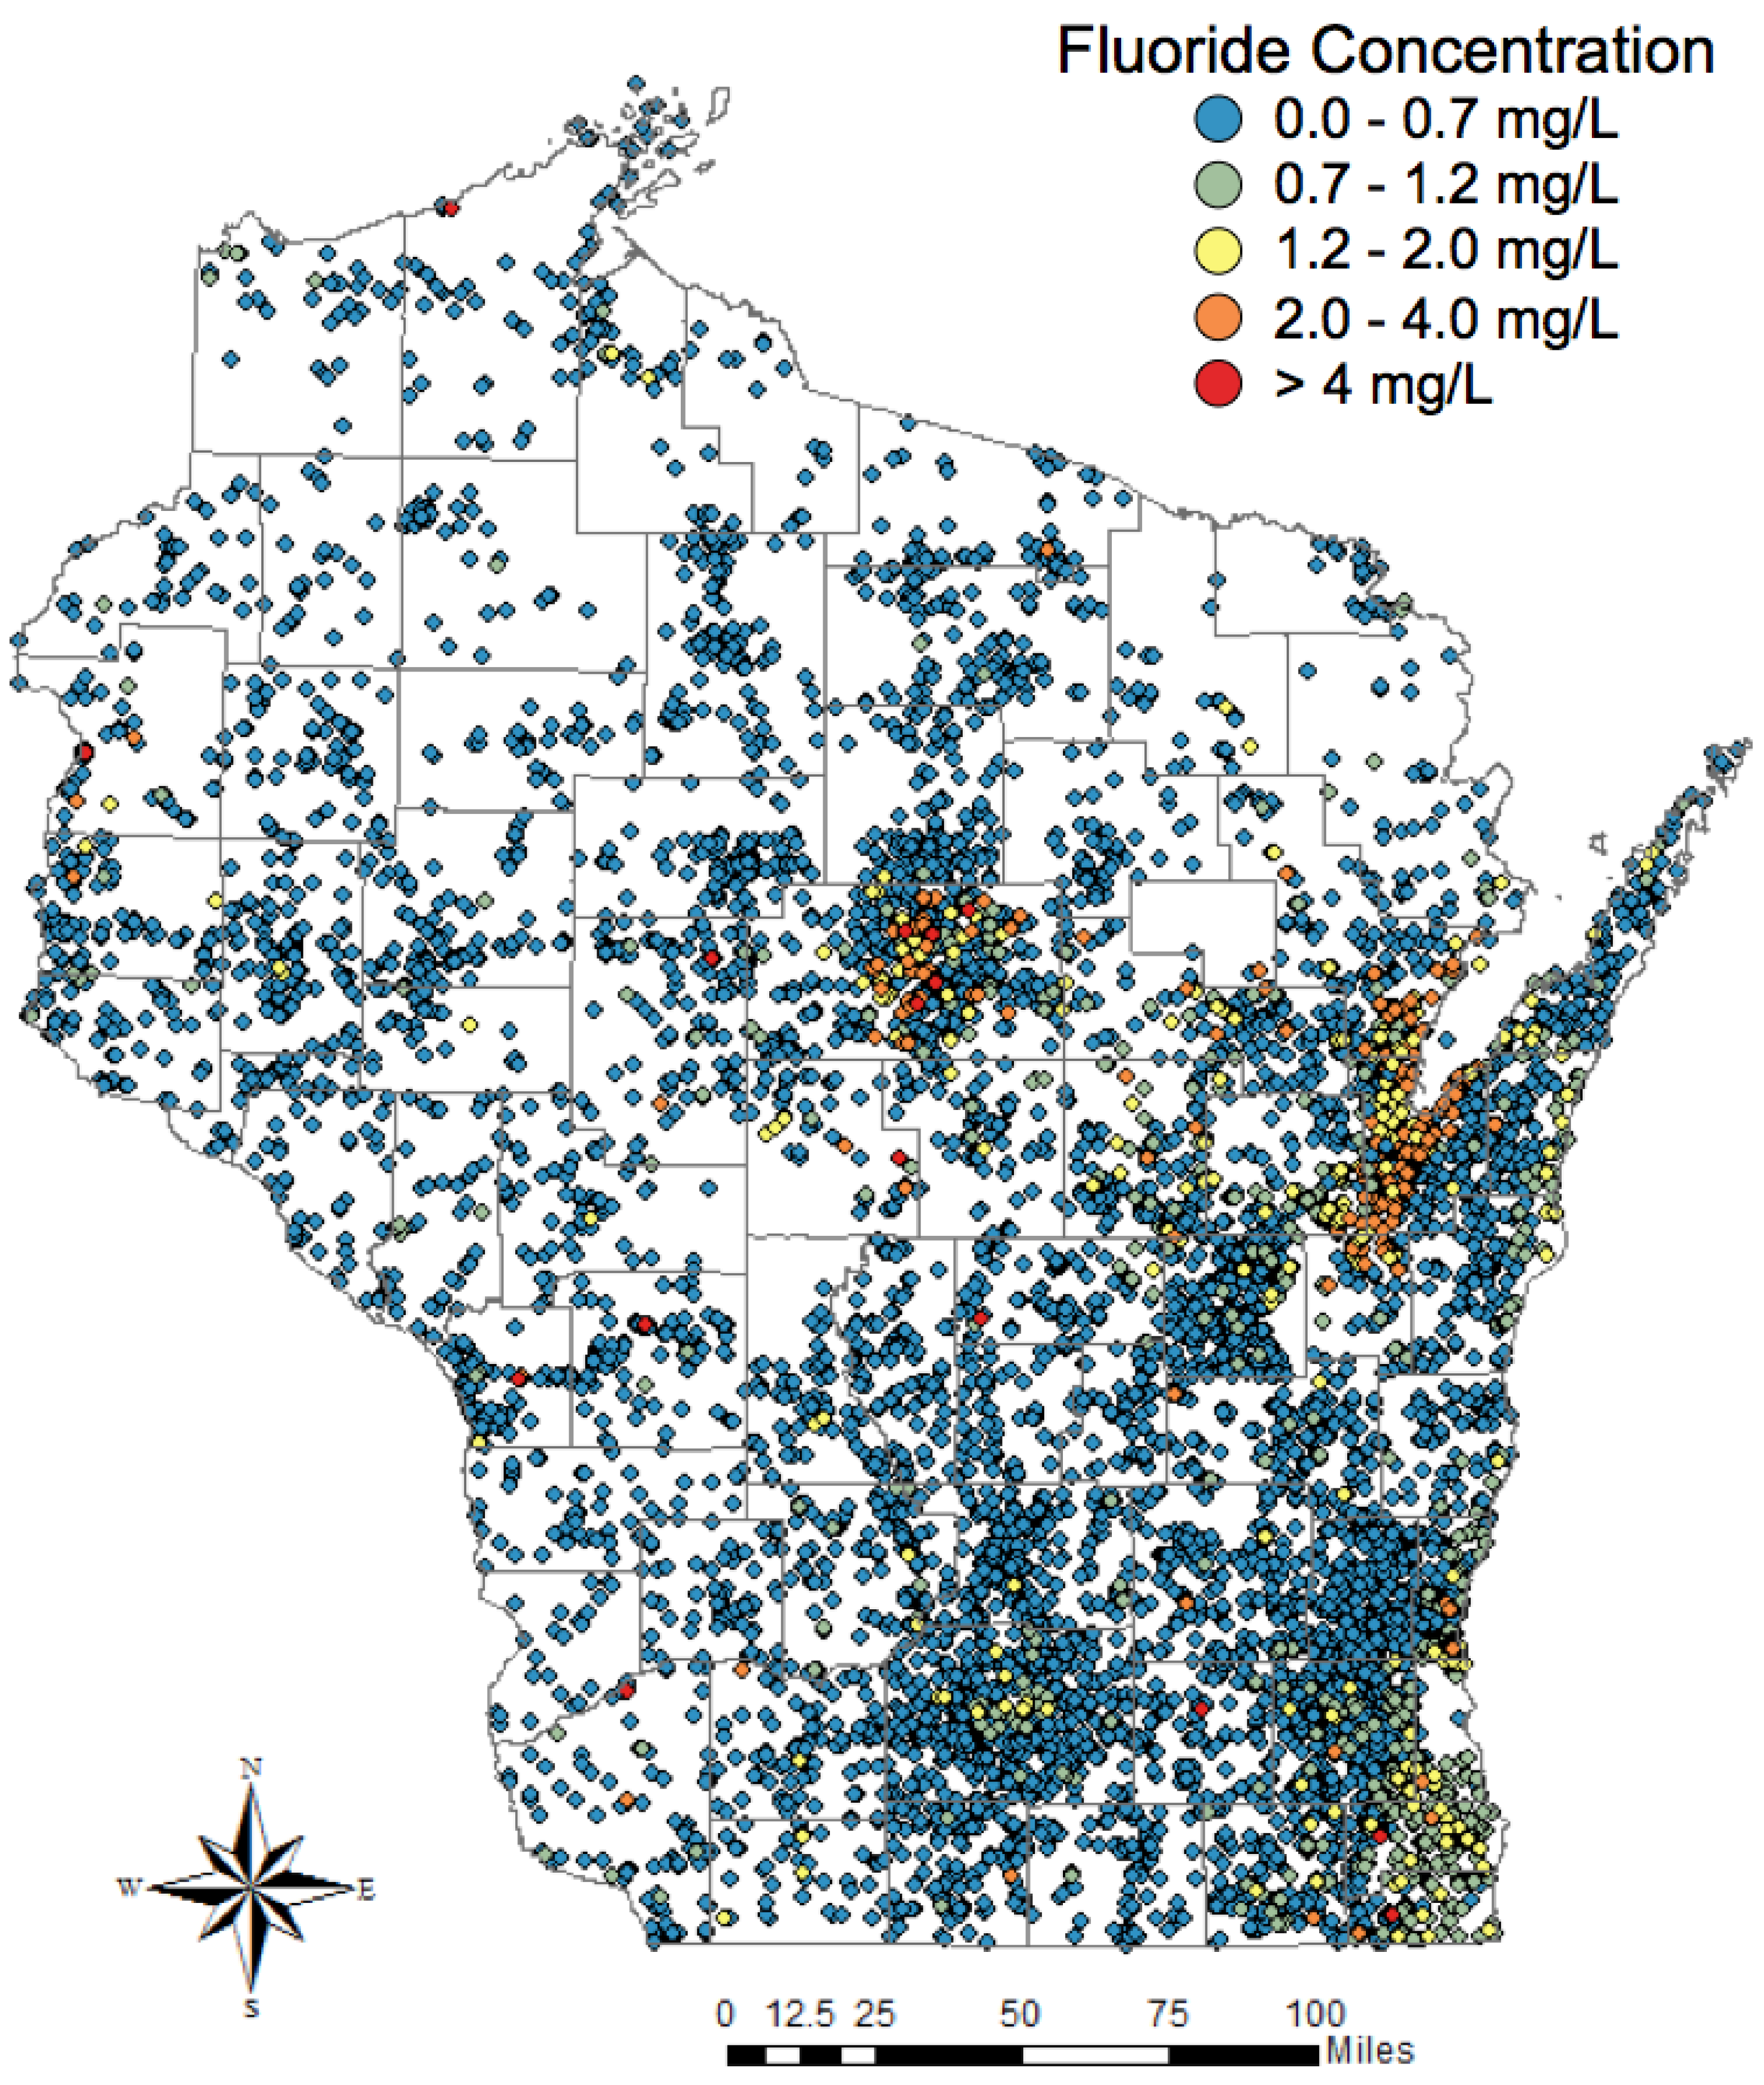
A second region of elevated fluoride occurs in the Cambrian and Ordovician confined aquifer of northeastern Wisconsin along the Fox River Valley and adjacent to the Bay of Green Bay. This anomaly has been known for more than 40 years [64,95], and a study by Krohelski [28] showed a mean concentration of 1.32 mg/L for the Ordovician and Cambrian sandstone aquifers in the region. While few wells appear to exceed the MCL of 4.0 mg/L, hundreds of wells likely exceed the secondary MCL of 2.0 mg/L, and most wells in the confined aquifer likely exceed the target value of 1.2 mg/L suggested by the U.S. EPA. The source of fluoride in this aquifer appears to be fluorite associated with Mississippi Valley-type mineralization in the region [26].
A third region is less well defined and less studied, but it extends along the Lake Michigan shoreline from Kewaunee County in the north to the Illinois border in the south. Many wells exceed the secondary MCL of 2.0 mg/L, and a few exceed 4.0 mg/L. Most of the wells with elevated fluoride appear to be drawing from both Pleistocene glacial sediments and Silurian dolomite units. It is likely that fluorite is also the source of this elevated dissolved fluoride because fluorite mineralization occurs in the Silurian rocks of eastern Wisconsin. More research on this topic is needed to better understand the stratigraphic distribution and origin of dissolved fluoride in eastern Wisconsin.
In Marathon and Lincoln counties (central Wisconsin), county health departments offer test kits for dissolved fluoride. Other municipalities, such as those in the Fox River Valley region, distribute notices to water utility customers advising them of elevated levels above the secondary MCL.
4.1.4. Dissolved Strontium
A region of high dissolved strontium (Sr) occurs in an arc-shaped band throughout eastern Wisconsin inland from the Lake Michigan shoreline where deep wells penetrate the Cambrian-Ordovician sandstone aquifer (Figure 7). Groundwater in parts of eastern Wisconsin contains dissolved Sr levels that exceed lifetime and short-term U.S. EPA Health Advisories of 4 mg/L and 25 mg/L, respectively [64,92,93,94]. Hundreds of wells are impacted throughout this region, including an area of anomalously high dissolved Sr in parts of Brown, Outagamie, and Calumet counties.
At present, about 11,000 groundwater samples statewide have been analyzed for strontium [92,93]. Until recently, data regarding dissolved Sr in Wisconsin groundwater were limited, and it is now clear that elevated dissolved Sr is present in the deep aquifer throughout much of eastern Wisconsin. While limited evidence for high Sr in the region’s groundwater was available for over 50 years [96], little attention was given to this problem until 2013 [92,93]. Affected wells include many municipal wells from the suburban Milwaukee metropolitan area north to Green Bay, with concentrations of strontium in groundwater drinking supplies reaching as high as 52 mg/L [96].
The source of the Sr appears to be the dissolution of heterogeneously distributed celestine (SrSO4), and possibly strontianite (SrCO3) cements in Cambrian and Ordovician rocks in the region [92,93,94]. These rocks were strongly impacted by dolomitization and mineralization associated with an ancient hydrothermal brine migration from the Michigan basin [26].
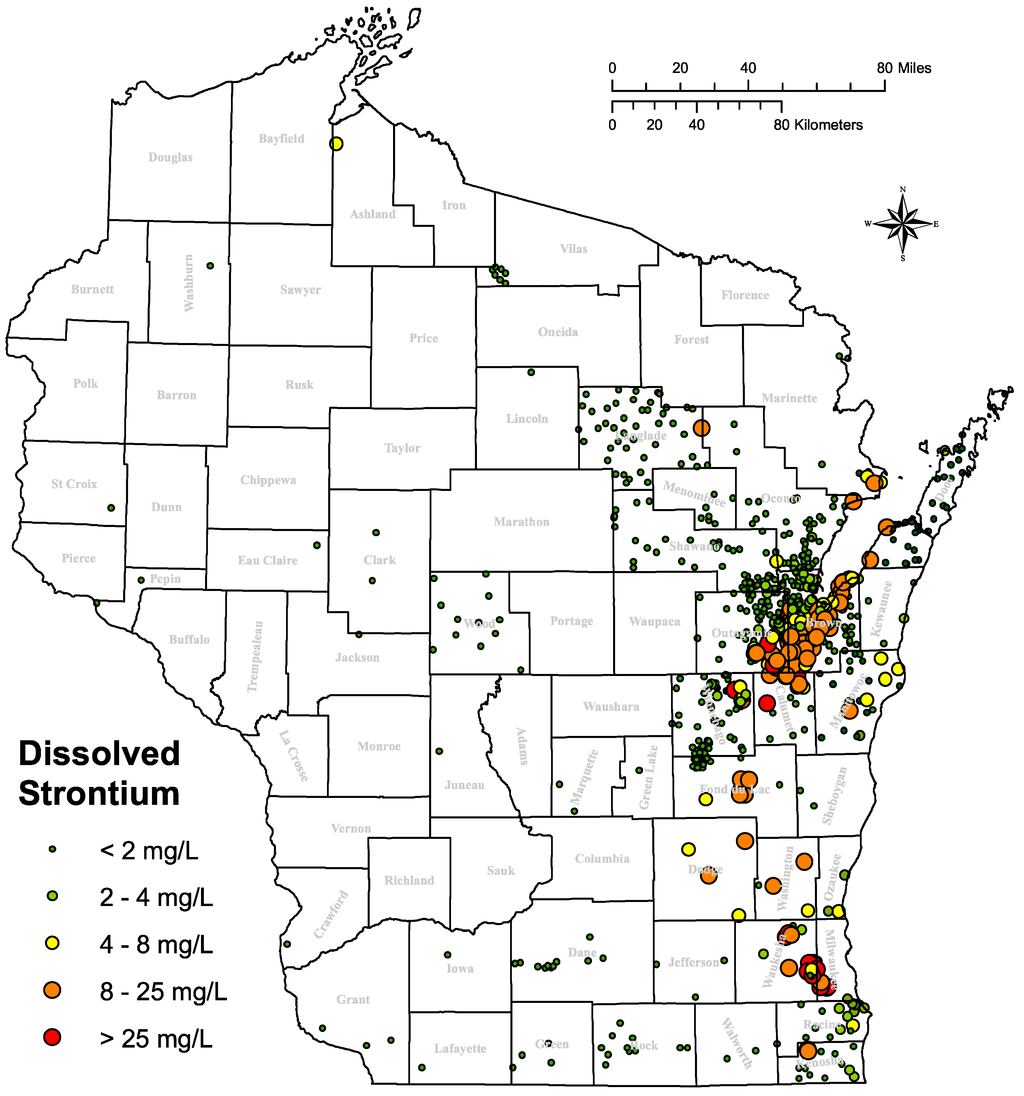
Figure 7.
A broad arc-shaped region of eastern Wisconsin contains elevated dissolved strontium in the Cambrian-Ordovician aquifer. Limited data suggest additional wells in the Silurian bedrock east of this zone also contain elevated dissolved strontium above the EPA lifetime health advisory level of 4 mg/L [92,93,94].

Although the full spectrum of adverse human health effects from Sr ingestion is unclear, two health effects are documented in the literature. One of these is known as “strontium rickets”, which is a musculoskeletal disease in which bones are thicker and shorter than normal and can be deformed [97]. Another health effect linked to the ingestion of groundwater-derived strontium is tooth enamel mottling [98]. Recognition that dissolved Sr might be a more significant problem in Wisconsin than initially anticipated has prompted the recent addition of Sr to the State Lab of Hygiene water quality metals scan in the last several years. At present, there is no MCL in effect through the U.S. EPA, but there has been a preliminary determination by the EPA to regulate strontium in Drinking Water [99]. Treatment systems (standard water softeners or reverse osmosis systems) are very effective solutions, but the public is generally unaware of the Sr problem.
4.1.5. High Total Dissolved Solids
Most groundwater in Wisconsin has relatively low total dissolved solids. This is not surprising because the state also lacks any economic deposits of petroleum and natural gas, which are often associated with dense brines. While strong evidence for multiple ancient brine migrations is present in the Paleozoic sedimentary rocks in the region (e.g., [26,100]), these aquifers have been subsequently flushed of brine over millions of years prior to the Pleistocene Epoch. Some water has been documented by radiocarbon dating as being Late Pleistocene in age [36]. However, not all salts have been fully removed from the system.
Portions of the Cambrian-Ordovician aquifer system in eastern Wisconsin contain groundwater with elevated total dissolved solids (TDS). While a precise distribution of wells with high TDS is not available, the approximate region is roughly correlative with the Maquoketa Shale subcrop in eastern Wisconsin [64,93,94]. Values of total dissolved solids above 1000 mg/L have been reported mainly from the Cambrian-Ordovician confined aquifer of eastern Wisconsin [64,92,95], but significant regions of the Silurian aquifer of southeastern Wisconsin also have TDS values that exceed 1000 mg/L [7]. In addition, some wells in western and northwestern Wisconsin exceed this value [95]. Hundreds of wells are likely impacted by this problem, and it prevents a large part of eastern Wisconsin that has shallow aquifer contamination from accessing potable supplies of deep aquifer groundwater.
Dissolved boron (B) and lithium (Li) appear to be associated with elevated salinities [64,94]. In a recent study by Luczaj et al. [92], analysis of boron and lithium in selected samples has identified that these may also be important elements of concern in the deep aquifer system of northeastern Wisconsin. Two of 49 samples analyzed for dissolved B exceeded the MCL of 1000 µg/L. One sample was 3300 µg/L, over three times the MCL established by the State of Wisconsin. Although Li does not have an established MCL, concentrations varied dramatically in parts of the region from 1.7 µg/L to 305 µg/L. High levels of dissolved Sr, Li, B, and F have been reported elsewhere in carbonate rock on marginal parts of high salinity basins (e.g., [101]).
4.1.6. Other Noteworthy Problems
Several other noteworthy problems from naturally occurring contaminants are known in Wisconsin, including aluminum and manganese. The extent and cause of these problems is not fully understood, but they have variable origins in different parts of the state. One area of particular concern for manganese has been Taylor County in northern Wisconsin [102]. Elevated manganese and aluminum have been reported from several regions in the state [59], but a detailed analysis of most of these occurrences has not been completed.
4.2. Anthropogenic Contaminants
4.2.1. Nitrate
Nitrate is generally considered the most widespread groundwater contaminant in Wisconsin. Natural or background concentrations of nitrate-nitrogen in groundwater are typically less than 1 mg/L, and concentrations greater than this provide evidence of impacts from the use of nitrogen fertilizers, storage or spreading of animal waste and/or other bio-solids, or septic system drain fields. As nitrate, nitrogen is readily carried in the drainage that recharges groundwater. Previous estimates attribute 90% of nitrate in Wisconsin’s groundwater to agricultural sources, 9% to septic systems and 1% to lawn fertilization [103]. The variety of nitrogen sources and the mobility of nitrate make it an ideal candidate to understand groundwater wells or aquifer systems that are susceptible to anthropogenic influences.
A statewide survey of private wells in Wisconsin showed 9% of wells exceeded the drinking water standard of 10 mg/L for nitrate-nitrogen [104]. The percentage of wells that exceeded the standard increased to 21% when limited to wells located in districts where greater than 75% of the area is cultivated. Additional information exists from voluntarily submitted private well data collected over a nearly 30-year period across the state. These data show similar exceedance rates to the statewide survey, revealing approximately 10% of wells exceed the nitrate standard [79]. Forty-two percent of all samples reported a concentration above 2 mg/L, which is generally considered conclusive evidence of anthropogenic influences. The amount of data collected through voluntary testing is significant and the spatial distribution is extensive (Figure 8). The patterns that emerge have allowed resource professionals to identify areas of concern and ground-truth existing models of groundwater susceptibility.
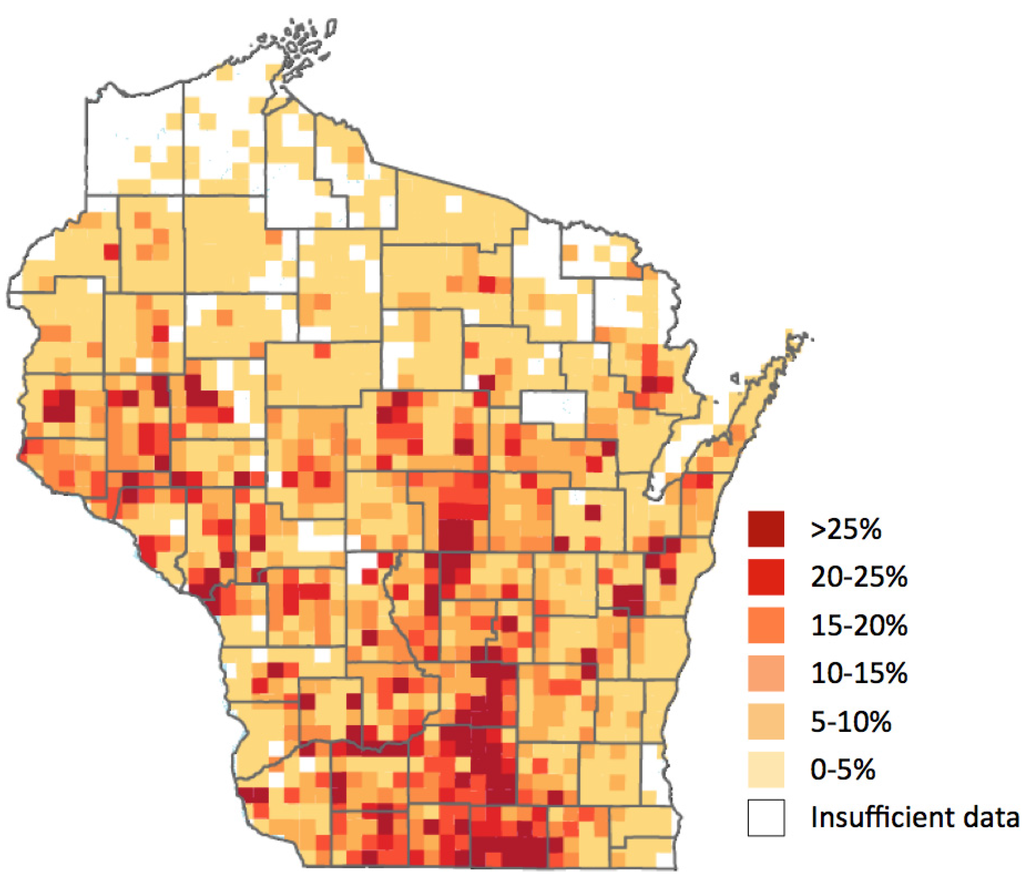
Figure 8.
Map of Wisconsin showing the percentage of groundwater samples in each township above the 10 mg/L nitrate-N drinking water standard [79].
Figure 8.
Map of Wisconsin showing the percentage of groundwater samples in each township above the 10 mg/L nitrate-N drinking water standard [79].

In Wisconsin, groundwater contamination susceptibility has previously been modeled as a function of surficial deposit type, depth to bedrock, type of bedrock and depth to groundwater [105]. Areas determined to have a high groundwater contamination susceptibility rating typically correlate well with areas of known groundwater nitrate concerns as evidenced by private well testing data in areas where sufficient data exists. Simply identifying areas that are susceptible should not be interpreted that groundwater quality is degraded. In order for groundwater to actually become contaminated there needs to exist a nitrogen source. Northern Wisconsin is an example of an area where the groundwater is rated as highly susceptible to groundwater contamination; however, nitrate above the drinking water standard is rare. The large percentage of forests and wetlands, combined with low population densities in northern Wisconsin, results in very few nitrate impacted wells. Conversely just because there is a source of nitrogen does not guarantee significant groundwater nitrate impacts. Such is the case in eastern Wisconsin, where agriculture is often the dominant land use, but groundwater concentrations of nitrate are often found at background or natural levels. In these areas, a higher potential for denitrification, a greater use of drain tiles, and generally heavier texture soil types are potential explanations for the lack of nitrate found in groundwater in much of the area.
Much attention has been paid to the role of agricultural practices and the influence on ground and surface waters with respect to nitrate. Studies have affirmed that applying rates of nitrogen in excess of economic optimal rates exacerbate groundwater concerns; however many studies have shown that even at optimal rates of application, nitrate can leach at rates exceeding drinking water standards [106,107]. The groundwater nitrate pattern in Wisconsin is mostly explained by investigating the relationship between agricultural practices and a few soil or geologic characteristics. Three areas with significant nitrate impacts include: (1) regions of highly permeable sandy soils (central sands region and lower Wisconsin River valley), (2) shallow carbonate rock aquifer systems of eastern Wisconsin located along and east of the Niagara Escarpment, where solution-enlarged joints, sinkholes, and other karst features promote drainage of nitrate rich soil pore water from agriculturally managed soil horizons to groundwater in the unconfined dolostone aquifer, and (3) south-central Wisconsin where well-drained soils are extensively managed for high nitrogen input row crop production.
4.2.2. Pathogens
Pathogens are receiving increasing attention in Wisconsin. Recent work over the past 15 years in Wisconsin has revealed a complex problem with pathogens in a variety of geologic units from multiple sources. Bacterial contamination has been widely known from regions of the state with karst aquifers and heavy agriculture [108,109]. However, recent studies have found viruses in both municipal and domestic water supply wells drawing from a number of aquifer types. Viruses have been associated with leaking sewage systems in deep aquifers accessed by municipal wells, leaking septic systems in shallower wells in karst regions, and surface water contributions to municipal wells [110,111,112,113,114,115,116,117]. In one case, a restaurant well was contaminated by its own septic drainfield, leading to a norovirus outbreak that sickened 229 people [114].
The large number of dairy cows and other animals in the state mean that pathogenic contamination from manure is an ongoing concern. This is particularly true in areas where wells rely on the shallow carbonate rock aquifer such as eastern Wisconsin [108], but it is true in other regions as well [116]. Thin or absent soils overlying fractured, karsted dolomite rock allow surface water a direct conduit to groundwater with little to no ability to attenuate or filter contaminants such as bacteria or viruses. Anecdotal and documented evidence suggest “brown water” incidents (i.e., sudden changes in water quality that occur during snowmelt or spring rains) have occurred for many years throughout Northeast Wisconsin (see also [117]). Between 2006 and mid-2014, sixty-four wells were replaced throughout Wisconsin due to confirmed contamination by livestock manure [118]; three-quarters of those wells were located in areas rated as having a significant to extreme vulnerability to groundwater contamination related to karst-type landscape features (e.g., sinkholes, fracture traces, surface rock outcrops, disappearing streams) [108].
The problem of pathogen contamination is widespread, and is not limited to shallow domestic wells. Nonetheless, disinfection of municipal water systems has the capability to limit the exposure of residents to pathogens like bacteria and viruses. Unfortunately, disinfection is not mandated for the municipal systems that supply groundwater to over 2 million residents of Wisconsin, although about 60% of the state’s municipal groundwater systems do disinfect their water [119]. Recent studies in Wisconsin have suggested that public health could be improved by identifying municipal water systems that lack water treatment and are likely to transmit waterborne disease [116].
4.2.3. Pesticides
A survey of 398 private wells by the Wisconsin Department of Agriculture, Trade, and Consumer Protection estimated that 33.5% of wells statewide contain at least one detectable pesticide or pesticide metabolite [120]. Wells located in areas with a greater intensity of agriculture are more likely to contain detections of pesticides. The most frequently detected pesticides or pesticide metabolites in Wisconsin groundwater included metolachlor ESA, alachlor ESA, atrazine and metabolites of atrazine.
Wisconsin is unique in that it has a health-based groundwater standard of 3 parts per billion (ppb) for atrazine plus its three metabolites (diamino atrazine, deethyl atrazine, and deisopropyl atrazine), as opposed to just atrazine [121]. When concentrations of atrazine and its metabolites are detected in a well above 3 ppb, an atrazine prohibition area may be established that prohibits future use of atrazine in a designated area around the well. Continued monitoring of wells in atrazine prohibition areas reveal that since 1995, concentrations of atrazine and its metabolites have slowly dissipated in most wells. It was estimated that following prohibition of atrazine it would take 11–17 years for atrazine and the metabolites to dissipate completely from wells [121].
4.2.4. Endocrine Disrupting Compounds
Recent research has addressed the prevalence of endocrine disrupting compounds (EDCs) in groundwater, which is an emerging class of contaminants. EDCs can originate from a wide variety of sources, including pharmaceuticals from leaky septic systems, land-applied manure, and estrogenic pesticides [109,122]. Historically, the best-studied EDC in Wisconsin has been atrazine and its metabolites [120,121].
Limited work has been done in Wisconsin regarding other EDCs, but these are likely to receive greater attention in the future because of their potential to cause physiological abnormalities and endocrine-related cancers in exposed organisms [109]. A recent study by Bauer et al. [109] in six northeastern Wisconsin counties showed that contamination of groundwater with EDCs, nitrate, and fecal bacteria is a common problem in karst areas of northeastern Wisconsin. Their study did not analyze specific endocrine disrupting compounds; rather, they used human breast cancer cells to evaluate the “estrogenicity” of the water [109].
4.3. Contaminants of Unresolved Origin
Boron and Molybdenum are two contaminants that have been recognized recently as having a significant impact on the water quality of parts of southeastern Wisconsin. The precise origin of the boron and molybdenum in groundwater is not completely understood, and disagreement exists regarding the source(s). The region of elevated molybdenum and boron values occurs in Racine, Kenosha, and Milwaukee counties in southeastern Wisconsin. Of 967 unique wells tested from 2010 to 2014, 45% of the wells exceeded the WDNR enforcement standard of 40 µg/L, and 22% exceeded the newly established Wisconsin Department of Health Advisory Level of 90 µg/L [123]. A smaller number of wells contained boron concentrations above 1000 µg/L, which is the WDNR enforcement standard. These wells are located in Pleistocene glacial sediments and underlying Silurian dolostone bedrock.
In a 2013 Report, the WDNR evaluated the possibility that three landfills, one of which was a coal fly ash landfill, could be the source of elevated boron and molybdenum in private wells nearby [124]. Water quality testing included stable isotopic analysis of boron and molybdenum, as well as tritium sampling. The WDNR concluded that a municipal and industrial landfill was not the source of molybdenum in private wells, but data were inconclusive as to whether or not a fly ash landfill was the source of molybdenum. Boron in most private wells appeared to be from sources other than the landfills, either natural or other anthropogenic sources. Tritium sampling showed that most private wells contained water without detectable tritium, suggesting that anthropogenic sources were not likely the source of molybdenum in most of the private wells analyzed. The elevated molybdenum remains the largest mystery, especially because it is detected in wells spread across such a large region of the state.
A more recent study by the environmental group Clean Wisconsin [123] came to a different conclusion based on a regional analysis. They suggest that there is a correlation between beneficial coal fly as “reuse” sites and elevated levels of molybdenum in private wells. Wisconsin has the highest rate of “beneficial reuse” of coal fly ash in the United States, and concern has arisen from decades of unregulated disposal of coal fly ash beneath roads, buildings, and foundations. They suggest that widespread distribution of coal fly ash over several decades has led to the regional groundwater problem of elevated dissolved molybdenum. A recent 2014 U.S. EPA ruling continues to allow the beneficial reuse of coal combustion products, without the need to regulate it as a hazardous substance [125].
5. Conclusions
In general, groundwater quantity issues are most prominent in the central sands region of central Wisconsin and heavily populated parts of northeastern and southeastern Wisconsin that draw from confined aquifers. Some regions, such as the municipalities near Lake Michigan, are fortunate enough to have this resource available and have switched over to surface water resources when water quantity or quality issues have arisen.
Problems with groundwater quality, on the other hand, are more widespread and are difficult to solve. Groundwater quality issues originate through naturally occurring and anthropogenic sources, and they are strongly influenced by the regional geologic framework. The arsenic contamination problem in eastern Wisconsin has been addressed in some areas through well testing and special well casing requirements. Although significant problems remain, a greater public awareness has been established. Other contaminants, such as bacteria and nitrates, continue to be significant challenges. A few contaminants, such as viruses, EDCs, and strontium, might be considered emerging contaminants.
Acknowledgments
We would like to thank UW-Green Bay students Joseph Baeten and Josie Robertson for assistance with graphics related to their research on strontium and fluoride, respectively. Robert Smail contributed some helpful information on water use in the state. We also thank Elizabeth Luczaj and two anonymous reviewers for kindly reviewing this manuscript.
Author Contributions
John Luczaj’s contribution includes researching the overall groundwater quantity and quality issues. Kevin Masarik focused on the groundwater quantity overview, issues related to the central sand plains, and sections covering nitrates, pesticides, and pathogens. Both parties worked on identifying and documenting the references and creating figures.
Conflicts of Interest
The authors declare no conflict of interest.
References
- Rohli, R.V.; Vega, A.J. Climatology, 4th ed.; Jones & Bartlett Learning: Burlington, MA, USA, 2015; p. 443. [Google Scholar]
- NOAA. National Weather Service Statewide Wisconsin Average Annual Precipitation Map—30 Year Average Precipitation 1981–2010. Available online: http://www.crh.noaa.gov/images/mkx/climate/avg_30_year_precip.png (accessed on 15 April 2015).
- United States Census Bureau. United States Census—2010. Available online: http://www.census.gov/2010census/data/ (accessed on 15 April 2015).
- Wisconsin Department of Natural Resources (WDNR). Status of Groundwater Quantity in Wisconsin. Available online: http://dnr.wi.gov/topic/Groundwater/documents/GCC/gw-quantity.pdf (accessed on 15 April 2015).
- Luczaj, J.A.; Hart, D.J. Drawdown in the Northeast Groundwater Management Area (Brown, Outagamie, and Calumet Counties, WI). Final report prepared for the Wisconsin Department of Natural Resources. Available online: http://wgnhs.uwex.edu/pubs/wofr200904/ (accessed on 15 April 2015).
- Maas, J.C. Drawdown, Recovery, and Hydrostratigraphy in Wisconsin’s Northeast Groundwater Management Area (Brown, Outagamie, and Calumet Counties). Master’s Thesis, University of Wisconsin, Green Bay, WI, USA, December 2009. [Google Scholar]
- Southeast Wisconsin Regional Planning Commission (SWRPC). Groundwater Resources of Southeastern Wisconsin: Technical Report Number 37. Available online: http://www.sewrpc.org/SEWRPCFiles/Publications/TechRep/tr-037_groundwater_resources.pdf (accessed on 15 April 2015).
- Stites, W.; Kraft, G.J. Groundwater quality beneath irrigated vegetable fields in a north-central U.S. sand plain. J. Environ. Qual. 2000, 29, 1509–1517. [Google Scholar] [CrossRef]
- Wisconsin Department of Natural Resources (DNR). Wisconsin Lakes; Wisconsin Department of Natural Resources: Madison, WI, USA, 2009.
- Syverson, K.M.; Colgan, P.M. The Quaternary of Wisconsin: A review of stratigraphy and glaciation history. In Quaternary Glaciations—Extent and Chronology, Part II: North America; Ehlers, J., Gibbard, P.L., Eds.; Elsevier Publishing: Amsterdam, The Netherlands, 2004; pp. 295–311. [Google Scholar]
- Wisconsin Department of Natural Resources (WDNR). Wisconsin Water Use: 2013 Withdrawal Summary; Wisconsin Department of Natural Resources Water Use Section: Madison, WI, USA, 2014. Available online: http://dnr.wi.gov/topic/WaterUse/documents/WithdrawalReportDetail.pdf (accessed on 15 April 2015).
- Ellefson, B.R.; Mueller, G.D.; Buchwald, C.A. Water Use in Wisconsin: United States Geological Survey Open-File Report; United States Geological Survey: Reston, VA, USA, 2000.
- Smail, R.A. Written Communication regarding groundwater use in Wisconsin, 13 October 2014.
- Center for Land Use Education (CLUE). Wisconsin Land Use Megatrends: Water. University of Wisconsin-Stevens Point and University of Wisconsin—Cooperative Extension. Available online: https://www.uwsp.edu/cnr-ap/clue/Documents/megatrends/WaterMegatrendsFINAL.pdf (accessed on 15 April 2015).
- Weidman, S.; Schultz, A.R. The Underground and Surface Water Supplies of Wisconsin; Forgotten Books: London, UK, 1915. [Google Scholar]
- Kammerer, P.A., Jr. Ground Water Flow and Quality in Wisconsin’s Shallow Aquifer System; United States Geological Survey: Reston, VA, USA, 1995.
- Dott, R.H., Jr.; Attig, J.W. Roadside Geology of Wisconsin, 1st ed.; Mountain Press: Missoula, MT, USA, 2004; p. 246. [Google Scholar]
- La Berge, G.L. Geology of the Lake Superior Region; Geoscience Press, Inc.: Phoenix, AZ, USA, 1994; p. 313. [Google Scholar]
- Larson, G.; Schaetzl, R. Origin and evolution of the Great Lakes. J. Gr. Lakes Res. 2001, 27, 518–546. [Google Scholar] [CrossRef]
- Luczaj, J.A. Geology of the Niagara escarpment in Wisconsin. Geosci. Wis. 2013, 22, 1–34. Available Online: http://wgnhs.uwex.edu/pubs/gs22a01/ (accessed on 15 April 2015). [Google Scholar]
- Ojakangas, R.W.; Morey, G.B.; Green, J.C. The mesoproterozoic midcontinent rift system, lake superior region, USA. Sediment. Geol. 2001, 141–142, 421–442. [Google Scholar] [CrossRef]
- Schultz, G.M. Wisconsin’s Foundations: A Review of the State’s Geology and its Influence on Geography and Human Activity; UW Press: Dubuque, IA, USA, 1986; pp. 1–211. [Google Scholar]
- Schulz, K.J.; Cannon, W.F. The Penokean orogeny in the Lake Superior region. Precambrian Res. 2007, 157, 4–25. [Google Scholar] [CrossRef]
- Syverson, K.M.; Clayton, L.; Attig, J.W.; Mickelson, D.M. Lexicon of Pleistocene Stratigraphic Units of Wisconsin; Technical Report; Wisconsin Geological and Natural History Survey: Madison, WI, USA, 2011; pp. 1–180. [Google Scholar]
- Catacosinos, P.A.; Daniels, P.A., Jr.; Harrison, W.B., III. Structure, stratigraphy, and petroleum geology of the Michigan basin. In Interior Cratonic Basins; Leighton, M., Kolata, D., Oltz, D., Eidel, J., Eds.; American Association of Petroleum Geologists Memoir: Tulsa, OK, USA, 1990; pp. 561–601. [Google Scholar]
- Luczaj, J.A. Evidence against the Dorag (Mixing-Zone) model for dolomitization along the Wisconsin arch—A case for hydrothermal diagenesis. AAPG Bull. 2006, 90, 1719–1738. [Google Scholar] [CrossRef]
- Runkel, A.C.; Miller, J.F.; McKay, R.M.; Palmer, A.R.; Taylor, J.F. High-resolution sequence stratigraphy of lower Paleozoic sheet sandstones in central North America: The role of special conditions of cratonic interiors in development of stratal architecture. GSA Bull. 2007, 119, 860–881. [Google Scholar] [CrossRef]
- Krohelski, J.T. Hydrogeology and Ground-Water Use and Quality, Brown County, Wisconsin; Wisconsin Geological and Natural History Survey: Madison, WI, USA, 1986; Volume 57, pp. 1–42. [Google Scholar]
- Luczaj, J.A.; Maas, J.; Hart, D.J. A history of drawdown in the Cambrian-Ordovician confined aquifer system in northeastern Wisconsin. Manuscript in preparation.
- Wisconsin Geological & Natural History Survey. In Bedrock Stratigraphic Units in Wisconsin; Educational Series; Wisconsin Geological & Natural History Survey: Madison, WI, USA, 2011.
- McLaughlin, P.I.; Mikulic, D.G.; Kluessendorf, J. Age and correlation of Silurian rocks in Sheboygan, Wisconsin, using integrated stable carbon isotope stratigraphy and facies analysis. Geosci. Wis. 2013, 21, 15–38. [Google Scholar]
- Velbel, M. The “Lost Interval”: Geology from the Permian to the Pliocene. In Michigan Geography and Geology, 1st ed.; Schaetzl, R., Darden, J., Brant, D., Eds.; Pearson Custom Publishing: Boston, MA, USA, 2009; pp. 60–68. [Google Scholar]
- Moran, J.M.; Hopkins, E.J. Wisconsin’s Weather and Climate, 1st ed.; University of Wisconsin Press: Madison, WI, USA, 2002; pp. 1–321. [Google Scholar]
- Thorleifson, L.H. Potential Capacity for Geologic Carbon Sequestration in the Midcontinent Rift System in Minnesota; Open File Report for Minnesota Geological Survey: St. Paul, MN, USA, 2008; pp. 1–138. [Google Scholar]
- Grundl, T.; Cape, M. Geochemical factors controlling radium activity in a sandstone aquifer. Ground Water 2006, 44, 518–527. [Google Scholar] [CrossRef] [PubMed]
- Grundl, T.; Magnusson, N.; Brennwald, M.S.; Kipfer, R. Mechanisms of subglacial groundwater recharge as derived from noble gas, 14C, and stable isotopic data. Earth Planet. Sci. Lett. 2013, 369–370, 78–85. [Google Scholar] [CrossRef]
- Luczaj, J.A.; Stieglitz, R.D. Geologic history of New Hope Cave, Manitowoc County, Wisconsin. Wis. Speleol. 2008, June, 7–17. [Google Scholar]
- Wauters, G.J. Paleoecological Perspectives: The Brussels Hill Pit Cave Mammal Assemblage, with a Focus on Short-Tailed Shrews and Graphical Explorations of Holocene Paleomammalogy in Wisconsin. Master’s Thesis, University of Wisconsin, Green Bay, WI, USA, 2013. [Google Scholar]
- Weaver, T.R.; Bahr, J.M. Geochemical evolution in the Cambrian-Ordovician sandstone aquifer, eastern Wisconsin: 1. Major ion and radionuclide distribution. Ground Water 1991, 29, 350–356. [Google Scholar] [CrossRef]
- Weaver, T.R.; Bahr, J.M. Geochemical evolution in the Cambrian-Ordovician sandstone aquifer, eastern Wisconsin. 2. Correlation between flow paths and ground-water chemistry. Ground Water 1991, 29, 510–515. [Google Scholar] [CrossRef]
- Klump, S.; Grundl, T.; Purtschert, R.; Kipfer, R. Groundwater and climate dynamics derived from noble gas, 14C, and stable isotope data. Geology 2008, 36, 395–398. [Google Scholar] [CrossRef]
- Weeks, E.P.; Stangland, H.G. Effects of Irrigation on Streamflow in the Central Sand Plain of Wisconsin; United States Geological Survey: Reston, VA, USA, 1971.
- Kraft, G.J.; Clancy, K.; Mechenich, D.J.; Haucke, J. Irrigation effects in the Northern Lake States: Wisconsin central sands revisited. Ground Water 2012, 50, 308–318. [Google Scholar] [CrossRef] [PubMed]
- Groundwater Coordinating Council (GCC). Wisconsin Groundwater Coordinating Council FY 2013 Report to the Wisconsin State Legislature. Available online: http://dnr.wi.gov/topic/groundwater/documents/GCC/Report/WIgroundwaterLaw.PDF (accessed on 15 April 2015).
- Supreme Court of Wisconsin, Lake Beulah Management District, Petitioner-Appellant-Cross-Respondent, Lake Beulah Protective and Improvement Association, Co-Petitioner-Co-Appellant-Cross- Respondent, v. State of Wisconsin Department of Natural Resources, Respondent-Respondent, Village of East Troy, Intervening-Respondent-Respondent- Cross-Appellant-Petitioner. 2011. Available online: https://www.wicourts.gov/sc/opinion/DisplayDocument.pdf?content=pdf&seqNo=67353 (accessed on 15 April 2015).
- Boldt, J.D. Case Nos. 1H-12-03, 1H-12-05, DNR-13-021 and NDR-13-027. State of Wisconsin, Division of Hearings and Appeals. 3 September 2014. [Google Scholar]
- Council of Great Lakes Governors. Great Lakes-St. Lawrence River Basin Water Resources Compact (2008). Available online: http://www.cglg.org/projects/water-management/great-lakes-agreement-and-compact/ (accessed on 12 April 2015).
- Karkkainen, B.C. The Great Lakes water resources compact and agreement: Transboundary normativity without international law. William Mitchell Law Rev. 2013, 39, 997. [Google Scholar]
- Feinstein, D.T.; Hart, D.J.; Eaton, T.T.; Krohelski, J.T.; Bradbury, K.R. Simulation of Regional Groundwater Flow in Southeastern Wisconsin; Wisconsin Geological & Natural History Survey: Madison, WI, USA, 2004; Available online: http://wgnhs.uwex.edu/pubs/wofr200401/ (accessed on 15 April 2015).
- Luczaj, J.A. The largest flowing artesian well in the state of Wisconsin is (sometimes) an abandoned deep quarry. In Proceedings of the American Water Resources Association—Wisconsin Section, 38th Annual Meeting, Wisconsin Dells, WI, USA, 13–14 March 2014; Available online: http://state.awra.org/wisconsin/2014meeting/Session3A4Luczaj.pdf (accessed on 15 April 2015).
- Jakel, D.E. Soil Survey of Adams County, Wisconsin; USDA Soil Conservation Service: Washington, DC, USA, 1980.
- Weeks, E.P.; Ericson, D.W.; Holt, C.L.R. Hydrology of the Little Plover River Basin Portage County, Wisconsin and the Effects of Water Resource Development; Water-Supply Paper for United States Geological Survey; United States Geological Survey: Reston, VA, USA, 1965.
- Clayton, L. Pleistocene Geology of Adams County, Wisconsin; University of Wisconsin-Extension and Geological and Natural History Survey: Madison, WI, USA, 1987. [Google Scholar]
- Goc, M.J. The Wisconsin Dust Bowl. Wis. Mag. Hist. 1990, 73, 163–201. [Google Scholar]
- Prengaman, K. Groundwater War Pits Farmers Against Fish. Wisconsin Center for Investigative Journalism, 13 July 2013. Available online: http://wisconsinwatch.org/2013/07/groundwater-war-pits-wisconsin-farms-against-fish-2/ (accessed on 15 April 2015).
- Wisconsin Department of Natural Resources (WDNR). Central Sands Strategic Analysis. Available online: http://dnr.wi.gov/topic/eia/cssa.html (accessed on 13 April 2015).
- Bell, E.A.; Sherrill, M.G. Water Availability in Central Wisconsin—An Area of Near-Surface Crystalline Rock; Water-Supply Paper for United States Geological Survey: Reston, VA, USA, 1974.
- Joachim, D.R.; Gotkowitz, M.B.; Potter, K.W.; Bradbury, K.R.; Vavrus, S.J.; Loheide, S.P. Forecasting Impacts of Extreme Precipitation Events on Wisconsin’s Groundwater Levels; Open-File Report; Wisconsin Geological & Natural History Survey: Madison, WI, USA, 2011; Available online: http://wgnhs.uwex.edu/pubs/000897/ (accessed on 15 April 2015).
- Knobeloch, L.; Gorski, P.; Christenson, M. Private drinking water quality in rural Wisconsin. J. Environ. Health 2013, 75, 16–20. [Google Scholar] [PubMed]
- WHO. Guidelines for Drinking Water Quality, 4th ed.; World Health Organization: Geneva, Switzerland, 2011. [Google Scholar]
- U.S. Environmental Protection Agency. National Primary Drinking Water Standards; Environmental Protection Agency: Washington, DC, USA, 2000; pp. 76708–76753.
- Guse, C.E.; Marbbella, A.M.; George, V.; Layde, P.M. Radium in Wisconsin drinking water: An analysis of osteosarcoma risk. Arch. Environ. Health 2002, 57, 294–303. [Google Scholar] [CrossRef] [PubMed]
- Gilkeson, R.H.; Cowart, J.B. Radium, radon, and uranium isotopes in ground water from Cambrian–Ordovician sandstone aquifers in Illinois. In Radon in Ground Water—Hydrogeologic Impact and Indoor Air Contamination; Graves, B., Ed.; Lewis Publishers, Inc.: Chelsea, MI, USA, 1987; pp. 403–422. [Google Scholar]
- Wilson, J.T. Water-Quality Assessment of the Cambrian-Ordovician Aquifer System in the Northern Midwest, United States; Scientific Investigations Report; United States Geological Survey: Reston, VA, USA, 2012. Available online: http://pubs.usgs.gov/sir/2011/5229 (accessed on 15 April 2015).
- Wisconsin Department of Natural Resources (WDNR). Radium in Drinking Water. PUB-DG-008 2014. Available online: http://dnr.wi.gov/files/pdf/pubs/dg/dg0008.pdf (accessed on 15 April 2015).
- Sturchio, N.C.; Banner, J.L.; BInz, C.M.; Heraty, L.B.; Musgrove, M. Radium geochemistry of ground waters in Paleozoic carbonate aquifers, midcontinent, USA. Appl. Geochem. 2001, 16, 109–122. [Google Scholar] [CrossRef]
- Gilkeson, R.H.; Cartwright, K.; Cowart, J.B.; Holtzman, R.B. Hydrogeologic and Geochemical Studies of Selected Natural Radioisotopes and Barium in Ground Water in Illinois; Report for Illinois Water Resources Center: Urbana, IL, USA, 1983; pp. 1–93.
- Siegel, D.I. Sulfur isotope evidence for regional recharge of saline water during continental glaciation, north-central United States. Geology 1990, 18, 1054–1056. [Google Scholar] [CrossRef]
- Millard, P. Brown County Cities Find Water Crisis Solution in Manitowoc County. Available online: http://www.bizjournals.com/milwaukee/stories/2007/12/10/focus1.html?page=all (accessed on 15 April 2015).
- Bergquist, L. Fond du Lac to Pay Settlement over Radium in Drinking Water. Available online: http://www.jsonline.com/news/wisconsin/37527669.html (accessed on 15 April 2015).
- Wisconsin Department of Natural Resources (DNR). DNR Approves New Berlin Request to Divert Lake Michigan Water; Department of Natural Resources: Madison, WI, USA, 21 May 2009.
- Behm, D. Waukesha Turns to More Radium-Laced Water after Well Pump Fails. Available online: http://www.jsonline.com/news/waukesha/waukesha-turns-to-radium-contaminated-water-after-well-pump-fails-b99108416z1-225570262.html (accessed on 15 April 2015).
- Waukesha Water Utility Public Radium Notice. Letter to the Public (2014). Available online: http://www.ci.waukesha.wi.us/web/guest/redium (accessed on 15 May 2015).
- Behm, D. Waukesha Concedes it Can’t Meet Deadline for Radium-Free Water. Milwaukee Journal Sentinel. 19 November 2014. Available online: http://www.jsonline.com/news/waukesha/waukesha-concedes-it-can-meet-deadline-for-radium-free-water-b99393845z1–283255831.html (accessed on 15 April 2015).
- Smith, A.H.; Lingas, E.O.; Rahman, M. Contamination of drinking-water by arsenic in Bangladesh: A public health emergency. Bull. World Health Organ. 2000, 78, 1093–1103. [Google Scholar] [PubMed]
- Riewe, T.; Weissbach, A.; Heinen, L.; Stoll, R. Naturally occurring arsenic in well water in Wisconsin. Water Well J. 2000, 49, 24–29. [Google Scholar]
- Knobeloch, L.M.; Zierold, K.M.; Anderson, H.A. Association of arsenic-contaminated drinking-water with prevalence of skin cancer in Wisconsin’s Fox River valley. J. Health Popul. Nutr. 2006, 24, 206–213. [Google Scholar] [PubMed]
- Schreiber, M.E.; Simo, J.A.; Freiberg, P.G. Stratigraphic and geochemical controls on naturally occurring arsenic in groundwater, Eastern Wisconsin, USA. Hydrogeol. J. 2000, 8, 161–176. [Google Scholar] [CrossRef]
- Center for Watershed Science and Education (CWSE). WI Well Water Viewer, University of Wisconsin-Stevens Point. Available online: http://www.uwsp.edu/cnr-ap/watershed/Pages/WellWaterViewer.aspx (accessed on 13 April 2015).
- Root, T.L.; Gotkowitz, M.B.; Bahr, J.M.; Attig, J.W. Arsenic geochemistry and hydrostratigraphy in Midwestern U.S. glacial deposits. Ground Water 2010, 48, 903–912. [Google Scholar] [CrossRef] [PubMed]
- Johnson, D.M.; Riewe, T. Arsenic and Northeastern Wisconsin. Water Well J. 2006, 60, 26–31. [Google Scholar]
- Burkel, R.S.; Stoll, R.C. Naturally occurring arsenic in sandstone aquifer water supply wells of Northeastern Wisconsin. Groundw. Monit. Remediat. 1999, 19, 114–121. [Google Scholar] [CrossRef]
- Schreiber, M.E.; Gotkowitz, M.B.; Simo, J.A.; Freiberg, P.G. Mechanisms of arsenic release to ground water from naturally occurring sources, eastern Wisconsin. In Arsenic in Ground Water; Welch, A., Stollenwerk, K., Eds.; Kluwer Academic Publishers: Boston, MA, USA, 2003; pp. 259–280. [Google Scholar]
- Gotkowitz, M.B.; Schreiber, M.S.; Simo, J.A. Effects of water use on arsenic release to well water in a confined aquifer. Ground Water 2004, 42, 568–575. [Google Scholar] [CrossRef] [PubMed]
- Johnson, D. Written communication, 28 August 2008.
- Luczaj, J.A.; McIntire, M. Geochemical characterization of MVT mineralization in eastern Wisconsin Paleozoic sedimentary rocks: Implications for groundwater quality. Manuscript in preparation.
- Thornburg, K.; Sahai, N. Arsenic occurrence, mobility, and retardation in sandstone and dolomite formations of the Fox River Valley, Eastern Wisconsin. Environ. Sci. Technol. 2004, 38, 5087–5094. [Google Scholar] [CrossRef] [PubMed]
- Ozsvath, D.L. Fluoride and environmental health: A review. Rev. Environ. Sci. Biotechnol. 2009, 8, 59–79. [Google Scholar] [CrossRef]
- Tiemann, M. Fluoride in Drinking Water: A Review of Fluoridation and Regulation Issues; Congressional Research Service: Washington, DC, USA, 2013; pp. 1–21. [Google Scholar]
- Ozsvath, D.L. Fluoride concentrations in a crystalline bedrock aquifer Marathon County, Wisconsin. Environ. Geol. 2006, 50, 132–138. [Google Scholar] [CrossRef]
- Wisconsin Department of Natural Resources (WDNR). Groundwater Retrieval Network. Available online: http://prodoasext.dnr.wi.gov/inter1/grn$.startup (accessed on 20 October 2014).
- Luczaj, J.A.; Zorn, M.; Baeten, J. An Evaluation of the Distribution and Sources of Dissolved Strontium in the Groundwater of Eastern Wisconsin, with a Focus on Brown and Outagamie Counties; Final Report Submitted to the UW Water Resources Institute: Madison, WI, USA, 15 November 2013. [Google Scholar]
- Baeten, J. Spatial Distribution and Source Identification of Dissolved Strontium in Eastern Wisconsin’s Cambrian-Ordovician Aquifers. Master’s Thesis, University of Wisconsin, Green Bay, WI, USA, 2013. [Google Scholar]
- Luczaj, J.A.; Baeten, J.; Zorn, M. Distribution and Sources of Dissolved Strontium in the Groundwater of Eastern Wisconsin. Manuscript in preparation.
- Holt, C.; Skinner, E.L. Ground-water quality in Wisconsin through 1972. Wis. Geol. Nat. Hist. Surv. Inform. Circular 1973, 22, 1–148. [Google Scholar]
- Nichols, M.S.; McNall, D.R. Strontium content of Wisconsin municipal waters. J. Am. Water Works Assoc. 1957, 49, 1493–1498. [Google Scholar]
- Özgür, S.; Sümer, H.; Koҫoǧlu, G. Rickets and soil strontium. Arch. Dis. Child. 1996, 75, 524–526. [Google Scholar] [CrossRef] [PubMed]
- Curzon, M.E.J.; Spector, P.C. Enamel mottling in a high strontium area of the USA. Community Dent. Oral Epidemiol. 1977, 5, 243–247. [Google Scholar] [CrossRef] [PubMed]
- Available online: http://yosemite.epa.gov/opa/admpress.nsf/6427a6b7538955c585257359003f0230/327f339e63facb5a85257d77005f4bf9!OpenDocument (accessed on 15 April 2015).
- Bethke, C.M.; Marshak, S. Brine migrations across North America—The plate tectonics of groundwater. Annu. Rev. Earth Planet. Sci. 1990, 18, 237–315. [Google Scholar] [CrossRef]
- Klimas, A.; Mališauskas, A. Boron, fluoride, strontium, and lithium anomalies in fresh groundwater of Lithuania. Geologija 2008, 50, 114–124. [Google Scholar] [CrossRef]
- Oberle, S. Written communication, 22 June 2011.
- Shaw, B. Nitrogen contamination sources: A look at relative contributions. In Proceedings of the Nitrate in Wisconsin’s Groundwater: Strategies and Challenges Conference, Stevens Point, WI, USA, 10 May 1994.
- Department of Agriculture, Trade and Consumer Protection (DATCP). Agricultural Chemicals in Wisconsin Groundwater (April 2008). Available online: http://datcp.wi.gov/uploads/Environment/pdf/ARMPub180.pdf (accessed on 15 April 2015).
- Schmidt, R.R. Groundwater Contamination Susceptibility Map and Evaluation; Wisconsin’s Groundwater Management Plan Report; Wisconsin Department of Natural Resources: Madison, WI, USA, 1987.
- Masarik, K.; Norman, J.; Brye, K. Long-term drainage and nitrate leaching below well-drained continuous corn agroecosystems and a prairie. J. Environ. Prot 2014, 5, 240–254. [Google Scholar] [CrossRef]
- Randall, G.W.; Huggins, D.R.; Russelle, M.P.; Fuchs, D.J.; Nelson, W.W.; Anderson, J.L. Nitrate losses through subsurface tile drainage in conservation reserve program, alfalfa, and row crop systems. J. Environ. Qual. 1997, 26, 1240–1247. [Google Scholar] [CrossRef]
- Erb, K.R.; Stieglitz, R. Final Report of the Northeast Wisconsin Karst Task Force; University of Wisconsin—Extension: Madison, WI, USA, 2007; pp. 1–46. [Google Scholar]
- Bauer, A.C.; Wingert, S.; Fermanich, K.J.; Zorn, M.E. Well water in karst regions of northeastern Wisconsin contains estrogenic factors, nitrate, and bacteria. Water Environ. Res. 2013, 85, 318–326. [Google Scholar] [CrossRef] [PubMed]
- Borchardt, M.A.; Bertz, P.D.; Spencer, S.K.; Battigelli, D.A. Incidence of enteric viruses in groundwater from household wells in Wisconsin. Appl. Environ. Microbiol. 2003, 69, 1172–1180. [Google Scholar] [CrossRef] [PubMed]
- Borchardt, M.A.; Haas, N.L.; Hunt, R.J. Vulnerability of drinking-water wells in La Crosse, Wisconsin, to enteric-virus contamination from surface water contributions. Appl. Environ. Microbiol. 2004, 70, 5937–5946. [Google Scholar] [CrossRef] [PubMed]
- Borchardt, M.A.; Bradbury, K.R.; Gotkowitz, M.B.; Cherry, J.A.; Parker, B.L. Human enteric viruses in groundwater from a confined bedrock aquifer. Environ. Sci. Technol. 2007, 41, 6606–6612. [Google Scholar] [CrossRef] [PubMed]
- Hunt, R.J.; Borchardt, M.A.; Richards, K.D.; Spencer, S.K. Assessment of sewer source contamination in drinking water wells using tracers and human enteric viruses. Environ. Sci. Technol. 2010, 44, 7956–7963. [Google Scholar] [CrossRef] [PubMed]
- Borchardt, M.A.; Bradbury, K.R.; Alexander, E.C., Jr.; Kolberg, R.J.; Alexander, S.C.; Archer, J.R.; Braatz, L.A.; Forest, B.M.; Green, J.A.; Spencer, S.K. Norovirus outbreak caused by a new septic system in a dolomite aquifer. Ground Water 2011, 49, 85–97. [Google Scholar] [CrossRef] [PubMed]
- Borchardt, M.A.; Spencer, S.K.; Kieke, B.A.; Lambertini, E.; Loge, F.J. Viruses in non-disinfected drinking water from municipal wells and community incidence of acute gastrointestinal illness. Environ. Health Perspect. 2012, 120, 1272–1279. [Google Scholar] [CrossRef] [PubMed]
- Uejio, C.K.; Yale, S.H.; Malecki, K.; Borchardt, M.A.; Anderson, H.A.; Patz, J.A. Drinking water systems, hydrology, and childhood gastrointestinal illness in central and Northern Wisconsin. Am. J. Public Health 2014, 104, 639–646. [Google Scholar] [CrossRef] [PubMed]
- Erb, K.R.; Ronk, E. Documenting the regional impacts of karst task force recommendations on ‘brown water incidents’ in Northeast Wisconsin, USA. Resources 2015. under review. [Google Scholar]
- Chern, L. Written communication, 8 April 2014.
- Gotkowitz, M.B.; Liebl, D.S. Municipal drinking water safety, the link between groundwater, pathogens, and public health. Wis. Geol. Nat. Hist. Surv. Educ. Ser. 2013, 053, 1–4. [Google Scholar]
- Wisconsin Department of Agriculture, Trade, and Consumer Protection. Wisconsin groundwater quality: Agricultural chemicals in Wisconsin groundwater. In Agric. Resour. Manag.; 2008; 180, p. 21. Available online: http://datcp.wi.gov/uploads/Environment/pdf/ARMPub180.pdf (accessed on 15 April 2015). [Google Scholar]
- Wisconsin Department of Agriculture, Trade, and Consumer Protection. Fifteen Years of the DATCP Exceedence Well Survey 2010. Available online: http://datcp.wi.gov/uploads/Environment/pdf/FifteenYearsoftheDATCPExceedenceSurvey.pdf (accessed on 15 April 2015).
- Benotti, M.J.; Trenholm, R.A.; Vanderford, B.J.; Holady, J.C.; Stanford, B.D.; Snyder, S.A. Pharmaceuticals and endocrine disrupting compounds in U.S. drinking water. Environ. Sci. Techol. 2009, 43, 597–603. [Google Scholar] [CrossRef]
- Cook, T.; Mathewson, P.; Nekola, K. Don’t Drink the Water—Groundwater Contamination and the “Beneficial Reuse” of Coal Ash in Southeast Wisconsin. Clean Wisconsin, (November 2014). Available online: http://www.cleanwisconsin.org/wp-content/uploads/2015/02/dont-drink-the-water-report-clean-wisconsin.pdf (accessed on 15 April 2015).
- Lourigan, J.; Phelps, W. Caledonia groundwater molybdenum investigation Southeast Wisconsin—2013. Wisconsin Department of Natural Resources: Madison, WI, USA, 2013. Available online: http://dnr.wi.gov/files/PDF/pubs/WA/WA1625.pdf (accessed on 15 April 2015). [Google Scholar]
- United States Environmental Protection Agency (USEPA). Hazardous and Solid Waste Management System; Disposal of Coal Combustion Residuals from Electric Utilities. Available online: http://www.gpo.gov/fdsys/pkg/FR-2015-04-17/pdf/2015-00257.pdf (accessed on 15 April 2015).
© 2015 by the authors; licensee MDPI, Basel, Switzerland. This article is an open access article distributed under the terms and conditions of the Creative Commons Attribution license (http://creativecommons.org/licenses/by/4.0/).