Abstract
The characterization of carbonate subsurface reservoirs, which host significant natural resources such as water and hydrocarbon, is crucial for earth scientists and engineers. Key characterization methods include seismic and downhole sonic techniques. This study explores the relative influence of mineralogy versus pore geometry on acoustic velocity and velocity–porosity relationships in carbonate rocks, which is important for seismic and sonic interpretation in reservoir characterization. A global dataset from ten localities encompassing different carbonate lithologies—including limestones, fabric-preserving (FP) and non-fabric-preserving (NFP) dolostones, and siliceous carbonates—was analyzed using laboratory measurements and Differential Effective Medium (DEM) modeling. Results show that the mineralogy influence decreases with porosity, so it is limited only to tight rocks where dolostones show higher velocity than limestones while siliceous carbonates show the least velocity. As porosity increases, FP dolostones retain higher velocities, whereas NFP dolostones have comparable or lower velocities than limestones, contrary to expectations from mineral elastic properties. This behavior is mainly governed by pore geometry, as supported by petrographic analysis and DEM modeling. Siliceous carbonates display notably lower velocities, which is entirely attributed to smaller pore aspect ratios (about 50% less than in limestones) rather than mineralogical effects. Overall, this study highlights that pore geometry dominates over mineralogy in determining acoustic velocity within porous carbonates, providing a valuable framework for improving seismic and sonic-based porosity estimation across variable carbonate lithologies.
Keywords:
carbonates; mineralogy; pore types; acoustic velocity; rock-physics; lithology; geo-resources 1. Introduction
Carbonate rocks are major aquifer and hydrocarbon reservoirs, so better characterization of such rocks can be of major interest for many earth sciences and engineering applications [1,2]. Sonic- and seismic-based methods are major techniques for exploring subsurface rocks. Therefore, understanding geological and microstructural controls on the sonic/elastic properties of carbonates can be crucial for downhole sonic and seismic interpretation [1,2,3,4,5]. This can also be important for establishing the petroacoustic signature (i.e., linking petrophysical and elastic properties) of rocks, which is a major task in rock-physics analysis [3]. A good example for such a petroacoustic signature is the compressional velocity–porosity relationship (Vp-φ), which is essential for quantitative sonic and seismic interpretation [3,4,5].
In general, porosity alone cannot explain variations in velocity within carbonates due to their heterogeneity, which imposes a challenge to sonic- or seismic-based porosity estimation. Many studies have investigated controlling factors on the velocity–porosity relationship of carbonates, examining different factors such as mineralogy, pore geometry, texture, and grain-to-mud ratio [6,7,8,9,10,11,12,13]. Among all factors, mineralogy and pore geometry have been reported as typically the most important ones [6,7,8,9,11,12,13,14,15,16]. The rich literature has shown that complex pore geometry in carbonates plays a major role in controlling the velocity at any given porosity [6,7,8,9,11,12,13]. Rocks dominated by secondary macro-pores (e.g., moldic, vuggy, intraparticle) are usually characterized by higher velocity compared to micro-porosity-dominated rocks, as reported by many studies [6,7,8,11,13,17,18,19,20]. These studies showed that pore geometry can explain the noticeable scatter in Vp-φ, especially in limestones. Nevertheless, carbonates can have variable mineralogy (apart from limestone, which is made out of calcite), including dolomite and siliciclastic inputs. For dolostones, a relatively recent study showed that Vp and φ can show strong correlation, especially for non-fabric-preserving (NFP) dolostones [21]. The authors attributed this observation to the potential homogenization of pore structure by non-fabric-preserving dolomitization, resulting in porosity (rather than pore geometry) being the main controlling factor on velocity [21]. The texture of dolostones can also be important, as fabric-preserving (FP) dolostones are frequently characterized by higher velocity than NFP dolostones at any given porosity [21]. This study, however, was focused on dolostones and did not compare the Vp-φ to that from limestones, for example. Such a comparison was recently carried out by [22], where the authors compared Vp-φ of limestones with that of dolostones. The authors reported limited impact of mineralogy, as dolostones showed comparable velocity with limestones despite the higher mineral velocity of dolomite [22]. The dolostone dataset used, however, was predominantly NFP, so comparison with FP dolostone or mixed carbonate–siliciclastic systems was not established. While Weger et al. [22] suggested limited mineralogy effect, other studies suggested that mineralogy is the main parameter controlling acoustic velocity in dolostone–limestone and carbonate–siliciclastic systems [14,15,16,23,24,25]. Such studies stated that pore geometry does also influence the velocity, but it remains unclear how much pore geometry (versus mineralogy) contributes to the velocity variations.
It is worth mentioning that the vast majority of the above studies focused on a single formation, frequently with a limited number of samples. This made it difficult to draw general conclusions about the impact of mineralogy on acoustic velocity, for example. A comprehensive study comparing the Vp-φ of global carbonate datasets, characterized by variable pore geometry and mineralogy, including limestone, dolostone (with both FP and NFP textures), and mixed carbonate-siliciclastic, is still missing. Such comprehensive study and comparison between the petroacoustic signature (Vp-φ) of different carbonate lithologies and pore geometries can help to (1) establish the dominant or characteristic Vp-φ for each mineralogy/lithology, (2) determine the dominant controlling factor on velocity (mineralogy versus pore geometry) and quantify the contribution of each, and (3) establish the foundation for sonic-based facies and porosity determination. Therefore, the aim of the current study is to investigate which factor is more important in explaining the variations in velocity at a given porosity in carbonates: mineralogy or pore geometry. This study aims to quantify the contribution of each factor and to explore whether such contribution is a function of the rock porosity or if it is similar across the whole porosity range. This study uses published datasets from more than 10 different localities globally, covering a wide range of porosity, pore type, and mineralogy. The datasets include limestones (calcite dominant) and FP and NFP dolostones, in addition to siliceous limestones (with variable quartz content). The dominant petroacoustic signature of each group was established considering the impact of both mineralogy and pore geometry. The analysis was complemented by rock-physics modeling in an effort to differentiate and quantify the relative contribution of pore geometry versus mineralogy to the observed velocity variations.
2. Materials and Methods
2.1. Dataset
The data used in this study is sourced from the existing literature, and it consists of porosity (φ) and acoustic velocity (Vp) measured at high pressure (30–40 MPa) to ensure relevancy to typical subsurface reservoir pressure and to eliminate the impact of micro-cracks potentially induced during plug extraction. All ultrasonic measurements used here are obtained from dry core plug samples to eliminate velocity variations due to fluid–solid interaction or dispersion (i.e., velocity increase due to the fluid presence at ultrasonic frequency). The average central frequency of the ultrasonic measurements was 0.7–1 MHz. Mineralogy data was obtained based on X-ray diffraction (XRD) measurements, focusing here on the fraction of calcite, dolomite, and quartz. Clay was found in very few samples and in very minor quantities (typically less than 1–2%); therefore, it was not considered here. Dominant pore types were identified based on petrographic analysis of thin sections. Porosity was obtained using helium porosimeter for all samples included in this study. The consistency in terms of measurement conditions (e.g., dry samples, pressure conditions) and techniques (same ultrasonic, porosity, and XRD methods) can ensure minimizing any associated uncertainty or artifacts imposed on the analysis. The above data was collected from published datasets and experiments carried out on rocks from various localities worldwide as summarized in Table 1. The data was acquired from the raw tables provided by the published references without filtering or processing. The dataset also covers a wide range of porosity (0–50%), Vp (2300–6800 m/s), and mineralogy (calcite, dolomite, and mixed carbonate–siliciclastic). The dataset is characterized by heterogeneous textures and pore types as highlighted in Table 1. For dolostones, the data includes both fabric-preserving (FP) and non-fabric-preserving (NFP) rocks since their petroacoustic signature (Vp-φ) can be different, as suggested by Salih et al. [21]. In FP dolostones, the original fabric and microstructure (e.g., grain boundaries, pore size, and geometry) of the precursor limestone is clearly recognized and preserved. In contrast, the original fabric is completely destroyed and replaced by a micro-intercrystalline dolomite phase in NFP dolostones. The compiled dataset can help to achieve this study’s objective in comparing the effect of mineralogy versus pore geometry on acoustic velocity of carbonates. It can provide important insights on the most significant controlling factor and whether different carbonate lithologies can be differentiated on the basis of their petroacoustic response. We constructed the Vp-φ cross plots and compared the trends between limestones and dolostones as well as between limestones and mixed carbonate–siliciclastic rocks, considering the variable pore types in the analysis. The qualitative interpretation of the Vp-φ cross plots was complemented by quantitative analysis through rock-physics modeling which was performed using the Differential Effective Medium theory (DEM), as explained in the next section.

Table 1.
Brief description of the mineralogy and pore types of the datasets used in this study.
2.2. Differential Effective Medium (DEM) Modeling
There are many rock-physics modeling theories, among which Differential Effective Medium (DEM) theory is well known for its potential in carbonates [18,25,31,32,33,34,35]. A very important aspect of DEM is incorporating the impact of both mineralogy and pore geometry on the effective elastic moduli of the rock, which made the model very suitable for this study. In DEM, the medium is represented by a host background matrix and inclusions (pores in this case). The effective bulk and shear modulus (K* and G*, respectively) of such two-phase composite are expressed as functions of the following parameters [3]:
- The host mineral bulk and shear modulus (Kh and Gh, respectively);
- The inclusion bulk and shear modulus (Ki and Gi, respectively);
- The volumetric fraction of the inclusions (i.e., porosity, φ);
- The equivalent pore aspect ratio (EPAR).
The last parameter above (EPAR) represents the smallest to the largest lengths ratio for an oblate ellipsoidal inclusion [3], which, when used in DEM formulations, results in effective elastic moduli that are equivalent to those of the actual rock at a given mineralogy and porosity [3,18,31]. EPAR has been used by many studies to incorporate the impact of pore geometry on the elastic response of carbonates, e.g. Refs [18,21,32,33,34,35]. The value of EPAR = 1 represents a spherical inclusion/pore, while a very small value (EPAR << 0.1) corresponds to a flat pore (such as a fracture or crack along the crystal faces, for example). The higher the value of EPAR, the higher the Ki and Gi, which results in higher K* and G* at any given porosity. It is important to mention that EPAR is only a simplified mathematical consideration for pore geometry that does not mean having, in reality, actual ellipsoidal pores with the specified aspect ratio. It is only an “equivalent” aspect ratio from an elastic behavior point of view (i.e., it gives same elastic moduli as the measured one for the actual rock sample). Despite this simplification, EPAR is a very powerful tool for incorporating the impact of pore geometry on velocity, as the relative EPAR values carry information about pore types [18,21,32]. For example, moldic and vuggy dominant pores are more rounded (relatively higher EAPR) than interparticle and micro-porosity (or micro-cracks).
The following system of equations describes the relationship between K*, G*, and the input parameters Kh, Gh, Ki, Gi, and φ [3]:
At φ = 0, we obtain and , which correspond to the mineral elastic moduli as per Table 2. In the case of mixed mineralogy, the effective mineral moduli are obtained using the Voigt–Reuss–Hill average [3]. In the equations above, and are geometric coefficients that can be calculated for an ellipsoidal inclusion characterized by a specific EPAR. The details of the formulations to calculate these two parameters can be found in other references [3,31].
Table 2.
Density and elastic moduli for the pure minerals: calcite, dolomite, and quartz; values are obtained from [3].
The K* and G* obtained from DEM can then be used to calculate the compressional and shear wave velocity by the following equations:
where is the rock bulk density, and it can be calculated from the following:
In Equation (5), and correspond to the mineral density of the solid and fluid (air, in this case), respectively. The DEM theory was used to examine the variability of velocity as a function of porosity by establishing Vp-φ curves for different mineralogies (calcite versus dolomite and quartz, for example) and pore geometries (i.e., variable EPAR). The aim here is to model the experimental data from the global dataset (Table 1) to examine which factor (mineralogy or pore geometry) contributes more to the variability observed. For example, if we observe differences in Vp at any given porosity between dolostone and limestone, and if we could model such differences using the same EPAR in DEM for both lithologies, then mineralogy alone can explain the velocity variations. Nevertheless, if different EPAR values are needed to explain the velocity variation between the two lithologies, then pore geometry can be more significant than mineralogy. To obtain the best fit of EPAR for each lithology/mineralogy, a grid search was used based on DEM formulations (through a MATLAB code) to find the EPAR value that minimizes the global mean absolute error between the predicted and measured Vp of all data points within a specific lithology/mineralogy. The EPAR step size used in the grid search was 0.01, and the obtained best-fit EPAR was then used in DEM to plot the Vp-φ trajectories on top of the experimental data, as will be displayed in the Results section. The mean absolute error (MAE) and coefficient of determination (R2) are also reported in Section 3.
3. Results
3.1. Limestone-Dolostone Comparison
Figure 1 shows the relationship between Vp and porosity for limestone and dolostone samples from various literature sources. Several observations can be noted from the Figure. Firstly, the Vp-φ relationship for both fabric- and non-fabric-preserving dolostones (red and green data points in Figure 1) overlap at low porosity range (<10%), and they both plot above the limestone data (in gray). Secondly, while the fabric-preserving (FP) dolostone continues to show higher Vp than limestones at higher porosities, the non-fabric-preserving (NFP) dolostone data started to overlap with that of limestones at porosity above 20% (Figure 1). This indicates comparable velocities between NFP dolostones and limestones at high porosity range. The scatter in Vp-φ relationship observed for the dolostone or limestone dataset might be explained by the variability of pore geometry within each lithology as highlighted by earlier studies [7,13,27,28,29,30,31,32,36].
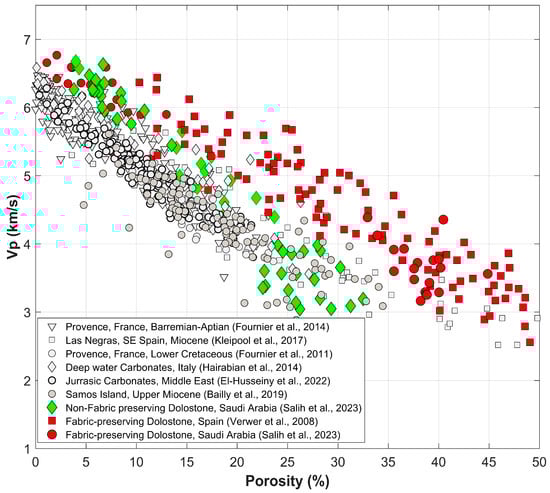
Figure 1.
Vp–porosity relationship for various carbonate datasets [15,17,21,26,27,28,29,30]. The data points for limestone rocks are shown in gray, while the dolostones are shown in green and red for non-fabric-preserving and fabric-preserving dolostones, respectively. While an overall inverse relationship between velocity and porosity exists, there is a noticeable scatter in the cross plot.
Despite the scatter in the Vp-φ relationship, there is an overall petroacoustic trend for each lithology as highlighted when grouping data from different sources for the same lithology (Figure 2). The results clearly show two distinct trends for FP versus NFP dolostones in comparison with limestones. Therefore, we separated the two different dolostone textures during DEM modeling and analysis. Figure 2a shows the same limestone and NFP dolostone data as in Figure 1 but with DEM modeling results. In this Figure, the DEM result for pure calcite with an average EPAR of 0.15 (solid black curve) represents the best overall fit for the combined limestone data (gray circles). Table 3 summarizes the best-fitting DEM-derived EPAR values for each lithology and the corresponding MAE and R2. The dashed blue curve in Figure 2a refers to the same EPAR value of 0.15 but for pure dolomite mineralogy. While such a curve seems to be consistent with some NFP dolostone data at low porosity, it clearly overestimates the velocity for NFP dolostones at higher porosities (>20%). An average EPAR of 0.11 shows a better fit for these NFP dolostones (green curve, Figure 2a). Regarding the DEM results for fabric-preserving (FP) dolostones, an average EPAR of 0.2 produces the best fit for the data, especially at porosity above 10% (Figure 2b). Unlike NFP dolostones, using the same EPAR of 0.15 results in overall underestimation (rather than overestimation) of velocity for the porous FP dolostones (porosity > 10%), as shown in Figure 2b. Particularly, 94% of such porous FP dolostone datapoints plots above the dashed blue curve (EPAR = 0.15), indicating higher aspect ratio pores. The average best-fit EPAR for the porous FP dolostone is 0.2 (red solid curve). It is very evident that the discrepancy between the dashed blue curve (mineralogy effect alone) and the solid red curve (combined mineralogy and pore geometry variations) increases as the porosity increases (Figure 2b). In this case, mineralogy alone can explain less than 50% of the velocity variations between the limestones (black curve) and FP dolostone (red curve) at porosities above 20%.
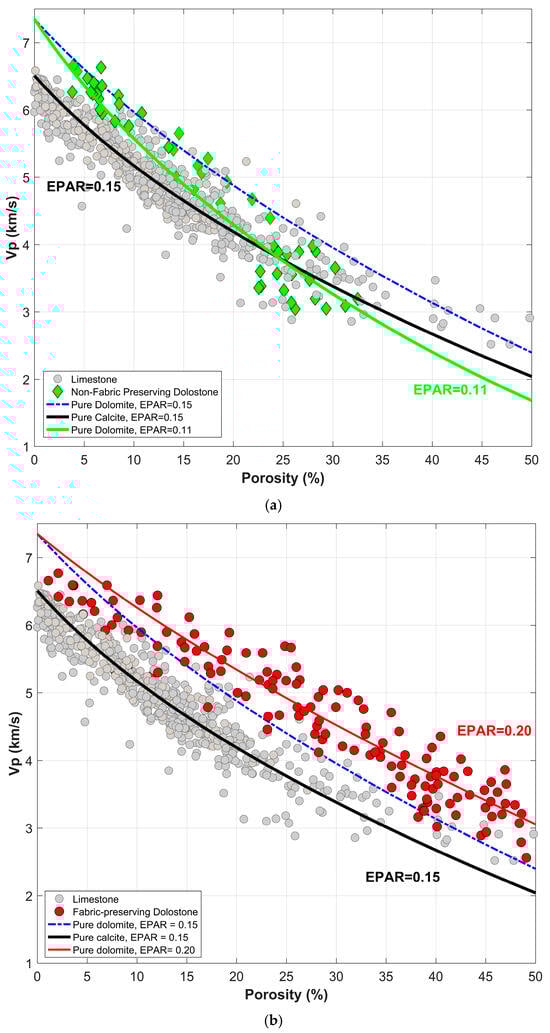
Figure 2.
Vp–porosity relationship for various carbonate datasets (experimental data in circles) along with DEM modeling results (curves). The data here is the same as the one shown in Figure 1 but grouped based on lithology (e.g., all limestones are grouped together): (a) comparison between the limestones and non-fabric-preserving dolostones; (b) comparison between the limestones and fabric-preserving dolostones. The black curve shows the DEM modeling results using pure calcite mineralogy and EPAR = 0.15 (black solid curve; best fit for limestones). The blue dashed curve corresponds to the DEM results using EPAR = 0.15 too but for pure dolomite mineralogy. The solid green and red curves are the best-fit DEM results for non-fabric-preserving and fabric-preserving dolostones, respectively.
Table 3.
Summary of the DEM-derived best-fit average EPAR values for the different lithologies.
Based on the above, one important observation is that mineralogy impact decreases as the porosity increases. That is, mineralogy variations contribute to velocity variations mainly in tight rocks. To better demonstrate this point, the MAE was calculated for the dolostone data above and below 10% porosity, assuming the mineralogy effect only (same EPAR of 0.15 as calcite without adjusting EPAR). The choice of 0–10% porosity to define tight rocks is selected here only for the purpose of demonstration. The MAE for dolostones above 10% porosity was found to be 603 m/s, while it was much lower (i.e., 161 m/s) for dolostones below 10% porosity. Supporting the same argument, adjusting the EPAR reduced the MAE further by only 30 m/s for tight dolostone (porosity < 10%) but by more than 300 m/s for the dolostones above 10% porosity. This shows that the mineralogy effect is more dominant in tight rocks (0–10% porosity for example), as it can largely explain the velocity variability in that tight porosity range. In contrast, adjusting the EPAR is required to reduce the error significantly for a higher porosity range. Ignoring the impact of pore geometry in such porous dolostones can result in increasing the MAE by around 100% (i.e., from 297 to 603 m/s).
3.2. Limestone-Siliciclastic Comparison
Figure 3 shows the relationship between Vp and porosity for mixed carbonate–siliciclastic rocks. Data is color-coded by the carbonate fraction (mainly calcite) while the siliciclastic fraction is mainly represented by quartz (i.e., samples had very minor negligible clay content as per [25,32]). It is evident from the Figure that carbonate-rich samples are characterized by higher Vp at any given porosity compared to samples with a higher siliciclastic fraction. This trend is consistent for the entire porosity range (Figure 3).
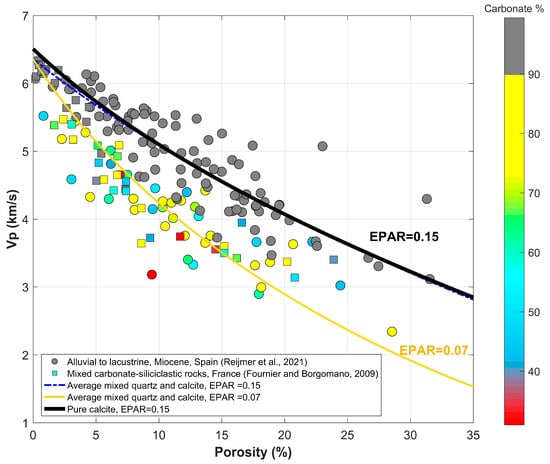
Figure 3.
Vp–porosity relationship for mixed carbonate–siliciclastic datasets [25,32] along with DEM modeling results. The gray data points refer to the carbonate-rich (mainly calcite) samples with best-fit DEM results when EPAR is 0.15. On the other hand, the colorful data points are for samples characterized by quartz content above 10% with the best-fit DEM results (orange curve) using EPAR = 0.07. The blue dashed curve is for mixed mineralogy (same mineralogy as for orange curve) but with EPAR = 0.15. The Figure shows clearly that variations in velocity between the different lithologies can be explained by associated variations in EPAR rather than mineralogy.
The DEM results in Figure 3 clearly show that the mineralogy effect cannot explain the scatter in the Vp-φ relationship. Samples were divided into two groups: (a) carbonate-rich samples with more than 90% calcite, and (b) samples with less than 90% calcite (with variable quartz percentage). The average quartz percentage in the second group was found to be 30%. Consequently, the Voigt–Reuss–Hill average was used to calculate the elastic moduli and Vp at zero porosity for calcite–quartz mixtures with relative percentages of 70–30%, respectively. It is evident that the increased quartz content resulted in a minor drop in Vp at only low porosity (dashed blue curve in Figure 3) in comparison with the carbonate-rich samples (solid black curve) when using the same EPAR. The two curves are almost matching at porosities above 5%, indicating that mineralogy cannot explain any velocity variation at such a porosity range. Reproducing the overall Vp-φ trend for the mixed calcite–quartz mineralogy requires an average EPAR of 0.07, which is less than half of that for calcite-rich samples.
4. Discussion
4.1. Pore Geometry Versus Mineralogy Control on Acoustic Velocity
The results shown in Figure 2 and Figure 3 show that mineralogy might explain velocity variations only at low porosity ranges, especially for the limestone–dolostone systems. In this range, the velocity in dolostone is higher than limestone, while increasing siliciclastic inputs show the least velocity. Such an order (dolomite > calcite > quartz) is consistent with the mineral moduli and Vp for these lithologies, as reported in Table 2. Nevertheless, the velocity–porosity relationship is more complex at higher porosity where mineralogy cannot explain the velocity variation, suggesting that pore geometry is the dominating factor. This is supported by several observations, as detailed in the following discussion. The first observation is that velocity for a given mineralogy (pure calcite or pure dolomite for example) can vary by up to 2000 m/s at a given porosity (Figure 1). Despite having an overall dominant EPAR of 0.15 (Figure 2 and Figure 3), limestones show noticeable scatter around the best-fit DEM results (MAE = 307 m/s as per Table 1), and this is attributed to the variations in pore geometry as highlighted by many studies [22,23,24,25,26,27,28,29,30,31,32,33,34,35,36]. Same applies to dolostone where the dolomitization texture (fabric- versus non-fabric-preserving) plays a significant role in controlling the resultant pore geometry and, consequently, the resultant velocity–porosity trajectory. In this case, fabric-preserving dolostones are characterized by a higher velocity than the non-fabric-preserving dolostones due to the softer pore structure of the latter (i.e., micro-intercrystalline), as highlighted by [21]. Overall, the MAE is high (i.e., 307–530 m/s) when using a single average EPAR value approach for any given lithology, which suggests the significance of heterogeneous pore geometry in controlling velocity variations within the same lithology/mineralogy.
The second observation that supports the dominant pore geometry effect on velocity is related to the Vp-φ results obtained for different lithologies. For example, carbonate rocks characterized by siliciclastic fractions showed lower velocity at any given porosity compared to their carbonate-rich counterpart (Figure 3). The best-fit EPAR for the limestones is 0.15, but if we use the same EPAR for siliceous limestone (using the mineral moduli for quartz–calcite mixtures but without readjusting EPAR), we obtain the dashed blue curve in Figure 3. This curve is almost identical to the black curve (best fit for limestones) and very far from the best-fit curve for siliceous limestone (which means mineralogy alone cannot explain any drop in velocity). The Vp-φ for the mixed carbonate–siliciclastic samples required the EPAR to be lowered by more than 50% compared to the limestone rocks (Figure 3). That is, the noticeable drop in the velocity of the siliceous carbonate samples is likely due to the associated change in pore geometry (rather than mineralogy itself), resulting in softer pore structure compared to the limestone samples at any given porosity. In general, the higher siliciclastic input may increase the fraction of clay and intergranular porosity (while decreasing the fraction of stiffer secondary pores). This is because quartz is more resistive toward chemical and physical alteration compared to carbonates [37,38,39,40], which reduces the impact of dissolution, for example, in creating secondary pores. Consequently, the EPAR decreases as the siliciclastic fraction increases. Figure 4 shows petrographic evidence from thin sections of siliceous carbonates, highlighting the lack of moldic/vuggy secondary porosity in the silica-rich zones compared to limestones from the same geological formation [31].
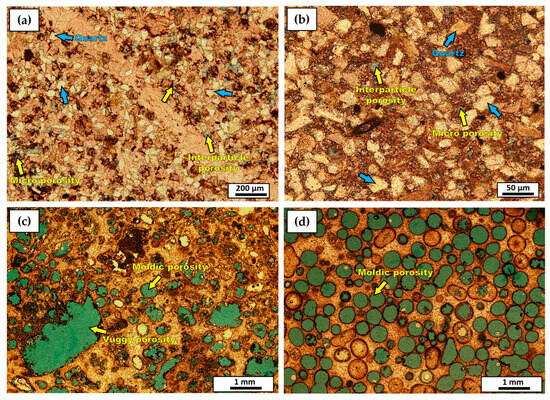
Figure 4.
Thin section images for samples from Salih et al. [31]: (a,b) siliceous limestones, where blue arrows refer to quartz particles; (c,d) pure limestones characterized by secondary pores. The yellow arrows refer to the different dominant pore types encountered in these rocks, which belong to the same geological formation. Samples in the upper row (a,b) come from the silica-rich zone within the formation, while samples (c,d) belong to the pure limestone zone [31].
In examining the results for limestones and dolostones at porosities above 10% (Figure 1), dolostones can show higher, similar or lower velocity compared to limestones at any given porosity. The DEM results show that pore geometry (represented by EPAR) can explain such variability. For example, non-fabric-preserving (NFP) dolostones with an average EPAR of 0.11 (lower than that of limestones) can still show higher velocity than limestones at lower porosity because the fraction of pores is still low (so the mineralogy effect overcomes the impact of lower EPAR). Nevertheless, this trend is reversed at higher porosity due to the increasing contribution of pores, resulting in lower velocity for NFP dolostones compared to limestones. The lower EPAR for NFP dolostones can be explained by dominant soft micro-intercrytalline porosity (Table 1) compared to limestones, which are typically characterized by higher EPAR macro interparticle and intraparticle/moldic pores that are typically developed in high-porosity limestones [7,13,28,29,30,31,36].
The results for FP dolostones also support the more significant impact of pore geometry compared to minerology (Figure 2b). Unlike NFP dolostones, FP dolostones have similar pore geometry as the original limestones before dolomitization. In this case, the FP dolostones are characterized by framework, moldic, and interparticle porosity (Table 1), resulting in consistently higher velocity at any given porosity compared to the limestone datasets (Figure 1). This is, however, a general trend that can be complicated by wide variability in pore types. For example, limestones with very developed spherical pores might demonstrate higher velocity than even the FP dolostones shown here. To illustrate this point, Figure 5 shows the same FP data as in Figure 2 but in comparison with two different limestones rock types, from Salih et al. [31], characterized by dominant (1) micro-porosity (Figure 5B) and (2) spherical moldic porosity (Figure 5C). While the micro-porosity-dominant limestones showed lower velocity compared to FP dolostones, the moldic-porosity-dominant limestones have comparable and even higher velocity than FP dolostones at a similar porosity range. Such observations can be explained by the pore geometry as suggested by the petrographic analysis, where pores in limestone sample C are more rounded (higher aspect ratio) than pores from the FP dolostone sample D (Figure 5), as an example. The DEM modeling results are also consistent with the petrographic analysis of sample B, which has lower EPAR value compared to FP dolostone sample D.
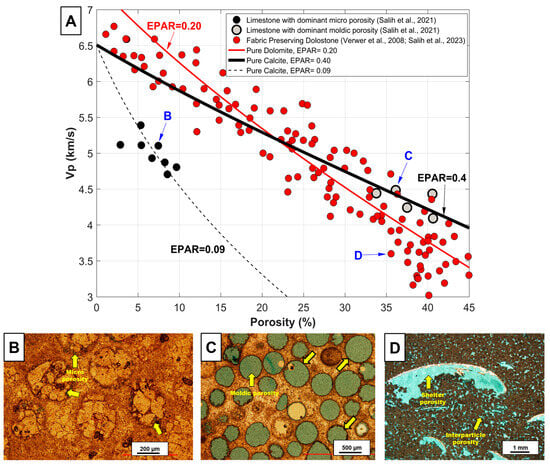
Figure 5.
(A) Vp–porosity relationship for FP dolostones from [15,21] (red circles) and two different limestone rock types (from Salih et al. [21,31], respectively) characterized by micro-porosity (black circles) and round moldic porosity (gray circles). The curves correspond to DEM modeling results with the corresponding EPAR values. The lower subfigures (B–D) show the thin section images for the samples, highlighted by blue text, and arrows in the upper cross plot. The yellow arrows in subfigures (B–D) highlight the dominant pore types in the samples. Thin section images are obtained and modified after Salih et al. [21,31].
It is important to mention here that the thin section observations about pore types support the DEM-derived EPAR values in a relative sense (not absolute). That is, sample C has the most spherical/rounded dominant pores and, consequently, has the highest EPAR value relative to the other three samples in Figure 5. This is followed by sample D, which is characterized by macro interparticle and shelter pores that are less rounded than moldic pores but more rounded than micro-pores. The latter are mainly flat pores with very low aspect ratios along grain contacts (thus having the least EPAR). It should be noted that perfect match between aspect ratio values observed for dominant macro-pores from thin sections and those derived from DEM is not expected since some fraction of porosity is below the image resolution (i.e., micro-pores which have low aspect ratio) as also highlighted by [18]. Such unresolved micro-pores or micro-cracks contribute to reducing the overall sample elastic moduli, and thus the effective EPAR is frequently less than the aspect ratio observed for macro-pores from thin sections [18]. As mentioned earlier, DEM-derived EAPR is only an “equivalent” aspect ratio that results in the same elastic moduli as the actual rock (see explanation in Section 2.2). It is worth mentioning that a single EPAR value is a simplifying consideration for the actual pore system, which is frequently characterized by multiple pore geometries (combination of both micro- and moldic porosity, for example). In this case, a single EPAR does not imply a single pore geometry but rather represents an effective value that is a weighted average [18,26] reflecting the proportion of the different pore geometries (and their corresponding pore stiffness, accordingly).
The DEM results can also be useful to determine the porosity value at which the pore geometry effect can overcome the impact of mineralogy. Comparing the solid red curve in Figure 5 (representing the overall Vp-φ for FP dolostones) with the solid black curve (corresponding to the overall Vp-φ for moldic limestones) shows that velocity for the moldic limestones exceeds that from the studied FP dolostones, starting from porosity of around 22%. At this porosity, the impact of EPAR (pore geometry) overturns the mineralogy effect. On the other hand, the micro-porosity-dominant limestone group (EPAR = 0.09) has a consistently lower velocity than FP dolostones, regardless of the porosity range. It should be reasonable, then, to imply that it is more difficult to separate rock type C from FP dolostones based on the petroacoustic signature (Vp-φ). On the other hand, rock type B has a very distinct petroacoustic signature that can be used to differentiate it from FP dolostones.
The significant impact of pore geometry on the macroscopic elastic moduli and velocity of rocks can be explained by the different pore stiffnesses associated with different pore geometries (low EPAR versus high EPAR). Pore stiffness defines how much the pore space resists deformation or volume change when an effective stress is applied [3]. Flat pores or micro-cracks (low EPAR) have low resistance to compression and shearing, especially when oriented perpendicular to the stress [3,40]. Stress concentration around such pores leads to magnification of the stress effect in the localized region of the crack tip [3,41]. This stress concentration increases as the pore aspect ratio decreases [41], which can lead to increased deformation or strain (i.e., lower bulk and shear modulus of the rock). In contrast, high EPAR geometries (such as spherical pores) have more uniform stress distribution around them [3,42] due to the lack of edges or tips, which results in more resistance to compressional and shearing stresses (i.e., higher pore stiffness).
It is worth mentioning that the results of this study agree with those reported by Weger et al. [22] regarding the more dominant impact of pore geometery compared to mineralogy. While [22] used limestone and dolostone data only, this current study confirms such a general conclusion when also incorporating mixed silisiclastic–carbonate rocks. Both the current study and [22] show that velocity within NFP dolostones can overalp with that from limestone due to the impact of pore geometery overturning the mineralogical effect. Nevertheless, there are some differences or additional observations from the current study especially related to the distinction betweeen NFP and FP dolostones. Specifically, the current study shows that FP dolostones, which were not considered in Weger et al. [22], are frequently characterized by a higher velocity than limestone and NFP dolostones. Unlike the NFP dolostones, which are charcterized by soft micro-intercrystalline porosity, the higher velocity of FP dolostones is due to preservation of the original pore geometery which is likely to contain stiff secondary pores, esepcially at high porosity range. The current study also clarifies that the relative influence of mineralogy versus pore gometery is a function of the porosity range (which was not established or considered by Weger et al. [22]). While mineralogy has limited impact at high porosity, the influence of mineralogy cannot be neglected for tight rocks (below porosity of 10%, for example, in the limestone–dolostone systems). That is, velocity variations within such a porosity range can be predominantly explained by the variation in minerals moduli.
4.2. Implications for Reservoir Characterization
The results of this study show that pore geometry is the most significant control on acoustic velocity within carbonates. This is the case for both dolostone–limestone and mixed siliciclastic–carbonate systems, especially at porosity above 10%. This suggests that pore geometry, rather than mineralogy, should be the basis for rock typing and for elastically differentiating between lithologies. Despite the scatter in the Vp-φ relationship within each individual lithology, there is an overall trend which is represented by an average characteristic EPAR value as estimated based on DEM modeling. The average EPAR values for each lithology from the studied global dataset are summarized in Table 3, as shown earlier. In the absence of clear pore geometry/type information, the petroacoustic trajectory obtained for the average EPAR can be used to obtain a rough estimate of porosity from velocity or impedance. For example, in intervals identified as NFP dolostone, using Gassmann fluid substitution and the DEM model with EPAR = 0.11 allows us to establish the impedance–porosity transform needed to estimate porosity from seismic impedance. It is important to note that knowledge about dominant pore geometry can assist the choice of proper EPAR values and, consequently, more accurate sonic- or seismic-based porosity estimation. This is particularly relevant to the porosity estimation in NFP dolostones, whose porosity is strongly correlated with velocity (highest R2 as per Table 3) due to the homogenous pore geometry (i.e., intercrystalline pore type only). This also means that other carbonate lithologies would require more pore geometry consideration before porosity estimation. Additionally, if well log data is available, the velocity–porosity relationship along with DEM modeling can be used to obtain the EPAR values that can help in rock or pore typing, which is closely linked with reservoir quality. Therefore, the petroacoustic signature can potentially be used as a tool in geo-steering to help well placement in the best reservoir quality interval. The above potential applications can be relevant to both hydrocarbon reservoirs and CO2 geological storage projects.
Despite the practical value of the DEM-derived Vp-φ trends reported here, simplified Vp-φ empirical formulas (best-fit exponential or linear forms) for each lithology can be beneficial for easier use in engineering applications. Table 4 summarizes these empirical best fits for each lithology.
Table 4.
Summary of the empirical best fit for the Vp-φ relationship of different lithologies.
This study relied on laboratory measurements conducted on dry core samples which do not consider the impact of fluid or field scale fractures (which are absent in core plugs). Future research can consider the use of well logs or seismic data (which were not available in this study) to confirm the petroacoustic signatures and conclusions reported here. Investigations using subsurface data can help to incorporate the impact of fluid and large-scale features such as fractures.
5. Conclusions
This study explored the impact of mineralogy and pore geometry on the acoustic velocity and the velocity–porosity relationship in carbonates. Global dataset from 10 different locations, covering a wide range of mineralogy (dolomite, calcite, and quartz) along with variable pore types, was used in this investigation. The analysis of the laboratory global dataset was supported by rock-physics modeling using DEM to incorporate and compare the impact of mineralogy versus pore geometry on velocity. The main outcome of this study is that pore geometry is much more significant than mineralogy in controlling the velocity variation at any given porosity. Specifically, the major conclusions of this study are listed below:
- The overall petroacoustic trends for the different lithologies (FP and NFP dolostone, limestones, siliceous carbonates) were established by reporting the average corresponding DEM-derived EPAR values (0.2, 0.11, 0.15, and 0.07, respectively) based on comprehensive datasets.
- The impact of mineralogy is limited to only tight rocks where dolostones show higher velocity values compared to limestones, while siliceous carbonates showed the least velocity. As porosity increases, the contribution of mineralogy diminishes while the influence of pore geometry variation dominates. Ignoring the pore geometry impact (fitting data with mineral moduli only without adjusting EPAR) can increase the MAE by 100% (exceeding 400 m/s in magnitude) for porous rocks.
- At high porosity, FP dolostones consistently show relatively higher velocity than limestones, while NFP dolostones show comparable or even lower velocity than limestone at a given porosity. These observations were attributed to the pore geometry of these lithologies where NFP dolostones are characterized by micro-intercrystalline soft pores in comparison with more developed stiff secondary macro-pores in limestones (and, consequently, in the FP dolostones, where such pores were preserved).
- The results also show that mineralogy has almost zero contribution to the lower velocity of siliceous carbonates in comparison with limestones. The variations in velocity in the siliciclastic–carbonate systems can only be attributed to the decrease in pore aspect ratio, by about 50% in comparison with limestones, which is associated with the increase in the non-carbonate (i.e., quartz) component.
The outcome of this study can inform quantitative sonic and seismic interpretations in carbonates for hydrocarbon reservoirs and CO2 storage applications.
Funding
This research received no external funding.
Data Availability Statement
The data used in this study are all reported in the cited references as per Table 1.
Acknowledgments
The author would like to thank the College of Petroleum Engineering and Geosciences at King Fahd University of Petroleum and Minerals (KFUPM) for supporting the work. Moaz Salih from KFUPM is also acknowledged for his help in providing the thin sections images.
Conflicts of Interest
The author declares no conflicts of interest.
Abbreviations
The following abbreviations are used in this manuscript:
| DEM | Differential Effective Medium |
| EPAR | Equivalent Pore Aspect Ratio |
| FP | Fabric Preserving |
| NFP | Non-Fabric Preserving |
| MAE | Mean Absolute Error |
References
- Palaz, I.; Marfurt, K.J. (Eds.) Carbonate Seismology: An Overview. In Carbonate Seismology; Society of Exploration Geophysicists: Tulsa, OK, USA, 1997; pp. 1–7. [Google Scholar]
- Orivri, U.D.; Chanda, P.; Johnson, L.; Koehn, L.W.; Pollyea, R.M. Opportunities and challenges for geologic CO2 sequestration in carbonate reservoirs: A review. Intern. J. Greenhouse Gas Cont. 2025, 142, 104342. [Google Scholar] [CrossRef]
- Mavko, G.; Mukerji, T.; Dvorkin, J. The Rock Physics Handbook: Tools for Seismic Analysis in Porous Media, 2nd ed.; Cambridge University Press: Cambridge, UK, 2009; Volume 2. [Google Scholar]
- Dvorkin, J.; Gutierrez, M.A.; Grana, D. Seismic Reflections of Rock Properties; Cambridge University Press: Cambridge, UK, 2014. [Google Scholar]
- Fournier, F.; Borgomano, J. Geological significance of seismic reflections and imaging of the reservoir architecture in the Malampaya gas field (Philippines). AAPG Bull. 2007, 91, 235–258. [Google Scholar] [CrossRef]
- Regnet, J.; David, C.; Robion, P.; Menéndez, B. Microstructures and physical properties in carbonate rocks: A comprehensive review. Mar. Pet. Geol. 2019, 103, 366–376. [Google Scholar] [CrossRef]
- Weger, R.J.; Eberli, G.P.; Baechle, G.T.; Massaferro, J.L.; Sun, Y.-F. Quantification of pore structure and its effect on sonic velocity and permeability in carbonates. AAPG Bull. 2009, 93, 1297–1317. [Google Scholar] [CrossRef]
- Sun, P.; Xu, H.; Dou, Q.; Adesokan, H.; Sun, Y.; Huang, Q.; Jiang, N. Investigation of pore-type heterogeneity and its inherent genetic mechanisms in deeply buried carbonate reservoirs based on some analytical methods of rock physics. J. Nat. Gas Sci. Eng. 2015, 27, 385–398. [Google Scholar] [CrossRef]
- Sharifi, H. Multi-pore rock physics model: An intelligent approach for carbonate rocks. J Petrol. Sci. Eng. 2022, 218, 111002. [Google Scholar] [CrossRef]
- Pan, J.G.; Deng, J.X.; Li, C.; Wang, H.B.; Zhang, H.Q.; Zhao, J.G.; Tang, G. Effects of micrite microtextures on the elastic and petrophysical properties of carbonate reservoirs. Appl. Geophys. 2019, 16, 399–413. [Google Scholar] [CrossRef]
- Jaballah, J.; Reijmer, J.J.G.; El-Husseiny, A.; Le Goff, J.; Hairabian, A.; Slootman, A. Physical properties of Cretaceous to Eocene platform-to-basin carbonates from Albania. Mar. Pet. Geol. 2021, 128, 105022. [Google Scholar] [CrossRef]
- Salih, M.; Reijmer, J.J.G.; El Husseiny, A.; Bashri, M.; Eltom, H.; Mukainah, H.A.; Kaminski, M.A. Controlling Factors on Petrophysical and Acoustic Properties of Bioturbated Carbonates: (Upper Jurassic, Central Saudi Arabia). Appl. Sci. 2021, 11, 5019. [Google Scholar] [CrossRef]
- Eberli, G.P.; Baechle, G.T.; Anselmetti, F.S.; Incze, M.L. Factors controlling elastic properties in carbonate sediments and rocks. Lead. Edge 2003, 22, 654–660. [Google Scholar] [CrossRef]
- Wilkens, R.; Simmons, G.; Caruso, L. The ratio Vp/Vs as a discriminant of composition for siliceous limestones. Geophysics 1984, 49, 1850–1860. [Google Scholar] [CrossRef]
- Verwer, K.; Braaksma, H.; Kenter, J.A. Acoustic properties of carbonates: Effects of rock texture and implications for fluid substitution. Geophysics 2008, 73, B51–B65. [Google Scholar] [CrossRef]
- Kenter, J.A.M.; Podladchikov, F.F.; Reinders, M.; Van der Gaast, S.J.; Fouke, B.W.; Sonnenfeld, M.D. Parameters controlling sonic velocities in a mixed carbonate-siliciclastics Permian shelf-margin (upper San Andres formation, Last Chance Canyon, New Mexico). Geophysics 1997, 62, 505–520. [Google Scholar] [CrossRef]
- Fournier, F.; Leonide, P.; Biscarrat, K.; Gallois, A.; Borgomano, J.; Foubert, A. Elastic properties of microporous cemented grainstones. Geophysics 2011, 76, E211–E226. [Google Scholar] [CrossRef]
- Fournier, F.; Pellerin, M.; Villeneuve, Q.; Teillet, T.; Hong, F.; Poli, E.; Borgomano, J.; Léonide, P.; Hairabian, A. The equivalent pore aspect ratio as a tool for pore type prediction in carbonate reservoirs. AAPG Bull. 2018, 102, 1343–1377. [Google Scholar] [CrossRef]
- Baechle, G.T.; Colpaert, A.; Eberli, G.P.; Weger, R.J. Effects of microporosity on sonic velocity in carbonate rocks. Lead. Edge 2008, 27, 1012–1018. [Google Scholar] [CrossRef]
- Sharma, R.; Prasad, M.; Batzle, M.; Vega, S. Sensitivity of flow and elastic properties to fabric heterogeneity in carbonates. Geophys. Prospect. 2013, 61, 270–286. [Google Scholar] [CrossRef]
- Salih, M.; El-Husseiny, A.; Reijmer, J.J.G.; Eltom, H.; Abdelkarim, A. Factors controlling sonic velocity in dolostones. Mar. Petrol. Geol. 2023, 147, 105954. [Google Scholar] [CrossRef]
- Weger, R.J.; Baechle, G.T.; Shen, S.; Eberli, G.P. Significance of Sonic Velocities in Limestones and Dolostones: A Comprehensive Study Revealing Limited Impact of Mineralogy. Minerals 2024, 14, 509. [Google Scholar] [CrossRef]
- Kleipool, L.M.; Reijmer, J.J.G.; Bádenas, B.; Aurell, M. Variations in petrophysical properties along a mixed siliciclastic carbonate ramp (Upper Jurassic, Ricla, NE Spain). Mar. Petrol. Geol. 2015, 68, 158–177. [Google Scholar] [CrossRef]
- Jafarian, E.; Kleipool, L.M.; Scheibner, C.; Blomeier, D.P.G.; Reijmer, J.J.G. Variations in petrophysical properties of Upper Palaeozoic mixed carbonate and non-carbonate deposits, Spitsbergen, Svalbard Archipelago. J. Petrol. Geol. 2017, 40, 59–83. [Google Scholar] [CrossRef]
- Reijmer, J.J.G.; Blok, C.N.; El-Husseiny, A.; Kleipool, L.M.; Hogendorp, Y.C.K.; Alonso-Zarza, A.M. Petrophysics and sediment variability in a mixed alluvial to lacustrine carbonate system (Miocene, Madrid Basin, Central Spain). Depos. Record 2021, 8, 317–339. [Google Scholar] [CrossRef]
- Fournier, F.; Léonide, P.; Kleipool, L.; Toullec, R.; Reijmer, J.J.G.; Borgomano, J.; Klootwijk, T.; van der Molen, J. Pore space evolution and elastic properties of platform carbonates (Urgonian limestone, Barremian-Aptian, SE France). Sediment. Geol. 2014, 308, 1–17. [Google Scholar] [CrossRef]
- Kleipool, L.M.; de Jong, K.; de Vaal, E.L.; Reijmer, J.J.G. Seismic characterization of switching platform geometries and dominant carbonate producers (Miocene, Las Negras, Spain). Sedimentology 2017, 64, 1676–1707. [Google Scholar] [CrossRef]
- Hairabian, A.; Fournier, F.; Borgomano, J.; Nardon, S. Depositional facies, pore types and elastic properties of deep-water gravity flow carbonates. J. Petrol. Geol. 2014, 37, 231–250. [Google Scholar] [CrossRef]
- El-Husseiny, H.; Al-Garadi, K.; Ali, A. Can laboratory ultrasonic measurements on core plugs reproduce results obtained from sonic well logging in carbonates? J. Appl. Geophy. 2022, 204, 104745. [Google Scholar] [CrossRef]
- Bailly, C.; Adelinet, M.; Hamon, Y.; Fortin, J. Combined controls of sedimentology and diagenesis on seismic properties in lacustrine and palustrine carbonates (Upper Miocene, Samos Island, Greece). Geophy. J. Int. 2019, 219, 1300–1315. [Google Scholar] [CrossRef]
- Salih, M.; Reijmer, J.J.G.; El-Husseiny, A. Diagenetic controls on the elastic velocity of the early Triassic Upper Khartam Member (Khuff Formation, central Saudi Arabia). Mar. Pet. Geol. 2021, 124, 104823. [Google Scholar] [CrossRef]
- Fournier, F.; Borgomano, J. Critical porosity and elastic properties of microporous mixed carbonate-siliciclastic rocks. Geophysics 2009, 74, 93–109. [Google Scholar] [CrossRef]
- Xu, S.; Payne, M.A. Modeling elastic properties in carbonate rocks. Lead. Edge 2009, 28, 66–74. [Google Scholar] [CrossRef]
- El-Husseiny, A.; Eltom, H.; Alqubalee, A.; Abdlmutalib, A.; Al-Mukainah, H.; Syahputra, R. Distinct Petroacoustic Signature of Burrow-Related Carbonate Reservoirs: Outcrop Analog Study, Hanifa Formation, Central Saudi Arabia. Nat. Resour. Res. 2022, 31, 2673–2698. [Google Scholar] [CrossRef]
- Queiroz, L.E.; Grana, D.; Fernandes, C.P.; Mukerji, T.; de Figueiredo, L.P.; Mantovani, I.F. Estimation of Equivalent Pore Aspect Ratio in Rock Physics Models and Validation Using Digital Rocks. Geosciences 2025, 15, 67. [Google Scholar] [CrossRef]
- Soete, J.; Kleipool, L.M.; Claes, H.; Claes, S.; Hamaekers, H.; Kele, S.; Özkul, M.; Foubert, A.; Reijmer, J.J.G.; Swennen, R. Acoustic properties in travertines and their relation to porosity and pore types. Mar. Petrol. Geol. 2015, 59, 320–335. [Google Scholar] [CrossRef]
- Earle, S. Physical Geology, 2nd ed.; BCcampus: Victoria, UK, 2019; Available online: https://opentextbc.ca/physicalgeology2ed/ (accessed on 30 November 2025).
- Zhang, P.; Tang, S.; Lin, D.; Chen, Y.; Wang, X.; Liu, Z.; Han, F.; Lv, P.; Yang, Z.; Guan, X.; et al. Diagenesis and Diagenetic Mineral Control on Reservoir Quality of Tight Sandstones in the Permian He8 Member, Southern Ningwu Basin. Processes 2023, 11, 2374. [Google Scholar] [CrossRef]
- Lucia, F.J. Carbonate Reservoir Characterization; Springer: Berlin/Heidelberg, Germany, 2007; p. 341. [Google Scholar] [CrossRef]
- Enayati-Bidgoli, A.; Saemi, E. Effects of late diagenesis on primary reservoir quality of a quartz arenite unit: A case study from the lower Cretaceous successions of SW Iran. Pet. Sci. 2019, 16, 267–284. [Google Scholar] [CrossRef]
- Cerney, B.; Carlson, R. The effect of cracks on the seismic velocities of basalt from site 990, southeast Greenland margin. In Proceedings of the Ocean Drilling Program, Scientific Results; Larsen, H.C., Duncan, R.A., Allan, J.F., Brooks, K., Eds.; Ocean Drilling Program: College Station, TX, USA, 1999; Volume 163, pp. 29–35. [Google Scholar]
- Davis, T.; Healy, D.; Bubeck, A.; Walker, R. Stress concentrations around voids in three dimensions: The root of failure. J. Struct. Geol. 2017, 102, 193–207. [Google Scholar] [CrossRef]
Disclaimer/Publisher’s Note: The statements, opinions and data contained in all publications are solely those of the individual author(s) and contributor(s) and not of MDPI and/or the editor(s). MDPI and/or the editor(s) disclaim responsibility for any injury to people or property resulting from any ideas, methods, instructions or products referred to in the content. |
© 2025 by the author. Licensee MDPI, Basel, Switzerland. This article is an open access article distributed under the terms and conditions of the Creative Commons Attribution (CC BY) license (https://creativecommons.org/licenses/by/4.0/).