Abstract
Accurate fault risk assessment is essential for maintaining wind turbine reliability. Traditional failure modes and effects analysis (FMEA)-based approaches struggle to handle the fuzziness, uncertainty, and conflicting nature of multi-criteria evaluations, which may lead to delayed fault detection and increased maintenance risks. To address these limitations, this paper proposes an enhanced risk assessment framework that integrates subjective-objective weighting and fuzzy decision-making. First, a combined subjective–objective weighting (CSOW) model with adaptive fusion is developed by integrating the analytic hierarchy process (AHP) and the entropy weight method (EWM). The CSOW model optimizes the weighting of severity (S), occurrence (O), and detection (D) indicators by balancing expert knowledge and data-driven information. Second, a fuzzy decision-making model based on interval-valued intuitionistic fuzzy numbers and VIKOR (IVIFN-VIKOR) is established to represent expert evaluations and determine risk rankings. Notably, the overlap rate between the top 10 failure modes identified by the proposed method and a fault-tree-based Monte Carlo simulation incorporating mean time between failures (MTBF) and mean time to repair (MTTR) reaches 90%, substantially higher than other methods. This confirms the superior performance of the framework and provides enterprises with a systematic approach for risk assessment and maintenance planning.
1. Introduction
Wind energy, with its remarkable advantages of being clean and renewable, is one of the key technologies for the transition from fossil fuels to renewable energy sources. With the rapid development of wind power generation technology, wind turbines have been widely deployed in the global new energy industry [1,2,3]. However, the complex operating environment and the variety of failure modes in wind power equipment often lead to significant economic losses and heightened maintenance risks when critical components fail [4]. Therefore, establishing a scientific and effective failure risk assessment method is of great importance for ensuring the reliability and safety of wind power systems.
Modern wind turbines exhibit complex, nonlinear, and highly coupled failure mechanisms due to long-term exposure to harsh environmental conditions such as variable wind loads, humidity, salt spray, and structural fatigue. Existing studies indicate that critical components including gearboxes, generators, and blades suffer from a wide range of degradation mechanisms such as bearing fatigue, lubrication loss, blade erosion, and gear cracking [5,6,7]. To address with these challenges, researchers have developed various analysis techniques, including supervisory control and data acquisition (SCADA) data-driven condition monitoring, vibration analysis for fault diagnosis, probabilistic reliability modeling, and machine learning-based health monitoring [8,9,10]. Although these approaches provide valuable diagnostic and prognostic insights, they generally lack a unified framework that integrates subjective expert knowledge, objective data, and fuzzy uncertainty, which are essential for wind turbine risk assessment. This limitation highlights the need for an advanced FMEA framework tailored to wind turbine systems.
Failure modes and effects analysis (FMEA) is an inductive risk analysis method for identifying and reviewing potential failures in mechanical, electrical, and other systems [11,12]. FMEA evaluates potential failure modes based on severity (S), occurrence (O), and detection (D), and ranks them using the risk priority number (RPN) to support maintenance strategies and resource allocation [13,14,15,16]. In practice, selecting appropriate maintenance strategies is essential for mitigating failure risks and improving system reliability, availability, and safety. This selection process is inherently a multi-criteria decision making (MCDM) problem, as it requires considering multiple factors such as cost, reliability, maintainability, and safety [17]. However, the traditional RPN approach has notable limitations [18,19,20]: equal weighting of indicators ignores their actual influence, expert scoring is subjective and prone to bias, similar RPN values reduce ranking resolution, and fuzziness or hesitation in judgments cannot be effectively handled, compromising the accuracy and robustness of risk assessment.
To address these limitations, scholars have proposed various improvements to FMEA. Wang et al. [21] introduced the analytic hierarchy process (AHP) into FMEA for weight modeling, assigning weights to different evaluation criteria to enhance the ability of the model to reflect differences among indicators. Dinmohammadi et al. [22] incorporated grey theory into FMEA for reliability analysis of offshore wind turbines and explored the relative weights of risk evaluation indicators for floating offshore wind systems in depth. Mario et al. [23] combined the entropy weight method (EWM), the best-worst method, and FMEA to derive an objective weighting factor, which effectively reduced machine failure rates in practical applications. These approaches improved weight assignment but did not fully address uncertainty and fuzziness in expert scoring.
With the development of fuzzy mathematics, fuzzy set theory has been applied to FMEA. For example, Pillay et al. [24] constructed new membership functions for the risk indicators S, O, and D based on fuzzy set theory, improving the efficiency of RPN calculation in FMEA. Sun et al. [25] proposed an improved FMEA risk assessment model that integrates fuzzy Bayesian networks and evidence theory. The model allows a holistic evaluation of hazards in maritime logistics systems and demonstrates its effectiveness and feasibility. Sharma et al. [26] developed a practical method combining fuzzy theory and AHP, which employs comprehensive evaluation techniques to more accurately participate in the risk prioritization process and reduce event uncertainty. Notably, while fuzzy theory improves the ability to handle uncertainty, the ranking phase often still depends on RPN or weighted average methods, which limits resolution and robustness in ranking.
Some researchers have regarded the prioritization of failure modes as a multi-attribute decision making problem [27,28,29,30]. For example, Safari et al. [31] employed an FMEA method integrated with VIKOR based on fuzzy variables to evaluate various risks in different aspects of enterprise management. Li et al. [32] proposed an enhanced FMEA model by combining FMEA, AHP, and technique for order preference by similarity to ideal solution (TOPSIS) to identify more reasonable levels of failure modes. Shi et al. [33] developed a TOPSIS-FMEA model that incorporated fuzzy preference ranking techniques based on the similarity to the ideal solution, to evaluate risks in terms of severity, occurrence, and detection. However, most of the existing approaches have not achieved an effective integration of fuzzy modeling and hybrid subjective–objective weighting mechanisms. These models tend to be fragmented and lack consistency, making it difficult to establish a unified and systematic risk assessment framework.
Although existing studies have made considerable progress in these areas, current FMEA models for wind turbines still face several challenges: (1) integration of subjective and objective weights remains fragmented, lacking a unified comprehensive weighting mechanism; (2) fuzzy modeling often overlooks hesitation in expert evaluations; (3) most studies focus on single-dimensional improvements, resulting in fragmented assessment processes and limited applicability. These limitations motivate the development of the present CSOW-IVIFN-VIKOR framework.
In risk assessment, the determination of criteria weights is crucial for obtaining robust and reliable results. Although methods such as the best–worst method (BWM) [34], the level-based weight assessment (LBWA) [35], the full consistency method (FUCOM) [36], and the double-input balanced ranking (DIBR) [37] reduce the number of pairwise comparisons and often achieve higher consistency, the AHP is still widely used. AHP provides transparency and interpretability, while allowing the structured aggregation of evaluations of S, O, and D provided by multiple experts. Its limitations, including potential inconsistency and the relatively large number of comparisons, are mitigated when combined with an objective weighting method. In this study, the entropy method was selected to capture the variability and discriminative power of the scoring data. The method is simple, interpretable, and fully compatible with AHP-derived subjective weights. Integrating AHP and EWM in the CSOW framework leverages expert judgment and data-driven information, improving robustness, reliability, and transparency in criteria weighting.
In response to these challenges, this paper proposes a wind turbine FMEA evaluation method that integrates both subjective-objective weighting and fuzzy decision-making. The proposed method is applied to a typical fault case study of the H171-5MW wind turbine, with equipment supplied by China State Shipbuilding Corporation Haizhuang Wind Power Co., Ltd., whose headquarters are located in Chongqing, China. The comparative results verify the feasibility and practical applicability of the method in terms of risk identification accuracy and prioritization rationality. The main research contributions and innovations of this study are as follows.
- (1)
- A Combined Subjective–Objective Weighting (CSOW) model is established. Subjective weights are derived using AHP, while objective weights are obtained through EWM. These are adaptively fused through a dynamic linear combination, enhancing both the rationality and robustness of weight assignment in risk assessment.
- (2)
- Development of a fuzzy decision-making model based on interval-valued intuitionistic fuzzy numbers and the VIKOR (IVIFN-VIKOR). A score function and the VIKOR method are applied to enhance failure risk prioritization by balancing group utility and individual regret.
- (3)
- A case study on H171-5MW wind turbine failure modes validates the proposed method. Compared with the traditional RPN model, it shows improved ranking robustness, fault identification accuracy, and information fusion, highlighting its potential for practical engineering applications.
The subsequent sections of this paper are structured as follows. Section 2 introduces the theoretical framework of the FMEA-based risk assessment method incorporating subjective-objective weighting and fuzzy decision-making. Section 3 presents a case study on wind turbine failure analysis using the proposed method. Finally, Section 4 concludes the paper.
2. Theoretical Methodology
2.1. Framework Overview
Figure 1 provides an overview of the proposed integrated risk assessment framework. This procedure can be applied throughout multiple stages of wind turbine lifecycle management, including early design assessment, development verification, and operational reliability evaluation. In practice, its most notable advantages arise during the operation and maintenance phase, where abundant expert experience and operational data can be incorporated to enhance the accuracy of risk prioritization. The framework consists of expert scoring collection and weight determination through AHP and entropy combination. It also includes IVIFN evaluation and VIKOR-based prioritization.
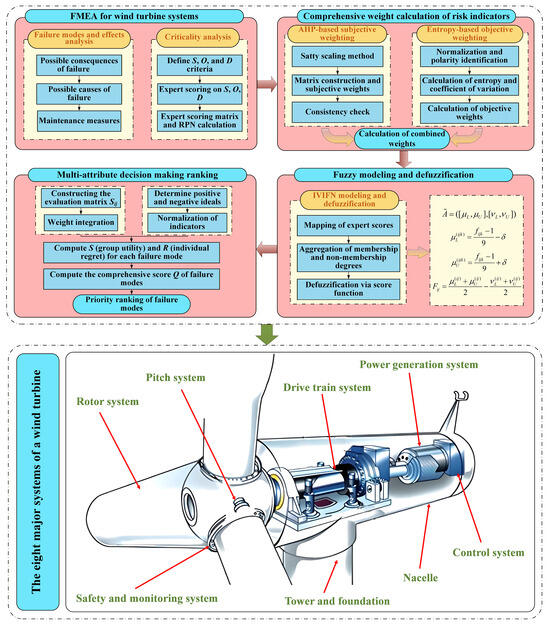
Figure 1.
Framework of the wind turbine FMEA evaluation method integrating subjective–objective weighting and fuzzy decision-making.
When applied at different stages, certain considerations may arise. For example, during the design stage, expert judgments play a dominant role due to the limited availability of operational data, whereas during real-world operation, the method can incorporate more objective information such as fault frequency, MTBF, or maintenance records.
To further elucidate the inherent consistency of the proposed methodological framework, it is necessary to clarify how the various techniques interact within a unified analytical process. The framework begins with the identification of failure modes and the acquisition of expert assessments of the S/O/D criteria, which constitute the primary data sources for subsequent stages. A hybrid weighting mechanism, combining AHP and EWM, first adaptively determines subjective and objective weights by combining expert judgments with the statistical dispersion of the scoring data, thus ensuring a balance of importance and a justifiable representation. These weights are then embedded in the IVIFN modeling stage, where expert assessments are transformed into a structured representation of uncertainty, capable of accommodating membership and hesitation. In the final stage, the VIKOR method aggregates the IVIFN scoring function, generating a compromise solution that reflects both group utility and individual regret metrics. Through this progressive integration of weight determination, uncertainty description, and compromise-based ranking, the framework ensures the systematic delivery of information. It also provides a comprehensive operational path from raw expert input to prioritized risk outcomes, consistent with the process presented in Section 3.
The data used in this study comes from the actual operation and maintenance records provided by China Shipbuilding Industry Corporation Haizhuang Wind Power Co., Ltd. (Chongqing, China), and includes S, O, and D ratings for multiple failure modes provided by six experts. Prior to analysis, missing or inconsistent entries were addressed, and all scores were normalized using the min-max method. To capture expert uncertainty, IVIFNs were constructed from the normalized scores. Any outliers were then verified and adjusted based on expert consensus. These preprocessing steps ensure the reliability and consistency of the data for subsequent risk assessment.
2.2. CSOW Model
Accurate indicator weighting is crucial for reliable ranking of wind turbine fault modes. This study proposes a CSOW model to integrate expert judgment with data-driven objectivity, enhancing evaluation stability and credibility. The model combines expert cognition with entropy-based analysis to balance rationality and sensitivity. It consists of four stages: FMEA-based failure identification, subjective and objective weight calculation, and adaptive weight integration, as shown in Figure 2.
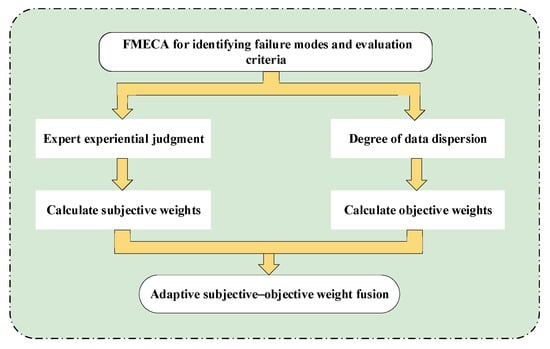
Figure 2.
Technical framework of the CSOW model.
2.2.1. FMEA-Based Identification of Failure Modes and Evaluation Indicators
In FMEA analysis, several key parameters are commonly used to evaluate and prioritize failure risks, including S, O, D, and the RPN [38,39,40]. These parameters collectively provide a structured basis for identifying and assessing the potential impact, frequency, and detectability of failure modes. In this study, FMEA serves as the foundational step for fault risk assessment. It is employed to identify typical failure modes in wind turbines and to establish the corresponding evaluation criteria. The outputs of this stage provide critical inputs for the subsequent procedures of weight determination and fuzzy decision-making, thereby ensuring the consistency and relevance of the overall assessment framework.
Severity refers to the seriousness of the consequences caused by a failure to the system, equipment, personnel, or users. Occurrence refers to the likelihood or frequency of a failure mode occurring during the lifecycle. Detection refers to the ability of current control measures to detect a given failure. The evaluation criteria are shown in Table 1.

Table 1.
Scales of S, O, and D parameters.
In traditional FMEA, the RPN is calculated as the product of S, O, and D, as expressed in the following formula:
The RPN ranges from 1 to 1000 and is used to evaluate the risk priority of failure modes, the higher the value, the higher the priority for corrective action.
2.2.2. Subjective Weight Calculation
In the subjective weight calculation, the CSOW model uses AHP to quantify expert perceptions via pairwise comparisons, constructing a consistent judgment matrix to derive the subjective weight vector. AHP decomposes complex problems hierarchically and determines indicator weights based on relative importance, using the Saaty 1–9 scale for comparisons [41,42,43].
- (1)
- Construct the judgment matrix as shown in Equation (2).
- (2)
- To solve for the maximum eigenvalue and eigenvector of an indicator, the square root method is used to compute the judgment matrix. The steps are as follows:
- (3)
- Normalize the indicator weights:where j represents the risk indicators S, O, and D.
- (4)
- To ensure that the weight allocation is reasonable and meets the requirements, further verification is necessary. Consistency check is performed on the weight vector under a single criterion, which requires the judgment matrix to generally satisfy consistency. The verification is carried out using the Consistency Index (CI) and the Consistency Ratio (CR) according to Equations (5) and (6).
In the above formulas, the closer the CI value is to zero, the closer the judgment matrix is to perfect consistency. When CR < 0.1, the judgment matrix A is considered to meet the consistency requirements; otherwise, the judgment matrix A must be re-constructed. The Random Index (RI) values for the consistency check are shown in Table 2.
Table 2.
Random index values for consistency check.
2.2.3. Objective Weight Calculation
The objective weighting component employs the EWM, which determines the indicator weights according to the degree of information dispersion within the dataset. By quantifying the variability of the evaluation data, EWM derives an objective weight vector that reflects the inherent differences among indicators and captures their discriminative contributions across various failure modes. The main calculation steps are summarized as follows [44,45,46,47]:
- (1)
- Data normalization. Suppose there are m indicators and n objects. The values of each evaluation indicator form the evaluation matrix as follows:
Evaluation indicators can be divided into two categories: benefit-type and cost-type. For benefit-type indicators, larger values are better, while for cost-type indicators, smaller values are preferred.
Normalization for benefit-type indicators:
Normalization for cost-type indicators:
- (2)
- The information entropy of each indicator is calculated using Equation (10).where , , and when , is defined as 0.
- (3)
- Calculate the divergence coefficient of each indicator.
- (4)
- Calculate the objective weight of each indicator.
2.2.4. Integration Mechanism of Subjective and Objective Weights
AHP, as a structured decision-making method, effectively captures expert knowledge and experience by constructing a pairwise comparison matrix to reflect the relative importance of each criterion. However, relying solely on subjective judgments, AHP may be affected by individual preferences and consistency errors. In contrast, EWM is a data-driven, objective weighting approach that quantifies the variability of each indicator within the dataset. Lower entropy indicates greater dispersion and higher information content, warranting a higher weight.
Although AHP and EWM each offer distinct advantages, using either alone may not fully capture the multidimensional characteristics of the evaluation system. To address this, an adaptive weight fusion strategy is proposed to integrate subjective and objective perspectives. An adaptive fusion coefficient is introduced to balance the contributions of the subjective and objective weight vectors, allowing the weight allocation to adjust according to expert judgment consistency and the discriminative ability of each criterion. This approach ensures a more balanced and context-sensitive assignment of weights. The AHP-EWM combination with adaptive fusion is formulated as follows:
- (1)
- Consistency Coefficient
By averaging the standard deviations across all objects, the overall dispersion of the j-th indicator can be obtained:
After normalization, the consistency coefficient is obtained as:
- (2)
- Discrimination Coefficient
Based on the entropy weight results, the discrimination of the j-th indicator is defined as:
- (3)
- Adaptive Fusion Coefficient
By integrating the consistency and discrimination coefficients, the adaptive fusion coefficient for the j-th indicator is defined as:
where α is introduced as a tuning coefficient to regulate the nonlinear fusion between the consistency index and the discriminative index . In this study, α = 1 is adopted as a neutral, providing a balanced trade-off without exaggerating local variations.
- (4)
- Calculation of Fused Weights
Based on the adaptive fusion coefficient , the fused weight for the j-th indicator is constructed as:
The fused weights are then normalized to ensure that they sum to one:
2.3. IVIFN-VIKOR Model
In wind turbine fault risk evaluation, expert scoring is often affected by bias and uncertainty, limiting the accuracy of traditional deterministic methods. To address this, a fuzzy multi-criteria ranking model based on IVIFN-VIKOR is developed. IVIFNs describe uncertainty in expert judgments, while VIKOR balances group utility and individual regret to derive a comprehensive ranking. The procedure involves IVIFN scoring, defuzzification, difference matrix construction, and final ranking (Figure 3).
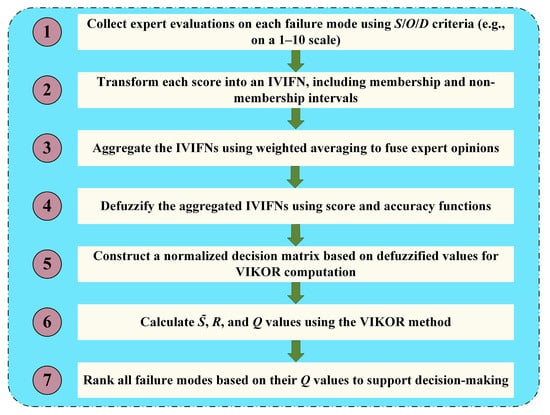
Figure 3.
Procedure of the IVIFN-VIKOR fuzzy decision-making method.
2.3.1. IVIFN-Based Fuzzy Modeling
In multi-attribute decision-making, traditional fuzzy sets capture uncertainty but fail to represent the full range of cognitive hesitation. IVIFNs, as an enhanced fuzzy modeling tool, more effectively express such fuzziness and have been widely applied in decision analysis [48,49,50].
- (1)
- Definition of IVIFNwhere and denote the lower and upper bounds of the membership and non-membership intervals, respectively. The hesitation degree interval is then obtained as:
This structure can more effectively reflect the uncertainty and hesitation in expert evaluations.
- (2)
- Mapping Expert Scores to IVIFNs
Given expert scores , where i: failure mode (i = 1, 2, …, m); j: evaluation criteria (S/O/D); k: expert index (k = 1, 2, …, K). The membership and non-membership degree intervals are calculated as shown in Equations (22) and (23).
where is the error coefficient, typically set to 0.05.
- (3)
- Aggregation of multiple experts’ scores
- (4)
- Calculate the IVIFN score function (defuzzification)
2.3.2. Failure Mode Hazard Ranking Using the VIKOR Method
VIKOR is a ranking method for solving multi-criteria decision-making problems, emphasizing the search for a compromise solution between “group utility” (i.e., the optimum of the majority of criteria) and “individual regret” (i.e., the minimization of the worst criterion). The detailed steps are as follows [51,52,53,54]:
- (1)
- Determine the positive ideal solution and negative ideal solution for each risk factor using Equations (27) and (28).
- (2)
- Calculate the relative distance of each failure mode to the ideal solutions under each risk factor.
- (3)
- Calculate the group utility distance Equation (30) and the individual regret distance Equation (31) for each evaluation object.
- (4)
- Calculate the comprehensive indexwhere v represents the decision maker’s strategy weight (typically set to v = 0.5).
3. Case Study on H171-5MW Wind Turbine
Based on actual O&M logs of the OWT provided by China State Shipbuilding Corporation Haizhuang Wind Power Co., Ltd. (Chongqing, China), this section applies the improved FMEA method, which integrates subjective and objective weights with fuzzy decision-making, to analyze the potential failure modes of the wind turbine. The aim is to verify the model’s capability to identify risk levels of potential faults in wind turbines.
3.1. FMEA of Wind Turbine
The wind turbine primarily consists of eight subsystems: the rotor system, drivetrain system, generator system, control system, pitch system, nacelle, safety monitoring system, and tower-foundation. Each subsystem has distinct failure modes. This section selects 40 typical failure modes from actual operational monitoring and fault data of the wind turbine, covering these eight subsystems, and establishes a table as shown in Table 3.
Table 3.
Wind turbine system fault code.
To ensure the credibility of the expert evaluations, six domain specialists with substantial backgrounds in wind turbine operation, maintenance, and reliability assessment were invited to provide S/O/D ratings. All experts possess extensive professional experience and solid domain knowledge in mechanical, electrical, and control systems, as well as practical involvement in wind farm fault diagnosis and maintenance decision-making. Their profiles cover both industry practitioners and academic researchers, offering a balanced blend of theoretical insight and hands-on expertise.
Since their qualifications are similar, equal weights were assigned in aggregating their S/O/D evaluations. Drawing on their professional experience and technical expertise, the experts independently scored each failure mode across three dimensions: S, O, and D. Based on these scores, the RPN for each failure mode was calculated, and a corresponding risk ranking was established. Table 4 reports the scoring results and rankings obtained using the RPN calculation formulated in Equation (1).
Table 4.
Expert scores on failure modes (S, O, D) and corresponding RPN-based rankings.
3.2. Comprehensive Weight Calculation
In this study, the AHP was employed to construct the pairwise comparison matrix. Experts from the wind power industry were invited to participate in the evaluation based on their extensive practical experience and professional judgment. Following the 1–9 scale proposed by Saaty [43], the experts conducted pairwise comparisons among the criteria. They judged that S is more important than O with a score of 2, S is more important than D with a score of 4, and O is more important than D with a score of 2. The resulting judgment matrix is shown in Table 5, which is constructed in accordance with Equation (2).
Table 5.
Judgment matrices for S, O, and D.
The geometric mean of each row (i.e., the n th root of the product of elements in each row) was calculated and then normalized to derive the subjective weights of the risk evaluation indicators. The results, determined according to the procedure described in Section 2.2.2, are presented in Table 6. The consistency check indicates that the requirements are satisfactorily met.
Table 6.
Subjective weights of risk indicators.
To enhance the objectivity of risk indicator weighting, EWM was applied to the three indicators: S, O, and D. EWM assigns higher weights to indicators with greater dispersion, as lower entropy reflects stronger discriminative power. The procedure is as follows: first, expert scoring data for all failure modes are normalized. Since S, O, and D are negative indicators (higher values indicate higher risk), a min-max transformation is used to eliminate the effects of differing units and scales. The min-max approach is particularly suitable for the entropy-weighting framework because it preserves the proportional relationships of the original ratings and ensures all transformed values remain non-negative, which is essential for stable entropy computation. Unlike alternative standardization techniques such as z-score scaling, it avoids producing negative values or altering the distribution structure, thereby preventing distortions that may affect entropy calculation. Second, the entropy of each indicator is calculated to quantify its information dispersion. Lower entropy indicates greater differentiation across the dataset, justifying a higher weight. The entropy values, divergence coefficients, and objective weights, determined according to the procedure described in Section 2.2.3, are presented in Table 7.
Table 7.
Entropy values, divergence coefficients, and objective weights of risk indicators.
The weights obtained through the adaptive weight fusion procedure described in Section 2.2.4 are presented in Table 8.
Table 8.
Comprehensive weights of risk indicators.
3.3. Interval-Valued Intuitionistic Fuzzy Number Modeling and Defuzzification
To accurately reflect the uncertainty and hesitation inherent in expert evaluations, the linguistic assessments of each failure mode in terms of S, O, and D were converted into IVIFNs. Specifically, Equations (22) and (23) were employed to establish the mapping between expert ratings and IVIFNs by calculating the corresponding membership and non-membership degrees. Subsequently, Equations (24) and (25) were used to perform an average aggregation of the IVIFNs provided by the six experts. After aggregating all expert evaluations, a complete IVIFN-based risk assessment matrix was constructed. The detailed results are presented in Table 9.
Table 9.
IVIFNs of risk indicators for failure modes.
To enable the quantification and ranking of failure risks, the IVIFNs were defuzzified using Equation (26), yielding the score function. Based on this, an m × 3 decision matrix was constructed, as shown in Table 10.
Table 10.
Score functions of risk indicators for failure modes.
3.4. VIKOR Multi-Criteria Decision Making
Based on the interval-valued intuitionistic fuzzy numbers of the failure mode evaluations, the positive ideal solution and negative ideal solution for each risk evaluation indicator were obtained. The results presented in Table 11 are obtained based on Equations (27) and (28).
Table 11.
Positive and negative ideal solutions of risk indicators.
The group utility measure , the individual regret measure R, and the compromise solution Q were calculated for each failure mode. The final risk priority rankings presented in Table 12 are obtained based on Equations (29)–(32).
Table 12.
Risk priority ranking of failure modes based on the VIKOR method.
3.5. Multi-Method Cross-Validation and Accuracy Analysis
To further validate the effectiveness of the proposed CSOW-IVIFN-VIKOR method, we first carried out a systematic comparison with several conventional approaches, including classical RPN, AHP, fuzzy RPN, grey relational analysis (GRA), and TOPSIS. By computing each method’s priority ranking of failure modes, we constructed an overall comparative ranking of the 40 failure modes across methods (Figure 4), which visually highlights the differences and trends in ranking produced by the various approaches.
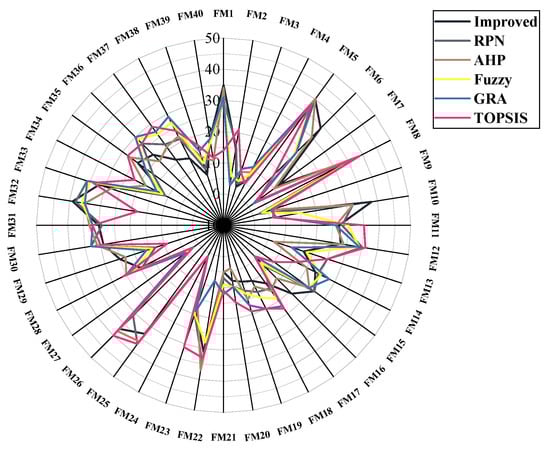
Figure 4.
Comparative overall ranking of 40 failure modes across different methods.
To more comprehensively assess ranking consistency among methods, we computed Kendall rank correlation coefficients and plotted a multi-method ranking-consistency heatmap (Figure 5). The results indicate that the Kendall coefficients between CSOW-IVIFN-VIKOR and classical RPN and AHP are highest (both 0.77), while the correlations with fuzzy RPN, GRA, and TOPSIS are 0.67, 0.55, and 0.47, respectively. This suggests that the proposed method inherits the intuitive ranking characteristics of traditional RPN while also reflecting the expert-judgement features captured by AHP; the lower correlations with fuzzy RPN, GRA, and TOPSIS reflect methodological differences in how expert disagreement and uncertainty are modeled.
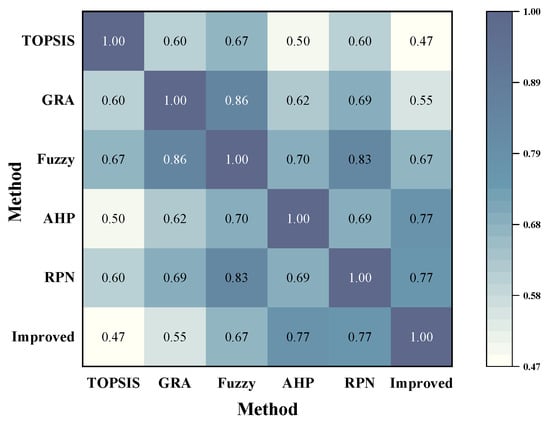
Figure 5.
Correlation of multi-method rankings using Kendall’s rank correlation.
However, inter-method consistency analysis lacks an independent objective benchmark. To provide such a benchmark, we introduced a fault-tree-based Monte Carlo simulation. By modeling the system structure and conducting extensive random simulations, this approach does not rely on expert scoring and therefore provides an objective reference for failure-mode prioritization. The simulation incorporates mean time between failures (MTBF) and mean time to repair (MTTR) to quantify each failure mode’s contribution to the system’s overall failure (see Table 13); in addition, the Monte Carlo framework reveals which failure modes are dominant contributors to system failure.
Table 13.
MTBF and MTTR of Basic Events.
In applying Monte Carlo simulation to validate the failure-mode ranking results, several assumptions and inherent limitations must be acknowledged. First, the simulation adopts the commonly used assumption that basic events in the fault tree are independent. Although this simplification does not fully capture the potential functional coupling or common-cause failures in wind turbine subsystems, it is widely employed in standardized reliability analysis practices. Under consistent assumptions, the Monte Carlo results still provide a meaningful baseline for comparison. Second, the simulation relies on predefined probability distributions and parameter settings derived from historical operational data. While the accuracy of the simulation depends on the quality of these data and the appropriateness of the assumed distributions, the use of actual field statistics ensures that the simulated failure behavior reflects realistic operational trends, particularly in terms of relative risk differences. Third, Monte Carlo simulation mainly captures stochastic variability and does not incorporate expert judgment, linguistic uncertainty, or fuzzy hesitation. However, this methodological independence is precisely what makes Monte Carlo a suitable complementary reference: it offers a purely data-driven validation perspective that is not influenced by the subjective or fuzzy modeling components embedded in the proposed approach.
Therefore, despite its limitations such as the independence assumption, distribution sensitivity, and computational cost, Monte Carlo simulation remains a rational and valuable tool for external validation. It provides an objective stochastic benchmark under widely accepted reliability assumptions, supporting the robustness and credibility of the proposed risk-ranking method.
Figure 6 presents a fault-tree model of the wind-turbine system. In the simulation, the overall turbine failure was defined as the top event, the eight major subsystems were treated as intermediate events, and 40 specific failure modes were represented as basic events. We performed 1 × 10⁴ Monte Carlo runs to compute the contribution rate of each basic event to the top-event failure and thereby derived a ranking of critical failure modes. Table 14 lists the codes corresponding to the top and intermediate events. Because the Top 10 modes represent the principal system risks and their ranking accuracy directly affects maintenance-priority decisions, we validated method performance by comparing the Top 10 lists rather than the full set of 40 modes.
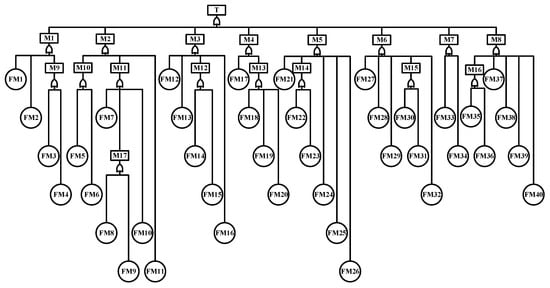
Figure 6.
Fault tree model of the wind turbine system.
Table 14.
Top and intermediate events of the wind turbine.
Figure 7 shows the overlap rates between the Top 10 failure modes identified by each method and those obtained from the Monte Carlo simulation. The CSOW-IVIFN-VIKOR method achieves the highest match rate, demonstrating the closest alignment with the simulation results. In contrast, classical RPN and other traditional approaches show noticeable deviations. These results confirm that the proposed method better integrates expert knowledge with data characteristics to accurately identify system-critical failure modes and support risk-prioritized maintenance decisions.
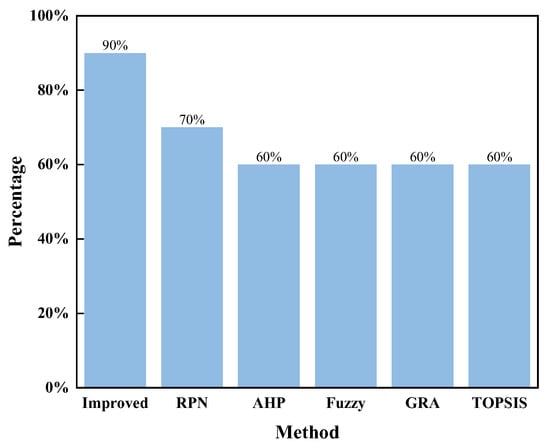
Figure 7.
Comparison of the Top 10 overlap between multi-method ranking results and Monte Carlo simulation validation.
3.6. Results and Discussion
Before presenting the detailed results, it is important to clarify the rationale behind the methodological design adopted in this study. The selection and ordering of the methods were determined by the characteristics of expert-based S/O/D evaluations and the need to construct a balanced and uncertainty-aware prioritization framework. The AHP-entropy combination was first employed to merge subjective expert knowledge with the objective dispersion of the scoring data, producing more stable and interpretable criterion weights than either method alone. To capture the ambiguity inherent in expert judgments, particularly for low-frequency or poorly understood failure modes, IVIFNs were adopted because they provide a richer representation of membership, non-membership, and hesitation. Finally, the VIKOR method was selected for ranking due to its compromise-oriented decision logic and its stronger ability to discriminate among closely performing failure modes when compared with traditional distance-based methods like TOPSIS. The framework follows a sequential structure of weight determination, fuzzy modeling, and compromise ranking, which ensures methodological coherence and provides a solid foundation for the analyses presented in the following subsections.
3.6.1. Weighted Results Analysis
To validate the rationality of the proposed CSOW-based weight fusion, we compared AHP-derived subjective weights, EWM-based objective weights, and CSOW-fused weights across three risk indicators: S, O, and D. Figure 8a presents radar plots of the three weighting schemes. AHP weights reflect expert preference for the S indicator, while EWM emphasizes the discriminative power of O within the data. In contrast, CSOW-fused weights achieve a dynamic compromise, adaptively balancing subjective and objective contributions according to expert consistency and the relative discriminative strength of each indicator. This approach retains the guidance of expert knowledge while incorporating objective data variability, mitigating biases associated with purely subjective or purely data-driven weighting. Notably, the adjustment of O weights illustrates the ability of CSOW to flexibly capture the importance of indicators based on data characteristics.
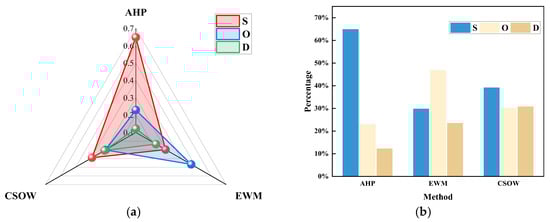
Figure 8.
Weight Comparison Analysis (a) Radar comparison of AHP, EWM, and CSOW weights; (b) Weight distribution of AHP, EWM, and CSOW.
Figure 8b further highlights these differences via bar charts. AHP assigns the highest weight to S, and EWM emphasizes O, whereas CSOW-fused weights are more evenly distributed across all indicators. This balanced allocation avoids over-reliance on either expert judgment or data alone, demonstrating the method’s comprehensiveness and robustness in capturing both subjective insight and objective evidence.
3.6.2. Sensitivity and Robustness Results Analysis
Although the CSOW method adaptively fuses subjective (AHP) and objective (EWM) weights to enhance ranking rationality, the external weights may still be affected by expert variability and data uncertainty. Therefore, perturbation experiments of ±5%, ±10%, and ±20% were applied to the O, S, and D indicators to evaluate robustness. The perturbation ranges of ±5%, ±10% and ±20% were selected to represent three graded levels of weight uncertainty commonly used in sensitivity analyses, ±5% models minor fluctuations arising from typical expert judgment variability; ±10% represents moderate deviations that frequently occur in practical weighting processes; and ±20% serves as a relatively large disturbance to test the stability of results under more extreme uncertainty. These levels are sufficient to reveal whether the proposed ranking is sensitive to small perturbations or only to substantial changes, while keeping computational effort at a practical level. Perturbations were applied to each criterion weight and the vector was renormalized to sum to one after each adjustment; the resulting ranking changes at each perturbation level were recorded to assess robustness. Results shown in Figure 9a,b demonstrate that the CSOW-IVIFN-VIKOR method maintains strong stability: the Top 3 risk modes remain fully preserved under all perturbations except D at −20%, and the Top 10 retention rate stays above 85% in most cases. Compared with traditional RPN, the proposed method shows superior robustness in identifying critical failure modes.
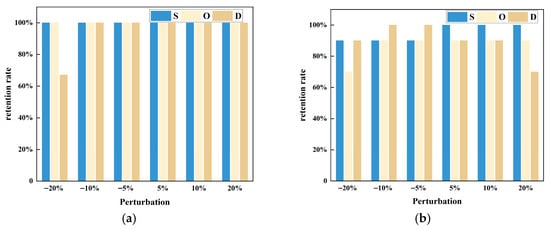
Figure 9.
Analysis of Critical Failure Mode Identification Accuracy under Weight Perturbations. (a) Retention rate of Top 3 risk modes; (b) Retention rate of Top 10 risk modes.
To provide a more comprehensive assessment of ranking stability, both Kendall and Spearman rank correlation coefficients were computed to evaluate the consistency between perturbed rankings and the baseline ranking. The Kendall coefficient is more sensitive to local rank swaps, whereas the Spearman coefficient captures the correlation of overall trends. The combined use of both metrics provides a more complete and robust evaluation of ranking consistency rather than relying on a single measure. Based on this analysis, heatmaps were plotted (Figure 10a,b) to illustrate overall ranking consistency. The results demonstrate that even under significant weight fluctuations, the proposed method maintains a high level of ranking stability, highlighting its reliability and robustness in practical applications.
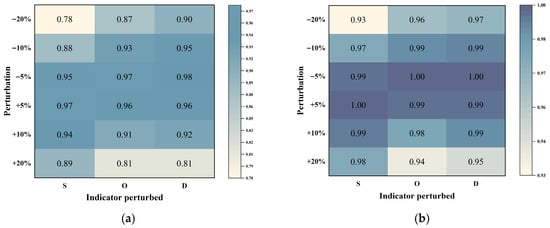
Figure 10.
Ranking consistency analysis under weight perturbations. (a) Heatmap of Kendall rank correlation coefficients; (b) Heatmap of Spearman rank correlation coefficients.
Overall, the results indicate that even under substantial weight fluctuations, the proposed method preserves a high degree of ranking stability, demonstrating its reliability and robustness in practical applications.
3.6.3. Discussion of Typical Failure Modes and Engineering Interpretation
To further validate the rationality of the improved method, three representative failure modes were selected for detailed analysis.
FM6 (Main Shaft Lubrication System Pipeline Failure): In the traditional RPN method, FM6 was ranked 23rd and classified as a medium-risk failure mode. Under the improved approach, however, its ranking dropped to 34th, indicating a low-risk mode. This adjustment reflects the improved model’s ability to fully account for the low severity of this failure, thereby reducing the excessive influence of the medium occurrence value that the traditional RPN tends to amplify. According to on-site operational and maintenance records, pipeline failures in the main shaft lubrication system seldom lead to severe consequences such as turbine shutdowns and are effectively mitigated through routine lubrication monitoring and scheduled maintenance. This real-world evidence is consistent with the improved method’s classification of FM6 as a low-risk mode, thereby enhancing the credibility of the evaluation.
FM7 (Gearbox Structural Failure): In the traditional RPN results, FM7 is ranked 3rd, mainly driven by its high occurrence rating. However, field data show that although this failure mode occurs relatively frequently, its severity is moderate, and it can often be detected early through conventional vibration and temperature monitoring techniques. The improved CSOW-IVIFN-VIKOR method integrates occurrence, severity, and detectability in a balanced manner, reducing the disproportionate impact of high occurrence alone. As a result, FM7’s ranking is reasonably lowered to 12th. This demonstrates that the proposed method remains sensitive to meaningful variations in risk while providing a more accurate reflection of the actual operational significance of failures. Consequently, the method offers a more scientific and data-aligned basis for maintenance planning and resource allocation.
FM16 (Inverter cooling and lubrication system circuit failure): the traditional RPN ranking relies solely on the simple product of S, O, and D, which causes the high occurrence rating to overestimate its priority. However, from an engineering perspective, this failure has a relatively low severity and a moderate detectability, resulting in limited actual impact on overall system operation. The improved method, through CSOW adaptive weight fusion and IVIFN-VIKOR multi-criteria ranking, comprehensively considers occurrence, severity, and detectability while accounting for uncertainty in expert assessments, reasonably lowering the risk priority of this failure to rank 21. This demonstrates that the proposed method can more accurately balance the significance of failures with high occurrence but low severity, providing a more reliable and scientifically grounded risk prioritization for maintenance decision-making.
Overall, these cases demonstrate that the proposed method effectively mitigates the bias inherent in the traditional RPN, aligns more closely with operational experience, and enhances the credibility and practicality of FMEA-based risk assessments.
4. Conclusions
To overcome the shortcomings of traditional FMEA methods for wind turbines-particularly their limited handling of fuzziness, difficulty in quantifying uncertainty, and strong subjectivity in multi-criteria weighting-this study proposes an improved evaluation method integrating adaptive subjective-objective weight fusion with fuzzy decision-making. A CSOW model was first developed by combining AHP and EWM, effectively integrating expert subjective judgments with objective data characteristics to optimize the weighting of risk evaluation criteria S, O, and D, enhancing the scientific rationality and accuracy of weight allocation. Subsequently, IVIFNs were employed to capture the uncertainty and hesitation inherent in expert evaluations, and, together with the VIKOR multi-criteria ranking method, an IVIFN-VIKOR model was constructed for multidimensional prioritization of failure modes, improving both accuracy and stability in risk assessment.
Application to a typical failure case of the H171-5MW wind turbine demonstrates that the CSOW model mitigates subjectivity and criterion-neglect issues inherent in traditional FMEA weighting, while the IVIFN-VIKOR model addresses fuzziness and uncertainty in expert scoring. The proposed method was further validated through Monte Carlo fault tree simulation, which provided an independent, data-driven reference for critical failure identification, and weight-perturbation analyses, which confirmed the robustness and stability of the risk ranking under ±5%, ±10%, and ±20% variations in S, O, and D weights.
Although the proposed CSOW-IVIFN-VIKOR framework provides reliable results, the information sources used in the current evaluation remain relatively limited. The expert panel, although composed of experienced specialists, represents only a finite range of domain perspectives, and the assessment still relies primarily on expert knowledge rather than real-time operational data. In future work, the richness and diversity of the information base can be further enhanced by involving a broader group of experts to improve the representativeness of the judgments and by integrating SCADA and maintenance data to complement expert knowledge with dynamic, data-driven evidence. Strengthening both sources of information will further improve the robustness and adaptability of the proposed framework.
Author Contributions
Conceptualization, Z.L. and Y.W.; methodology, Z.L. and Y.W.; validation, Y.X., Y.L. and Y.W.; data curation, Y.W.; writing—original draft preparation, Z.L.; writing—review and editing, Q.L. and X.Q.; visualization, Z.L.; supervision, Y.W. and Q.L.; funding acquisition, X.Q. All authors have read and agreed to the published version of the manuscript.
Funding
This research was funded by Science and Technology Innovation Key R&D Program of Chongqing (CSTB2025TIAD-STX0025).
Data Availability Statement
The data used in this article are available in the article.
Conflicts of Interest
The authors declare no conflicts of interest.
References
- Bin Abu Sofian, A.D.A.; Lim, H.R.; Siti Halimatul Munawaroh, H.; Ma, Z.; Chew, K.W.; Show, P.L. Machine learning and the renewable energy revolution: Exploring solar and wind energy solutions for a sustainable future including innovations in energy storage. Sustain. Dev. 2024, 32, 3953–3978. [Google Scholar] [CrossRef]
- Xu, B.; Lin, B. Green finance, green technology innovation, and wind power development in China: Evidence from spatial quantile model. Energy Econ. 2024, 132, 107463. [Google Scholar] [CrossRef]
- Li, J.X.; Wang, L.P.; Zhang, Z.Q.; Zhang, C.; Dong, Z.Q. Fragility analysis of wind turbine towers under combined wind and seismic loads considering wind-induced fatigue. Eng. Fail. Anal. 2025, 174, 109472. [Google Scholar] [CrossRef]
- Pérez, J.M.P.; Márquez, F.P.G.; Tobias, A.; Papaelias, M. Wind turbine reliability analysis. Renew. Sust. Energy Rev. 2013, 23, 463–472. [Google Scholar] [CrossRef]
- Liu, Z.; Shao, Z.; Li, Y.; Liu, H.; Liang, J. Performance degradation analysis-based fatigue reliability modeling and assessment for offshore wind turbine blade adhesive bonding. IEEE Trans. Reliab. 2025, 74, 4858–4869. [Google Scholar] [CrossRef]
- Bai, X.; Han, S.; Kang, Z.; Tao, T.; Pang, C.; Dai, S.; Liu, Y. Wind turbine gearbox oil temperature feature extraction and condition monitoring based on energy flow. Appl. Energy 2024, 371, 123687. [Google Scholar] [CrossRef]
- Leon-Medina, J.X.; Tibaduiza, D.A.; Parés, N.; Pozo, F. Digital twin technology in wind turbine components: A review. Intell. Syst. Appl. 2025, 26, 200535. [Google Scholar] [CrossRef]
- Igba, J.; Alemzadeh, K.; Durugbo, C.; Henningsen, K. Through-life engineering services: A wind turbine perspective. Procedia CIRP 2014, 22, 213–218. [Google Scholar] [CrossRef]
- Feng, Y.; Qiu, Y.; Crabtree, C.J.; Long, H.; Tavner, P.J. Monitoring wind turbine gearboxes. Wind Energy 2013, 16, 728–740. [Google Scholar] [CrossRef]
- Kerboua, A.; Kelaiaia, R. Recurrent neural network optimization for wind turbine condition prognosis. Diagnostyka 2022, 23, 2022301. [Google Scholar] [CrossRef]
- Liu, C.; Zhou, C.; Tan, L.; Cui, J.; Xiao, W.; Liu, J.; Wang, H.; Wang, T. Reliability analysis of subsea manifold system using FMECA and FFTA. Sci. Rep. 2024, 14, 22873. [Google Scholar] [CrossRef] [PubMed]
- Klarić, K.; Perić, I.; Vukman, K.; Papić, F.; Klarić, M.; Grošelj, P. Hybrid MCDM-FMEA model for process optimization: A case study in furniture manufacturing. Systems 2024, 13, 14. [Google Scholar] [CrossRef]
- Liu, H.C.; Liu, L.; Liu, N. Risk evaluation approaches in failure mode and effects analysis: A literature review. Expert Syst. Appl. 2013, 40, 828–838. [Google Scholar] [CrossRef]
- Li, H.; Teixeira, A.P.; Soares, C.G. A two-stage Failure Mode and Effect Analysis of offshore wind turbines. Renew. Energy 2020, 162, 1438–1461. [Google Scholar] [CrossRef]
- Li, L.; You, J.; Xu, T. Risk Analysis of Digital Twin Project Operation Based on Improved FMEA Method. Systems 2025, 13, 48. [Google Scholar] [CrossRef]
- Li, H.; Diaz, H.; Soares, C.G. A developed failure mode and effect analysis for floating offshore wind turbine support structures. Renew. Energy 2021, 164, 133–145. [Google Scholar] [CrossRef]
- Božanić, D.; Epler, I.; Puška, A.; Biswas, S.; Marinković, D.; Koprivica, S. Application of the DIBR II-rough MABAC decision-making model for ranking methods and techniques of lean organization systems management in technical maintenance. Facta Univ. Ser. Mech. Eng. 2024, 22, 101–123. [Google Scholar] [CrossRef]
- Tang, Y.; Tan, S.; Zhou, Y.; Huang, Y.; Zhou, D. BDWRPN: Belief divergence weighted risk priority number for failure modes ranking and its application. In Proceedings of the 2023 ECC, Bucharest, Romania, 13–16 June 2023; IEEE: New York, NY, USA, 2023; pp. 1–6. [Google Scholar] [CrossRef]
- Kumar, M.P.; Raju, N.V.S.; Kumar, M.S.; Gupta, G. Risk assessment and prioritization using fuzzy FMECA: A case study of dumper breakdowns. Int. J. Syst. Assur. Eng. 2024, 1–15. [Google Scholar] [CrossRef]
- Cicek, K.; Demirci, S.M.E.; Sengul, D. A hybrid failure analysis model design for marine engineering systems: A case study on alternative propulsion system. Eng. Fail. Anal. 2025, 167, 108929. [Google Scholar] [CrossRef]
- Wang, W.; Liu, W.; Fang, Y.; Zheng, Y.; Lin, C.; Jiang, Y.; Liu, D. Reliability analysis of subway sliding plug doors based on improved FMECA and Weibull distribution. Eksploat. Niezawodn. 2024, 26, 178275. [Google Scholar] [CrossRef]
- Dinmohammadi, F.; Shafiee, M. A fuzzy-FMEA risk assessment approach for offshore wind turbines. Int. J. Progn. Health Manag. 2013, 4, 59–68. [Google Scholar] [CrossRef]
- Di Nardo, M.; Murino, T.; Osteria, G.; Santillo, L.C. A new hybrid dynamic FMECA with decision-making methodology: A case study in an agri-food company. Appl. Syst. Innov. 2022, 5, 45. [Google Scholar] [CrossRef]
- Pillay, A.; Wang, J. Modified failure mode and effects analysis using approximate reasoning. Reliab. Eng. Syst. Safe. 2003, 79, 69–85. [Google Scholar] [CrossRef]
- Sun, J.; Wang, H.; Wang, M. Risk assessment of bauxite maritime logistics based on improved FMECA and fuzzy Bayesian network. J. Mar. Sci. Eng. 2023, 11, 755. [Google Scholar] [CrossRef]
- Sharma, A.; Gupta, G. Comparative analysis of conventional and fuzzy FMECA approach for criticality analysis of a vertical roller mill. Int. J. Syst. Assur. Eng. 2023, 14, 1395–1420. [Google Scholar] [CrossRef]
- Shao, J.; Zhong, S.; Tian, M.; Liu, Y. Combining fuzzy MCDM with Kano model and FMEA: A novel 3-phase MCDM method for reliable assessment. Ann. Oper. Res. 2024, 342, 725–765. [Google Scholar] [CrossRef]
- Xiao, Z.; Shi, Z.; Bai, J. FMEA Risk Assessment Method for Aircraft Power Supply System Based on Probabilistic Language-TOPSIS. Aerospace 2025, 12, 548. [Google Scholar] [CrossRef]
- Kamsefidi, M.M.; Shahraki, A.; Saljooghi, F.H. Improving the calculation of rpn in the fmea method by combining a nonlinear model with revised topsis and fuzzy logic. J. Health Saf. Work. 2023, 12, 854–871. [Google Scholar] [CrossRef]
- Kumari, S.; Ahmad, K.; Khan, Z.A.; Ahmad, S. Analysing the failure modes of water treatment plant using FMEA based on fuzzy AHP and fuzzy VIKOR methods. Arab. J. Sci. Eng. 2025, 50, 16821–16836. [Google Scholar] [CrossRef]
- Safari, H.; Faraji, Z.; Majidian, S. Identifying and evaluating enterprise architecture risks using FMEA and fuzzy VIKOR. J. Intell. Manuf. 2016, 27, 475–486. [Google Scholar] [CrossRef]
- Li, F.; Zhang, L.; Dong, S.; Xu, L.; Zhang, H.; Chen, L. Risk assessment of bolt-gasket-flange connection (BGFC) failures at hydrogen transfer stations based on improved FMEA. Int. J. Hydrogen Energy 2024, 50, 700–716. [Google Scholar] [CrossRef]
- Lin, Q.; Pei, X.; Zhuang, J.; Wang, D. An Integrated FMEA Method for Medical Human Reliability Analysis Based on DEMATEL and TOPSIS in Interval-Valued Intuitionistic Fuzzy Environment. Risk Anal. 2025, 45, 3819–3838. [Google Scholar] [CrossRef]
- Ju, Y.; Zhao, Q.; Luis, M.; Liang, Y.; Dong, J.; Dong, P.; Giannakis, M. A novel framework for FMEA using evidential BWM and SMAA-MARCOS method. Expert Syst. Appl. 2024, 243, 122796. [Google Scholar] [CrossRef]
- Biswas, S.; Pamučar, D.; Božanić, D.; Halder, B. A New Spherical Fuzzy LBWA-MULTIMOOSRAL Framework: Application in Evaluation of Leanness of MSMEs in India. Math. Probl. Eng. 2022, 2022, 5480848. [Google Scholar] [CrossRef]
- Pamučar, D.; Stević, Ž.; Sremac, S. A new model for determining weight coefficients of criteria in MCDM models: Full Consistency Method (FUCOM). Symmetry 2018, 10, 393. [Google Scholar] [CrossRef]
- Radovanović, M.; Božanić, D.; Tešić, D.; Puška, A.; Hezam, I.M.; Jana, C. Application of hybrid DIBR-FUCOM-LMAW-Bonferroni-grey-EDAS model in multicriteria decision-making. Facta Univ. Ser. Mech. Eng. 2023, 21, 387–403. [Google Scholar] [CrossRef]
- Zheng, W.; Gao, J.M.; Wang, R.X.; Chen, K.; Jiang, Y. Comprehensive Deployment Method for Technical Characteristics Base on Multi-failure Modes Correlation Analysis. IOP Conf. Ser. Mater. Sci. Eng. 2017, 281, 012058. [Google Scholar] [CrossRef]
- Chen, H.; Chen, W.; Li, H.; Zhang, J.; Niu, B. FMECA-Based Reliability Analysis of Heavy-Duty CNC Machine Tools. Qual. Reliab. Eng. Int. 2025, 41, 1804–1814. [Google Scholar] [CrossRef]
- Naranjo, J.E.; Alban, J.S.; Balseca, M.S.; Bustamante Villagómez, D.F.; Mancheno Falconi, M.G.; Garcia, M.V. Enhancing Institutional Sustainability Through Process Optimization: A Hybrid Approach Using FMEA and Machine Learning. Sustainability 2025, 17, 1357. [Google Scholar] [CrossRef]
- AlKheder, S.; Al Otaibi, H.; Al Baghli, Z.; Al Ajmi, S.; Alkhedher, M. Analytic hierarchy process (AHP) assessment of Kuwait mega construction projects’ complexity. Eng. Constr. Archit. Manag. 2025, 32, 1903–1946. [Google Scholar] [CrossRef]
- Chen, C.Y.; Huang, J.J. Deriving fuzzy weights from the consistent fuzzy analytic hierarchy process. Mathematics 2022, 10, 3499. [Google Scholar] [CrossRef]
- Saaty, T.L. Modeling unstructured decision problems-the theory of analytical hierarchies. Math. Comput. Simul. 1978, 20, 147–158. [Google Scholar] [CrossRef]
- Liu, Z.; Xie, Q.; Dai, L.; Wang, H.; Deng, L.; Wang, C.; Zhang, Y.; Zhou, X.; Yang, C.; Xiang, C.; et al. Research on comprehensive evaluation method of distribution network based on AHP-entropy weighting method. Front. Energy Res. 2022, 10, 975462. [Google Scholar] [CrossRef]
- Li, G.; Zhang, L.; Wang, Y.; Kang, Z. Critical node identification method of power grid based on the improved entropy weight method. Electronics 2023, 12, 2439. [Google Scholar] [CrossRef]
- Gao, Y.; Lifu, A.; Zhao, C.; Qin, X.; Na, R.; Wang, A.; Wei, S. Research on entropy weight variation evaluation method for wind power clusters based on dynamic layered sorting. Glob. Energy Interconnect. 2024, 7, 653–666. [Google Scholar] [CrossRef]
- Zou, Q.; Zhang, T.; Liu, W. A fire risk assessment method based on the combination of quantified safety checklist and structure entropy weight for shopping malls. Proc. Inst. Mech. Eng. O J. Risk Reliab. 2021, 235, 610–626. [Google Scholar] [CrossRef]
- Kodukulla, S.M.; Sireesha, V. A New Method for Ranking Interval-valued Intuitionistic Trapezoidal Fuzzy Sets. J. Appl. Sci. Eng. 2025, 28, 1371–1376. [Google Scholar] [CrossRef]
- Wang, Z.; Xiao, F.; Ding, W. Interval-valued intuitionistic fuzzy Jenson-Shannon divergence and its application in multi-attribute decision making. Appl. Intell. 2022, 52, 16168–16184. [Google Scholar] [CrossRef]
- Dong, J.Y.; Wan, S.P. Interval-valued intuitionistic fuzzy best-worst method with additive consistency. Expert Syst. Appl. 2024, 236, 121213. [Google Scholar] [CrossRef]
- Wang, Z.; Wang, R.; Deng, W.; Zhao, Y. An integrated approach-based FMECA for risk assessment: Application to offshore wind turbine pitch system. Energies 2022, 15, 1858. [Google Scholar] [CrossRef]
- Garg, A.; Das, S.; Maiti, J.; Pal, S.K. Granulized Z-VIKOR model for failure mode and effect analysis. IEEE Trans. Fuzzy Syst. 2020, 30, 297–309. [Google Scholar] [CrossRef]
- Zhang, W.; Wang, R.; Xu, J.; Chen, X.; Gao, J.; Wang, Z. Failure Mode and Effect Analysis of Complex Electromechanical Systems Based on Personalized Consensus in Heterogeneous Environment. Qual. Reliab. Eng. Int. 2025, 41, 2509–2530. [Google Scholar] [CrossRef]
- Sudžum, R.; Nestić, S.; Komatina, N.; Kraišnik, M. An intuitionistic fuzzy multi-criteria approach for prioritizing failures that cause overproduction: A case study in process manufacturing. Axioms 2024, 13, 357. [Google Scholar] [CrossRef]
Disclaimer/Publisher’s Note: The statements, opinions and data contained in all publications are solely those of the individual author(s) and contributor(s) and not of MDPI and/or the editor(s). MDPI and/or the editor(s) disclaim responsibility for any injury to people or property resulting from any ideas, methods, instructions or products referred to in the content. |
© 2025 by the authors. Licensee MDPI, Basel, Switzerland. This article is an open access article distributed under the terms and conditions of the Creative Commons Attribution (CC BY) license (https://creativecommons.org/licenses/by/4.0/).