Abstract
Reducing greenhouse gas (GHG) emissions and fuel consumption remains a critical objective in courier fleet management. Dynamic routing, which continuously updates delivery routes in response to real-time conditions, offers a promising solution. However, its implementation is hindered by challenges in real-time data analytics and intelligent decision-making. This study addresses two underexplored, yet impactful, variables in dynamic fleet routing: (1) the changing weight of delivery trucks due to unloading at each stop and (2) traffic conditions on local roads, where most deliveries occur. We propose a machine learning-driven smart rerouting system that integrates real-time data analytics into a dynamic routing optimization framework focused on minimizing fuel consumption. Our approach consists of two key components. First, trucks are equipped to collect continuous real-time data on vehicle weight, which are analyzed using frequency domain techniques, and traffic conditions, which are interpreted via neural networks. Second, these data inform an optimization model that explicitly captures the relationship between fuel consumption, emissions, vehicle weight, and traffic dynamics. This model surpasses conventional capacitated vehicle routing approaches by embedding real-time reasoning into route planning. Extensive simulation studies demonstrate that the proposed system significantly reduces both GHG emissions and fuel consumption compared to traditional routing models, highlighting its potential for sustainable and cost-effective fleet operations.
1. Introduction
Transportation significantly contributes to carbon dioxide (CO2) and other greenhouse gas (GHG) emissions. It is reported to account for about 14 percent of global anthropogenic emissions and approximately 27 percent in the U.S. (Herzog et al., 2005) []. Urban transportation operations, including passenger and freight transport, are responsible for 20–30% of total GHG emissions (IPCC, 2017) []. To address this, intelligent transportation technologies and mobility management strategies are emerging as solutions to reduce GHG emissions and fuel consumption. Existing practices and studies often rely on simulation models, scenario analysis, and limited deployment experiences (Shaheen and Lipman, 2007) []. Further research is essential to quantify potential impacts accurately.
Accurately estimating and visualizing fuel consumption and emissions from transportation are crucial for understanding the energy costs and air pollution associated with travel and transport. Previous studies often did not account for vehicle activities, potentially leading to erroneous estimates. Machine learning (ML) is increasingly vital in monitoring and reducing transport-related GHG emissions. ML has shown great potential in predicting emissions, optimizing routes, and performing econometric modeling to evaluate road transport policies aimed at reducing GHGs in urban settings (Rinchi et al., 2024) []. Therefore, accurately estimating and visualizing vehicle fuel consumption and emissions by considering vehicles’ mobile activities in optimal route planning powered by using machine learning solutions is of practical importance (Kan et al., 2018) [].
(1) Vehicle routing problems: While carriers typically transport large quantities of goods over long distances, couriers deliver items regionally (McLeod et al., 2020) []. Carriers usually use larger trucks and employ a team of drivers to make deliveries. In contrast, couriers typically use their vehicles to make deliveries at specific times and locations. Generally, courier services are faster and more efficient and have door-to-door service more often than the post office. Courier deliveries usually take place in dense urban areas, for which fleet operation management comes with many challenges not experienced in delivering in suburban environments, such as numerous apartment buildings in urban areas, frequent stops, complex local traffic, etc. For courier operations, route planning is a crucial component of fleet management, and businesses have traditionally relied on static routing techniques. However, dynamic routing has emerged as a more advanced and efficient approach to fleet management (Zeimpekis et al., 2007) [].
Static route planning generates planned routes based on fixed criteria like distance, pre-determined delivery locations, and historical data. Unless fleet managers manually update these routes, they do not change. The limitations of static route planning are obvious, including fixed and preplanned routes: the fact that routes are determined on the basis of assumptions and historical data, the absence of real-time modifications depending on changing factors, limited flexibility to adapt to unanticipated circumstances or changes, and the fact that routes may not account for variables like traffic conditions or customer preferences. Typically, static routes are established before the day starts and are followed throughout the day without modification (Horváth et al., 2017) []. The routes are not usually updated frequently in static routing.
(2) Dynamic fleeting routing: In contrast to conventional static route planning techniques, dynamic routing is the process of continuously optimizing delivery routes in real time, depending on an array of variables, such as traffic conditions, customer requirements, delivery windows, and vehicle capacities (Nguyen et al., 2020) []. It entails generating the most efficient routes utilizing advanced algorithms and real-time data. This leads to increased operational effectiveness, cost savings, and customer satisfaction. Dynamic routing adapts and modifies routes as needed to ensure the most efficient and cost-effective delivery process. To generate accurate and updated route plans, it makes use of advanced technologies, including GPS tracking, telematics systems, and sophisticated algorithms.
While the potential benefits of dynamic fleet routing sound appealing, existing methods and practices of dynamic routing mainly focus on “indirect interventions” regarding rerouting decisions, for example, through dynamic pricing (Figliozzi et al., 2007) []; Turan et al., 2020) [], predictions of changes (Liebig et al., 2017) [], adjustments of vehicle capabilities (Seyyedhasani and Dvorak, 2018) [], or optimization of resource allocation (Ninikas and Minis, 2020 []; Wang et al., 2018 []). This limitation may be associated with the difficulties in adapting to real-time changes in traffic conditions, which calls for smart sensing and advanced data analytics and reasoning (Psaraftis et al., 2016) [].
(3) Real-time fuel economy for minimizing GHG emissions: One theoretical limitation of traditional vehicle routing methods lies in modeling fleet operation costs purely on the total traveled distance (Dantzig and Ramser, 1959) []. In practical applications of courier deliveries, the fuel cost (not only the gas price but also the kind of fuel surcharges occurred in one way or another) is one of the most important drivers of cost towards GHG emissions per se (Zhou et al., 2016) [], particularly when operated in urban areas that are subject to low MPG (miles-per-gallon), frequent stops, low speeds, and high traffic (Yao et al., 2015) []. Compared to other cost drivers of fleet operations (e.g., tolls, taxes, permits, salaries, etc.) that are not negotiable or avoidable, fuel economy indeed is an “optimizable variable” that can play a significant role in cost-effective fleet operation management (Miao et al., 2018) [].
Existing fuel economy models for reducing GHG emissions are mainly based on the average past performance or predicted fuel consumption (Li et al., 2009) [] but cannot be applied to real-time scenarios (Keith et al., 2019) [], which is more imperative than ever for implementing dynamic fleet routing. Real-time fuel economy has more profound implications, including the following: (a) Real-time truck weight: Fuel economy is heavily correlated with the weight of the truck and its loads. The added complexity of the courier delivery case is that the truck’s weight keeps changing after unloading at each delivery stop, which, in turn, will affect the fuel economy of subsequent travels. This calls for real-time sensing of the truck’s weight on the go. (b) Real-time traffic conditions: Fuel economy, particularly in urban areas, is strongly affected by the traffic conditions, such as traffic congestion, road closure/detour, traffic signals/crossing, as well as other moving objects on the roads. It is thus necessary, yet challenging, to detect traffic conditions instantaneously in order to feed real-time data to dynamic routing for making rerouting decisions.
To address these critical technical challenges of dynamic fleet routing problems for dealing with real-time fuel economy for reducing GHG emissions, this paper proposes a smart fleet rerouting system by embedding real-time data analytics and reasoning into a dynamic routing optimization model focusing on the fuel consumption rate (FCR) and, in turn, GHG emissions. The smart system empowers trucks to collect a stream of real-time data, encompassing crucial factors like weight and prevailing traffic conditions. Original contributions expected to advance the practical applications of dynamic fleet routing are threefold: first, smart truck weight sensing and analytics are proposed to derive weight measurements through meticulous frequency domain analysis. Second, real-time traffic condition assessments are made possible through the application of neural networks for on-road object detection and fuzzy logic intelligent reasoning for rerouting decisions. Third, real-time relationships between FCR/GHG emissions, the truck’s weight, and traffic conditions are modeled within a coherent framework of dynamic fleet routing optimization. Overall, the proposed smart fleet rerouting system aims to transcend the limitations of conventional route planning approaches regarding real-time capabilities.
2. Related Work
(1) Truck weight detection: Various techniques exist for measuring a truck’s weight. The most straightforward method involves periodic weighing on a scale. However, this approach is not always feasible, and the weight data obtained are neither real-time nor continuous. There are other types of onboard sensors for measuring the pressure inside the truck’s suspension airbag (Right Weigh, 2023) [], the length of the shock absorber (Chen, 2011) [], the strain in the truck’s rim (Trimble, 2015) [], the angular displacement and disturbance of a suspension component (Brown, 2020) [], and the stress level of a leaf spring suspension (Creative Microsystems, 1998) []. However, these methods often cater to specific suspension types, potentially requiring invasive installations or complex modifications. Such alterations can impact the truck’s mechanical performance and safety, and the associated complexity may lead to higher costs. It is of practical importance to develop a noninvasive method universally independent of specific truck structures to measure truck weight in a real-time manner.
(2) Vehicle routing problem: The Traveling Salesman Problem (Flood, 1956) [] originated from the problem that a salesman needs to travel from his home to several cities and then return to his home via the shortest path. The vehicle routing problem (VRP) is a generalization of the Traveling Salesman Problem. It is defined as an optimization problem about finding the optimal set of routes for the fleet in order to deliver goods to a set of customers (Dantzig and Ramser, 1959) []. The objective function is to minimize the total distance given a number of stops and the distance between every two stops. The optimal solution is achieved by aggregations and rapid corrections, considering relative cost factors. The basic VRP model assumes only one product demand and that all trucks in the fleet have the same capacity.
The capacity constraint can be mitigated by allowing different capacities for the trucks; this is referred to as the Capacitated VRP (CVRP). In addition, the VRP with a time constraint (VRPTW) has more constraints in the time domain, including allowable delivery times or time windows, which means that the customers impose the earliest service time or service deadline constraints (Solomon and Desrosiers, 1988) []. Many problems with perishable food delivery are solved based on this type of VRP (Hsu et al., 2004) []. A more specific application in this area is frozen food delivery [] (Zhang and Chen, 2014). Compared to the classic VRP, this application calculates the transportation cost of a vehicle between two customer locations by distance while introducing four additional types of costs, including multi-product demands, the cost of refrigeration related to the transportation time and the number of stops, the cargo damage cost related to the time and the demand of customers, and the penalty cost, which is time-related and happens when the food is delivered outside the customer’s required time window.
The VRP has been studied for years, and there are many other variants of VRP, such as VRP with Profit (VRPP) (Archetti et al., 2014) [], VRP with Pickup and Delivery (VRPPD) (Koç et al., 2020) [], Dynamic VRP (DVRP) (Azi et al., 2012) [], Electric VRP (E-VRP) (Erdelić and Carić, 2019) [], and more. A new type of VRP can be created based on the new requirements and constraints of the problem and modified from the existing VRP. This research introduces a new dimension of real-time fuel economy to the VRP, which is a significant cost driver in practical applications of fleet operation management.
(3) VRP optimization solution: The solution of a VRP typically entails optimization models whose formulations generally fall into two categories: vehicle flow formulations and set partitioning formulations. Solving methods for VRP optimization models can be broadly classified into two distinct groups: exact methods and approximate solution methods (Goel and Maini, 2017) [].
The exact methods are guaranteed to obtain the optimal solution [] (Jourdan et al., 2009). Methods like branch and bound, constraint programming, and dynamic programming are included in this family. The approximation methods include heuristic methods and metaheuristic methods. The heuristic methods focus on finding better solutions by iteration. In each step, the solution will move to a state with a lower cost, such as savings methods (Clarke and Wright, 1964) [], which includes one of the earliest methods for solving VRP, and sequential insertion (Joubert and Claasen, 2006) [], which improves the quality of the initial solution for a number of problem classes. Metaheuristics are a class of heuristics that search beyond the local optima (Glover, 1990) []. Methods like genetic algorithms, swarm intelligence (Akhand et al., 2015) [], and local search are included in this family. The local search can be solved with many algorithms, including WalkSAT algorithms, simulated annealing (Kirkpatrick et al., 1983) [], Tabu search (Glover, 1990) [], and guided local search. The guided local search has been proven to have a better result more times than the other methods (Voudouris and Tsang, 1995) [].
3. Smart Fleet Rerouting System Architecture
For courier operations, one of the most pivotal facets of fleet management lies in route planning for individual trucks. Consider a fleet with inventory stationed at a depot, poised to meet anticipated customer demands the following day. Precise knowledge of demand quantities and customer locations is at hand prior to the day’s commencement. The objective here is to devise the most efficient approach for assigning routes among the fleet’s trucks.
Traditional methods often opt for the shortest path that ensures all customers are serviced, but in practice, this simplistic approach often falls short. Truck transport operates in an environment rife with complexities and uncertainties. Numerous variables are at play, including customer locations, demand quantities, and the available pathways between the depot and customers or even among customers, which can vary daily. Unlike conventional models, real-world delivery costs are influenced by factors beyond distance alone. Fuel consumption is the primary cost driver, making fuel cost minimization the foremost goal in route planning.
To achieve this goal, minimizing the overall fleet fuel consumption rate (FCR) and, thus, GHG emissions, is paramount. Several factors impact the FCR of each truck. Internally, factors such as engine efficiency, engine RPM, gear selection, speed, throttle position, aerodynamic drag, rolling resistance, and driveshaft loss contribute to the FCR’s complexity. Externally, cargo weight, traffic conditions, driver behavior, fuel quality, and altitude variations also significantly affect the FCR. To align the model with reality, these FCR-affecting factors should be incorporated into the model, in addition to distance considerations.
Knowing that the weight of the truck will vastly affect the FCR and, in turn, the transportation cost, it is critical to detect the accurate weight of the truck in a real-time manner. Although the route planning of each truck is pre-determined on the previous day, the weight of the truck at any time and location can be estimated from the route assignment.
Several constraints are also pertinent to this problem. Overloading a truck is illegal and poses risks to the driver, other road users, and pedestrians. Real-world time constraints are another concern, as customers may specify delivery windows, and truck drivers must adhere to work-hour regulations. While not directly addressed in this paper, minimizing FCR indirectly minimizes refueling time, optimizing the time for goods delivery—a particularly valuable point as electric vehicles gain prominence, given their slower charging speeds, which makes idling trucks for extended periods highly inefficient.
3.1. Smart Data Analytics and Intelligent Reasoning
To surpass the efficiency of traditional fleet route planning systems, it is imperative to establish a novel model that comprehensively addresses real-world complexities. In this proposed system, the primary objective is the minimization of fuel consumption across the entire fleet. In practical scenarios, fuel consumption is influenced not only by factors such as the total distance traveled, truck weight, efficiency, and traffic conditions but also by the driver’s driving style. Consequently, a diverse array of data is required to optimize this process, extending beyond mere information regarding delivery locations, weights, and available routes. In this regard, this paper develops an approach using smart data analytics and intelligent reasoning.
The decision-making hierarchy underlying this smart approach is illustrated in Figure 1. It provides an overview of how the system intends to tackle the challenges of dealing with real-time fuel economy through enhanced data acquisition and decision-making. The system is stratified into three tiers of subsystems, with each upper-level system relying on the lower-level systems. The ultimate goal is to efficiently allocate routes to the entire fleet by devising an optimal route for each individual truck. This pivotal task falls under the purview of the cloud-based smart fleet rerouting system, situated at the topmost tier. This subsystem possesses the requisite knowledge and decision-making capabilities to enhance the overall efficiency. To attain this knowledge, critical information is indispensable, including pairwise distances between locations, prevailing traffic conditions, the fuel efficiency of trucks and drivers, and the weight of the truck between two unloading stops. These critical data points are acquired and processed by the onboard data processing system, residing in the second tier. This subsystem extracts valuable features from raw data collected by a myriad of sensors, situated at the lowest tier. These sensors encompass location coordinates, suspension frequencies of the truck, road imagery, and so on.
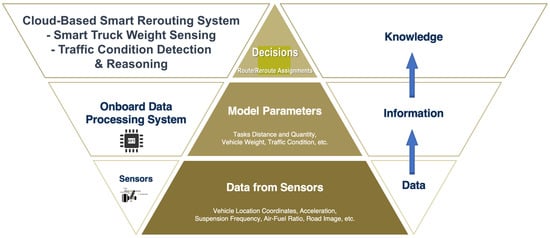
Figure 1.
Decision-making hierarchy underlying smart data analytics and intelligent reasoning for dynamic fleet routing.
3.2. System Analysis and Design
Figure 2 illustrates the system architecture of smart data analytics and intelligent reasoning for dynamic fleet routing. The cloud-based smart fleet rerouting system serves as the top layer of the decision-making hierarchy and interacts with various stakeholders of fleet operations. It is equipped with an optimization model to plan and assign routes to each truck in order to achieve high efficiency for the entire fleet. The onboard data acquisition/processing system covers the middle and bottom layers of the decision-making hierarchy. It employs sensors and computing units to collect data and send the weight, traffic condition, and driver’s driving data to the cloud server. While the truck drivers are the main stakeholders of this system, the technicians also have chances to interact with the system for registering new trucks or adjusting/recalibrating the current trucks.
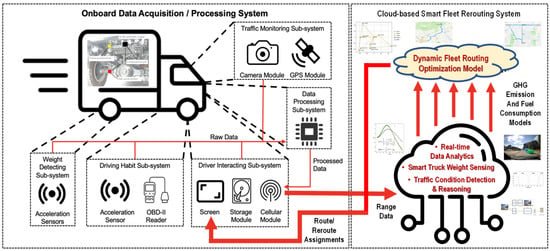
Figure 2.
System architecture of smart fleet rerouting planning.
Three subsystems are required to collect the necessary data. The weight-detecting subsystem is located on the subframe of the truck. It is used to collect the suspension movement data. By doing a Fourier transform and regression, the current weight of the truck can be calculated. The driving monitoring subsystem should be installed in the driver’s footwear. It is equipped with another accelerometer to record the longitudinal acceleration, along with an OBD-II reader to collect the data that are related to the FCR, like the throttle position and air–fuel ratio from the truck’s ECU. A fuel consumption index (FCI), introduced to indicate the truck and driver’s fuel efficiency, will be calculated from the raw data.
The traffic monitoring subsystem is mounted behind the front windshield. It includes a GPS module for the location coordinates and a camera to record road images. Based on statistical analysis of the historical traffic conditions from the third-party sources, another index, i.e., the traffic condition index (TCI), is calculated to stimulate the fleet to drive on roads that have less traffic. The images will be processed with machine vision techniques and neural networks to identify the number of cars on the road. Those images can be used to identify real-time traffic conditions. If there are too many cars on the road, leading to slow traffic, the system will direct the driver to the next best-optimized route.
There are two additional subsystems, although they are not used to collect data. The driver interaction subsystem has three main parts. There is a screen where the driver can log in and look for the assigned routes and all the information obtained by the previously mentioned subsystem. There is a data storage module that will store all the data for future system calibrations, as well as a calibrated model for the current truck, including the general range, FCR, and cargo capacity. There is also a cellular module that is used to communicate with the cloud-based routing system in real time. Finally, the data processing subsystem is used to process all the raw data from all the previous subsystems. Table 1 summarizes the inputs from other subsystems, methods used, and outputs generated from the data processing subsystem.

Table 1.
Data processing of subsystem functions.
4. Smart Truck Weight Sensing and Analytics
The prevalent truck weighing methods involve invasive installations and complex modifications that may impact the truck’s mechanical performance and safety. Real-time weighing needs to collect an accurate weight and be able to send this information, along with its latitude and longitude, through an Automatic Vehicle Locator (AVL) that is typically equipped with trucks. We are motivated to design a smart system that is noninvasive, easy to install, and universal for all suspension types, that can read a range from 2 to 32 tons for typical courier trucks, and that is hooked up to the RS232 port of most trucks.
We propose using accelerometers to record the oscillations of the axle and the frame of the truck. The weight of the truck can be found by using accelerometers and processed via the Fourier transform and regression. A computational unit is introduced to calculate the frequency response function of the suspension that is modeled as a mass-spring-damper (MSD) system. Based on the response function, the unit is able to determine the weight of the truck with the cargo load. After determining the weight, it is sent over to the AVL. A single calibration is required upon system installation, so that the smart device learns the properties of an empty vehicle. This smart sensing method is advantageous for its universality and indirect measurement by simulating the vehicle frequency response on computer software.
(1) Smart sensing system design: Our smart method of indirect and noninvasive truck weight measurement is based on the principle of vibrations. The truck is modeled as an MSD using accelerometers. The system measures the mass by determining the oscillation frequency transfer function of the suspension. This is a completely noninvasive approach, as no suspension components have to be modified; it is also applicable to all suspension types, and the sensors are cheap and can be easily installed and replaced.
The core of this system is the computation unit, as this method requires more intensive calculations. This approach is physically feasible as it can be tested on a simulated response function. However, the exact results depend on the quality of data received from the accelerometer sensors, which can only be determined in the calibration phase. Figure 3 shows how the accelerometer data are computed into the weight output.

Figure 3.
Truck MSD vibration model for smart weight sensing using accelerometer data.
(2) System modeling and data processing: Assuming the truck only has four wheels on each corner, the load is evenly distributed among all wheels. The dynamic model of the truck suspension can be simplified to a quarter mass-spring-damper model. Ignoring the deflection of the wheel, the model can be further simplified to a second-order mass-spring-damper system with one degree of freedom (Bereteu and Perescu, 2012) [], as shown in Figure 3b.
The data from the accelerometers are converted to the frequency domain by fast Fourier transform (FFT). The governing transfer function of this second-order mass-spring-damper system with one degree of freedom is as follows:
where , , and denote the natural frequency [Hz], damping ratio, spring constant [N/m], damping coefficient [N s/m], and mass [kg], respectively.
One calibration run when the truck is empty is needed for this system to work. The acceleration data from both the axle and the frame will first be converted to the frequency domain by doing an FFT. A series of gain data is then calculated from two types of frequency data. The gain data are separated into different samples. Then, a curve fitting of Equation (1) is performed, where x is the linear frequency data from 0 to 25 Hz, sliced into the same length as the sampling window length, and y is the gain data in the sample. This provides the natural frequency of the car when it is empty. Therefore, the spring constant can be found with , where both and are known. Because will not change as loads are added to the truck, after the calibration run, the natural frequency can be obtained using the same methods, and then the weight is calculated as follows: . Each sample will provide a unique weight, but one can pick out the outliers and calculate the average of multiple samples to derive a more accurate weight.
(3) System implementation and testing: The system is composed of two accelerometers, one to characterize the input of the suspension system and the other to characterize its output, along with a computational unit, as shown in Figure 4a. The system is designed to allow for easy installation and packaging. System components, as shown in Figure 4b, are attached to the vehicle frame with zip ties, as shown in Figure 4c. A prototype is created using a Raspberry Pi as the computational unit. This can be replaced with an embedded system module and a dedicated circuit board in real applications. The frequency domain transfer function is dependent on the weight of the truck and cargo. Therefore, it is possible to determine the weight of the cargo when the transfer functions for the empty and loaded vehicles are known. This onboard weighing system employs two accelerometers that measure acceleration in the direction normal to the ground, collecting and feeding time data to the computational model. Pairs of accelerometers have one mounted to the frame of the vehicle and another mounted to the axle.
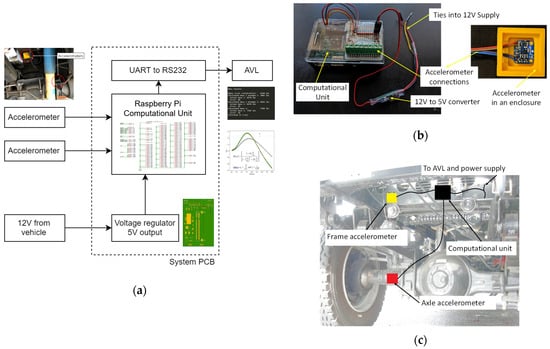
Figure 4.
System architecture and prototype. (a) System block diagram. (b) System prototype. (c) System installation on the truck.
The prototype system is tested on a four-wheeled truck with leaf spring suspension. Two Adafruit Triple-Axis Accelerometers and a Raspberry Pi 3-Model B are used for data collection. After the initial calibration runs, two load conditions are tested on three routes. The accelerometer is set to 50 Hz, and the sampling window is 3000; so, every 1 min, new weight data are generated. The test conditions are summarized in Table 2, and the results indicate that a maximal error is less than 3%, as shown in Figure 5.

Table 2.
Calculated mass and error.
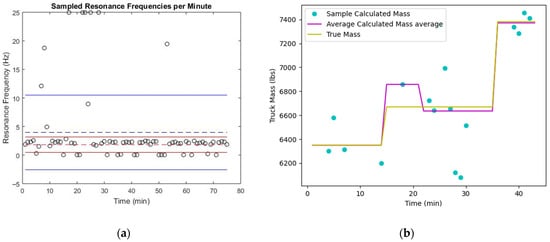
Figure 5.
System testing and experimental results. (a) Sampled resonance frequencies. (b) Frequency response of different loads and calculated mass.
Matlab signal processing is used to reduce data, confirming that different loading conditions cause variations in the frequency response. Weight configurations and calculations for preliminary testing are shown in Figure 5b. Figure 5a shows the sampled resonance frequencies, with a mean around 2.5 Hz, although there are a few obvious high and low outliers, with iterated standard deviation bounds. Overall, the experimental results provide support for a theoretical relationship between the mass and the consistent resonance frequency. It lends itself to be a novel and noninvasive method of determining vehicle weight in real time.
5. Traffic Condition Detection and Analytics Using an RPN-Enhanced Mask R-CNN
This function is critical for incorporating truck fuel consumption into decision-making for dynamic fleet routing. The pre-determined traffic condition is acquired from third-party sources, and the TCI is represented as the ratio of the average speed to the speed limit. Because historical data cannot always output the correct prediction, in case of unpredictable events like car accidents, a camera is used to identify how many cars are on the road and then decide to switch to an alternative road. Intelligent reasoning is achieved by integrating the Faster R-CNN (Girshick, 2015) [] and fuzzy logic [] (Zadeh, 1975) techniques.
(1) TCI Generation from historical data: The traffic condition of this system is constructed with two parts. The traffic condition data from the third-party source are used to predict future traffic conditions, while the real-time camera data are used for route planning. TomTom is a free third-party source that is used to attain the necessary data. It is able to show the median or average speed of a certain route at a certain date and time period, as well as the speed limit of the route, as shown in Figure 6. The TCI is set as the ratio of the average speed to the speed limit on business days during the last four weeks from 7:00 to 20:00. In reality, however, it is possible that a unique event that cannot be identified from historical data can occur, such as a car accident or a closed road. Therefore, the camera on the car is used to identify this instantaneous traffic condition and inform the system to choose an alternative route in real time.
(2) Enhanced Mask R-CNN for on-road object detection: The Faster R-CNN, or Faster Region-Based Convolutional Neural Network, is used to extract the context information from images to identify the instantaneous traffic condition. It is able to partition the images into segments and identify the object type, number, and position. The basic principles behind the Faster R-CNN will be explained in this section. This paper uses a pre-trained Mask R-CNN model with a COCO dataset, which contains more than 200,000 labeled images and 91 object categories (Lin et al., 2014) [], including objects that are common on roads, like cars, buses, trucks, motorcycles, people, bicycles, traffic lights, and stop signs. The Mask R-CNN is a more advanced neural network that is based on the Faster R-CNN (He et al., 2017) []. The advantage of the Mask R-CNN over the faster R-CNN is that it is capable of adding semantic segments to the bounding boxes through ROI (region of interest) Align Pooling.
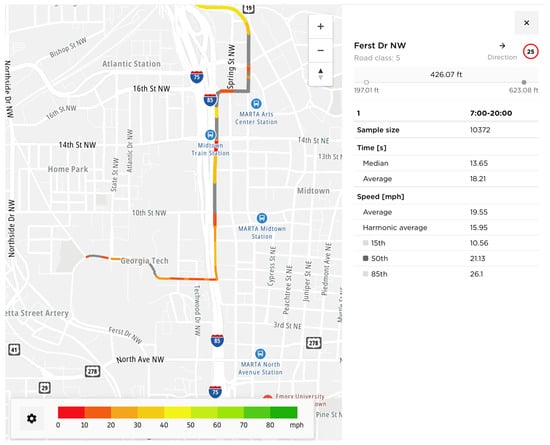
Figure 6.
Example traffic data from TomTom (2023) [].
To make the region detection faster, a separate network, called the Region Proposal Network (RPN), replaces the selected search used in Fast R-CNN (Ren et al., 2015) []. The RPN uses an “anchor box” mechanism. For the training data, many anchor boxes with different sizes will be placed onto a training image with the correct bounding boxes of the object of interest. To determine whether the anchor box is a correct bounding detection, the ratio of the intersection of the two boxes to the union of the two boxes must be calculated. If the ratio is large enough (normally larger than 0.7), then the anchor box is bounding an object, and if the ratio is small (normally smaller than 0.3), then it is not. Figure 7 shows the model formulation of an enhanced Mask R-CNN by incorporating an RPN.
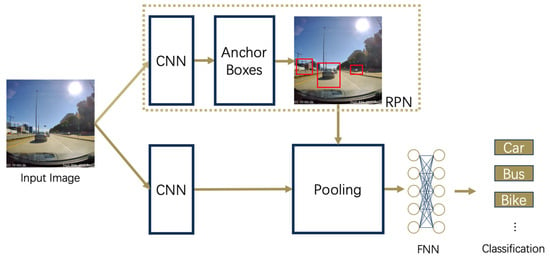
Figure 7.
Formulation of an RPN-enhanced Mask R-CNN model for efficient on-road object detection.
(3) Verification experiments: The enhanced R-CNN is able to provide the number of cars, buses, trucks, or any other possible types of objects that can be on the road. A few test pictures were captured with a 70mai Dash Cam mounted at the top center of the windshield of a midsize sedan. Figure 8a shows an image captured while doing common street driving. Two cars and four people are detected. Figure 8b shows an image captured during highway driving at night. Five cars are detected. Although there is one car that is not detected, this example shows that the neural network is capable of providing a rough range of the number of objects on the road in low light.
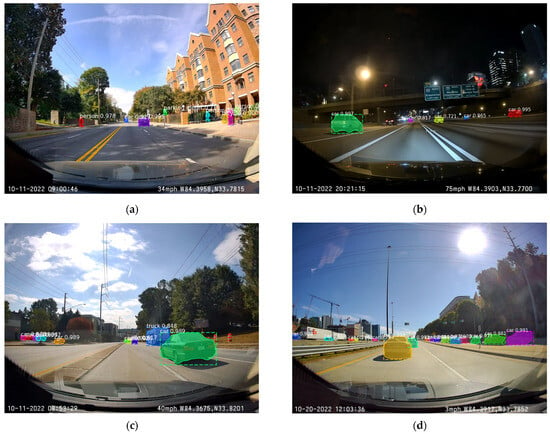
Figure 8.
On-road object visual detection experiments using the RPN-enhanced Mask R-CNN. (a) Street driving. (b) Highway driving at night. (c) Street driving with parked cars. (d) Highway driving with side roads.
However, there are a few limits that exist. Figure 8c shows another street driving situation. There are nine cars and one truck detected by the neural network. This number indicates that the traffic in this situation is much more jammed than what Figure 8a shows. However, the speed indicated at the bottom of the image shows that the car is driving at a very fast speed. Also, half of the cars detected are parked on the side of the street, and they will not affect the traffic on the road.
Figure 8d tells a similar story. It is captured on a side road of a highway. There are 16 cars detected, and the speed does indicate that the traffic is jammed. However, there are only two cars in front of the camera car that are on the same road. It is highly likely that other cars will not affect the traffic conditions that the camera car experiences. Another similar situation would be the two directions of the same road having completely different traffic conditions.
There are some capacity limitations inherent in on-road object visual detection, such as not being able to distinguish whether the objects would affect the travel speed of the camera car of the current neural network. For dynamic fleet routing, knowing only the number of objects on the road is not enough to make the correct route-changing decisions. As such, more aspects should be considered, for which fuzzy logic is further implemented for rerouting decision support.
6. Intelligent Traffic Reasoning for Rerouting Decisions Using Fuzzy Logic
From the camera data and neural networks analysis, the number of objects that can potentially slow the car down is known. However, the truck can still travel at an optimal speed if the objects do not affect the traffic flow. Situations such as parked cars on the side of the road, the traffic on the other side road, or just a wide road with many trucks can easily lead to this error. Therefore, the speed of the truck should also be considered. Fuzzy logic is a logic of approximate reasoning (Zadeh, 1975) [], which is useful for making decisions with multiple considerations.
To eliminate the effects of different types of roads, like highway driving usually being much faster than street driving, the ratio of the truck’s travel speed to the route’s speed limit is used. Based on a priori knowledge of domain experts on fleet operations, the average speed from the last five minutes is used to eliminate the effect of sudden speed changes, like merging and traffic lights. The speed ratio can be represented by an index with the range of 0 to 1 using Equation (2).
where , and denote the speed ratio, average speed of the last 5 min [mph], and speed limit of the current path [mph], respectively.
A fuzzy set is a class of objects with a continuum of grades of membership (Zadeh, 1965) []. In this case, the fuzzy set for the speed ratio is jammed, heavy, normal, and smooth. Equations (3)–(6) are the respective membership functions, as shown in Figure 9.
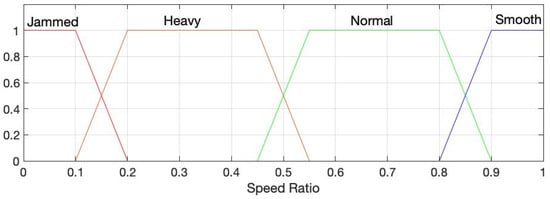
Figure 9.
Speed ratio membership functions.
While the enhanced Mask R-CNN manages to identify the number of objects on the road, simply counting the number can lead to some error estimation because different objects affect the traffic condition differently. For example, a semi-truck is usually slower than cars, takes up a lot of space on the road, and is usually difficult to pass. Thus, a higher weight should be used for making decisions. The indices of such weights for common types of objects on the road are listed in Table 3. The indices and more potential objects that are on the road could be adjusted and added for a more accurate reasoning result.

Table 3.
Index scores of different objects on the road.
The sum of the indices is used as the other decision factor for the fuzzy logic. The fuzzy set for the summation of the object indices is light, medium, and intense. Equations (7)–(9) are the corresponding membership functions, as shown in Figure 10:
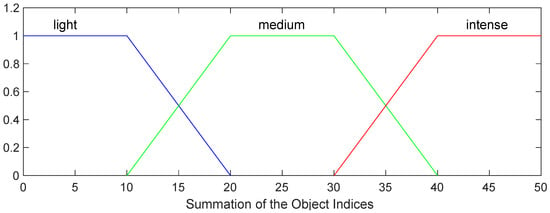
Figure 10.
Object index sum membership functions.
There are three options for rerouting decisions in the system: Change the Route, Follow the Plan, and Let the Driver Decide. Accordingly, the fuzzy rules are defined as listed in Table 4.

Table 4.
Fuzzy rules for rerouting decisions.
When the speed ratio is “smooth” for whatever the object index sum is, the system will still follow the plan. Some possible situations can be a very wide freeway with many trucks that are all traveling at a fast speed or the situation presented in Figure 10. When the speed is slow but there are not many objects detected, it is better to let the driver decide because there could be some object that affects the traffic condition but are not detected by the camera.
7. Dynamic Fleet Routing Optimization of Real-Time Fuel Economy for Reducing GHG Emissions
To incorporate real-time truck weight and traffic condition data into dynamic fleet routing, we formulated a capacitated truck rerouting problem considering a fuel economy and traffic condition (CTRP-FT) model to depict the relationship between the weight of the truck and GHG emissions measured by the FCR of the truck and, in turn, to optimize the tradeoffs between the fuel economy (GHG emissions) and truck rerouting decisions. The objective function and constraints are modified from the conventional CVRP to include more variables in the new dynamic routing model. A heuristic algorithm for solving this CTRP-FT model is developed by leveraging the first solution strategy and the local search with simulated annealing.
The objective of this model is to minimize the total fuel consumed by the fleet, which is related to GHG emissions. The FCR is assumed to be increasing linearly as the weight of the cargo increases based on empirical studies (Carlson, 2013) []. The FCRs are calibrated and input into the system model when the truck is empty and fully loaded, respectively, such that the slope of the linear relationship can be established. The traffic conditions can be simplified as indices. If the traffic from two nodes is heavy, the index should be high, and thus, it will be performed as a penalty when calculating the final cost of the objective function (Peng, 2022) [].
(1) Calculating GHG emissions by fuel economy: Methods for calculating and analyzing the carbon footprint of transportation are still evolving, playing a critical role in managing GHGs that contribute to global warming. Various definitions and methods exist for calculating the transportation carbon footprint (Yaacob, 2020) []. While previous studies have focused on measuring the absolute magnitude of GHG emissions, it is posited that relative measures serve as better indicators of the negative effects of GHG emissions resulting from fuel consumption. The rationale is that improved fuel economy naturally leads to a reduction in GHG emissions, as seen in the ACEEE’s ratings used by Greenercars.org.
By shifting the focus from absolute GHG emissions to relative measures, such as emissions per mile or per ton-mile, we can better assess the efficiency and environmental impact of transportation activities. This approach highlights the importance of optimizing fuel efficiency as a direct means to mitigate GHG emissions. The accurate measurement and analysis of these relative indicators require integrating advanced technologies, including AI, to monitor vehicle activities and predict emissions accurately, thereby supporting more effective policy-making and environmental management strategies.
The principle of measuring GHG emissions in relation to the fuel consumption rate is widely evidenced by many practical applications. For instance, the United States Environmental Protection Agency (EPA) has established a GHG Equivalencies Calculator, which provides references for calculating GHG emissions based on the gallons of fuel consumed (EPA, 2024) []. This tool highlights the direct relationship between fuel consumption and GHG emissions, illustrating how improvements in fuel economy can lead to significant reductions in environmental impact. By using such calculators, both policymakers and individuals can better understand and manage the carbon footprint of their transportation activities, fostering more efficient and sustainable practices.
(2) Modeling real-time fuel economy associated with truck weight sensing data: Intuitively, the truck’s weight should have a negative effect on the FCR, as more weight means that more energy is needed to move the extra weight, although the FCR is affected by many factors, especially for an internal combustion engine, such as the drivetrain efficiency, air density, and gearing. The tractive force required to move a truck is the most important factor that affects the FCR.
The tractive force is the force used to overcome the resistance from the aerodynamic drag, tire rolling resistance, and climbing resistance when the truck is not on level ground. When the tractive force is larger than the combined resistance, the truck will accelerate, which is caused by the extra force. On the contrary, if the tractive force is smaller than the resistance, the truck will decelerate. Assuming negligible climbing resistance (truck running on level ground), the following equation describes the forces (Cheah, 2010) []:
where , , , , , , , , , , , and denote the tractive force [N], aerodynamic drag [N], rolling resistance [N], acceleration force [N], drag coefficient, air density [kg/m3], truck velocity [m/s], truck frontal area [m2], rolling resistance coefficient, truck mass [kg], gravitational acceleration [m/s2], and truck acceleration [m/s2], respectively. Note that the truck mass has a linear relationship with the tractive force needed. Assume the other factors that affect the FCR for the same type of truck are nearly identical. The FCR increases linearly as the truck’s weight is increased. The experimental data also confirmed this assumption. According to the U.S. Department of Energy, the FCR of a Ford Fusion V6 increases linearly as the weight is increased under UDDS, US06, and the Highway drive cycle (Carlson, 2013) []. Therefore, the FCR of the model can be simplified into a linear model:
where is the mass of the load, and and are the slope and the intercept of the linear model, respectively, where two initial calibration runs are needed for each truck to obtain those two parameters. When the truck is empty,
When the truck is fully loaded,
The slope of the model can be written as:
Hence, the linear model of Equation (14) can be written as:
(3) Constraints: The constraints of the CTRP-FT are the same as the CTRP, since there are no additional restrictions introduced to the system, with being denoted as a binary variable, where . If , the route between nodes and is included in the optimal route, which means that there will be one truck, and only truck travels on this node. If , truck will not travel between nodes and . First, no truck can travel from a node to itself.
where is the number of trucks available in the fleet. Then, the truck will leave the node that it enters; so, the total number of times a truck enters a node is equal to the total number of times a truck leaves that node, i.e.,
where is the number of customers or stops. Every node should only be entered once by one truck, as follows:
All trucks should be at the depot at the beginning of the day and the end of the day, i.e.,
Finally, the capacity constraints, i.e., the load on truck between any two nodes and , should not be greater than the capacity of the truck , i.e.,
(4) Formulation of the CTRP-FT objective function: The CTRP-FT is extended from the classic CVRP by introducing more variables and changing the optimization direction. To extend the objective of minimizing the total distance traveled to minimizing the fuel consumed, a relationship between those two parameters is defined.
Note that the FCR is linearly related to the weight of the truck (Carlson, 2013) []. Assuming the cargo weight will not change between two stops, the total weight of the truck, and thus the FCR, will stay constant between two stops. The cargo weight between nodes and is , and thus the FCR is as follows:
Because different trucks may have different fuel consumption models, if truck travels from node to , the FCR is as follows:
The fuel used between nodes and should simply be the product of the FCR and the distance, as follows:
Furthermore, the traffic condition should be introduced into the model as a weighted penalty for the distance between the two nodes. This penalty, called the traffic condition index, , is the ratio of the speed limit of the road to the historical average speed. Because the traffic condition on the same route might be different at a different time, a subscript is added to the equation, as follows:
Summing up the fuel used for all the trucks in the fleet, and adding the binary variable , the objective function is attained, as follows:
(5) CTRP-FT Optimization Model:
| s.t. |
8. Heuristic Algorithm for Solving CTRP-FT Optimization
Like almost all VRPs, the CTRP-FT entails a common type of NP-hard problem. This means that finding the exact solution not only takes a lot of computing power but is also usually not possible. Therefore, heuristic methods are commonly used in solving these types of problems. To efficiently solve the CTRP-FT optimization model, we take advantage of Google OR-Tools (Google, 2023) []. Two algorithms are selected from the tool library: the first solution strategy and the local search algorithm.
(1) The first solution strategy: For illustrative simplicity, assume there is only one truck in the fleet, the capacity of the truck is infinite, and the cost is only the distance. The first solution strategy is simply to go to the nearest unvisited node at each step if there is one depot and four customers with pairwise distances, as listed in Table 5.

Table 5.
Example of a routing problem for the first solution strategy.
Starting from the depot, the next closest step is customer 2, with a distance of 8. At customer 2, the closest next step is customer 4, with a distance of 6. At customer 2, the shortest distance to the next stop is 6, which is to customer 2. However, customer 2 has already been visited; thus, the next-best solution, customer 1, is the next step. Following the same principle, the best route for this example is Depot → Customer 2 → Customer 4 → Customer 1 → Customer 3 → Depot, with a total distance of 48. The pseudocode of this strategy is shown in Table 6.

Table 6.
Pseudocode of the first solution strategy.
(2) Local search with simulated annealing: Using Google OR-Tools, the cost for each truck can be adjusted at each step. Because the current node and the potential next node are known, the distance, the traffic condition, and the extra load needed (customer demand at the next node) are known. The cost between the two nodes can be set as . However, the first solution strategy can be easily trapped in the local minimum, and better solutions are available. In this example, the route “Depot → Customer 1 → Customer 2 → Customer 4 → Customer 3 → Depot” has a lower total distance of 47.
The local search algorithm can be implemented to escape this local minimum with the strategy of simulated annealing. It is a combinatorial search technique inspired by the physical process of annealing (Kirkpatrick et al., 1983) []. During the metal annealing process, if the temperature is high, and thus the cooling rate is high, the atoms inside the metal will be fixed in random places. However, suppose the temperature is cold, and thus, the cooling rate is low. In that case, the atoms will find a configuration with lower internal energy or an organized structure, which can make the metal stronger. The analogy is that at high temperatures, the probability of accepting a worse neighboring solution is high, but doing this is helpful for escaping the local minimum that is near the initial solution. Also, at low temperatures, it tends to choose the better solution more and more. The probability of choosing a new solution can be represented as:
where , and denote the new solution cost, current solution cost, and temperature at the step, respectively. The initial temperature and the cooling rate , where , should also be defined. For the Truck Routing Problem, the first solution can be randomly generated. At each iteration, flipping the sequence of the two adjacent nodes for all possible node pairs (i.e., from ABCDA to ACBDA and ABDCA), pick the best solution, and use Equation (28) to find the new solution. The pseudocode of this strategy is shown in Table 7.

Table 7.
Pseudocode of local search with simulated annealing.
9. Testing Experiment and Performance Comparison
To verify that the CTRP-FT model can provide a better route plan than the conventional CVRP model, customer information, including location and needs, and fleet information, including the number of trucks available, the capacity of each truck, and the FCR model of each truck, are randomly generated. The same data are used by both CTRP-FT and CVRP models to calculate the optimal route plan. The CTRP-FT cost, which includes more variables and is thus more realistic, is calculated and compared with respect to the route plans attained from the CVRP model.
9.1. Simulation Setup for Customer and Fleet Data Generation
(1) Customer location and distance matrix (): A changeable number of customers will be placed on a grid, with the depot located at . The and coordinates of customers are integers randomly generated within the range of −50 to 50. The distance between any two nodes is simplified as the Euclidean Distance using the formula . The distances are stored in a symmetric matrix. The element of row and column represents the distance between the nodes and . It is also possible to generate a nonsymmetric matrix to simulate the situation where there is a one-way path.
(2) Traffic condition index matrix generation (): Similar to the distance matrix, the TCI matrix is also a matrix in which the element of row and column represents the TCI of the route between the nodes and . The TCI here will be a random number within the range of 1 and , a changeable maximum additional TCI. Similar to the speed ratio, a larger TCI here means worse traffic conditions. The matrix does not necessarily have to be symmetric because the traffic conditions on the same route for both directions could be different.
(3) Customer demand vector generation (): The demand from every customer is defined in an vector with a random integer within the range of 0 to , a changeable maximum customer demand.
(4) Fleet capacity vector generation (): Similar to the customer demand vector, the capacity of each truck is stored in a vector, where is the number of trucks available in the fleet. The capacities will be a random integer between 5000 and , a changeable maximum additional capacity. By doing this addition instead of directly using a random number, unrealistic situations, such as a truck with too little capacity or a truck with a capacity that is hundreds of times greater than that of the other truck, will be avoided.
(5) Fleet fuel consumption model generation (): In practice, the bigger, heavier, or more capable trucks tend to have a larger FCR. In order to generate a more representative fleet, the empty weight of each truck, , will be randomly generated as an integer between 5000 and , a changeable additional empty weight. An FCR index, , is also generated within the range of 0 and , a changeable maximum FCR index. The two ends of the FCR model are the FCR when the truck is empty and the FCR when the truck is and , respectively.
9.2. Code Setup and Computing Time
The entire simulation can be implemented in Python 3.9 and Google OR-Tools. This tool is capable of solving the CVRP model directly, providing the possibility of adding more constraints or modifying the cost of each truck. Because the CTRP-FT is based on the CVRP, the traffic condition is added to the code by multiplying the distance matrix by the traffic condition matrix elementwise, and the FCR between two nodes is implemented by changing the cost of each truck at each step for all the iterations. The FCR is calculated with the weight, the slope index, and the FCR when the truck is empty. Thus, the FCR between two nodes of each specific truck can be calculated and updated at each step of the model.
Because this calculation is light for computers, the computing for the CVRP and the CTRP-FT models takes nearly an identical amount of time. For the setup of five trucks and 10 customers, Google OR-Tools can solve one problem using the first solution strategy for about 1 s for both models.
9.3. Simulation Case I—Small Fleet and Symmetric Path
(1) Generated customer and fleet: The input parameters for all the changeable parameters described in the previous section are listed in Table 8. The generated customer location and needs are shown in Figure 11. The generated distance matrix and the generated TCI matrix are shown in Table A1 and Table A2 in Appendix A, respectively. The generated fleet information is shown in Table 9.

Table 8.
Input parameters for customer and fleet generation: Case I.
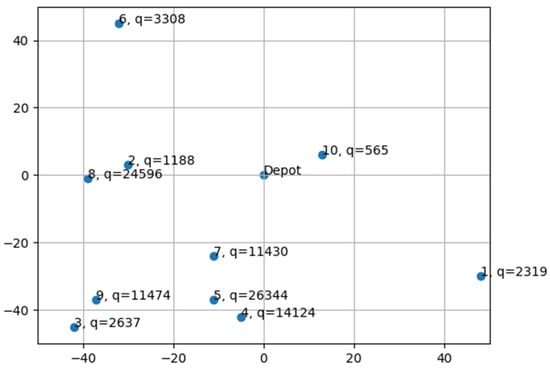
Figure 11.
Generated customer locations and demands: Case I.

Table 9.
Generated fleet information: Case I.
(2) Simulation result: Detailed stops for the CTRP-FT plan are listed in Table 10, and those for the CVRP plan are listed in Table 11. It is clear that the routes assigned from the two models are completely different. Figure 12 shows the route planned by the two models. Table 12 summarizes the cost derived from the two models. The routing plan from the CTRP-FT model has a total traveling distance of about 52.2 km more than that from the CVRP model. However, after considering the traffic condition and fuel consumption, it uses 117.61 L less fuel than that from the CVRP model.

Table 10.
Route planned by CTRP-FT model: Case I.

Table 11.
Route planned by CVRP model: Case I.
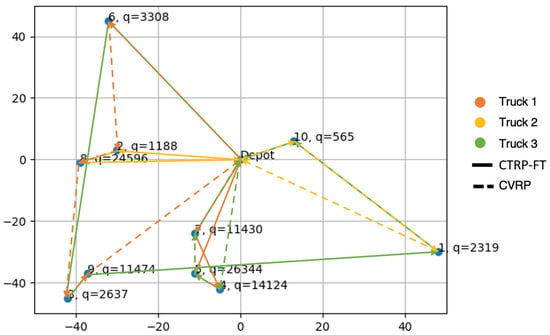
Figure 12.
Route traveled by each truck planned by both models: Case I.

Table 12.
Costs from two models: Case I.
9.4. Simulation Case II—Large Fleet and Nonsymmetric Path
(1) Generated customer and fleet: The second simulation study is meant to simulate the parcel services in an urban area. With more customers involved but all having a smaller demand, the delivery truck fleet contains a larger number of smaller trucks. However, the distances between the customers are much closer due to the urban area’s complex routing. The path between two locations might only be one-way. Therefore, in this simulation, there are 40 customers, 10 trucks, and a 50% possibility that a path is one-way.
Details about the input parameters are listed in Table 13. The generated customer location is shown in Figure 13, and the demand is shown in Table 14. The distance matrix is shown in Figure A1 in Appendix B, where the elements highlighted in red mean that the route between and is a one-way (where is the row and is the column). The traffic condition index matrix is shown in Figure A2 in Appendix B. The generated fleet information is shown in Table 15.

Table 13.
Input parameters for customer and fleet generation: Case II.
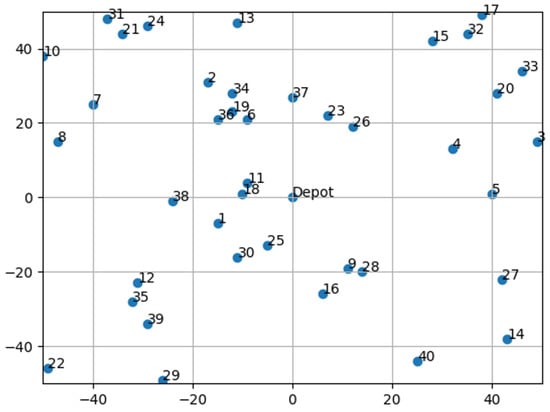
Figure 13.
Generated customer locations: Case II.

Table 14.
Generated customer demands: Case II.

Table 15.
Generated fleet information: Case II.
(2) Simulation result: Detailed stops for the CTRP-FT plan are listed in Table 16, and those for the CVRP plan are listed in Table 17. It is clear that the routes assigned from the two models are completely different for this case as well. It is notable that for the CTRP-FT-generated plan, trucks 1, 4, 5, and 6 are not used, and for the CVRP-generated plan, trucks 1, 2, and 6 are not used. All unused trucks have a relatively low capacity. The CTRP-FT model tries to finish the same tasks with fewer trucks and uses truck 2 instead of truck 4, which has the advantage of a low FCR. These prove that both models consider the capacity constraint, and only the new model considers the FCR.

Table 16.
Route planned by CTRP-FT model: Case II.

Table 17.
Route planned by CVRP model: Case II.
Table 18 summarizes the cost derived from the two models. The routing plan from the CTRP-FT model has a total traveling distance of about 213.1 km more than that from the CVRP model. However, after considering the traffic condition and fuel consumption, it uses 110.75 L less fuel than that from the CVRP model. This trend is the same as in simulation case I.

Table 18.
Cost from both models: Case II.
9.5. Reliability Test
Both simulation cases show that the CTRP-FT model travels a longer distance than the CVRP model but consumes less fuel. Because the data are randomly generated, it is possible that the advantage is not true for any possible cases. Therefore, 100 runs of simulation are conducted with the input parameters shown in Table 19. It is the same setup as Case I, but with five trucks in the fleet. This makes it less likely that there is no solution to the problem. The capacity of the truck will be more likely to satisfy the customers’ needs.

Table 19.
Simulation run with input parameters for the reliability test.
The result once more confirms that the new model is better. Within the 100 runs, there are 91 runs when the CTRP-FT uses less fuel, 8 runs when either the model has no solution, and only 1 run when CVRP uses less fuel, as visually indicated in Figure 14 and Figure 15. While CTRP-FT generally travels longer distances, it consumes less fuel in 98.9% of the feasible cases.
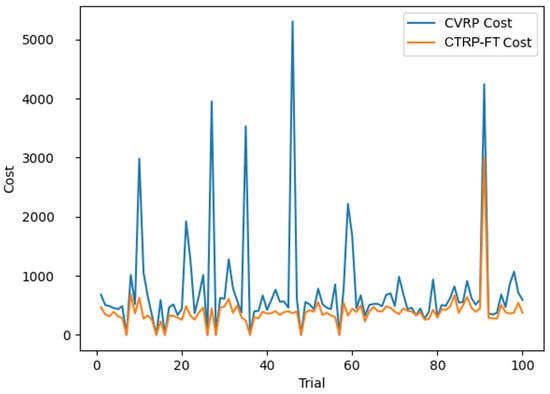
Figure 14.
Reliability test result of the fuel used.
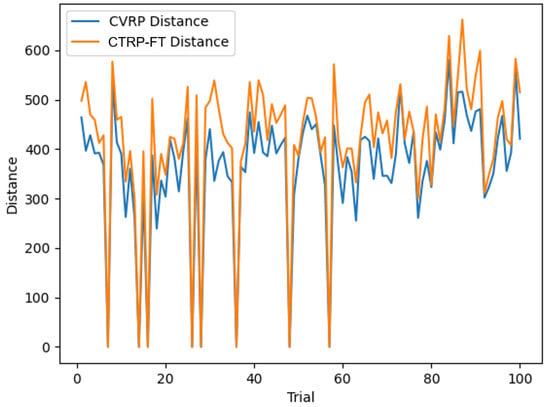
Figure 15.
Reliability test result of the distance traveled.
The potential reasons for the no-solution cases could be that the total customers’ demand is larger than the entire fleet capacity or that one consumer has a demand that is larger than the truck with the largest possible capacity in the fleet. The potential reason for the one case in which CVRP is better could be that the solution is only a local minimum or that the traffic condition does not have any effect at that time.
9.6. Model Verification
Simulations constructed with randomly generated data verify the feasibility of the proposed model for dynamic fleet routing. The result verifies the main hypothesis of the model that the minimal traveling distance does not necessarily mean the minimum cost, considering fuel efficiency, cargo weight, and traffic conditions. These factors cannot be ignored in the real world.
In the first case, the proposed model is capable of using 17.19% less fuel, although the total traveled distance is 12.32% more than the CVRP model. In the second case, the proposed model is capable of using 9.03% less fuel, although the total traveled distance is 19.99% more than the CVRP model. The reliability tests show that this trend holds true for 98.9% of the feasible cases. This is solid proof that the CTRP-FT model can better tackle the real-time fuel economy issue encountered by many real-world courier companies in their fleet operation management.
10. Concluding Remarks
This paper presents a machine learning-driven approach that harnesses smart data analytics and intelligent reasoning to address the complex challenges of dynamic fleet routing, with the goal of minimizing GHG emissions and fuel consumption. The proposed methodology emphasizes real-time route optimization, prioritizing fuel efficiency to reduce emissions, while continuously adapting to evolving vehicle and traffic data. By integrating real-time data sources, the system enhances the precision of route planning and maintains up-to-date responsiveness. This adaptability enables swift reactions to unexpected events, allowing for on-the-fly adjustments that ensure efficient, low-emission fleet operations.
Centered on fuel economy as a means to reduce GHG emissions, the system places particular emphasis on weight detection, traffic condition assessment, and a robust optimization model. Beyond simply accounting for vehicle load and traffic data, it also integrates driver interaction and inter-subsystem communication. By combining advanced technologies, data-driven modeling, and fuel efficiency, this research aims to redefine the landscape of freight transportation. The ultimate objective is to deliver cost-effective, environmentally sustainable solutions that are both practical and scalable in real-world applications.
The paper introduces a machine learning-powered system architecture that integrates smart data analytics and intelligent reasoning to enhance the operational efficiency of truck fleets while minimizing GHG emissions. The system is primarily focused on optimizing fuel consumption and analyzing the diverse factors that influence it. The architecture is composed of two interconnected subsystems, each contributing to a comprehensive and adaptive solution for sustainable freight transportation.
The first subsystem, embedded within each truck, facilitates real-time data acquisition by performing key functions such as weight monitoring, traffic condition assessment, and driver behavior analysis. These capabilities are enabled through universally compatible hardware that is easy to install and maintain, ensuring that vehicle safety remains uncompromised. The central focus of this paper is the detailed exploration of the weight detection mechanism, which utilizes two accelerometers, in conjunction with the Fourier transform and regression techniques, to deliver real-time weight estimations. To validate this approach, a series of experiments is conducted using a pickup truck as the test platform.
Furthermore, the paper explores the principles and methodologies behind the traffic condition monitoring subsystem. During dynamic route planning, traffic conditions are inferred from historical data provided by a third-party service. To address unexpected events encountered en route, a cabin-mounted camera employs neural networks to detect road obstacles in real time. A fuzzy logic rule is then applied, using the ratio of the truck’s average speed over the past five minutes to the designated speed limit for the route. This approach enables informed and adaptive decision-making regarding potential route adjustments.
The second subsystem is responsible for leveraging the data collected by the onboard subsystem. At its core is a customized capacitated vehicle routing model (CVRP), specifically designed to minimize fuel consumption while accounting for all variables captured in real time, including vehicle-specific fuel consumption rates and dynamic traffic conditions. To solve this complex optimization problem, the system employs heuristic algorithms, namely, an initial solution strategy, followed by local search enhanced with simulated annealing. Extensive simulations validate the effectiveness of the proposed model, consistently generating routes that achieve lower fuel consumption compared to traditional CVRP approaches.
While the primary objective of this novel system is to reduce fuel consumption—and consequently GHG emissions—its foundational principles are adaptable to alternative energy sources, such as electricity. In the context of electric vehicles (EVs), a similar challenge arises in optimizing charging efficiency. This system holds significant potential to enhance the EV range and reduce charging time, thereby improving the overall efficiency of electric truck routing for goods delivery.
However, several limitations identified in this study warrant further investigation in future research. Although a conceptual framework for driver behavior monitoring is proposed, a more comprehensive exploration of methodologies and prototype validation is needed. Incorporating additional behavioral factors—such as driver mood (e.g., anger and fatigue)—could further enrich the model’s accuracy and robustness [] (Zhou et al., 2014). Moreover, the design of inter-subsystem communication protocols should be approached with precision, especially as hardware components are prototyped and integrated.
Author Contributions
Conceptualization, J.P. and R.J.J.; methodology, J.P., R.J.J. and F.Z.; software, J.P.; validation, J.P.; formal analysis, J.P.; investigation, J.P., R.J.J. and F.Z.; resources, R.J.J. and F.Z.; data curation, J.P.; writing—original draft preparation, J.P. and R.J.J.; writing—review and editing, R.J.J. and F.Z.; visualization, J.P.; supervision, R.J.J. and F.Z.; project administration, R.J.J. All authors have read and agreed to the published version of the manuscript.
Funding
This research received no external funding.
Data Availability Statement
Data available in the Appendix A and Appendix B.
Acknowledgments
Bilal Ali, Matthew Moore, Aman More, Matthew Murray, George Smirnov, and Angie Zhang are acknowledged for their groundwork in truck weight sensing hardware development, testing, and field studies.
Conflicts of Interest
The authors declare no conflicts of interest.
Appendix A. Generated Distance and TCI Matrices for Testing Case I

Table A1.
Generated distance matrix of Case I.
Table A1.
Generated distance matrix of Case I.
| 0 | 56.60 | 30.15 | 61.55 | 42.30 | 38.60 | 55.22 | 26.40 | 39.01 | 52.33 | 14.32 |
| 56.60 | 0 | 84.69 | 91.24 | 54.34 | 59.41 | 109.7 | 59.30 | 91.71 | 85.29 | 50.21 |
| 30.15 | 84.69 | 0 | 49.48 | 51.48 | 44.28 | 42.05 | 33.02 | 9.85 | 40.61 | 43.10 |
| 61.55 | 91.24 | 49.48 | 0 | 37.12 | 32.02 | 90.55 | 37.44 | 44.10 | 9.43 | 75.01 |
| 42.30 | 54.34 | 51.48 | 37.12 | 0 | 7.81 | 91.09 | 18.97 | 53.26 | 32.39 | 51.26 |
| 38.60 | 59.41 | 44.28 | 32.02 | 7.81 | 0 | 84.65 | 13.00 | 45.61 | 26.00 | 49.24 |
| 55.22 | 109.7 | 42.05 | 90.55 | 91.09 | 84.65 | 0 | 72.12 | 46.53 | 82.15 | 59.55 |
| 26.40 | 59.30 | 33.02 | 37.44 | 18.97 | 13.00 | 72.12 | 0 | 36.24 | 29.07 | 38.42 |
| 39.01 | 91.71 | 9.85 | 44.10 | 53.26 | 45.61 | 46.53 | 36.24 | 0 | 36.06 | 52.47 |
| 52.33 | 85.29 | 40.61 | 9.43 | 32.39 | 26.00 | 82.15 | 29.07 | 36.06 | 0 | 65.95 |
| 14.32 | 50.21 | 43.10 | 75.01 | 51.26 | 49.24 | 59.55 | 38.42 | 52.47 | 65.95 | 0 |

Table A2.
Generated TCI matrix of Case I.
Table A2.
Generated TCI matrix of Case I.
| 3.093 | 3.312 | 1.553 | 3.616 | 1.993 | 1.182 | 1.902 | 3.007 | 2.213 | 3.780 | 1.854 |
| 3.058 | 2.864 | 1.217 | 1.205 | 1.498 | 3.104 | 3.230 | 2.692 | 3.690 | 1.590 | 3.113 |
| 1.131 | 3.905 | 1.438 | 1.215 | 2.787 | 3.327 | 1.820 | 2.265 | 2.566 | 1.064 | 1.655 |
| 3.265 | 2.314 | 3.198 | 3.129 | 3.919 | 2.636 | 3.045 | 3.324 | 1.536 | 3.036 | 2.203 |
| 3.733 | 2.163 | 2.062 | 3.876 | 3.935 | 2.035 | 2.600 | 3.419 | 2.395 | 2.565 | 1.784 |
| 1.934 | 2.017 | 2.985 | 1.876 | 1.670 | 1.321 | 2.345 | 3.646 | 2.439 | 3.962 | 1.869 |
| 3.743 | 2.811 | 2.178 | 1.066 | 3.343 | 2.956 | 1.168 | 2.077 | 3.656 | 2.979 | 2.643 |
| 3.683 | 2.597 | 1.269 | 1.139 | 2.092 | 3.314 | 3.600 | 1.135 | 1.403 | 1.366 | 2.578 |
| 1.788 | 1.519 | 2.645 | 3.044 | 2.848 | 2.787 | 2.971 | 2.763 | 2.664 | 2.746 | 1.718 |
| 2.852 | 1.129 | 3.306 | 1.770 | 1.725 | 3.005 | 3.541 | 1.799 | 1.290 | 2.110 | 2.445 |
| 1.620 | 3.961 | 3.677 | 1.879 | 2.277 | 3.304 | 3.371 | 2.732 | 1.487 | 3.789 | 2.283 |
Appendix B. Generated Distance and TCI Matrices for Testing Case II
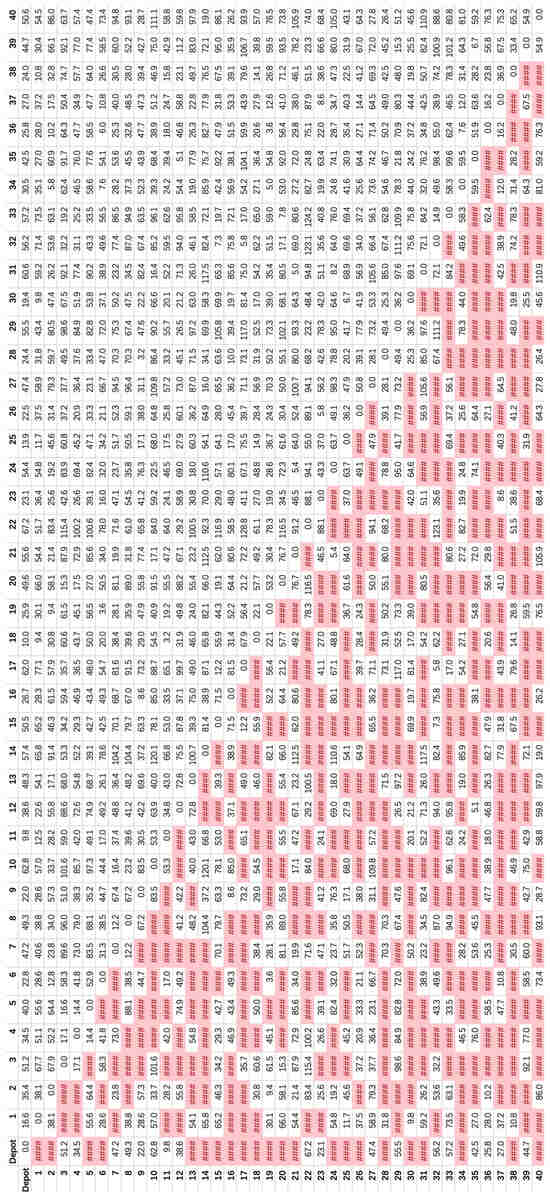
Figure A1.
Generated distance matrix of Case II.

Figure A2.
Generated TCI matrix of Case II.
References
- Herzog, T.; Pershing, J.; Baumert, K.A. Navigating The Numbers: Greenhouse Gas Data and International Climate Policy; World Resources Institute (WRI): Washington, DC, USA, 2005. [Google Scholar]
- IPCC. The Fifth Assessment Report of IPCC. Intergovernmental Panel on Climate Change, 2017. Available online: https://www.ipcc.ch/assessment-report/ar5/ (accessed on 24 January 2024).
- Shaheen, S.A.; Lipman, T.E. Reducing Greenhouse Emissions And Fuel Consumption: Sustainable Approaches for Surface Transportation. IATSS Res. 2007, 31, 6–20. [Google Scholar] [CrossRef]
- Rinchi, O.; Alsharoa, A.; Shatnawi, I.; Arora, A. The Role of Intelligent Transportation Systems and Artificial Intelligence in Energy Efficiency and Emission Reduction. arXiv 2024, arXiv:2401.14560. [Google Scholar] [CrossRef]
- Kan, Z.; Tang, L.; Kwan, M.P.; Zhang, X. Estimating vehicle fuel consumption and emissions using GPS big data. Int. J. Environ. Res. Public Health 2018, 15, 566. [Google Scholar] [CrossRef]
- McLeod, F.; Cherrett, T.; Bates, O.; Bektaş, T.; Lamas-Fernandez, C.; Allen, J.; Piotrowska, M.; Piecyk, M.; Oakey, A. Collaborative parcels logistics via the carrier’s carrier operating model. Transp. Res. Rec. 2020, 2674, 384–393. [Google Scholar] [CrossRef]
- Zeimpekis, V.S.; Tarantilis, C.D.; Giaglis, G.M.; Minis, I.E. Dynamic Fleet Management: Concepts, Systems, Algorithms & Case Studies; Springer Science & Business Media: Berlin/Heidelberg, Germany, 2007. [Google Scholar]
- Horváth, M.T.; Mátrai, T.; Tóth, J. Route planning methodology with four-step model and dynamic assignments. Transp. Res. Procedia 2017, 27, 1017–1025. [Google Scholar] [CrossRef]
- Nguyen Duc, D.; Tran Huu, T.; Nananukul, N. A dynamic route-planning system based on industry 4.0 technology. Algorithms 2020, 13, 308. [Google Scholar] [CrossRef]
- Figliozzi, M.A.; Mahmassani, H.S.; Jaillet, P. Pricing in dynamic vehicle routing problems. Transp. Sci. 2007, 41, 302–318. [Google Scholar] [CrossRef]
- Turan, B.; Pedarsani, R.; Alizadeh, M. Dynamic pricing and fleet management for electric autonomous mobility on demand systems. Transp. Res. Part C Emerg. Technol. 2020, 121, 102829. [Google Scholar] [CrossRef]
- Liebig, T.; Piatkowski, N.; Bockermann, C.; Morik, K. Dynamic route planning with real-time traffic predictions. Inf. Syst. 2017, 64, 258–265. [Google Scholar] [CrossRef]
- Seyyedhasani, H.; Dvorak, J.S. Dynamic rerouting of a fleet of vehicles in agricultural operations through a Dynamic Multiple Depot Vehicle Routing Problem representation. Biosyst. Eng. 2018, 171, 63–77. [Google Scholar] [CrossRef]
- Ninikas, G.; Minis, I. The effect of limited resources in the dynamic vehicle routing problem with mixed backhauls. Information 2020, 11, 414. [Google Scholar] [CrossRef]
- Wang, Y.; Zhang, J.; Assogba, K.; Liu, Y.; Xu, M.; Wang, Y. Collaboration and transportation resource sharing in multiple centers vehicle routing optimization with delivery and pickup. Knowl. Based Syst. 2018, 160, 296–310. [Google Scholar] [CrossRef]
- Psaraftis, H.N.; Wen, M.; Kontovas, C.A. Dynamic vehicle routing problems: Three decades and counting. Networks 2016, 67, 3–31. [Google Scholar] [CrossRef]
- Dantzig, G.B.; Ramser, J.H. The Truck Dispatching Problem. Manag. Sci. 1959, 6, 80–91. [Google Scholar] [CrossRef]
- Zhou, M.; Jin, H.; Wang, W. A review of vehicle fuel consumption models to evaluate eco-driving and eco-routing. Transp. Res. Part D Transp. Environ. 2016, 49, 203–218. [Google Scholar] [CrossRef]
- Yao, E.; Lang, Z.; Yang, Y.; Zhang, Y. Vehicle routing problem solution considering minimising fuel consumption. IET Intell. Transp. Syst. 2015, 9, 523–529. [Google Scholar] [CrossRef]
- Miao, C.; Liu, H.; Zhu, G.G.; Chen, H. Connectivity-based optimization of vehicle route and speed for improved fuel economy. Transp. Res. Part C Emerg. Technol. 2018, 91, 353–368. [Google Scholar] [CrossRef]
- Li, S.; Timmins, C.; Von Haefen, R.H. How do gasoline prices affect fleet fuel economy? Am. Econ. J. Econ. Policy 2009, 1, 113–137. [Google Scholar] [CrossRef]
- Keith, D.R.; Houston, S.; Naumov, S. Vehicle fleet turnover and the future of fuel economy. Environ. Res. Lett. 2019, 14, 021001. [Google Scholar] [CrossRef]
- Right Weigh. Air Suspension Load Scale. 2023. Available online: https://rightweigh.com.au/ (accessed on 24 January 2024).
- Chen, Y. Intelligent Vehicle Load Measuring System and Method. U.S. Patent 7,881,903, 1 February 2011. [Google Scholar]
- Trimble Inc. Vehicle Weight Sensor Based on Wheel Rim Strain Measurements. U.S. Patent 9,068,878, 30 June 2015. [Google Scholar]
- Brown, D. Method of Monitoring a Load Condition of a Vehicle. U.S. Patent 7,761,258, 20 July 2020. [Google Scholar]
- Creative Microsystems. Weight Measurement Apparatus for Vehicles. U.S. Patent 6,118,083, 4 September 1998. [Google Scholar]
- Flood, M.M. The Traveling-Salesman Problem. Oper. Res. 1956, 4, 61–75. [Google Scholar] [CrossRef]
- Solomon, M.M.; Desrosiers, J. Time Window Constrained Routing and Scheduling Problems. Transp. Sci. 1988, 22, 1–81. [Google Scholar] [CrossRef]
- Hsu, C.; Hung, S.; Li, H. Vehicle Routing Problem with Time-Windows for Perishable Food Delivery. J. Food Eng. 2004, 80, 465–475. [Google Scholar] [CrossRef]
- Zhang, Y.; Chen, X.D. An Optimization Model for the Vehicle Routing Problem in Multi-product Frozen Food Delivery. J. Appl. Res. Technol. 2014, 12, 239–250. [Google Scholar] [CrossRef]
- Archetti, C.; Speranza, M.G.; Vigo, D. Vehicle Routing Problems with Profits. In Vehicle Routing: Problems, Methods, and Applications, 2nd ed.; SIAM: Philadelphia, PA, USA, 2014; pp. 273–298. [Google Scholar]
- Koç, Ç.; Laporte, G.; Tükenmez, İ. A Review of Vehicle Routing with Simultaneous Pickup and Delivery. Comput. Oper. Res. 2020, 122, 104987. [Google Scholar] [CrossRef]
- Azi, N.; Gendreau, M.; Potvin, J.Y. A dynamic vehicle routing problem with multiple delivery routes. Ann. Oper. Res. 2012, 199, 103–112. [Google Scholar] [CrossRef]
- Erdelić, T.; Carić, T. A Survey on the Electric Vehicle Routing Problem: Variants and Solution Approaches. J. Adv. Transp. 2019, 2019, 5075671. [Google Scholar] [CrossRef]
- Goel, R.; Maini, R. Vehicle Routing Problem and Its Solution Methodologies: A Survey. Int. J. Logist. Syst. Manag. 2017, 28, 419–435. [Google Scholar] [CrossRef]
- Jourdan, L.; Basseur, M.; Talbi, E.G. Hybridising Exact Methods and Metaheuristics: A Taxonomy. Eur. J. Oper. Res. 2009, 199, 620–629. [Google Scholar] [CrossRef]
- Clarke, G.U.; Wright, J.W. Scheduling of Vehicles from a Central Depot to a Number of Delivery Points. Oper. Res. 1964, 12, 568–581. [Google Scholar] [CrossRef]
- Joubert, J.W.; Classen, S.J. A Sequential Insertion Heuristic for the Initial Solution to a Constrained Vehicle Routing Problem. ORiOn 2006, 22, 105–116. [Google Scholar] [CrossRef]
- Glover, F. Tabu Search: A Tutorial. Interfaces 1990, 20, 74–94. [Google Scholar] [CrossRef]
- Akhand, M.A.H.; Peya, Z.J.; Sultana, T.; Mahmud, A. Solving Capacitated Vehicle Routing Problem with Route Optimization using Swarm Intelligence. In Proceedings of the 2nd International Conference on Electrical Information and Communication Technologies, EICT 2015, Khulna, Bangladesh, 10–12 December 2015. [Google Scholar]
- Kirkpatrick, S.; Gelatt, C.D.; Vecchi, M.P. Optimization by Simulated Annealing. Science 1983, 220, 671–680. [Google Scholar] [CrossRef]
- Voudouris, C.; Tsang, E. Guided Local Search. In Handbook of Metaheuristics. International Series in Operations Research & Management Science; Springer: Cham, Switzerland, 1995; Volume 57. [Google Scholar]
- Bereteu, L.; Perescu, A. Quarter Car Suspension System with One Degree of Freedom Simulated Using Simulink. Ann. West Univ. Timisoara Phys. 2012, 56, 88–93. [Google Scholar] [CrossRef]
- Girshick, R. Fast R-CNN. In Proceedings of the IEEE International Conference on Computer Vision 2015, Santiago, Chile, 7–13 December 2015; pp. 1440–1448. [Google Scholar]
- Zadeh, L.A. Fuzzy Logic and Approximate Reasoning. Synthese 1975, 30, 407–428. [Google Scholar] [CrossRef]
- Lin, T.; Maire, M.; Belongie, S.; Hays, J.; Perona, P.; Ramanan, D.; Dollár, P.; Zitnick, C.L. Microsoft Coco: Common Objects in Context. In Proceedings of the 13th European Conference on Computer Vision—ECCV 2014, Zurich, Switzerland, 6–12 September 2014; Springer: Cham, Switzerland, 2014. [Google Scholar]
- He, K.; Gkioxari, G.; Dollár, P.; Girshick, R. Mask R-CNN. In Proceedings of the 2017 IEEE International Conference on Computer Vision (ICCV), Venice, Italy, 22–29 October 2017. [Google Scholar]
- TomTom. TomTom Traffic Stats. 2023. Available online: https://www.tomtom.com/products/traffic-stats/ (accessed on 24 January 2024).
- Ren, S.; He, K.; Girshick, R.; Sun, J. Faster R-CNN: Towards Real-Time Object Detection with Region Proposal Networks. In Proceedings of the Conference and Workshop on Neural Information Processing Systems, Montreal, QC, Canada, 7–12 December 2015. [Google Scholar]
- Zadeh, L.A. Fuzzy sets. Inf. Control 1965, 8, 338–353. [Google Scholar] [CrossRef]
- Carlson, R. Vehicle Mass Impact on Vehicle Losses and Fuel Economy. In Proceedings of the DOE Vehicle Technologies Program Annual Merit Review 2013, Arlington, VA, USA, 13–17 May 2013. [Google Scholar]
- Peng, J. Smart Sensing and Neural Network Based Reasoning for Optimal Fleet Route Planning with Fuel Economy. Master’s Thesis, Georgia Institute of Technology, Atlanta, GA, USA, 2022. Available online: http://hdl.handle.net/1853/70189 (accessed on 24 January 2024).
- Yaacob, N.F.F.; Mat Yazid, M.R.; Abdul Maulud, K.N.; Ahmad Basri, N.E. A review of the measurement method, analysis and implementation policy of carbon dioxide emission from transportation. Sustainability 2020, 12, 5873. [Google Scholar] [CrossRef]
- EPA. Greenhouse Gases Equivalencies Calculator-Calculations and References. 2024. Available online: https://www.epa.gov/energy/greenhouse-gases-equivalencies-calculator-calculations-and-references#:~:text=The%20amount%20of%20carbon%20dioxide,of%20gasoline%20consumed%E2%80%9D%20section%20above (accessed on 24 January 2024).
- Cheah, L.W. Cars on Diet: The Material Energy Impacts of Passenger Vehicle Weight Reduction in the U.S. Ph.D. Thesis, Massachusetts Institute of Technology, Cambridge, MA, USA, 2010. [Google Scholar]
- Google. Google OR-Tools Routing Guide. 2023. Available online: https://developers.google.com/optimization/routing (accessed on 24 January 2024).
- Zhou, F.; Ji, Y.; Jiao, R.J. Augmented affective-cognition for usability study of in-vehicle system user interface. J. Comput. Inf. Sci. Eng. 2014, 14, 021001. [Google Scholar] [CrossRef]
Disclaimer/Publisher’s Note: The statements, opinions and data contained in all publications are solely those of the individual author(s) and contributor(s) and not of MDPI and/or the editor(s). MDPI and/or the editor(s) disclaim responsibility for any injury to people or property resulting from any ideas, methods, instructions or products referred to in the content. |
© 2025 by the authors. Licensee MDPI, Basel, Switzerland. This article is an open access article distributed under the terms and conditions of the Creative Commons Attribution (CC BY) license (https://creativecommons.org/licenses/by/4.0/).