You are currently viewing a new version of our website. To view the old version click .
Systems
  • Article
  • Open Access

8 December 2023

Identification of Innovative Opportunities Based on Product Scenario Evolution

,
,
,
and
1
School of Mechanical Engineering, Hebei University of Technology, Tianjin 300401, China
2
National Engineering Research Center for Technological Innovation Method and Tool, Hebei University of Technology, Tianjin 300401, China
3
Department of Mechanical Engineering, University of Manitoba, Winnipeg, MB R3T 5V6, Canada
4
School of Mechanical Engineering, Tianjin University of Commerce, Tianjin 300134, China
This article belongs to the Topic Advanced Paradigms, Systems and Enabling Technologies for Product Life Cycle

Abstract

Innovation is a key factor for product development. Identifying innovative opportunities is the first step in innovative product design. Traditional methods of identifying innovative opportunities, such as market surveys and brainstorming, are limited by product users’ and designers’ experiences and lack systematic approaches to generate breakthrough innovations. This paper proposes a method to identify innovative opportunities based on product scenario evolution. The method models a product scenario based on product scenario elements, states, and behaviors. A Type II hierarchical function model is constructed based on the transformation and abstraction hierarchy of the product function model to identify target elements for the scenario evolution. Based on the theory of basic element extension and needs evolution characteristics, the method of extending target scenario elements is proposed. Based on the new scenario element sets and their impact, diffusion, identification, and evaluation methods are proposed for innovation opportunities. Potential opportunities are explored for product innovation from a scenario evolutionary perspective, which updates knowledge and technology reserves and finds new market opportunities for industries. The feasibility and effectiveness of the method are verified using the innovative design of a polyethylene (PE) pipeline hot-melt welding machine.

1. Introduction

Innovation is key to a given industry’s ability to maintain a competitive advantage in the constantly changing market [,]. Innovation opportunities provide chances for product developers to improve and meet unsatisfied or incompletely met needs of existing or new products by introducing new technologies, knowledge, or ideas [,]. Innovative product design is based on innovation opportunities through using design methods and combining user, technology, business, and other factors to create novel products [,,]. The innovation opportunity can be defined as “the possibility of realizing the potential economic value inherent in new combinations of resources and market demands that result from changes in the underlying scientific or technological knowledge, customer preferences, or the interrelationships between economic actors” []. Therefore, product innovation relies on innovation opportunities that provide a driving force and direction for innovation. Searching for and capturing innovation opportunities, as well as applying effective product innovative design methods, will therefore provide a strong support system for companies attempting to enhance their competitive advantage in the market.
Innovation opportunities come from changes in user needs, social factors, the market environment, technological developments, and competitors [,,,,,]. These changes can generate new needs, problems, contradictions, or constraints, providing the possibility and motivation for product innovation. For example, developments in the Internet have changed our behaviors and habits in many aspects of life, such as in information acquisition, communication, and shopping. Related changes have brought many innovation opportunities, such as Internet-based search engines, social networks, and e-commerce platforms []. Considering a product’s lifecycle [], innovation opportunities may come from different requirements in terms of product design, manufacturing, use, or recycling. According to the source and location, innovation opportunities can be classified as technology- and market-driven opportunities; these rely on the coordination of multiple environmental factors []. Overall, innovation opportunities arise from scientific and technological developments, changing user needs and social requirements.
Earlier research has developed a variety of innovation opportunity acquisition methods from multiple perspectives. For determining the necessary routes of product improvement, there are different methods available, such as brainstorming, mind mapping, SCAMPER, and TRIZ [,,,]. For determining the necessary routes of technological developments, there are various methods available, such as technology prediction, bionic designs, and analogical designs [,,]. For determining shifts in user needs, there are various established methods, such as questionnaires, focus groups, and customer interviews; these approaches gather users’ voices and understand users’ needs, the problems in existing products, and the gaps that exist between user expectations and reality []. For analyzing competitors, there are methods available, such as design-around approaches, reverse engineering, and open innovation [,,]. These methods provide guidance for accessing innovation opportunities, but they suffer from poor results and low success rates.
The scenario approach was originally developed to meet the needs of the United States Department of Defense’s military and was later applied in social analysis and policy development []. Beginning in the 1960s, the scenario approach was used to understand future business environments and successfully predicted a significant increase in the price of oil based on the world market []. This landmark success was a symbol of the proven practicality and adaptability of the scenario approach, which was then gradually extended to multiple application areas.
The scenario approach has developed three dominant schools: Intuitive Logics, Probabilistic Modified Trends, and La Prospective [,]. They emerged from different backgrounds with different characteristics, which has made the scenario approach concept confusing over the years []. However, after summarizing and synthesizing numerous previous studies, Matthew, J.S. defines scenarios as a set of possible and reasonable descriptive alternatives based on future external forces []. Therefore, scenarios are not simply predictions but a set of plausible alternative assumptions about the future: a non-totally free imagination grounded in the past and present [,]. However, few researchers have integrated the concept of the scenario into product function models to identify new opportunities for innovation.
To address the above problems, this paper analyzes product scenarios from different perspectives. The product, users, and usage environments are considered the influencing factors in a scenario. A method is proposed for generating innovative opportunities based on the evolution of the product scenario. The method creatively takes the function execution process of the typical product as a scenario, streamlining stakeholders and only focuses on the relationship between the user, the environment, and the product for the possible future direction in terms of evolution. Based on the theory of basic element extension and needs evolution characteristics, target scenario element extension rules and strategies are formulated to provide guidance for the direction and method concerning product scenario evolution. An automated strategy selection tool is developed using a back propagation (BP) neural network to improve design efficiency and reduce the error rate. A new scenario element matrix is constructed analogously to the morphological matrix. New scenario element sets and impact sets are obtained as initial innovation opportunities (IIOs). The final innovation opportunity (FIO) is obtained after the evaluation and integration of IIOs. Finally, the conceptual design is established to generate solutions based on the FIOs.
The sections of this paper are organized as follows. Section 2 discusses the related research. Section 3 introduces the concept and construction methods of product scenarios. Section 4 describes the proposed method. Firstly, the function model transformation and target scenario element determination methods are presented. Then, rules and strategies for scenario elements extension are developed to obtain future possibilities for target scenario elements. Finally, new scenario element sets are built, and innovation opportunities are obtained based on the impact diffusion. Section 5 verifies the feasibility of the method through the innovative design of a polyethylene (PE) pipeline hot-melt welding machine. Section 6 discusses the advantages, disadvantages, and prospects of the proposed method.

3. Concept of Product Scenario

The purpose of a product is to meet user needs, which usually relies on a deterministic or controllable function implementation process that is driven and influenced by internal and external factors such as material, energy, and information. Scenario state refers to the set of states of these factors at a given moment in time. The process of scenario development from the initial state to the end state under the actions of the product is called the product scenario. Influencing factors in the scenario state during this process are called scenario elements, which are summarized as environment elements, user elements, product elements, and relationship elements that reflect interactions among the elements. These concepts are introduced in detail as follows.

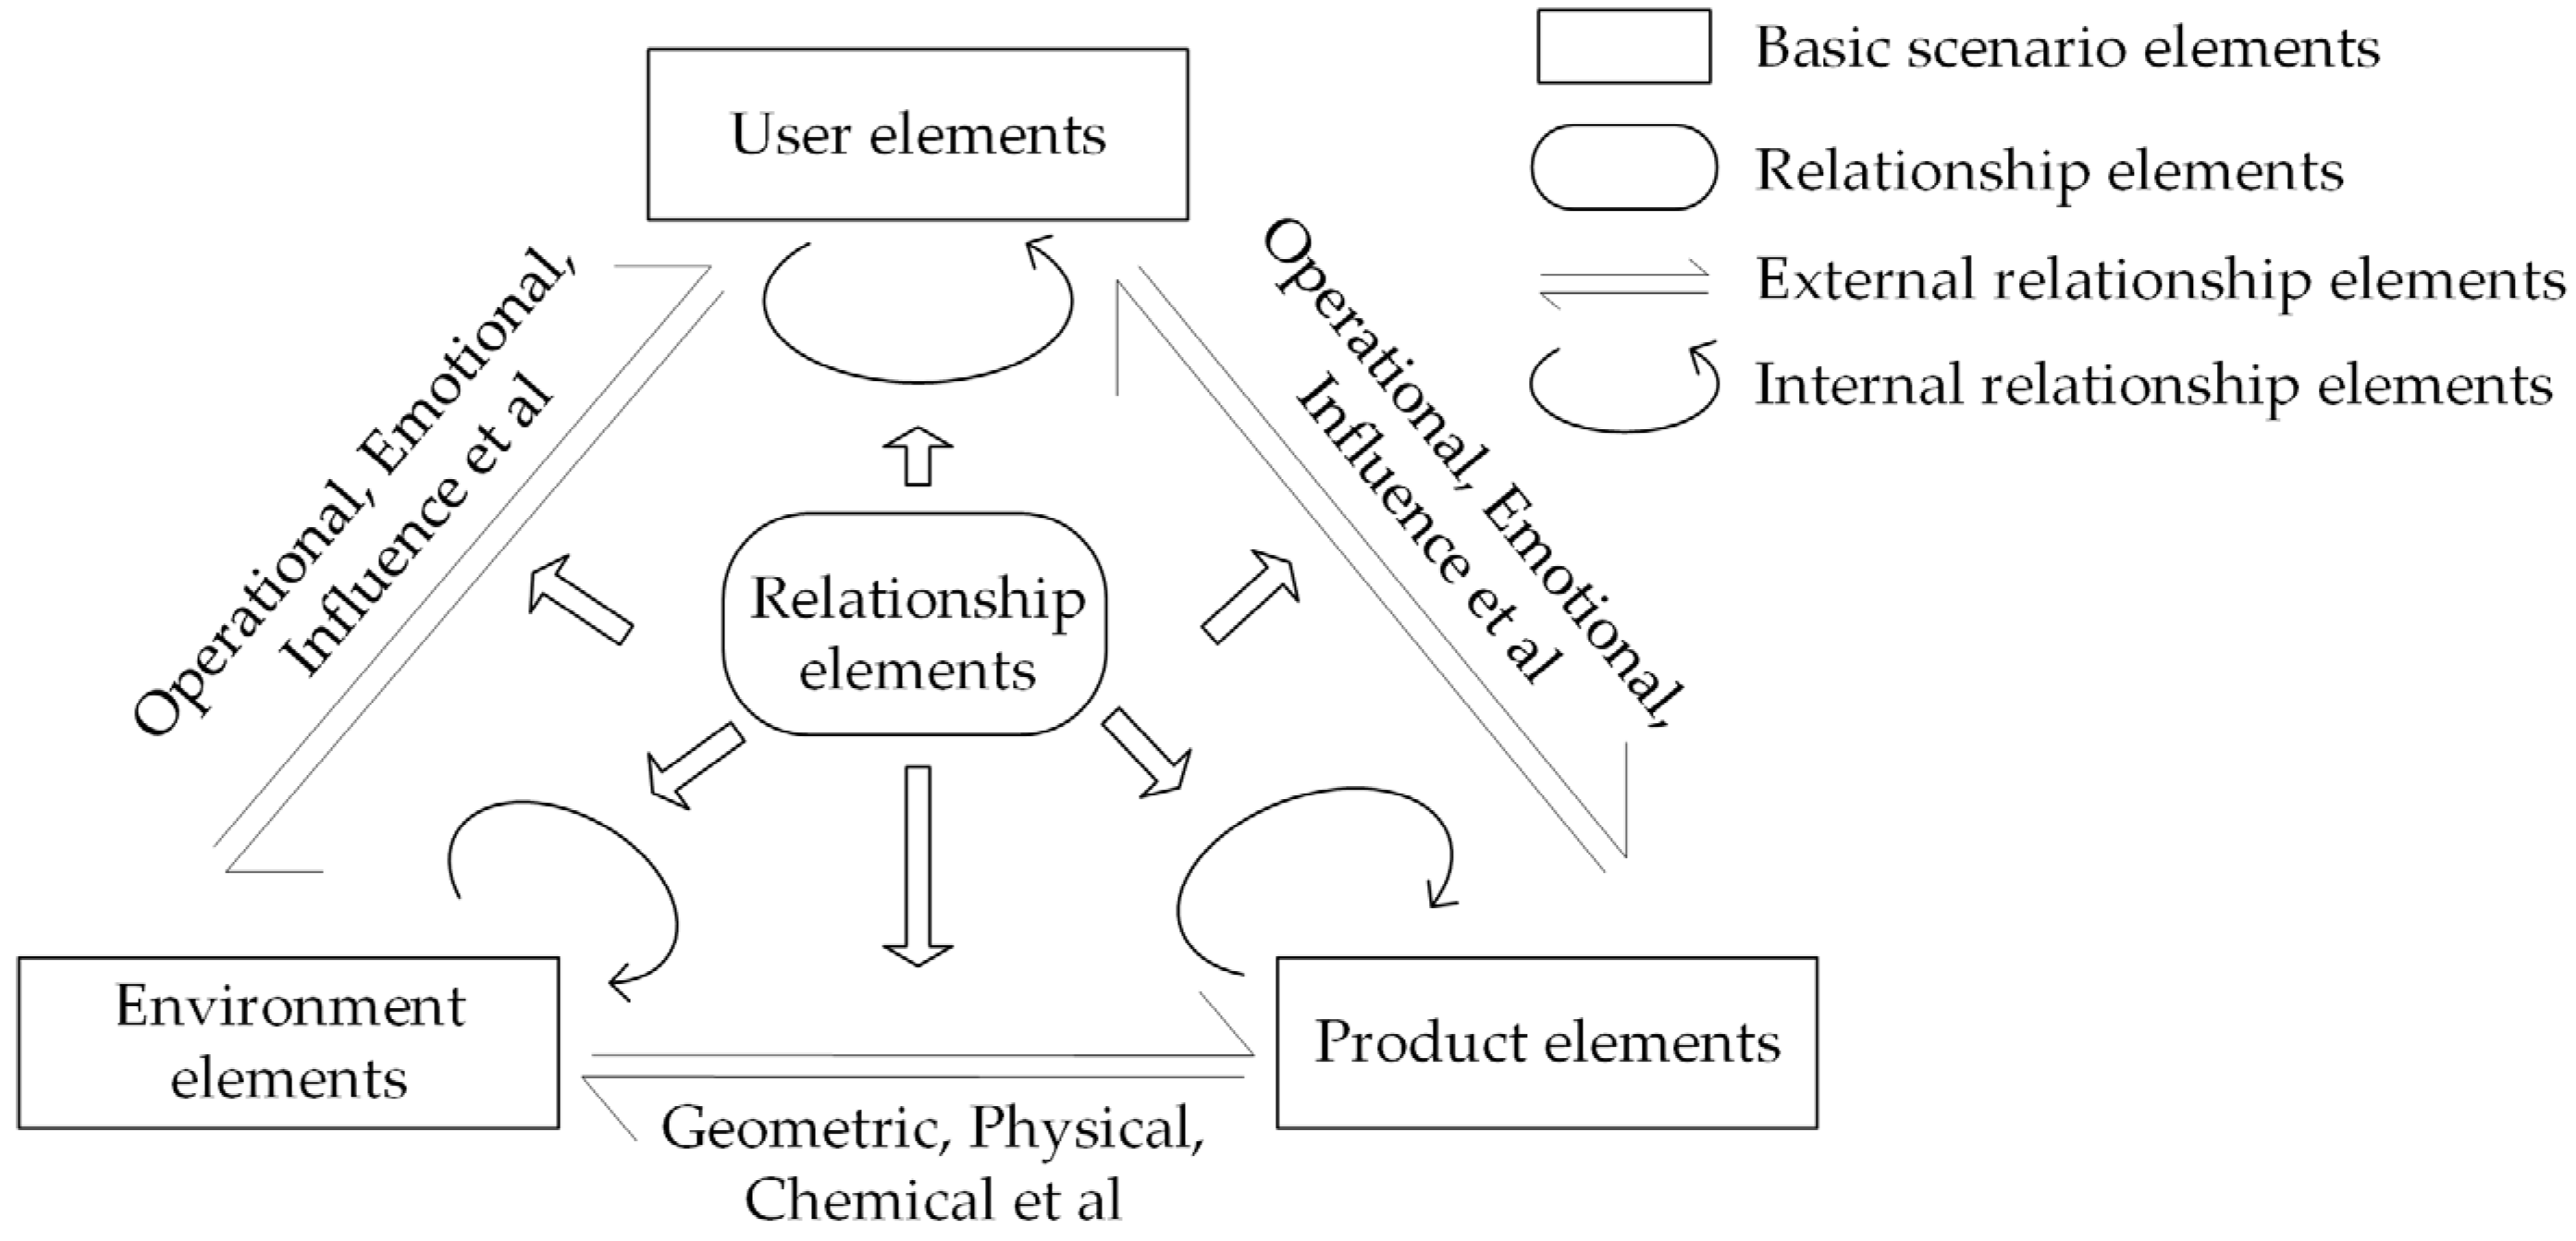
3.1. Scenario Elements of Product Scenario

Scenario elements (E) are key to the scenario state construction and scenario development. In order to represent the concept clearly, the basic element model of Extenics is used to represent the scenario elements [,], as shown in Equation (1), where O represents the concept or attribute name of scenario elements, C is the characteristics of O, V is the state indicator of C, and n represents the number of characteristics of O.
E = O ,   C ,   V = O C 1 V 1 C 2 V 2 C n V n ,
The basic scenario elements can be classified into environment elements, user elements, and product elements according to the class of associated objects []. Environment elements refer to the environmental resources involved in the scenario development process, such as the atmosphere, sunlight, and land. User elements refer to user groups or their characteristics that influence or determine the direction of scenario development, such as occupation, hobby, age, and behavioral habits. Product elements are product-related elements such as principles, functions, technologies, and structures that drive scenario development.
In addition to the three types of basic scenario elements mentioned above, relationship elements are another important component of product scenarios. Relationship elements refer to the stable or controllable relationship between the basic scenario elements, including geometric, physical, chemical, and emotional relationships. Among them, the relationship element between the product and the environment is determined by the characteristics of the elements, and the essence is scientific principles that exist in the objective world. The other aspect is the operational or emotional relationship between human beings and other elements. Therefore, the relationship element and basic scenario element together constitute the complete scenario element of the product scenario. Their relationship is shown in Figure 1.
Figure 1. Composition of scenario elements.

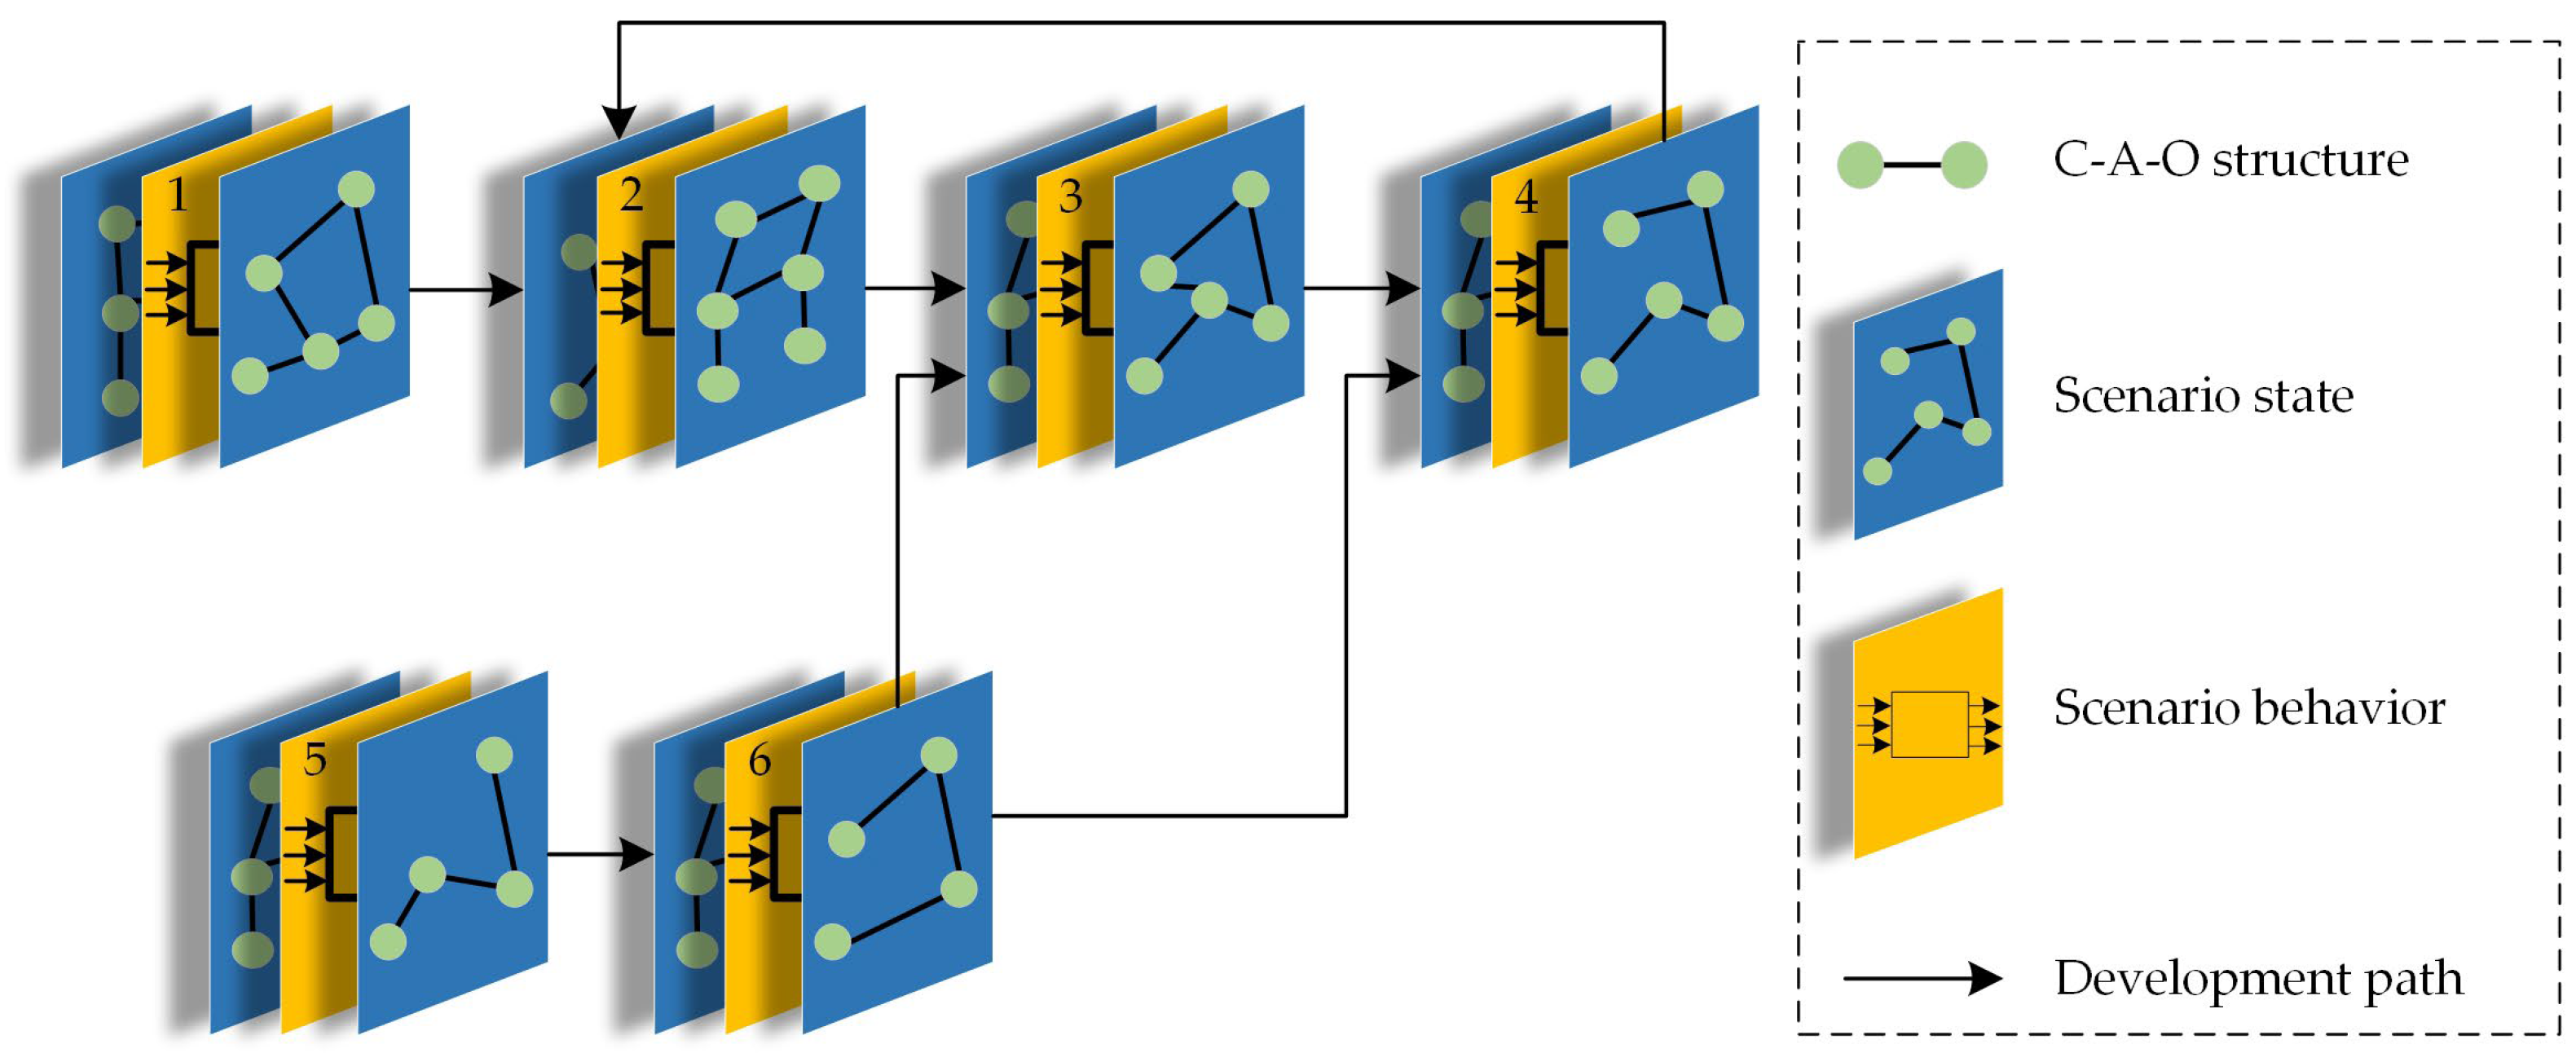
3.2. Development of Product Scenario

Scenario states are sets of related scenario elements at a given time or moment in the development of a product scenario. The transition between neighboring scenario states is marked by a targeted shift in their internal scenario elements and characteristics. All scenario states in the process of user needs fulfillment or product function execution are connected in a temporal and logical sequence to form a scenario development process. According to their position in scenario development, scenario states can be classified into initial, intermediate, and end scenario states.
To illustrate the scenario development, an example of “wood boiling water” is shown in Figure 2. The main feature of scenario development is the transformation of the scenario state in the direction of user’s needs. The whole development process is called the product scenario. In this case, we consider the fire source, firewood, container, and water as product elements of a complete product. User elements include the hands, feeling, and eyesight. The environment elements include the ground, air pressure, and oxygen. The first step of scenario development is the transformation of scenario states A to B, where the changing sign is the change in the position of the “fire source” to “firewood”, which raises the temperature of the firewood and consumes oxygen to keep it burning. The transformation sign from B to C is the internal energy of the firewood in the form of a flame that raises the temperature of the “container”, while the “container” transfers energy to the “water”. The transformation sign from C to D is that the firewood turns into ashes, and the water reaches the boiling point, which satisfies the user’s need. The whole process from scenario states A to D is the product scenario of “wood to boil water”.
Figure 2. Example of scenario states and development for heating water with firewood: (A) is the initial scenario state, (B) is the intermediate-1 scenario state, (C) is the intermediate-2 scenario state, and (D) is the end scenario state.
Scenario behavior is the driving force for scenario development, which prompts the attributes or characteristics of elements in the scenario state to change according to certain rules and logic. This causes a change in the scenario state and a transition to the next state, and this driving force is usually provided by the product. This means that the scenario state and scenario behavior are the node and driving force of the scenario development, respectively, and they are fundamentals for constructing product scenarios.
Scenario behaviors can be connected in a causal time sequence to form a scenario behavior chain. The basic scenario behavior chain consists of three types of connections, i.e., series, parallel, and feedback, as shown in Figure 3. They can be connected to form more complex behavior chains. Thus, the combination of scenario states and scenario behavior chains constitutes a complete process of product scenario development.
Figure 3. Basic scenario behavior chain: (a) serial connection, (b) parallel connection, and (c) feedback connection.

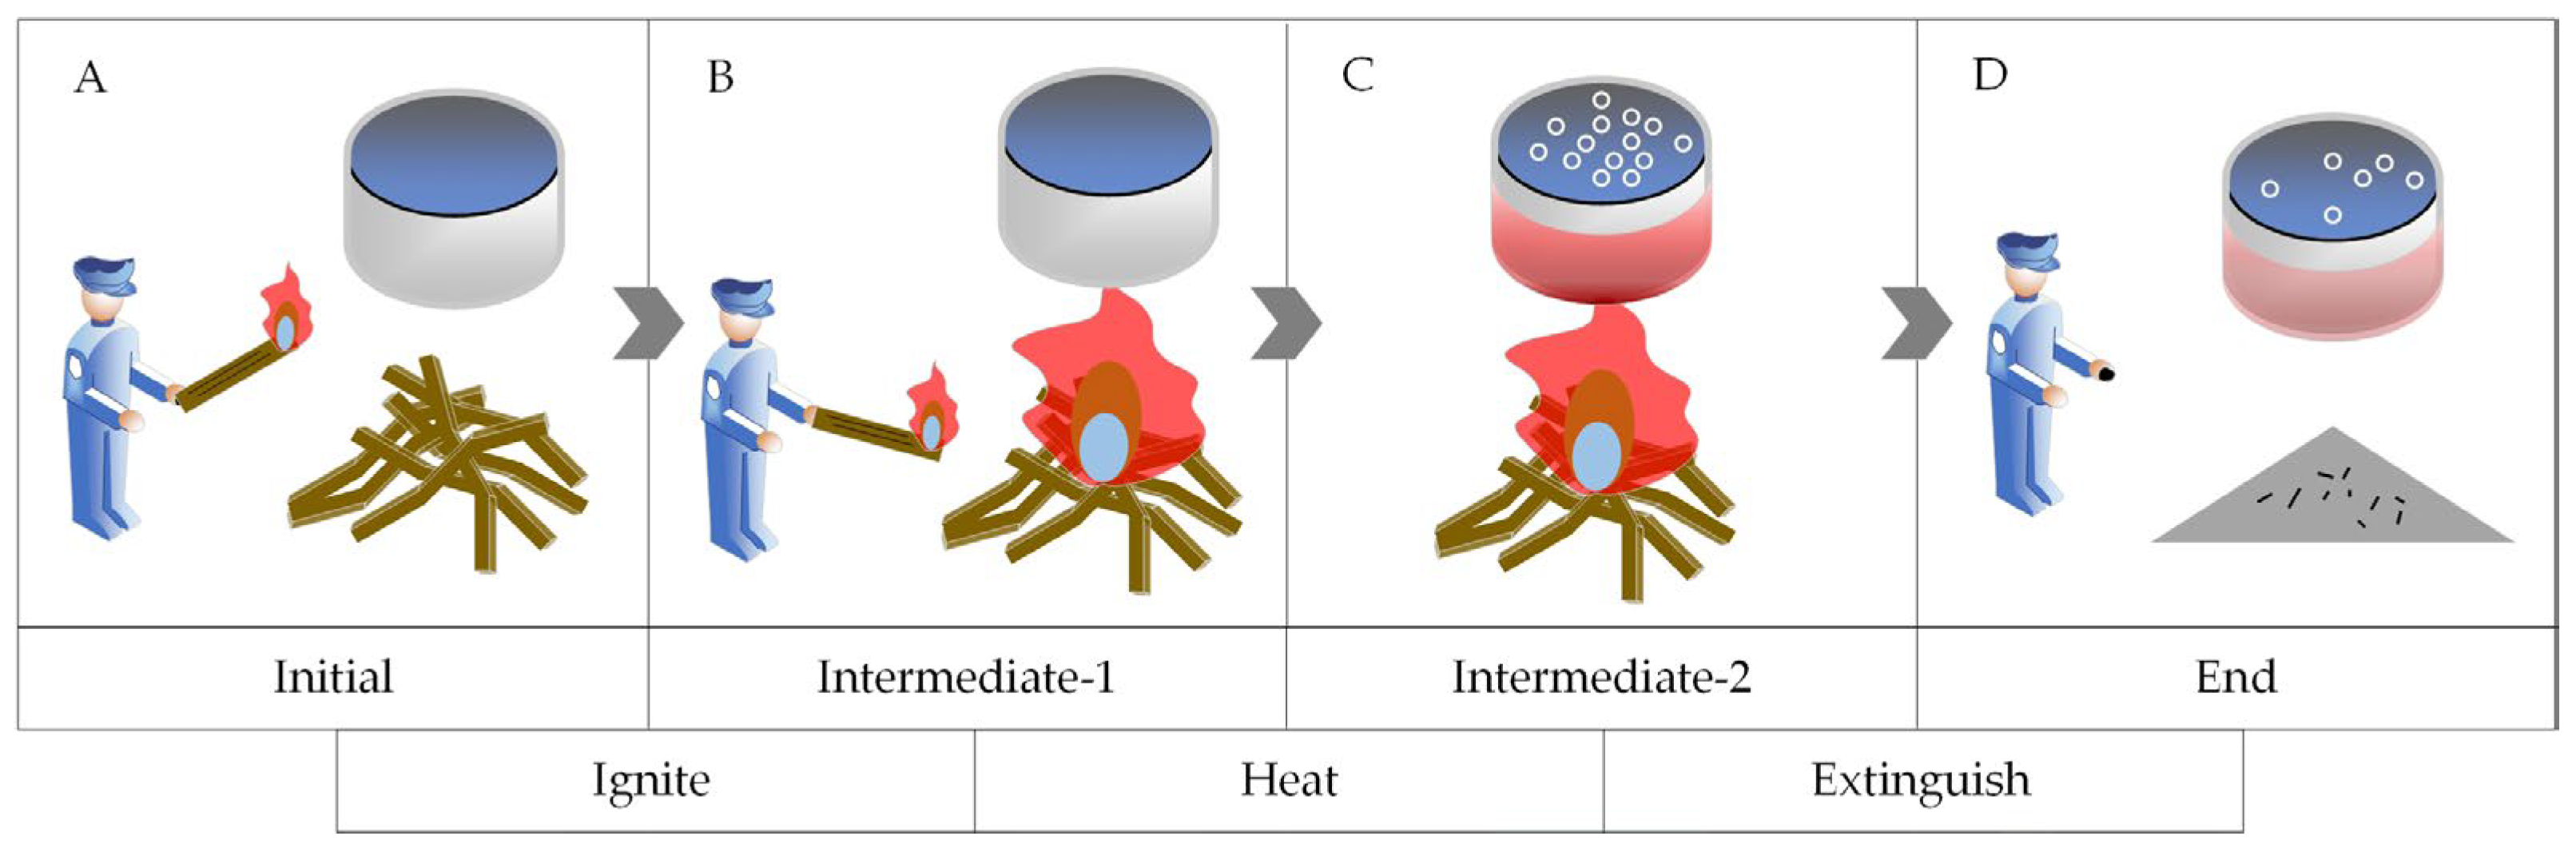
3.3. Typical Product Scenario Construction

The concept of scenarios is applied in product function modeling to build product scenarios. A typical product is selected according to the market and actual situation of the company, usually a best-selling product in the market or one of the company’s main products. The function model of the product is built using the following three steps:
(1) Basic scenario elements of the typical product are analyzed using the reverse fishbone diagram.
(2) Each basic scenario element is clarified.
(3) Relationship elements between the basic scenario elements are identified.
Figure 4 shows the system decomposition of a typical product based on the reverse fishbone diagram, containing module set M and element set E, where M contains product module Mi, environment module Me, and user module Mu.
Figure 4. System decomposition of a typical product.
Using basic scenario elements and relationship elements, a Type I function model is formed based on the system decomposition results of Figure 4. The Type I function model is based on the C–A–O structure, i.e., the simplest structure with the functional carrier, act, and object [], as shown in Figure 5. “C” and “O” belong to basic scenario elements of the product scenario, and “A” belongs to relationship elements. The connection of these elements constitutes the Type I function model of the system, as shown in Figure 6. It should be noted that the “C” or “O” identity is determined by the direction of “A”, so the “C” may also be an “O” under another “A”. The advantage of the Type I function model is that it can show the system function through clear component relationships, i.e., it can show the basic scenario elements and relationship elements, and therefore it is suitable for constructing the scenario state of the product scenario.
Figure 5. C–A–O structure.
Figure 6. Type I function model.
The static Type I function model is unable to represent the dynamic process of the system function, that is, it is difficult to represent the transformation process of the scenario state from the functional level. Therefore, we introduce the function structure to represent the system function in terms of the dynamic material, energy, and signal flows transferred between function units [], as shown in Figure 7. Function units, obtained in the overall function decomposition, are the smallest units of function decomposition. Attribute changes in the output flows are the result of function execution. Since the energy and signal are attributes or characteristics of a product, we only use the material flow to construct the function structure to simplify the model.
Figure 7. Function structure.
Function units in the function structure have a high degree of consistency with the scenario behaviors; therefore, we combine the function structure and Type I function model to construct a product scenario, as shown in Figure 8. The function units are used as scenario behaviors to form the scenario behavior chain. Corresponding basic scenario elements are extracted from the inputs and outputs of the function units, respectively, and the corresponding relationship elements are extracted from the Type I function model. They are then combined into scenario states for both sides of the scenario behavior. Scenario behaviors and scenario states together constitute the sub-scenario of a product scenario, i.e., the independent block in Figure 8, which reflects the functional process of the product and all the relevant scenario elements involved in the execution of the function. It shows that the two scenario states in the sub-scenarios are the initial scenario state and the end scenario state of the sub-scenarios. The scenario states form the C–A–O structure in Figure 6, where “C” and “O” represent the product, environment, and user elements, and “A” represents the relationship element. The scenario state consists of scenario elements that are only relevant to the sub-scenarios. The product scenario is obtained by connecting the scenario behaviors and scenario states according to the scenario behavior chain, as shown in Figure 8.
Figure 8. Product scenario.

4. Proposed Method

The future possibilities of product scenarios are important innovation opportunities. Scenario evolution is a reconfiguration of product scenarios based on directed changes in scenario elements, which leads to unforeseen discoveries, i.e., innovation opportunities. Designers can obtain new design requirements based on future-oriented changes in scenario elements and their impact areas, therefore realizing product innovation.
Therefore, innovation opportunity identification can be carried out in terms of both internal scenario exploration and external scenario expansion, as shown in Figure 9. First, new scenario elements are obtained through scenario element extension. Then, the new scenario elements are re-injected into the original product scenario, and the new scenario state is obtained based on the impact diffusion analysis. The new product scenario is obtained by redesigning the new scenario behaviors based on the new scenario states.
Figure 9. Schematic for identifying innovation opportunities based on product scenarios.

4.1. The Target Scenario Elements for Extension

In general, the function analysis uses the Type I function model shown in Figure 6, but this model is insufficient in terms of displaying the functions, and it is difficult to determine the importance level. Therefore, it is necessary to transform the Type I function model into the Type II function model, as shown in Figure 10. The square in the Type II function model represents the function, and the arrow between the functions represents that the latter function is the prerequisite of the former function. A dotted line indicates that the relationship cannot be obtained directly from the Type I function model. As shown in Figure 10, the following steps are required to transform a Type I function model into a Type II function model:
Figure 10. Function model transformation.
Step 1: Extracting the C–A–O structure from the Type I function model.
Step 2: Equating the C–A-O structure to a function and determining the connection relationship between functions.
Step 3: Connecting all the functions into a functional network according to the connection relationship in Step 2, i.e., forming a Type II function model.
In order to obtain generalized functions, the C–A–O structure is simplified into the form of “verb + noun” or “verb + noun phrase”, and then superlative words relating to the function are extracted according to the technological capability of the company, to construct an abstracted function set. For example, the function of air conditioners is abstracted as “reduce the temperature of gas” or “change the temperature”.
The abstraction level of functions is an important concept in innovative product design. As the abstraction level decreases, the technical or solution information of the function will be gradually apparent, but the degree of innovation is reduced accordingly. Therefore, the degree of innovation and innovation priority of functions is directly proportional to the abstraction level, and functions with a high abstraction level receive more attention in subsequent innovation activities. The solution and technology of the function constitute the evaluation criteria for the abstraction level, which is divided into three levels: FH1, FH2, and FH3. The criteria are as follows:
(1) FH1 is not concerned with specific technical means and solutions but only describes the purpose or effect that things or systems can achieve.
(2) FH2 is not related to the technology but is related to the solution and is able to envision the general content of the solution but does not contain specific details of its realization.
(3) FH3 is clearly related to the technology and solution with detailed information about the technical solution and its realization methods.
The Dempster–Shafer (D–S) theory from uncertainty reasoning is used to determine the level of abstraction of a function [,]. If there exists a finite space containing all subsets of possibilities, represented by Θ, function m : 2 Θ 0 ,   1 and satisfies m Ø = 0 and E Θ m E = 1 , then m is called a basic probability assignment (BPA) function on 2 Θ . The BPA of each function is determined based on the judgment criteria of the functional abstraction level. Table 1 shows three different assessment relations, the assumption space is Θ = H 1 ,   H 2 ,   H 3 , E1, E2, and E3 are subsets of Θ under different assessments, and m 1 E 1 , m 2 E 2 , and m 3 E 3 are three mutually independent BPA functions corresponding to the assessment relations. According to Dempster’s combination rule, the above three BPA functions forms a new BPA function (ms), as follows:
m s i = K 1 E 1 E 2 E 3 = H i m 1 E 1 m 2 E 2 m 3 E 3 ,
K = E 1 E 2 E 3 Ø m 1 E 1 m 2 E 2 m 3 E 3 ,
Table 1. Basic probability assignments at the function abstraction level.
After the functions are divided into hierarchical levels according to the D–S theory, a Type II hierarchical function model is constructed by rearranging the functions of the Type II function model according to the hierarchy, as shown in Figure 11. The higher the abstraction level of the function, the greater the extension space of its corresponding scenario elements. This is more conducive to generating new and highly creative scenario elements, which also implies the direction of product scenario evolution. Therefore, the basic scenario elements in the functions at the H1 level should be preferred as target scenario elements.
Figure 11. Type II hierarchical function model.

4.2. Methods for Extending Target Scenario Elements

In previous studies, we recognized that product innovation opportunities are closely related to changes in scenario elements. Although these changes may originate from multiple drivers, such as market demand, technological development, and adjustments in policies and regulations, they will ultimately be reflected in changes in scenario elements. Therefore, by combining the theory of basic element extension and the characteristics of needs evolution, rules and strategies of the scenario element extension are formed. A strategy selection method can then be proposed.

4.2.1. Scenario Elements Extension Rules

The extension rules of scenario elements are developed by drawing on the transformation methods of basic elements in Extenics. The basic expansion of basic elements includes divergence analysis, correlation analysis, implication analysis, and expandability analysis, while the basic transformations include substitution, addition and deletion, expansion and contraction, and decomposition and replication []. The former is used to obtain related new basic elements, and the latter is used to integrate these basic elements to obtain new basic elements. According to the basic element transformation methods, we summarize nine rules applicable to the extension of scenario elements, as shown in Table 2. The specifics of several special concepts, such as correlation, implication, and combination, are introduced, as follows:
Table 2. Scenario element extension rules.
(1) Correlation: If there is a dependency between a basic element and characteristic values of other basic elements, they are called correlated. Correlation includes single-direction correlation and two-direction correlation, and furthermore, it includes correlation between the characteristics within a basic element and logical correlation (“and” and “or”) of multiple elements. Correlations are symbolized as follows:
A B ,
(2) Implication: basic element B1 is considered to imply B2 if the realization of B1 contains the realization of B2. In addition, if this implication relation must exist under certain conditions, it is a conditional implication relation. Complex logical implication relations also exist between multiple basic elements. An important property is the transitive nature of the implication relation, i.e., if B1 implies B2 and B2 implies B3, then B1 implies B3. Implication relations are symbolized as follows:
B 1 B 2 B 3 ,
(3) Combination: Combination is the combination of more than two basic elements into a new basic element and contains three cases, as shown in Equation (6). Case one is where the new basic element adds different characteristics, case two is the combined change in the attributes and characteristic values of the new basic element, and case three is where the new basic element possesses two characteristics from different basic elements at the same time, and the values undergo a combined change. The combined change is not a simple addition but creates a completely new original function or property upon the original base, such as a bimetal strip.
B 1 B 2 = O 1 , c 1 , v 1 c 2 , v 2 ,   O 1 = O 2 ,   c 1 c 2 O 1 O 2 ,   c 1 ,   v 1 v 2 ,   O 1 O 2 ,   c 1 = c 2 O 1 O 2 , c 1 , v 1 c 1 O 2 c 2 , c 2 O 2 v 2 ,   O 1 O 2 ,   c 1 c 2 ,

4.2.2. Scenario Elements Extension Strategies

The extension rules provide a method applicable to product scenario element extension, but the process is highly stochastic. Therefore, it is critical to find a way to guide the scenario elements for highly feasible and innovative changes. The essence of product scenario evolution originates from the user needs. In order to provide a clear target and direction for the extension of scenario elements, this paper uses the laws concerning needs evolution to guide the selection and use of scenario elements extension rules.
After analyzing the laws of needs evolution, 16 needs evolution characteristics (NECs) are extracted to predict the future scenario elements of the product, as shown in Table 3. The NECs constitute extension strategies in an independent or combined way. A suitable extension strategy can only be maximized by combining it with the corresponding extension rules. In general, designers have to select NECs based on their experience; however, this is inefficient.
Table 3. Needs evolution characteristics.

4.2.3. Selection Strategies for Extending Scenario Elements

Due to the designers’ inertial thinking and inconsistent level of innovation, it is generally difficult to select the appropriate NEC as the element extension strategy. Therefore, we developed a tool to automatically predict NECs using MATLAB and a BP neural network, as follows.
First, a portfolio of 100 real-life product innovation cases was collected and identified; all of them have the common characteristic of being a significant evolution in satisfying user needs compared to the previous generation. Then, we extracted valid information from these samples as sample data. The sample data mainly contain the product characteristics and NECs. In order to study the relationship between product characteristics and NECs, the characteristics of changed scenario elements in two generations of products were extracted from the sample data as inputs to the BP neural network model, and the corresponding numbers of conforming NECs were considered outputs. Since the characteristics of the scenario elements are described in a natural language, which is difficult to recognize when using computers, LT dimensions were used to replace these characteristics.
The LT dimension is a highly abstract representation of physical quantities, which aims to represent arbitrary physical quantities using the product of different powers of length (L) and time (T) dimensions [,], e.g., the LT dimension of “pressure” is L2T−4. As with some kinds of unified relationships between different physical quantities, group theory and topological methods are used to obtain the analytic relationship of physical constants for the LT chart (Figure 12) [,]. As shown in Figure 12, there are a total of 50 numbered LT dimensions in the LT chart. The characteristics of a scenario element are the physical attributes that reflect the essence of the element, such as the strength, size, and resistance of the part. The fundamental reason for the outward manifestation of scenario elements and their specific relationships with other elements is the role played by their specific attributes, and thus, the collection of these characteristics constitutes the physical ontology of the element.
Figure 12. LT chart [], where the numbers in the background are the LT dimension numbers.
The original sample data are finally organized into 100 pieces of available sample data, each containing a set of LT dimension numbers and a NEC ordinal number. They are used as inputs and outputs of the BP neural network, respectively, and some of the data are shown in Table 4. The sample data are input into the BP neural network model for training. The results in Figure 13b show that the training error is minimized when the number of hidden layer nodes is 75, and the error level stabilizes at an order of magnitude of 10−2 (Figure 13c), which is a very low error level. Figure 13d shows a prediction accuracy of 90% for the 20 test samples.
Table 4. Sample data (part).
Figure 13. BP neural network training results: (a) parameter setting interface of neural network, (b) curve of the number of nodes in the hidden layer versus the training error, (c) curve of the number of training sessions versus the training error, and (d) test results of the neural network.
In practice, the LT dimension of the target scenario elements is extracted and input into the BP neural network model to obtain the recommended NEC. Designers can extend the target scenario elements guided by the NEC and recommended element extension rules. A large number of new scenario elements can be obtained.

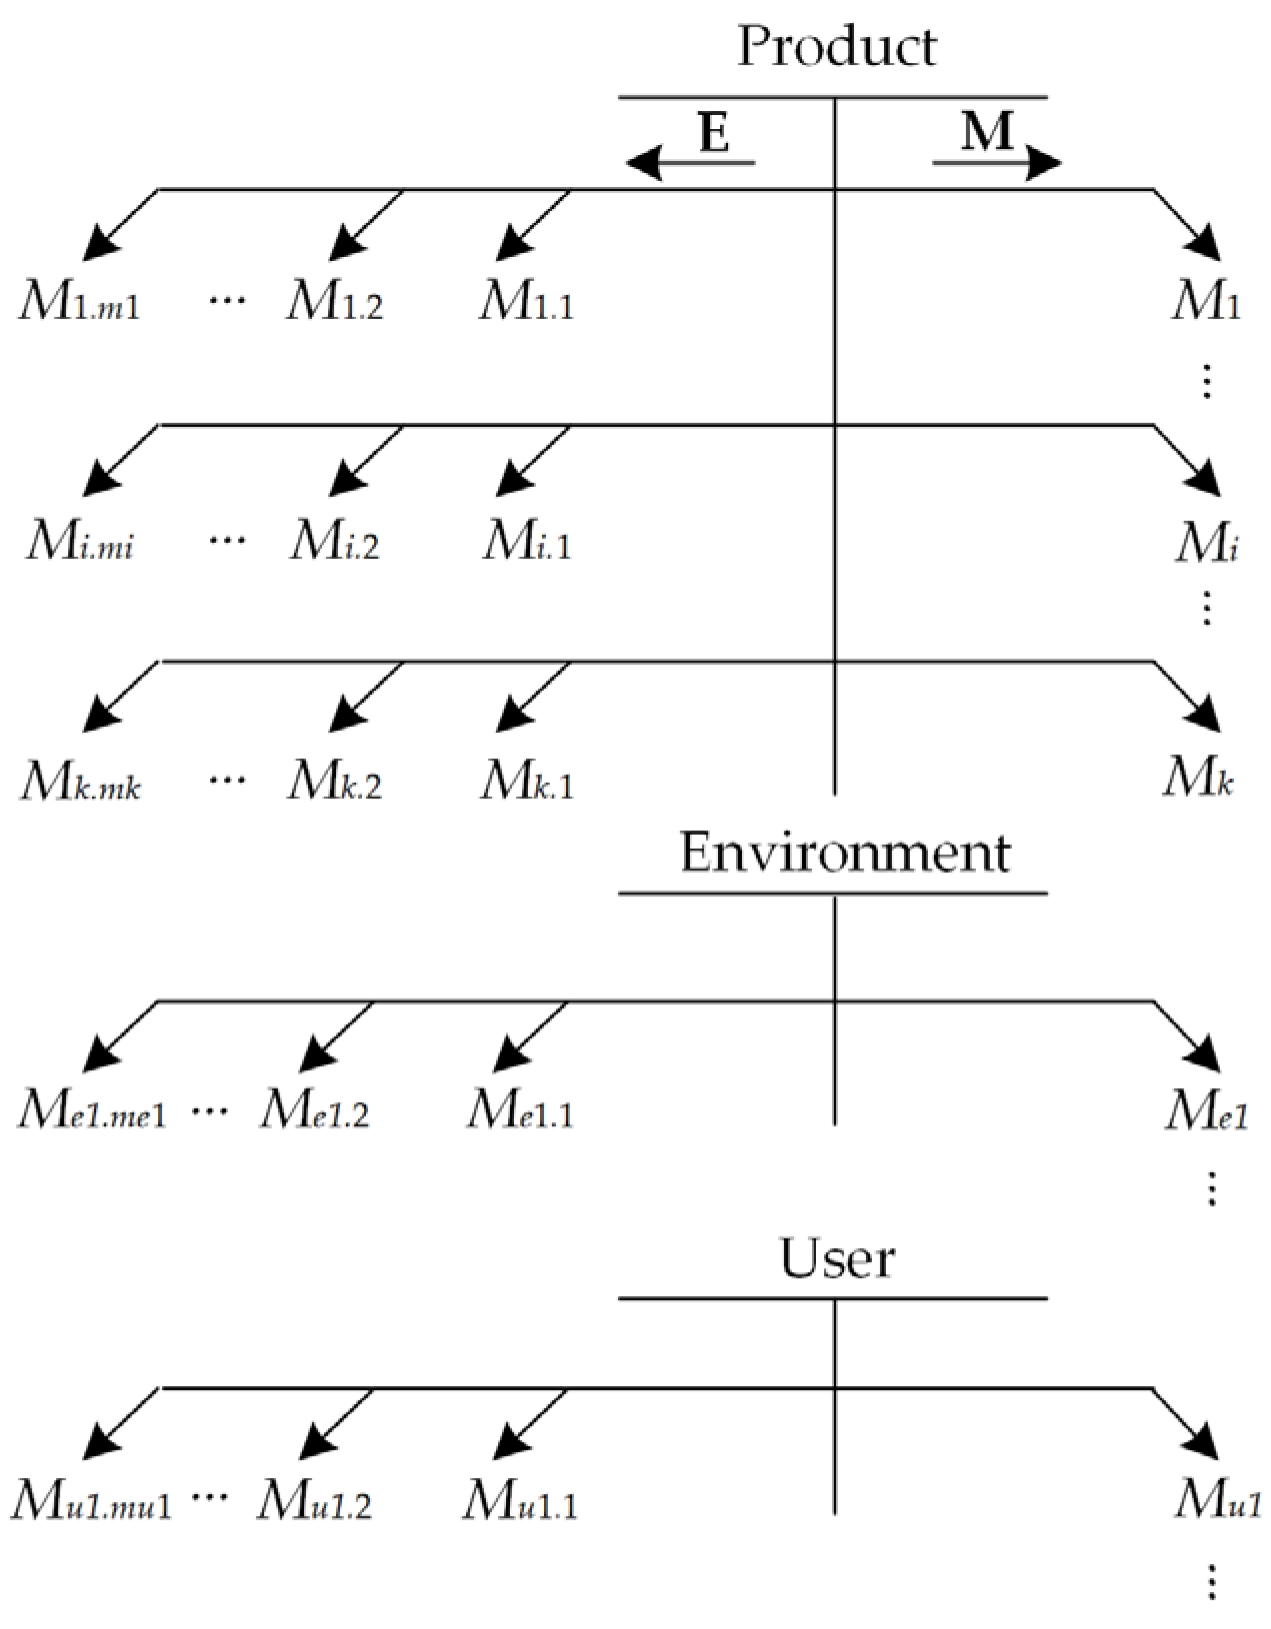
4.3. New Scenario Element Sets Construction and Innovation Opportunity Identification

The new scenario elements obtained through the above steps are still in a relatively chaotic state and cannot directly form a clear idea of the new product design. These disorderly new scenario elements may contain potential innovation opportunities. Effective design ideas can only be formed after optimization, classification, and integration. As shown in Figure 14, the discovery of innovation opportunities from the new scenario elements consists of two steps: innovation opportunity generation and evaluation.
Figure 14. Innovation opportunity generation process.

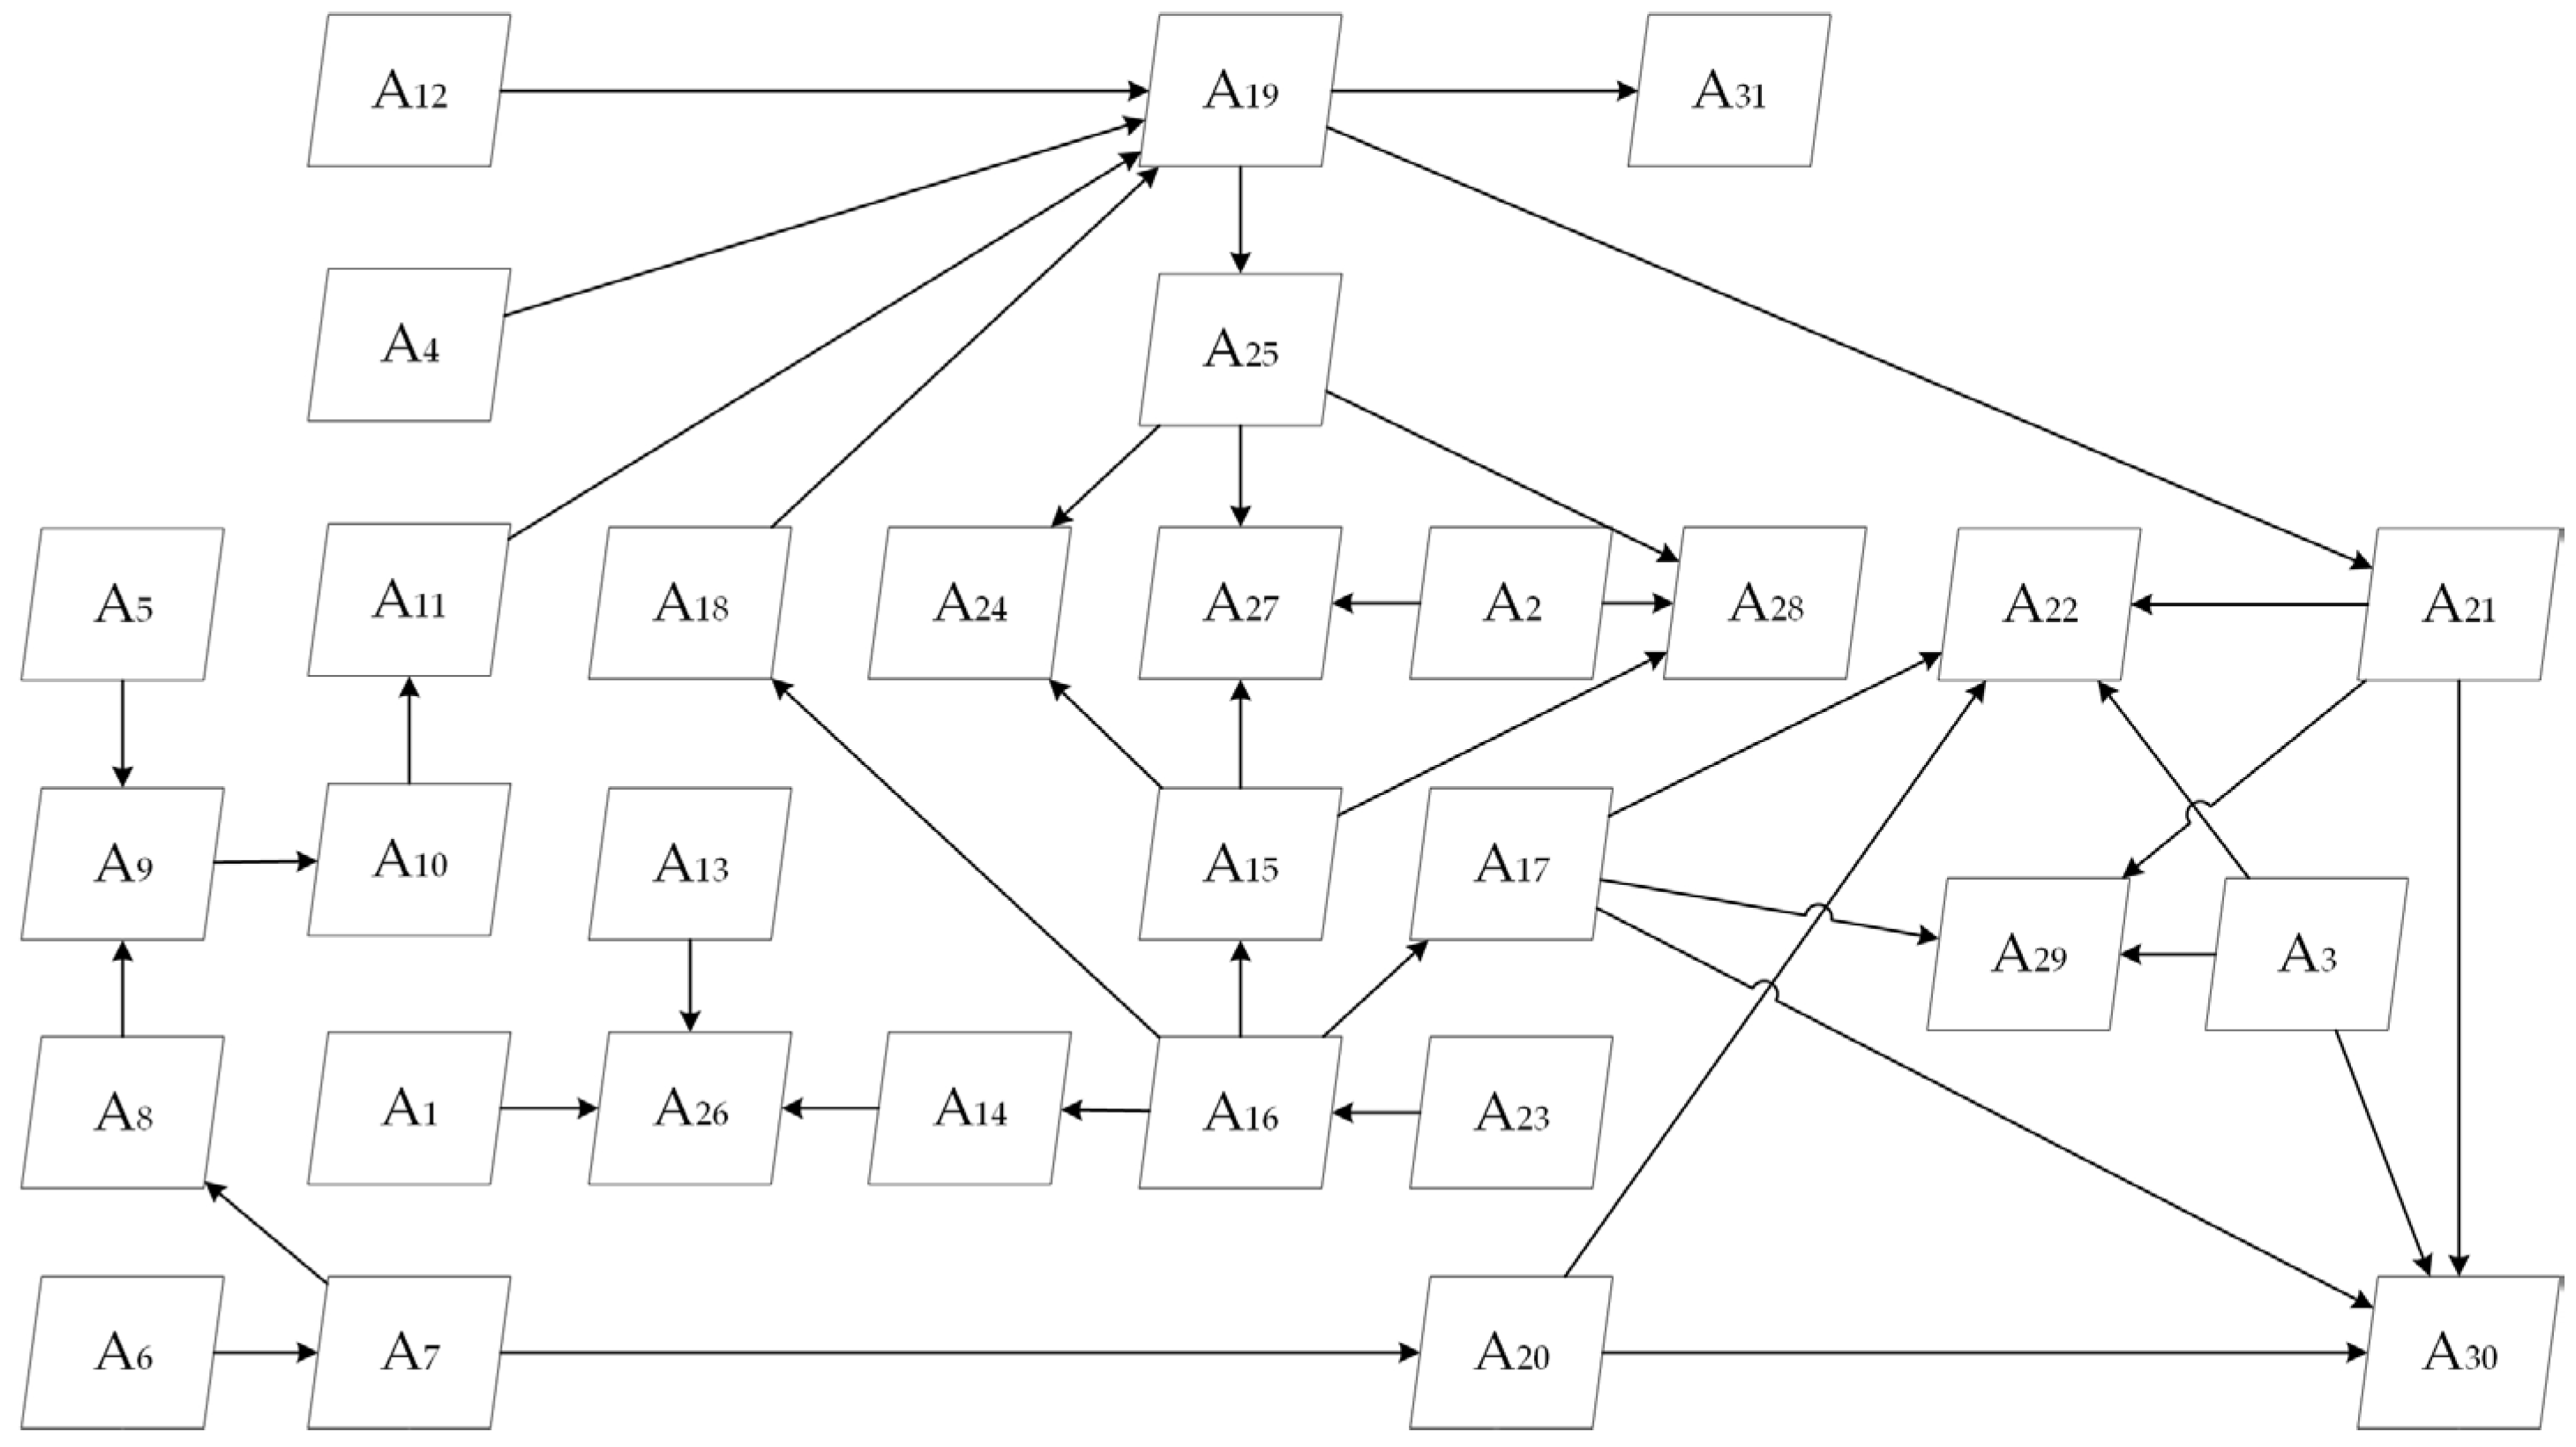
4.3.1. Innovation Opportunity Generation Process

As shown in Figure 14, changes in product scenarios are divided into active and passive changes. The former are new scenario elements generated by designers using element extension rules, and the latter are passive changes in scenario states and behaviors caused by the impact diffusion of new scenario elements.
The active change is the diffuse extension of scenario elements according to extension rules, where new relationship elements are created in the process of extension of the basic scenario elements, which is related to the use of specific extension rules. The process is as follows:
(1) Firstly, a matrix of new scenario elements is constructed with the original scenario elements as the first column and new scenario elements as rows, as shown in Figure 14.
(2) Then, like the morphological matrix approach, a few suitable new scenario elements are selected from each row of the new scenario element matrix, and these new elements are formed into a set.
(3) Finally, multiple sets of different new scenario element sets are generated in the same way.
The passive change is the impact diffusion of the active change described above along the scenario development process and is the adaptation of the original system to the active change. The process is as follows:
(1) First, using the original scenario development process as a basis, the location of the starting scenario state affected by the active change is identified.
(2) Then, the way in which product scenarios are adjusted is analyzed along the path of scenario development one by one. This includes the deletion, addition, and modification of scenario states and scenario behaviors. New scenario elements resulting from this process are collected.
(3) Finally, the new scenario elements, scenario states, and scenario behaviors are synthesized, and ways to improve the overall system are identified, resulting in an IIO.

4.3.2. Innovation Opportunity Evaluation

Active and passive changes together constitute IIOs of the product. Innovation opportunities with development values are screened out through the evaluation of expected novelty and expected values as follows:
(1) Expected novelty evaluation is the screening out of innovation opportunities that are distant or unrelated to existing products. Because the greater distance represents its lower market overlap rate, it is easier to meet the future needs of users and be accepted by the future market. The specifics of changes in the new scenario element sets of active changes are used as evaluation indicators, including values, characteristics, and objects of basic scenario elements as well as the relationship elements. The rules for assigning values to indicators are shown in Table 5. Only one maximum score is recorded for the same element, and the sum of scores in the new scenario element sets is the expected novelty evaluation value of the IIO corresponding to the set.
Table 5. Rules for assigning values to expected novelty indicators.
(2) Expected value evaluation is the screening out of high-value innovation opportunities from the perspective of function changes in the product. The premise of this evaluation is that all function changes are considered to have future values, so the greater the function changes, the higher the expected value of the innovation opportunity. Therefore, the number of changed functions, including improvements, additions, and deletions, is counted from the passively changed content as the evaluation value of the expected value of the IIO.
The highest-scoring IIO is determined based on the sum of the two evaluation values. Based on the content of the innovation opportunity, the product function improvement objectives and design requirements are organized. At the same time, the valuable content of the other IIOs is absorbed to construct a new product design specification, thus forming the FIO. The product is redesigned based on FIOs to obtain a product concept that meets expectations.

4.4. Summary

We reconstruct the product function model using the concept of scenarios and constructed product scenarios. Scenario elements’ extension targets are determined using the transformation of Type I and Type II function models and the D–S theory. Scenario element extension rules based on the transformation methods of basic elements in Extenics provide the theoretical basis and method for obtaining new scenario elements. The NEC extracted from the laws of needs evolution forms the element extension strategy, which provides the direction for product scenario evolution. An automated tool for selecting strategies is developed using the LT dimension and BP neural network to reduce the randomness of human judgment. Designers can obtain a large number of new scenario elements based on the element extension strategy and rules. The matrix of new scenario elements is obtained by analogy with the morphological matrix. The FIO is obtained after the optimization, classification, integration, and evaluation processes. This innovation opportunity generation method is easy to operate and highly reliable, which can help companies obtain novel innovation opportunities, reserve innovation knowledge, and maintain competitiveness in the future market. Finally, a seven-step process model of the innovation opportunity generation method based on product scenario evolution is formed, as shown in Figure 15.
Figure 15. Process model of innovation opportunity generation based on product scenario evolution.

5. Case Study

The PE pipeline hot-melt welding machine (PE-WM) is used as an example to demonstrate the proposed method in generating innovation opportunities based on product scenario evolution. PE-WM is a semi-automated device for connecting gas transmission pipelines. We select a PE-WM as the typical product. Figure 16 shows the product, which mainly consists of a pump station, an electrical box, a heating plate, a milling plate, fixtures, hydraulic cylinders, and a frame, among other parts. Figure 17 shows key steps of the PE-WM working, namely milling the pipe ends, heating the pipes, and butt jointing the pipes.
Figure 16. PE pipeline hot-melt welding machine.
Figure 17. PE-WM key working steps.

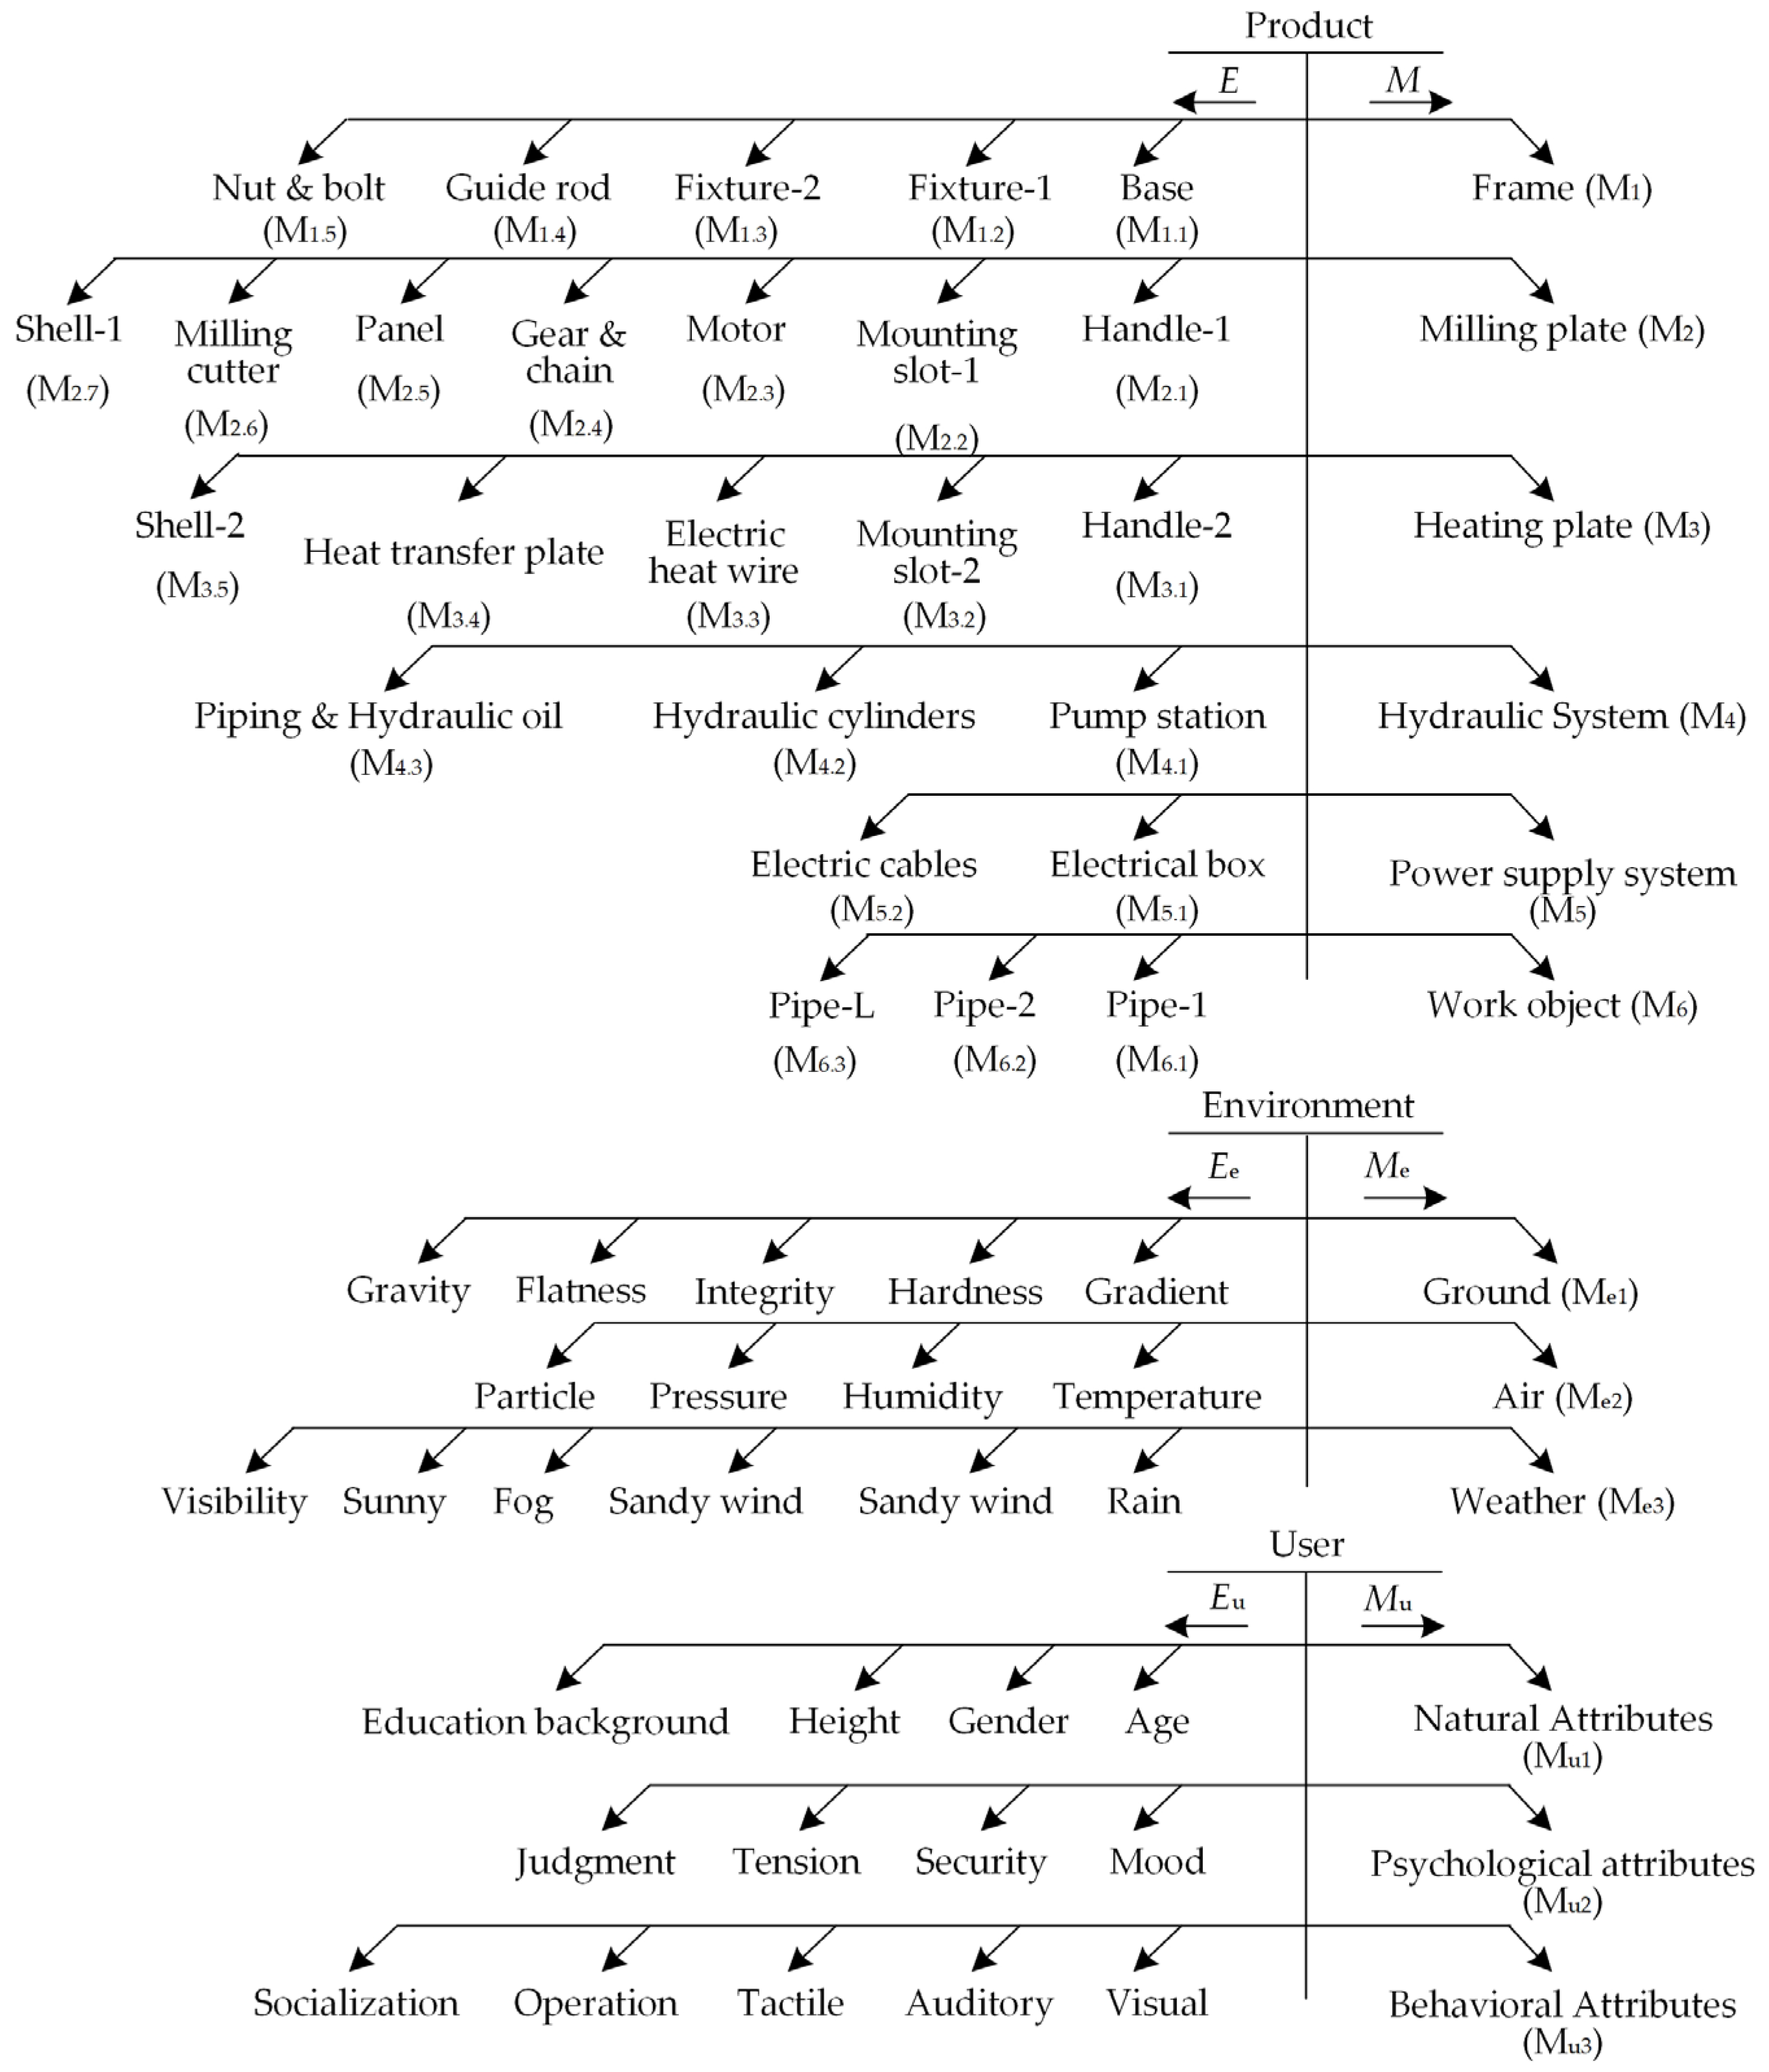
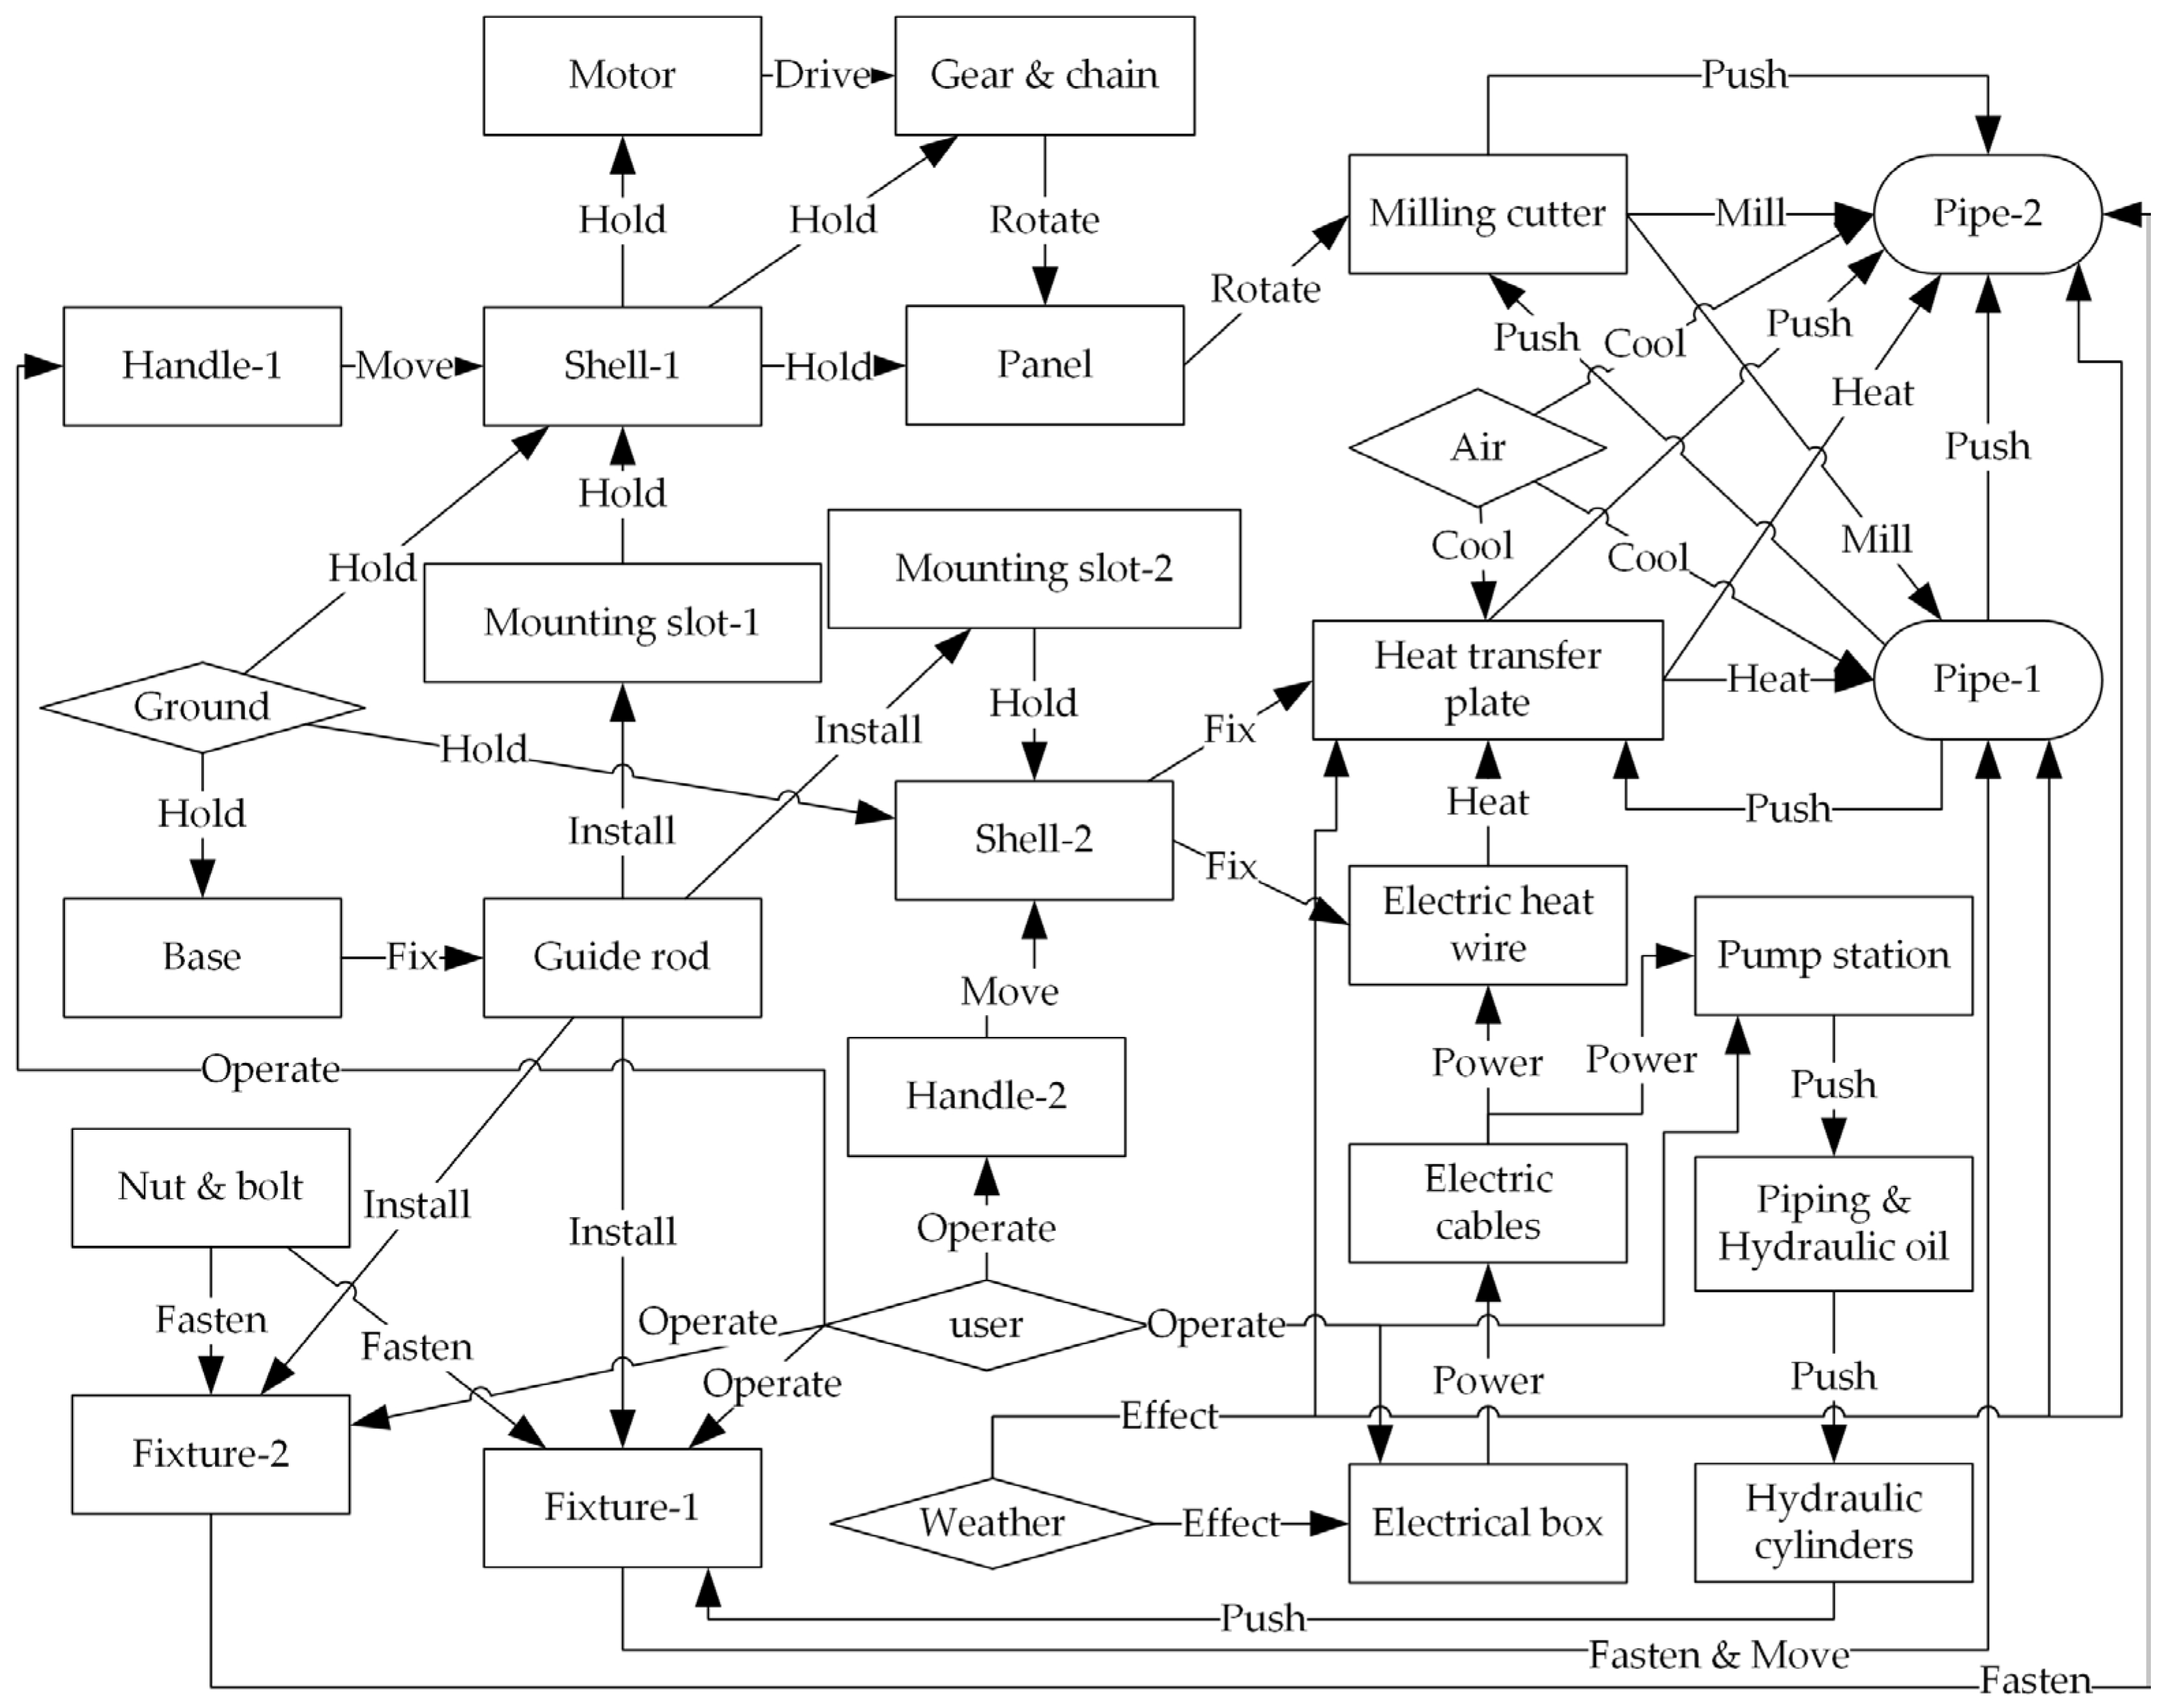
5.1. Product Scenario of PE-WM

The PE-WM is decomposed using a reverse fishbone diagram to obtain the basic scenario elements, as shown in Figure 18.
Figure 18. Reverse fishbone diagram of PE-WM.
The Type I function model of PE-WM is constructed, as shown in Figure 19. According to the model, the product, environment, user, and relationship elements in the product scenario are obtained, and scenario elements are connected to form the product scenario state.
Figure 19. Type I function model of PE-WM.
In order to obtain the PE-WM scenario behavior chain, the function structure shown in Figure 20 was constructed. Obviously, concerning scenario behavior, the function unit’s input and output correspond to two different scenario states; for example, the two changing scenario states of “Install pipe” are “Pipe position moves from ground to fixture” and “Fixture changes from open to locked”. The output scenario states are inputs for the next scenario behavior, “Close pipe”. Since only the scenario elements and scenario behaviors are shown in the function structure, the specific scenario states need to be determined in conjunction with the Type I function model, as shown in Figure 19.
Figure 20. Function structure of PE-WM.
The above two models are integrated in order to form product scenarios for PE-WM. For ease of representation, sequence numbers in Figure 18 are used to represent each basic scenario element, and scenario states on both sides of each scenario behavior are then determined based on the Type I function model and function structure. A total of 14 scenario behaviors are numbered sequentially in the order from left to right in Figure 20. All scenario behaviors and their corresponding scenario states are connected to form the product scenario of PE-WM, as shown in Figure 21.
Figure 21. Product scenario of PE-WM.
The rectangles containing only numbers are scenario behaviors (consistent with the serial numbers in Figure 20), and the rectangles on both sides are scenario states, with inputs on the left and outputs on the right. The connecting line between the scenario states represents that part of the output of the previous scenario behavior is the input of the next scenario behavior, i.e., there is an inheritance of scenario states between the two scenario behaviors. Input scenario states that have no inheritance are initial scenario states, such as the left side of scenario behaviors 1 and 6. The output scenario states that are not being inherited are the end scenario states, such as the right side of scenario behaviors 13 and 14. Obviously, after the scenario development, separated “Pipe-1” and “Pipe-2” change from the input of scenario behavior 2 to the combined “Pipe-L” in the output of scenario behavior 13.

5.2. PE-WM’s Target Extension Scenario Elements

In order to define the scenario extension targets, it is necessary to construct a Type II function model of the PE-WM. In order to be consistent with the product scenario in Figure 21, the “milling plate” and “heating plate” in the Type I function model are considered separate components. Functions in the Type I function model (Figure 19) are then extracted to obtain a total of 31 relevant functions. These functions are converted into more abstract functions, as shown in Table 6. According to the relationship between the functions, the Type II function model is formed, as shown in Figure 22.
Table 6. Abstracted function set.
Figure 22. Type II function model of PE-WM.
According to the method proposed in Section 4.1, the abstraction level of the above functions is determined according to the D–S theory. Three PhD students engaged in product innovation design research participated in the evaluation. They have at least three years of design experience in this field. The evaluators decided the abstraction level of the above functions independently and assigned BPA functions to each function according to the D–S theory. The results are shown in Table A1 in Appendix A. According to Dempster’s synthesis rule and Equations (2) and (3), BPA functions are calculated after the synthesis of the evidence, and the results are shown in Table A2. The results show that functions A22, A23, A24, A27, A30, and A31 belong to level H1, functions A11, A19, A21, A25, A26, A28, and A29 belong to level H2, and the remaining functions belong to level H3. Therefore, a Type II hierarchical function model is constructed, as shown in Figure 23. The scenario elements are extracted from level H1 as extension targets. As shown in Table A3, the target scenario elements included in the functions of level H1 are the heating plate, pipe-1, ground, base, milling plate, and pipe-2.
Figure 23. Type II hierarchical function model of PE-WM.

5.3. Selection of Element Extension Strategies

Taking the selection of extension strategy for “heating plate” as an example, the LT dimension numbers of the heating plate are input into the BP neural network prediction model. The output NEC number is 11, as shown in Figure 24. The LT dimension numbers of other target scenario elements are extracted, and their corresponding NECs are obtained in the same way. The results are shown in Table 7.
Figure 24. Example of BP neural network prediction output.
Table 7. Predicted results of NECs.
According to the suggested extension rules, the target scenario elements are extended, and the results are shown in Table 8, Table 9, Table 10, Table 11, Table 12 and Table 13. There are six target scenario elements in total; among them, “ground” belongs to the environment element, and the others belong to the product element. As a result of the extension, nine new relationship elements are generated, namely Me1-5~Me1-9, M2-1~M2-3, and M6.2-7.
Table 8. Scenario element extending results (M3).
Table 9. Scenario element extending results (M6.1).
Table 10. Scenario element extending results (Me1).
Table 11. Scenario element extending results (M1.1).
Table 12. Scenario element extending results (M2).
Table 13. Scenario element extending results (M6.2).

5.4. New Scenario Element Sets and Innovation Opportunities

Based on the target scenario elements and new scenario elements, a matrix of new scenario elements is constructed, as shown in Figure 25. Appropriate new scenario elements are then selected from each row of the matrix to constitute new scenario element sets. Due to space limitations, we only show three new scenario element sets in Figure 25.
Figure 25. New scenario elements matrix.
The three new scenario element sets are named S1, S2, and S3. They are then substituted into the product scenario (Figure 21). The impacted scenario states and behaviors are analyzed based on the scenario development process to form the following three IIOs:
(1) IIO-1: After analyzing S1, it is clear that this set combines the heating and milling plates into a new system with hydraulic cylinders for loading and unloading, and using the principle of induction heating, which has the advantage of increasing the automation of the system. The new scenario elements of S1 are substituted into Figure 21 to analyze the scenario development process and impact diffusion. It is found that the impacted scenario behaviors are numbers 5, 6, 9, 10, 11, and 14, where scenario behaviors 5 and 9 are no longer needed and should be deleted, functions of 6, 10, and 14 should be performed by hydraulic cylinders, and the heating principle of 11 should be replaced by induction heating.
(2) IIO-2: After analyzing S2, it is clear that this set forms a PE-WM for working in mountainous environments without electricity and with features that are easy to move and collect milling swarf. Based on the features of S2, it is not difficult to deduce that the milling plates and hydraulic cylinders that rely on electricity require new principles. The new scenario elements are substituted into Figure 21; it can be concluded that the impacted scenario behaviors include 3, 4, 7, 8, 9, 11, 12, and 13, and their corresponding scenario states. Specifically, 3 and 4 should be deleted, and new energy sources and transmissions should be utilized to improve 8, 9, 11, 12, and 13 with the addition of a milling swarf collection device and a base adjustment and travel device.
(3) IIO-3: After analyzing S3, the set forms a PE-WM to make a non-straight pipe (fused at an angle of less than 180°) by using at least two milling plates and an induction heating method to increase the heating efficiency, and hydraulic cylinders for automatic loading and unloading of both the heating and milling plates. The new scenario elements are substituted into Figure 21; it is found that the changed scenario states and behaviors include 1, 5, 6, 8, 10, 11, 12, 13, and 14. In addition, the pipes should be cut into the desired angle before milling the end face, so it is necessary to add functions of cutting pipes before behavior 6 and changing the angle of the milling plate before milling. Using the principle of induction heating to improve the original heating plate, the function of adjusting the pipe angle should be added before behavior 10 in order to make the end faces of the two pipes overlap completely.
According to the method proposed in Section 4.3.2, the above IIOs are evaluated in terms of both expected novelty and value. Based on the actively changing new scenario element sets and contents of IIOs, the specific scores of each IIO can be analyzed as shown in Table 14, which shows that IIO-3 has the highest total score and can be considered as the FIO.
Table 14. Evaluation of the IIOs.

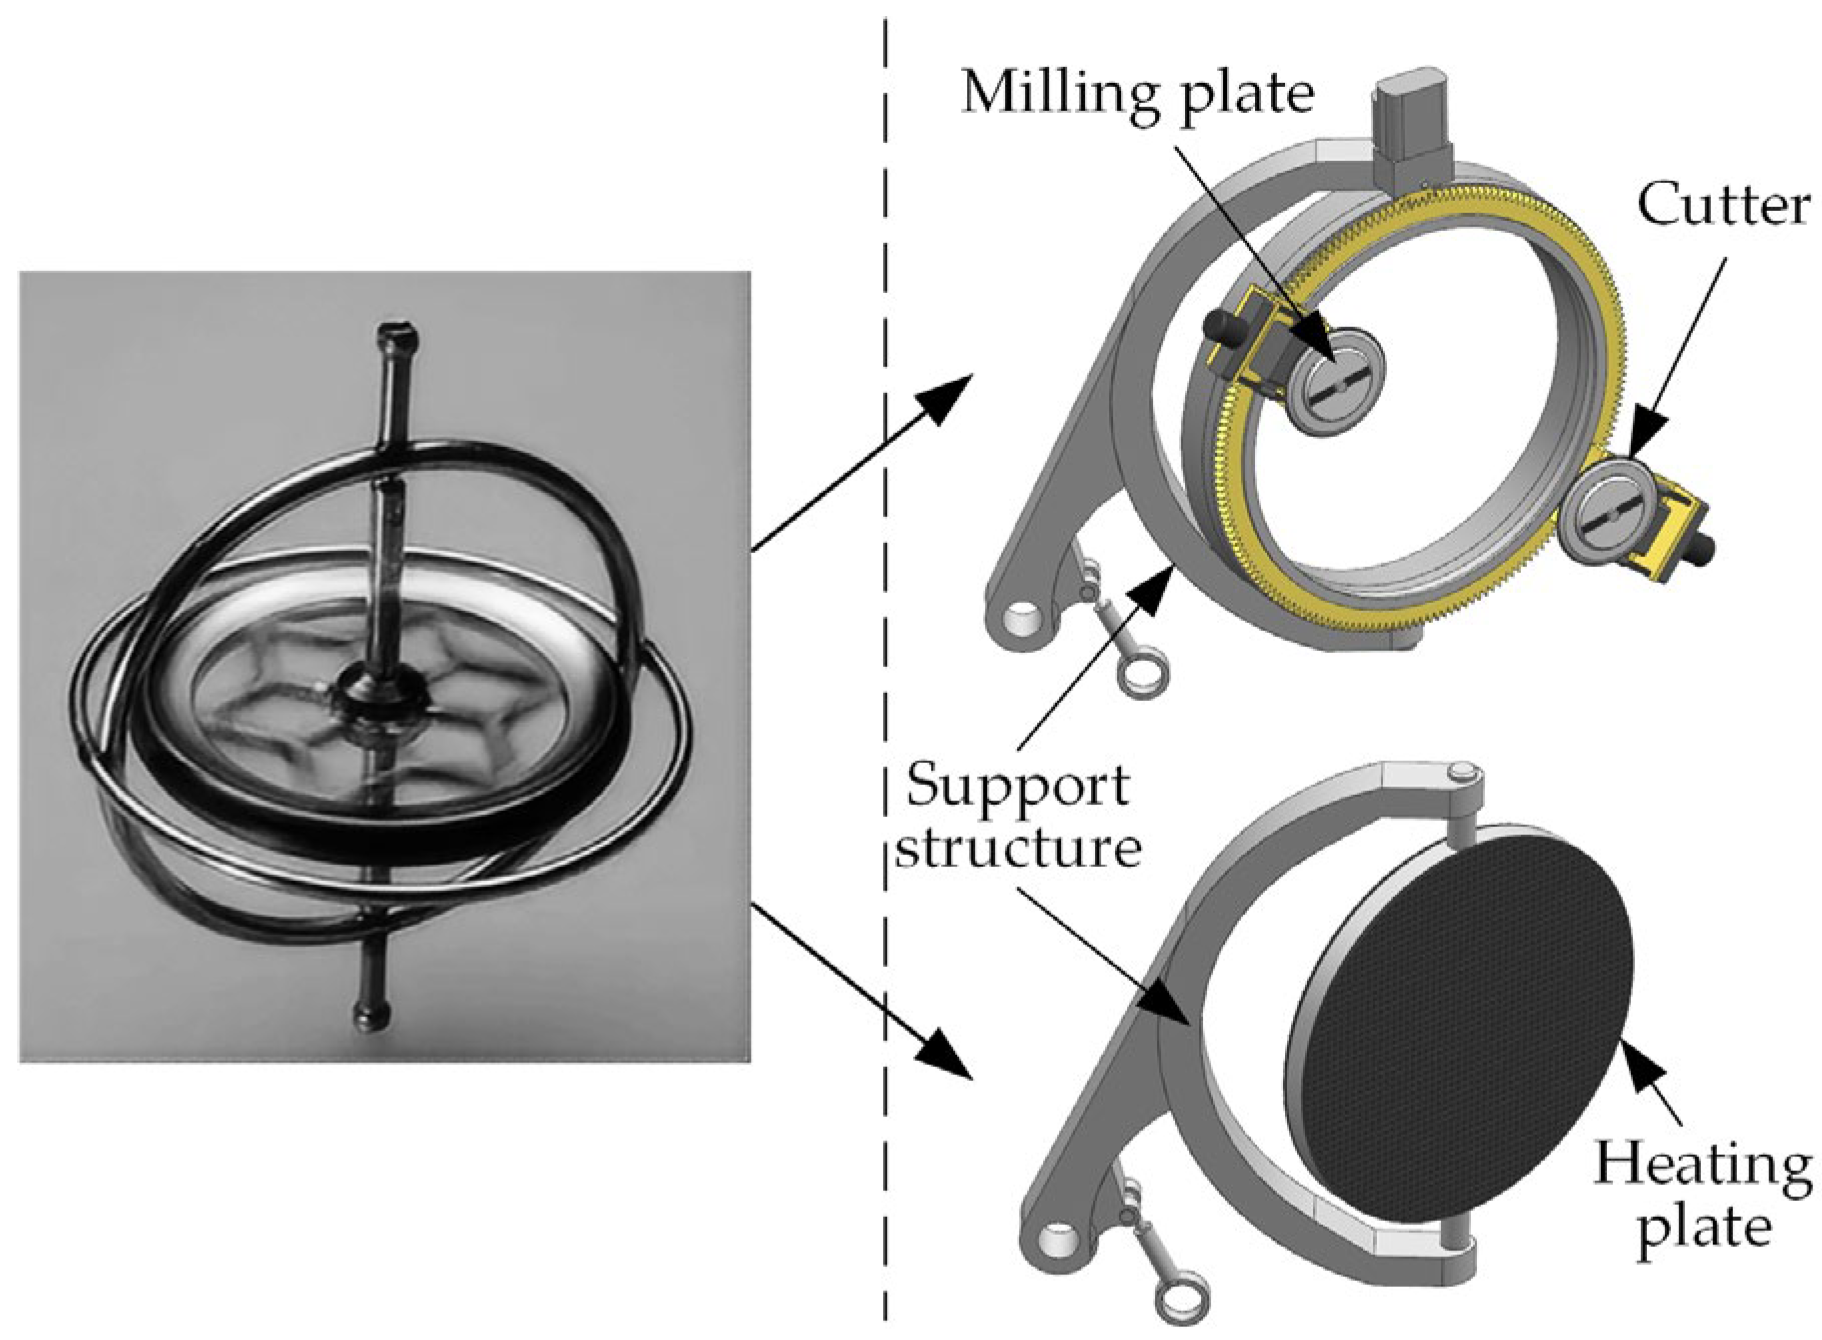
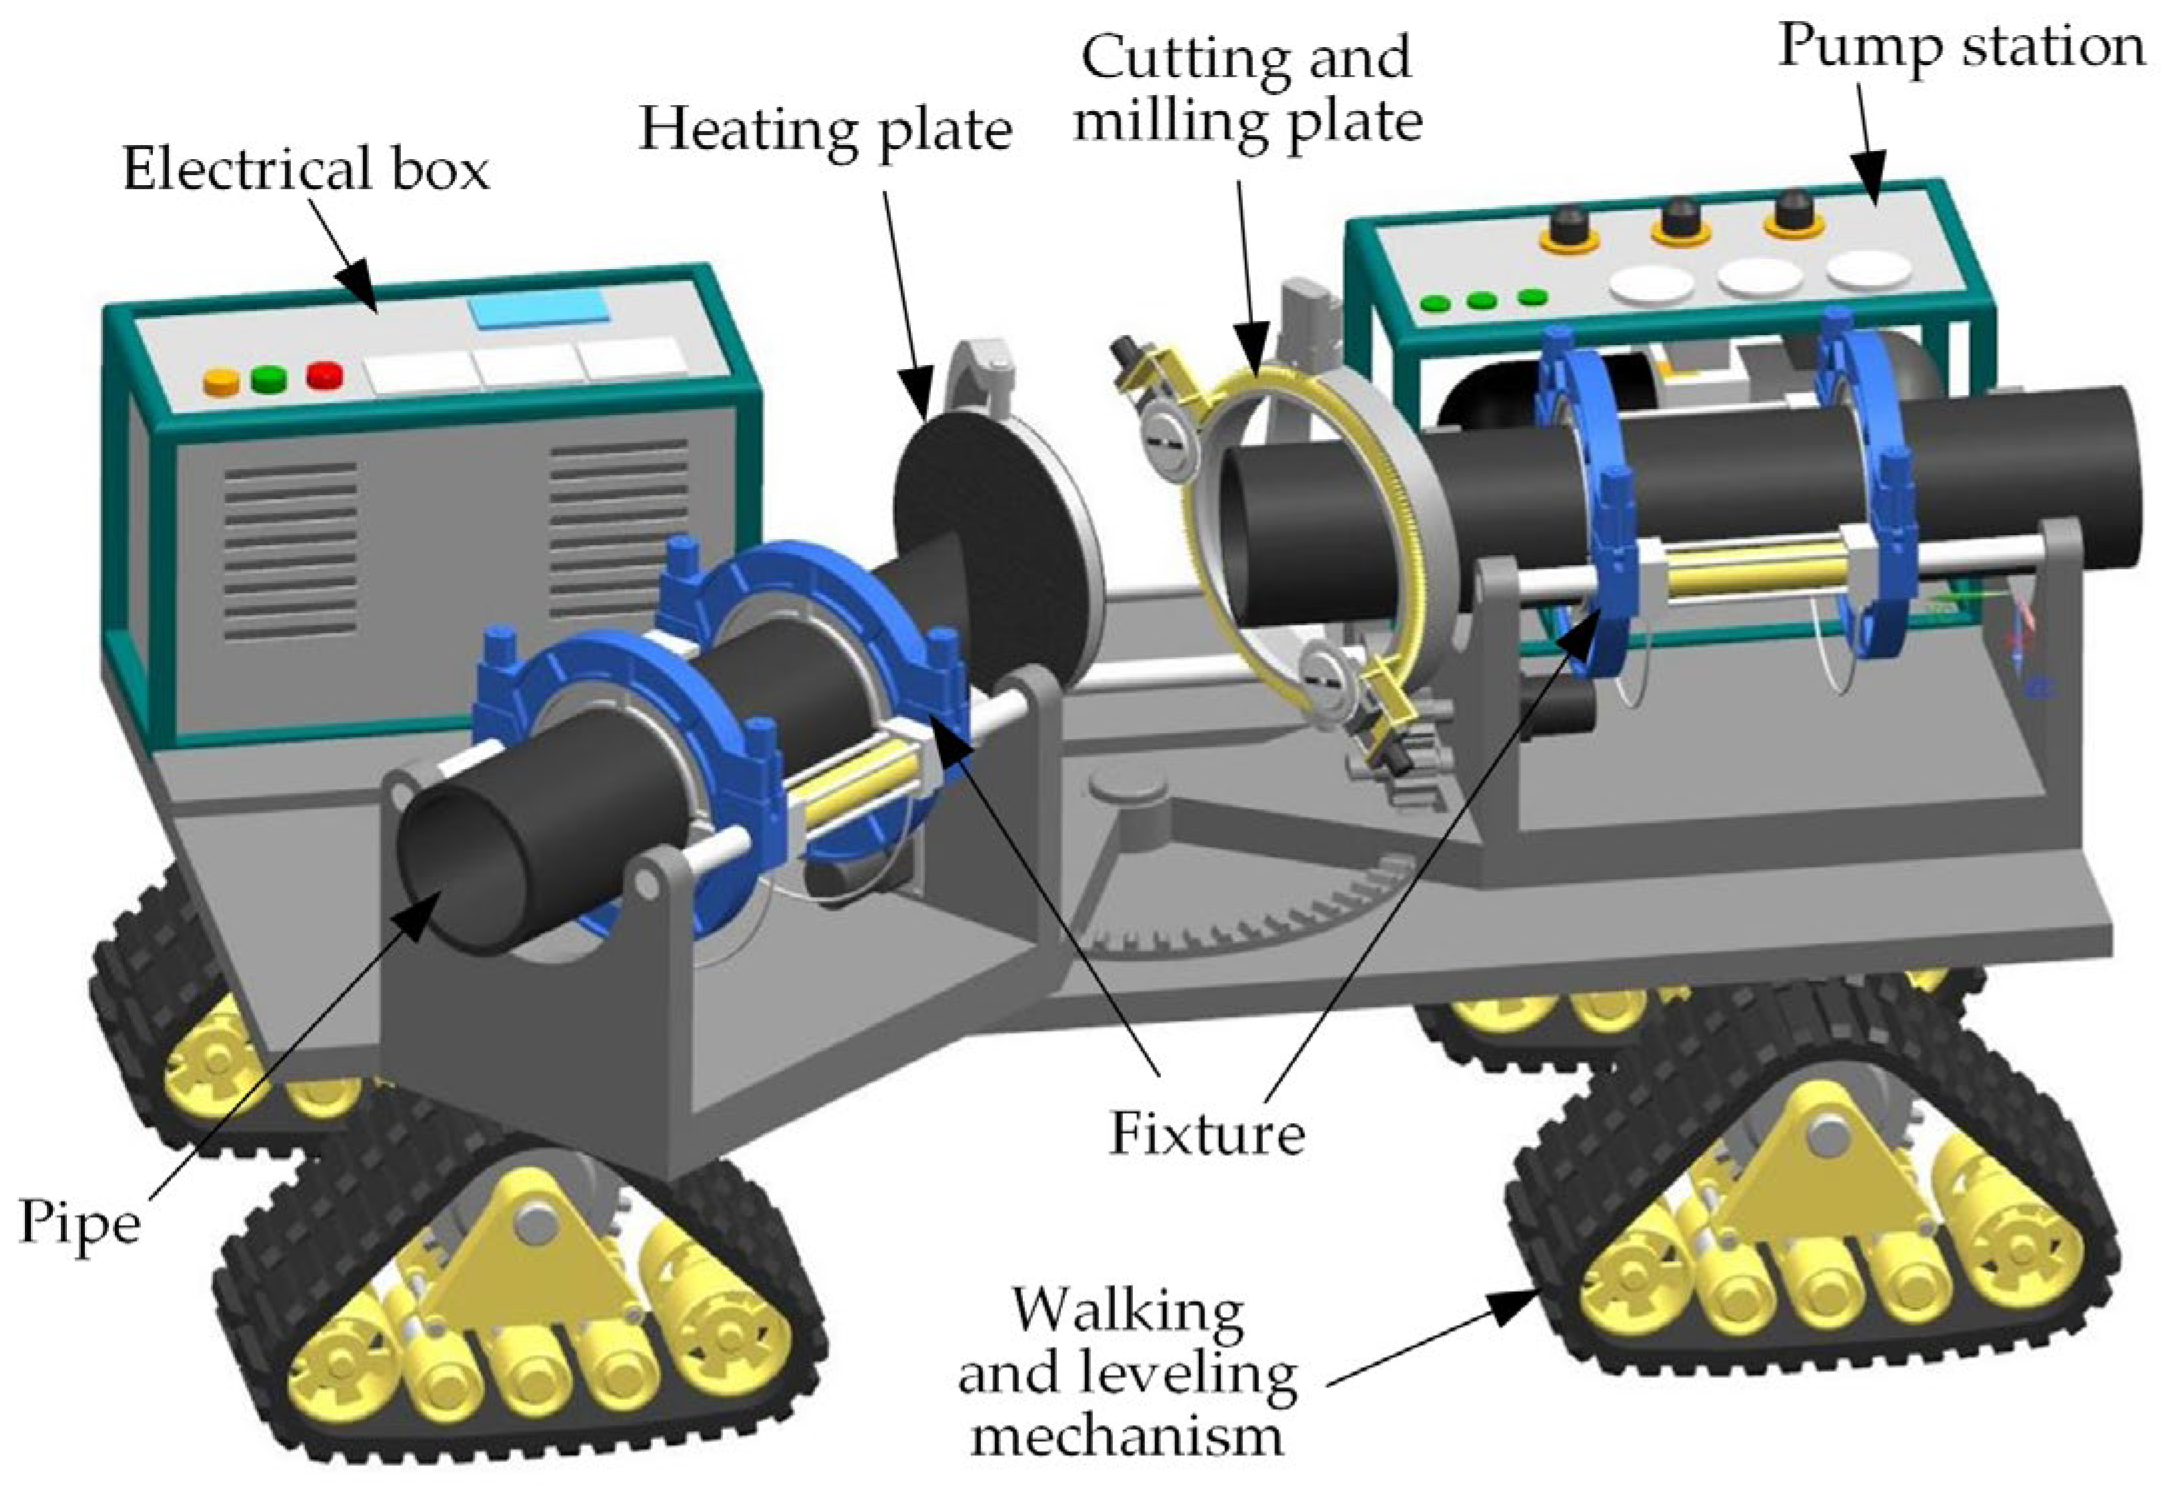
5.5. Innovative Design Scheme of PE-WM

Based on the contents of IIO-3 and the available parts of IIO-1 and IIO-2, we organize the design requirements for the new product as the FIO for PE-WM. We present the contents of the FIO in the form of a design specification, as shown in Table 15. Following this design specification, we propose a conceptual scheme for the new PE-WM. The conceptual scheme integrates systems as a whole with functions of walking and leveling to adapt to uneven working environments, as shown in Figure 26. The most special feature of the scheme is the ability to weld pipes at an angle of less than 180°, as shown in Figure 27. A gyroscope-like ring support structure is designed to support the heating and milling plates, allowing them to rotate around their vertical axis at the target angle to adapt to the shape of the pipe’s end face, as shown in Figure 28. The final design is shown in Figure 29.
Table 15. Design specification of a new PE-WM.
Figure 26. Walking and leveling mechanism.
Figure 27. Angle adjusting mechanism.
Figure 28. Milling and heating plate structures.
Figure 29. A new concept scheme of PE-WM.

5.6. Solution Evaluation and Comparison

Collecting and analyzing patents authorized in recent years, it was found that there are two main types of PE pipeline connection methods: joint and automatic (semi-automatic) types. The former requires customized joints according to demand, and its principle is to electrify the electric heating wire in the joint and pipe combination area to melt the material in the area and then cool it down to realize the connection. The latter, similar to the proposed scheme, is an automated or semi-automated device for connecting by heating and melting the pipe ends to butt the two pipes. As shown in Table 16, some representative patents are analyzed, and the advantages and disadvantages of the two types of schemes are summarized.
Table 16. Analysis of related patents.
Compared with other designs, the proposed solution has obvious advantages, such as easy construction, easy transportation, self-walking, and adjustable attitude. Most importantly, the proposed design has the function of connecting pipes at any angle, which is not available in other designs. It can reduce the construction difficulty of complex terrain, improve construction efficiency, and reduce cost. Therefore, the proposed design is innovative and has a broad application prospect. In the future, it can be further enhanced by absorbing the advantages of other schemes, such as connecting pipes of different materials and improving the structural load-bearing capacity of the joints.

6. Discussion

This paper proposes an innovation opportunity generation method based on the evolution of product scenarios, where future product scenarios are obtained by analyzing only a small number of the most important stakeholders. It forms a product-centric scenario concept, the essence of which is a scenario state and scenario behavior chain based on scenario elements. Scenario element extension strategies and rules are proposed based on NECs and basic element extension theories to ensure the quality and quantity of innovation opportunities. The construction of new scenario element sets and impact sets enables the formation of IIOs, which is also the process behind the emergence of innovation opportunities. The evaluation of IIOs integrates expected novelty and value to assess the development potential of future products and forms FIOs through appropriate integration. The method explores the innovation opportunities of current products from the perspective of the future for a well-structured method. The innovative design of the PE pipeline hot-melt welding machine shows the effectiveness of the method.
Compared with the existing methods, our method has advantages in terms of its wide range of applicability and low dependence on existing products. Our method is highly maneuverable and friendly to front-line engineers. The proposed target element determination method is based on the function model transformation, which avoids adverse results caused by blind selection to improve the efficiency and quality in terms of obtaining innovative opportunities. We have formulated rules and strategies for the scenario element extension to provide clear guidance and reference for designers, thus helping reduce uncertainty and risks in decision-making. The automatic strategy selection method improves the efficiency of complex system element extension and reduces the effects of human subjectivity. The identification and evaluation of innovative opportunities based on new scenario elements help designers generate a large number of new element combinations with innovative thinking and new product design ideas. The advantages in quantity and novelty can yield breakthrough innovative opportunities with significant differences from existing products. Overall, our method is an efficient innovative opportunity analysis method that forms a theoretical and methodological foundation for automated opportunity analysis.
In contrast to existing opportunity analysis studies, such as demand analysis or patent analysis, this method is an ex ante prediction method. It does not rely on pre-existing data, such as user reviews and patent applications. The generation, collection, organization, and analysis of data can take a lot of time and resources, and the collected data may be biased and incomplete. Our method focuses on forecasting future needs and predicting trends and opportunities by analyzing changes in current technologies, markets, and environments. This foresight enables companies to plan ahead and seize future market opportunities. This method considers the dynamic changes in the future to capture the uncertainty of the market and technological development. It enables companies to flexibly adapt to future changes and adjust their strategies on time.
This method is more efficient, targeted, and forward-looking because it goes directly from the scenario to the solution, which is different to the existing methods. Starting directly from the product scenario, steps of requirements gathering and analysis can be skipped, thus saving time and resources. It can go directly to the conceptual design stage to identify problems and improvement points and then propose innovative solutions. Analyzing new product scenarios allows for more accurate identification of potential improvement spaces and innovation opportunities for product development. In addition, it is possible to anticipate future problems and challenges so that coping strategies can be developed in advance. In contrast, the requirement analysis tends to focus more on current needs and problems and may not be accurate enough to grasp future trends and changes.
According to the KANO model, the most valuable needs for product innovation are excitement needs. However, these kinds of needs cannot usually be captured by analyzing historical data because users are unable to explicitly express such needs. In addition, the excitement needs are characterized by generating attributes that are different from the current product state, which is unexpected by users or exceeds their expectations of the product or service. Our method predicts future needs rather than incrementally improving an existing product. This makes it more effective in generating innovative opportunities to satisfy the excitement need. The analysis of innovation opportunities for the PE pipeline hot-melt welding machine shows that our method can obtain many high-value innovation opportunities, proving the effectiveness of the method.
There are still some limitations of this method. Firstly, the use of the element extension rule still relies on the experience of designers, and different people may produce different results. The diversity and creativity of the results are related to the ability of designers, especially divergent thinking and imagination. This aspect can be improved by organizing multidisciplinary, multilevel, and cross-domain designers to work together to contribute multidimensional knowledge for the element extension. Secondly, the coverage of the sample data of the BP neural network in the method is limited; it may not be applicable to products in other domains. Therefore, more sample data will be collected, and the distance and coverage of the sample data will be expanded to improve the generalizability of our method.

Author Contributions

Conceptualization, F.W. and R.T.; methodology, F.W., K.W. and Y.D.; project administration, R.T.; supervision, R.T.; validation, F.W. and R.T.; visualization, F.W.; writing—original draft, F.W.; writing—review and editing, Q.P. All authors have read and agreed to the published version of the manuscript.

Funding

This research was funded by the National Natural Science Foundation of China, grant number 51675159, the Central Government Guides Local Science and Technology Projects of China, grant number 18241837G.

Data Availability Statement

The data that support the findings of this study are available on request from the corresponding author, R.T., upon reasonable request.

Conflicts of Interest

The authors declare no conflict of interest.

Appendix A

Table A1. BPA functions of the functions (A1–A31).
No.m1(E1)m2(E2)m3(E3)No.m1(E1)m2(E2)m3(E3)No.m1(E1)m2(E2)m3(E3)
H1A10.000.150.11A120.100.030.09A220.620.740.69
H20.440.320.150.140.170.360.330.210.20
H30.540.520.720.750.780.530.040.010.07
Θ0.020.010.020.010.020.020.010.040.04
H1A20.200.060.13A130.100.030.09A230.680.500.71
H20.230.280.270.140.170.360.260.250.22
H30.550.650.590.750.780.530.040.140.00
Θ0.020.010.010.010.020.020.020.110.07
H1A30.200.060.13A140.010.060.06A240.740.380.52
H20.230.280.270.110.210.150.120.360.31
H30.550.650.590.870.710.780.100.200.08
Θ0.020.010.010.010.020.010.040.060.09
H1A40.000.150.11A150.150.010.03A250.170.090.18
H20.440.320.150.170.060.210.430.680.70
H30.540.520.720.670.920.740.370.210.11
Θ0.020.010.020.010.010.020.030.020.01
H1A50.080.150.09A160.000.010.00A260.160.030.15
H20.180.200.200.040.090.070.710.810.59
H30.720.630.700.950.890.920.110.150.24
Θ0.020.020.010.010.010.010.020.010.02
H1A60.130.020.10A170.150.010.03A270.740.380.52
H20.170.090.210.170.060.210.120.360.31
H30.690.880.670.670.920.740.100.200.08
Θ0.010.010.020.010.010.020.040.060.09
H1A70.060.020.11A180.010.060.06A280.170.090.18
H20.280.190.240.110.210.150.430.680.70
H30.650.780.630.870.710.780.370.210.11
Θ0.010.010.020.010.020.010.030.020.01
H1A80.090.030.05A190.170.300.14A290.260.180.22
H20.160.090.230.660.550.840.440.720.62
H30.740.860.710.070.110.010.270.090.14
Θ0.010.020.010.100.040.010.030.010.02
H1A90.140.110.01A200.030.050.11A300.620.740.69
H20.190.160.240.200.110.160.330.210.20
H30.650.720.740.760.820.720.040.010.07
Θ0.020.010.010.010.020.010.010.040.04
H1A100.140.290.26A210.260.180.22A310.750.540.63
H20.580.460.510.440.720.620.140.270.29
H30.260.230.220.270.090.140.100.170.07
Θ0.020.020.010.030.010.020.010.020.01
H1A110.230.130.02
H20.520.740.71
H30.240.110.26
Θ0.010.020.01
Table A2. Probability of function belonging to a level.
No.ProbabilityNo.Probability
H1H2H3ΘH1H2H3Θ
A10.00167580.10495190.89335600.0000163A170.00032670.00598750.99368170.0000041
A20.00867950.08179000.90952240.0000081A180.00021480.00862080.99116050.0000039
A30.00867950.08179000.90952240.0000081A190.03472960.96398040.00118890.0001012
A40.00167580.10495190.89335600.0000163A200.00070000.00972260.98957320.0000042
A50.00481210.02620570.96897080.0000113A210.05563220.92416540.02017710.0000253
A60.00115530.00952340.98931670.0000046A220.94554320.05373190.00068270.0000422
A70.00076500.04256210.95666730.0000056A230.91701050.08009720.00246810.0004242
A80.00062090.00934610.99002880.0000042A240.86424120.11018730.02467890.0008926
A90.00101560.02372320.97525590.0000053A250.01711860.93760360.04525320.0000246
A100.07469150.83548680.08979940.0000223A260.00328160.98217180.01453590.0000108
A110.00359490.96714210.02925630.0000067A270.86424120.11018730.02467890.0008926
A120.00173790.03130470.96694590.0000116A280.01711860.93760360.04525320.0000246
A130.00173790.03130470.96694590.0000116A290.05563220.92416540.02017710.0000253
A140.00021480.00862080.99116050.0000039A300.94554320.05373190.00068270.0000422
A150.00032670.00598750.99368170.0000041A310.94872900.04544730.00581670.0000070
A160.00000120.00049630.99950120.0000012
Table A3. C–A–O structure of the functions (A1–A31).
No.CarrierActObjectNo.CarrierActObject
A1UserOperateFixture-2A17Guide rodInstallHeating plate
A2UserOperateMilling plateA18Guide rodInstallFixture-1
A3UserOperateHeating plateA19Fixture-1Fasten and MovePipe-1
A4UserOperateFixture-1A20CabelPowerHeating plate
A5UserOperatePump stationA21Pipe-1PushHeating plate
A6UserOperateElectrical boxA22Heating plateHeatPipe-1
A7WeatherEffectElectrical boxA23GroundHoldBase
A8CablePowerPump stationA24Milling plateMillPipe-1
A9Pump stationPushPiping and Hydraulic oilA25Pipe-1PushMilling plate
A10Piping and Hydraulic oilPushHydraulic cylinderA26Fixture-2FastenPipe-2
A11Hydraulic cylinderPushFixture-1A27Milling plateMillPipe-2
A12Nut and boltFastenFixture-1A28Milling platePushPipe-2
A13Nut and boltFastenFixture-2A29Heating platePushPipe-2
A14Guide rodInstallFixture-2A30Heating plateHeatPipe-2
A15Guide rodInstallMilling plateA31Pipe-1PushPipe-2
A16BaseFixGuide rod

References

  1. Ferreira, J.J.M.; Fernandes, C.I.; Ferreira, F.A.F. To be or not to be digital, that is the question: Firm innovation and performance. J. Bus. Res. 2019, 101, 583–590. [Google Scholar] [CrossRef]
  2. Suchek, N.; Fernandes, C.I.; Kraus, S.; Filser, M.; Sjögrén, H. Innovation and the circular economy: A systematic literature review. Bus. Strategy Environ. 2021, 30, 3686–3702. [Google Scholar] [CrossRef]
  3. Jeong, B.; Yoon, J.; Lee, J.M. Social media mining for product planning: A product opportunity mining approach based on topic modeling and sentiment analysis. Int. J. Inf. Manag. 2019, 48, 280–290. [Google Scholar] [CrossRef]
  4. Hock-Doepgen, M.; Clauss, T.; Kraus, S.; Cheng, C.F. Knowledge management capabilities and organizational risk-taking for business model innovation in SMEs. J. Bus. Res. 2021, 130, 683–697. [Google Scholar] [CrossRef]
  5. He, J.; Ortiz, J. Sustainable business modeling: The need for innovative design thinking. J. Clean. Prod. 2021, 298, 126751. [Google Scholar] [CrossRef]
  6. Liu, A.; Lu, S. Functional design framework for innovative design thinking in product development. CIRP J. Manuf. Sci. Technol. 2020, 30, 105–117. [Google Scholar] [CrossRef]
  7. Kudrowitz, B.M.; Wallace, D. Assessing the quality of ideas from prolific, early-stage product ideation. J. Eng. Des. 2013, 24, 120–139. [Google Scholar] [CrossRef]
  8. Holmén, M.; Magnusson, M.; McKelvey, M. What are innovative opportunities? Ind. Innov. 2007, 14, 27–45. [Google Scholar] [CrossRef]
  9. Kifetew, F.M.; Perini, A.; Susi, A.; Siena, A.; Muñante, D.; Morales-Ramirez, I. Automating user-feedback driven requirements prioritization. Inform. Softw. Technol. 2021, 138, 106635. [Google Scholar] [CrossRef]
  10. Huang, C.; Chen, Y. How to enhance the green innovation of sports goods? Micro- and macro-level evidence from China’s manufacturing enterprises. Front. Environ. Sci. 2022, 9, 809156. [Google Scholar] [CrossRef]
  11. Shen, S.; Venaik, S.; Zhu, Y. A dynamic model of internationalization and innovation in emerging market enterprises: Knowledge exploration, transformation, and exploitation. Manag. Int. Rev. MIR J. Int. Bus. 2023, 63, 561–610. [Google Scholar] [CrossRef] [PubMed]
  12. Dean, T.; Zhang, H.; Xiao, Y. The role of complexity in the valley of death and radical innovation performance. Technovation 2022, 109, 102160. [Google Scholar] [CrossRef]
  13. Hagspiel, V.; Huisman, K.J.M.; Kort, P.M.; Lavrutich, M.N.; Nunes, C.; Pimentel, R. Technology adoption in a declining market. Eur. J. Oper. Res. 2020, 285, 380–392. [Google Scholar] [CrossRef]
  14. Lin, F.; Evans, R.D.; Kharel, R.; Williams, R.A. Competitor intelligence and product innovation: The role of open-mindedness and interfunctional coordination. IEEE Trans. Eng. Manag. 2022, 69, 314–328. [Google Scholar] [CrossRef]
  15. Lu, C.; Gu, T.; Chen, J.; Liu, Z. Will internet market newness improve performance? An empirical study on the internet market Innovation of Offline Retailers in China. Sustainability 2021, 13, 12619. [Google Scholar] [CrossRef]
  16. Restuccia, M.; de Brentani, U.; Legoux, R.; Ouellet, J.F. Product life-cycle management and distributor contribution to new product development. J. Prod. Innov. Manag. 2016, 33, 69–89. [Google Scholar] [CrossRef]
  17. Yoruk, E.; Jones, P. Firm-environment alignment of entrepreneurial opportunity exploitation in technology-based ventures: A configurational approach. J. Small Bus. Manag. 2023, 61, 612–658. [Google Scholar] [CrossRef]
  18. Rossiter, J.R.; Lilien, G.L. New “brainstorming” principles. Aust. J. Manag. 1994, 19, 61–72. [Google Scholar] [CrossRef]
  19. Chen, J. The Using of Mind Map in Concept Design. In Proceedings of the 2008 9th International Conference on Computer-Aided Industrial Design and Conceptual Design, Kunming, China, 22–25 November 2008; pp. 1034–1037. [Google Scholar]
  20. Boonpracha, J. SCAMPER for creativity of students’ creative idea creation in product design. Think. Ski. Creat. 2023, 48, 101282. [Google Scholar] [CrossRef]
  21. Ilevbare, I.M.; Probert, D.; Phaal, R. A Review of TRIZ, and its benefits and challenges in practice. Technovation 2013, 33, 30–37. [Google Scholar] [CrossRef]
  22. Mann, D.L. Better Technology forecasting using systematic innovation methods. Technol. Forecast. Soc. 2003, 70, 779–795. [Google Scholar] [CrossRef]
  23. Huang, J.Y.; Siao, S.T. Development of an integrated bionic design system. J. Eng. Des. Technol. 2016, 14, 310–327. [Google Scholar] [CrossRef]
  24. Jia, L.; Peng, Q.; Tan, R.; Zhu, X. Analogical stimuli retrieval approach based on R-SBF ontology model. J. Eng. Des. 2019, 30, 599–624. [Google Scholar] [CrossRef]
  25. McLafferty, I. Focus group interviews as a data collecting strategy. J. Adv. Nurs. 2004, 48, 187–194. [Google Scholar] [CrossRef] [PubMed]
  26. Li, M.; Ming, X.; He, L.; Zheng, M.; Xu, Z. A TRIZ-based trimming method for patent design around. Comput. Aided Des. 2015, 62, 20–30. [Google Scholar] [CrossRef]
  27. Canfora, G.; Di Penta, M. New Frontiers of Reverse Engineering. In Proceedings of the Future of Software Engineering (FOSE ′07), Minneapolis, MN, USA, 23–25 May 2007; pp. 326–341. [Google Scholar]
  28. Huizingh, E.K.R.E. Open innovation: State of the art and future perspectives. Technovation 2011, 31, 2–9. [Google Scholar] [CrossRef]
  29. Bradfield, R.; Wright, G.; Burt, G.; Cairns, G.; Van Der Heijden, K. The origins and evolution of scenario techniques in long range business planning. Futures 2005, 37, 795–812. [Google Scholar] [CrossRef]
  30. Cornelius, P.; Van De Putte, A.; Romani, M. Three decades of scenario planning in Shell. Calif. Manag. Rev. 2005, 48, 92–109. [Google Scholar] [CrossRef]
  31. Huss, W.R.; Honton, E.J. Scenario planning—What style should you use? Long Range Plann. 1987, 20, 21–29. [Google Scholar] [CrossRef]
  32. Godet, M. The art of scenarios and strategic planning: Tools and pitfalls. Technol. Forecast. Soc. 2000, 65, 3–22. [Google Scholar] [CrossRef]
  33. Spaniol, M.J.; Rowland, N.J. Defining scenario. Futures Foresight Sci. 2019, 1, e3. [Google Scholar] [CrossRef]
  34. Sardar, Z. The namesake: Futures; futures studies; futurology; futuristic; foresight—what’s in a name? Futures 2010, 42, 177–184. [Google Scholar] [CrossRef]
  35. Yu, X.; Wan, K.; Du, Q. The power of knowledge: Basic research and technological innovation–evidence from within and across industries in China. Appl. Econ. 2023; published online: 30 May 2023. [Google Scholar]
  36. Rao, S.K.; Prasad, R. Impact of 5G technologies on industry 4.0. Kluw. Commun. 2018, 100, 145–159. [Google Scholar] [CrossRef]
  37. Mirtalaie, M.A.; Hussain, O.K.; Chang, E.; Hussain, F.K. A decision support framework for identifying novel ideas in new product development from cross-domain analysis. Inform. Syst. 2017, 69, 59–80. [Google Scholar] [CrossRef]
  38. Hensen, A.H.R.; Dong, J.Q. Hierarchical business value of information technology: Toward a digital innovation value chain. Inf. Manag. 2020, 57, 103209. [Google Scholar] [CrossRef]
  39. Teece, D.J.; Pisano, G.; Shuen, A. Dynamic Capabilities and Strategic Management. Strateg. Manag. J. 1997, 18, 509–533. [Google Scholar] [CrossRef]
  40. Yung, I.-S.; Lai, M.-H. Dynamic Capabilities in New Product Development: The Case of Asus in Motherboard Production. Total Qual. Manag. Bus. Excell. 2012, 23, 1125–1134. [Google Scholar] [CrossRef]
  41. Buganza, T.; Dell’Era, C.; Verganti, R. Exploring the Relationships between Product Development and Environmental Turbulence: The Case of Mobile TLC Services. J. Prod. Innov. Manag. 2009, 26, 308–321. [Google Scholar] [CrossRef]
  42. Nieto, M.; Quevedo, P. Absorptive Capacity, Technological Opportunity, Knowledge Spillovers, and Innovative Effort. Technovation 2005, 25, 1141–1157. [Google Scholar] [CrossRef]
  43. Wang, C.; Geng, H.; Sun, R.; Song, H. Technological Potential Analysis and Vacant Technology Forecasting in the Graphene Field Based on the Patent Data Mining. Resour. Policy 2022, 77, 102636. [Google Scholar] [CrossRef]
  44. Shibata, N.; Kajikawa, Y.; Takeda, Y.; Matsushima, K. Detecting Emerging Research Fronts Based on Topological Measures in Citation Networks of Scientific Publications. Technovation 2008, 28, 758–775. [Google Scholar] [CrossRef]
  45. Guo, Y.; Xu, C.; Huang, L.; Porter, A. Empirically Informing a Technology Delivery System Model for an Emerging Technology: Illustrated for Dye-Sensitized Solar Cells. RD Manag. 2012, 42, 133–149. [Google Scholar] [CrossRef]
  46. Érdi, P.; Makovi, K.; Somogyvári, Z.; Strandburg, K.; Tobochnik, J.; Volf, P.; Zalányi, L. Prediction of Emerging Technologies Based on Analysis of the US Patent Citation Network. Scientometrics 2013, 95, 225–242. [Google Scholar] [CrossRef]
  47. You, H.; Li, M.; Hipel, K.W.; Jiang, J.; Ge, B.; Duan, H. Development Trend Forecasting for Coherent Light Generator Technology Based on Patent Citation Network Analysis. Scientometrics 2017, 111, 297–315. [Google Scholar] [CrossRef]
  48. Higham, K.; Contisciani, M.; De Bacco, C. Multilayer Patent Citation Networks: A Comprehensive Analytical Framework for Studying Explicit Technological Relationships. Technol. Forecast. Soc. Chang. 2022, 179, 121628. [Google Scholar] [CrossRef]
  49. Verspagen, B.; De Loo, I. Technology Spillovers between Sectors. Technol. Forecast. Soc. 1999, 60, 215–235. [Google Scholar] [CrossRef]
  50. Karki, M.M.S. Patent Citation Analysis: A Policy Analysis Tool. World Pat. Inf. 1997, 19, 269–272. [Google Scholar] [CrossRef]
  51. Yoon, B.; Magee, C.L. Exploring Technology Opportunities by Visualizing Patent Information Based on Generative Topographic Mapping and Link Prediction. Technol. Forecast. Soc. Chang. 2018, 132, 105–117. [Google Scholar] [CrossRef]
  52. Lee, C.; Kwon, O.; Kim, M.; Kwon, D. Early Identification of Emerging Technologies: A Machine Learning Approach Using Multiple Patent Indicators. Technol. Forecast. Soc. Chang. 2018, 127, 291–303. [Google Scholar] [CrossRef]
  53. Shen, Y.-C.; Wang, M.-Y.; Yang, Y.-C. Discovering the Potential Opportunities of Scientific Advancement and Technological Innovation: A Case Study of Smart Health Monitoring Technology. Technol. Forecast. Soc. 2020, 160, 120225. [Google Scholar] [CrossRef]
  54. Seo, W.; Yoon, J.; Park, H.; Coh, B.; Lee, J.-M.; Kwon, O.-J. Product Opportunity Identification Based on Internal Capabilities Using Text Mining and Association Rule Mining. Technol. Forecast. Soc. Chang. 2016, 105, 94–104. [Google Scholar] [CrossRef]
  55. Jun, S.; Sung Park, S.; Sik Jang, D. Technology Forecasting Using Matrix Map and Patent Clustering. Ind. Manag. Data Syst. 2012, 112, 786–807. [Google Scholar] [CrossRef]
  56. Son, C.; Suh, Y.; Jeon, J.; Park, Y. Development of a GTM-Based Patent Map for Identifying Patent Vacuums. Expert Syst. Appl. 2012, 39, 2489–2500. [Google Scholar] [CrossRef]
  57. Lee, C.; Kim, J.; Kwon, O.; Woo, H.-G. Stochastic Technology Life Cycle Analysis Using Multiple Patent Indicators. Technol. Forecast. Soc. 2016, 106, 53–64. [Google Scholar] [CrossRef]
  58. Cammarano, A.; Varriale, V.; Michelino, F.; Caputo, M. Employing Online Big Data and Patent Statistics to Examine the Relationship between End Product’s Perceived Quality and Components’ Technological Features. Technol. Soc. 2023, 73, 102231. [Google Scholar] [CrossRef]
  59. Zhou, T.; Lu, Y.; Wang, B. The Relative Importance of Website Design Quality and Service Quality in Determining Consumers’ Online Repurchase Behavior. Inform. Syst. Manag. 2009, 26, 327–337. [Google Scholar] [CrossRef]
  60. Morel, L.; Boly, V. New Product Development Process (NPDP): Updating the Identification Stage Practices. Int. J. Prod. Dev. 2006, 3, 232–251. [Google Scholar] [CrossRef]
  61. Jang, H.; Park, S.; Yoon, B. Exploring Technology Opportunities Based on User Needs: Application of Opinion Mining and SAO Analysis. Eng. Manag. J. 2023, 35, 209–222. [Google Scholar] [CrossRef]
  62. Ozcan, S.; Suloglu, M.; Sakar, C.O.; Chatufale, S. Social media mining for ideation: Identification of sustainable solutions and opinions. Technovation 2021, 107, 102322. [Google Scholar] [CrossRef]
  63. Yakubu, H.; Kwong, C.K.; Lee, C.K.M. A multigene genetic programming-based fuzzy regression approach for modelling customer satisfaction based on online reviews. Soft Comput. 2021, 25, 5395–5410. [Google Scholar] [CrossRef]
  64. Sardesai, S.; Stute, M.; Kamphues, J. A methodology for future scenario planning. In Next Generation Supply: A Roadmap for Research and Innovation; Springer: Cham, Switzerland, 2021; pp. 35–59. [Google Scholar]
  65. Weimer-Jehle, W. Cross-Impact Balances: A system-theoretical approach to cross-impact analysis. Technol. Forecast. Soc. 2006, 73, 334–361. [Google Scholar] [CrossRef]
  66. Bottero, M.; Assumma, V.; Caprioli, C.; Dell’Ovo, M. Decision making in urban development: The application of a hybrid evaluation method for a critical area in the city of Turin (Italy). Sustain. Cities Soc. 2021, 72, 103028. [Google Scholar] [CrossRef]
  67. Von Wirth, T.; Wissen Hayek, U.; Kunze, A.; Neuenschwander, N.; Stauffacher, M.; Scholz, R.W. Identifying urban transformation dynamics: Functional use of scenario techniques to integrate knowledge from science and practice. Technol. Forecast. Soc. 2014, 89, 115–130. [Google Scholar] [CrossRef]
  68. Strengers, Y.; Dahlgren, K.; Pink, S.; Sadowski, J.; Nicholls, L. Digital Technology and energy imaginaries of future home life: Comic-strip scenarios as a method to disrupt energy industry futures. Energy Res. Soc. Sci. 2022, 84, 102366. [Google Scholar] [CrossRef]
  69. Andersen, P.D.; Hansen, M.; Selin, C. Stakeholder inclusion in scenario planning—A review of european projects. Technol. Forecast. Soc. 2021, 169, 120802. [Google Scholar] [CrossRef]
  70. Schuh, G.; Schultze, W.; Schiffer, M.; Rieger, A.; Rudolf, S.; Lehbrink, H. Scenario-based determination of product feature uncertainties for robust product architectures. Prod. Eng. 2014, 8, 383–395. [Google Scholar] [CrossRef]
  71. Kurakawa, K. A Scenario-driven conceptual design information model and its formation. Res. Eng. Des. 2004, 15, 122–137. [Google Scholar] [CrossRef]
  72. Randt, N.P. An Approach to product development with scenario planning: The case of aircraft design. Futures 2015, 71, 11–28. [Google Scholar] [CrossRef]
  73. Shin, J.E.; Sutcliffe, A.G.; Gregoriades, A. Scenario advisor tool for requirements engineering. Requir. Eng. 2005, 10, 132–145. [Google Scholar] [CrossRef]
  74. Liu, F.; Li, X.; Shi, Y. Scientific breakthrough study of extenics. Procedia Comput. Sci. 2016, 91, 526–531. [Google Scholar] [CrossRef]
  75. Li, W.; Song, Z.; Mao, E.; Suh, S. Using extenics to describe coupled solutions in axiomatic design. J. Eng. Des. 2019, 30, 1–31. [Google Scholar] [CrossRef]
  76. Fulton Suri, J.; Marsh, M. Scenario building as an ergonomics method in consumer product design. Appl. Ergon. 2000, 31, 151–157. [Google Scholar] [CrossRef] [PubMed]
  77. Sheu, D.D.; Hou, C.T. TRIZ-based systematic device trimming: Theory and application. Procedia Eng. 2015, 131, 237–258. [Google Scholar] [CrossRef]
  78. Pahl, G.; Wallace, K.; Blessing, L. Engineering Design: A Systematic Approach, 3rd ed.; Springer: London, UK, 2007; ISBN 978-1-84628-318-5. [Google Scholar]
  79. Liu, F.; Zhao, Q.; Yang, Y. An approach to assess the value of industrial heritage based on dempster—Shafer theory. J. Cult. Herit. 2018, 32, 210–220. [Google Scholar] [CrossRef]
  80. Dong, Y.; Tan, R.; Zhang, P.; Peng, Q.; Shao, P. Product redesign using functional backtrack with digital twin. Adv. Eng. Inform. 2021, 49, 101361. [Google Scholar] [CrossRef]
  81. Yang, C. Extension Innovation Method, 1st ed.; CRC Press: Boca Raton, FL, USA, 2018. [Google Scholar]
  82. Wang, K.; Tan, R.; Peng, Q.; Sun, Y.; Li, H.; Sun, J. Radical innovation of product design using an effect solving method. Comput. Ind. Eng. 2021, 151, 106970. [Google Scholar] [CrossRef]
  83. Zhang, P.; Nie, Z.; Dong, Y.; Zhang, Z.; Yu, F.; Tan, R. Smart concept design based on recessive inheritance in complex electromechanical system. Adv. Eng. Inform. 2020, 43, 101010. [Google Scholar] [CrossRef]
  84. Bartini, R.O.D. Relations between physical constants. Prog. Phys. 2005, 3, 34–40. [Google Scholar]
Disclaimer/Publisher’s Note: The statements, opinions and data contained in all publications are solely those of the individual author(s) and contributor(s) and not of MDPI and/or the editor(s). MDPI and/or the editor(s) disclaim responsibility for any injury to people or property resulting from any ideas, methods, instructions or products referred to in the content.

Article Metrics

Citations

Article Access Statistics

Multiple requests from the same IP address are counted as one view.