1. Introduction
The self-driving automobile, also known as a driverless car or autonomous vehicle (AV), is able to sense the environment and navigate autonomously without the assistance of a driver [
1]. The level of vehicle automation, as classified by the Society of Automotive Engineers (SAE) (2016), falls between L1 (driver assistance) and L5 (full driving automation) [
2]. It is the goal of major manufacturers, such as Google, Tesla, and Huawei, to achieve L5 autonomous driving, which may be the final form of car driving.
In China, the popularity of intelligent vehicles is increasing, which makes autonomous driving more and more feasible. China’s robotaxi market is expected to reach 15.8 billion yuan in 2022, according to China Robotaxi Industry Development Insights 2022. In the online car-hailing and traditional taxi markets, robotaxi has a penetration rate of 3%. During the period from 2024 to 2027, the market size will increase from 85 billion yuan to 139 billion yuan, and the penetration rate will increase from 15% to 22%. Market size is expected to reach 196.2 billion yuan by 2028, with a penetration rate of 30% [
3]. A positive attitude towards unmanned vehicles is also demonstrated by the government and enterprises. Robotaxi is also a future trend and form of transportation.
A driverless vehicle may bring considerable benefits to road safety, flexibility, inclusivity, and sustainability in today’s society, where vehicles are becoming more and more popular [
4]. With China’s large population base, daily commuters, tourists, and travelers, unmanned vehicles may have a bright future in this market. From the perspective of taxi companies, robotaxi can reduce the labor cost of taxi drivers and facilitate management, as well as serve as a new technology to attract consumers. From the perspective of consumers, robotaxi may be able to calculate the most efficient route more easily since it is autonomously driven, which may reduce communication issues with drivers. Female consumers may feel that robotaxi will be safer and have additional advantages. Robotaxi can impact the issues associated with security, trust, privacy, accountability, reliability, and transparency [
5]. It is still a relatively new travel mode for users, even though robotaxi has been piloted in cities such as Beijing, Changsha, and Guangzhou. As a new mobility model, robotaxi’s popularity has a certain effect on the function and efficiency of urban traffic, so further exploration of consumer perception is necessary in order to improve their acceptance of robotaxi.
This study aims to explore the perceptions of general consumers or potential consumers towards robotaxis and how these perceptions influence their behavioral intention to ultimately use robotaxis by investigating China’s robotaxi users. This study employs variables such as performance expectancy, service expectancy, and perceived risk to establish a hypothetical model to examine the factors influencing consumers’ usage of robotaxis. This research perspective is relatively novel in the current field and aids businesses in deepening their understanding of the underlying motivations of consumers. At a time when urban transportation faces challenges, the promotion of autonomous vehicles becomes particularly crucial.
Additionally, the results of this study can provide governments, businesses, or investors with an in-depth analysis of the robotaxi market outlook from a consumer perspective, offering valuable decision-making direction. Our research can aid in understanding the development of China’s robotaxi market and delve deeper into key factors such as user needs, technological advancement, and market prospects, providing profound insights and robust support for the future development of robotaxis.
2. Theoretical Framework
In order to effectively evaluate consumers’ willingness to use robotaxi and establish consumers’ relevant cognition, this study builds a research framework by selecting relevant constructs as the assessment content involved in the study through literature review and discussion.
2.1. Performance Expectancy and Effort Expectancy
The subjects of performance expectation and effort expectation are generally discussed together in UTAUT [
6] or UTAUT2 [
7]. In terms of performance expectancy, it is the degree to which an individual believes that the system will contribute to the improvement of their job performance [
6]. The effort expectancy of a system relates to how easy it is for individuals to use it [
7]. According to the definition, performance expectancy and effort expectancy refer to the degree to which consumers accept new products and new technologies, i.e., the degree to which they are easy to use and useful [
8]. According to this study, performance expectancy refers to the degree to which robotaxi’s travel efficiency meets expectations, while effort expectancy refers to the ease with which it can be used. The study by Kanwaldeep et al. considers performance expectancy when investigating key factors for consumer adoption of autonomous vehicles [
9]. According to their study, self-driving cars will perform better than manual-driven vehicles [
10]. In addition, effort expectancy has implications for consumers’ behavioral intentions regarding autonomous vehicles [
11]. Unmanned vehicles are more likely to be adopted by consumers when their effort expectations are lower [
12]. In this study, we focus on performance expectancy and effort expectancy because robotaxi is still in the exploratory stage in China, and there are only a few cities currently being piloted. In addition to conducting research from the viewpoint of unmanned vehicle technology, it is important to look at consumer views, perceptions, and acceptance of robotaxi. While there are similar factors in UTAUT, such as facilitating conditions and social influence, there is a lack of social influence conditions because we are analyzing subjective cognition and robotaxi has not yet established a large-scale presence in China. Due to this, other constructs of UTAUT are not taken into account in this study.
2.2. Perceived Risk
First, perceived risk is associated with psychology research, which relates to consumers’ expectations of negative outcomes when purchasing a particular product [
13]. Because driverless cars are a new technology undergoing development, it is understandable that consumers are concerned about them. Unmanned vehicles may cause consumers’ concerns due to online reports [
14], media perceptions [
15], etc. In addition, consumers may have concerns about hacker attacks, vehicles being remotely controlled, and autonomous driving being disrupted by emergencies [
9,
16]. Therefore, unmanned vehicles still require improvements in order to be reliable in the face of small probability events [
17]. The perceived risk in this study refers to the likelihood that consumers perceive risks associated with robotaxi’s service quality, safety, and travel experience. As consumers weigh risks and benefits before making a final decision [
18], the lower the perceived risks, the higher the perceived advantages of unmanned vehicles [
18]. Additionally, the less risk consumers perceive, the more likely they are to adopt robotaxi.
2.3. Behavioral Intention
The behavioral intention indicator is an important component of consumer research, since it indicates the likelihood of the consumer taking a particular action [
19]. Consumer behavior has also been extensively discussed in the field of unmanned vehicles. Shirley et al. discuss how value orientation, media attention, and scientific knowledge influence Singaporeans’ behavioral intention to use self-driving cars [
20]. Ghasri and Vij investigated the influence of media comments and social influence on consumer behavioral intentions, particularly in relation to the distinction between different natural attributes of consumers [
21]. Kaur and Rampersad discuss the aspects of security and privacy that consumers are most concerned about [
9]. A reduction or elimination of consumer concerns will result in an increase in consumer behavioral intention. According to this study, the consumer’s behavioral intention represents the degree of willingness to ride a robotaxi. An individual’s behavioral intention is positively influenced by positive intentions and negatively influenced by negative intentions. As a result, in this study, the consumers’ intentions to adopt robotaxi may be influenced by their PE and EE, and at the same time, they may be negatively affected by their PR.
3. Research Method and Hypothesis
Based on the research purpose, this study draws up a research structure and integrates and analyzes the theoretical basis of relevant literature in order to carry out research methods and develop a research plan for implementation. This chapter explores the relevant influencing factors that affect consumers’ adoption of robotaxi based on literature research, establishes hypotheses, and uses quantitative questionnaires and scale survey methods to test these hypotheses. Following the reliability analysis and item analysis of the questionnaires, a correlation analysis was performed using a structural equation model. In addition to providing specific practice recommendations, the factors that impact the consumer the most were analyzed.
3.1. Proposed Theoretical Model and Research Hypothesis
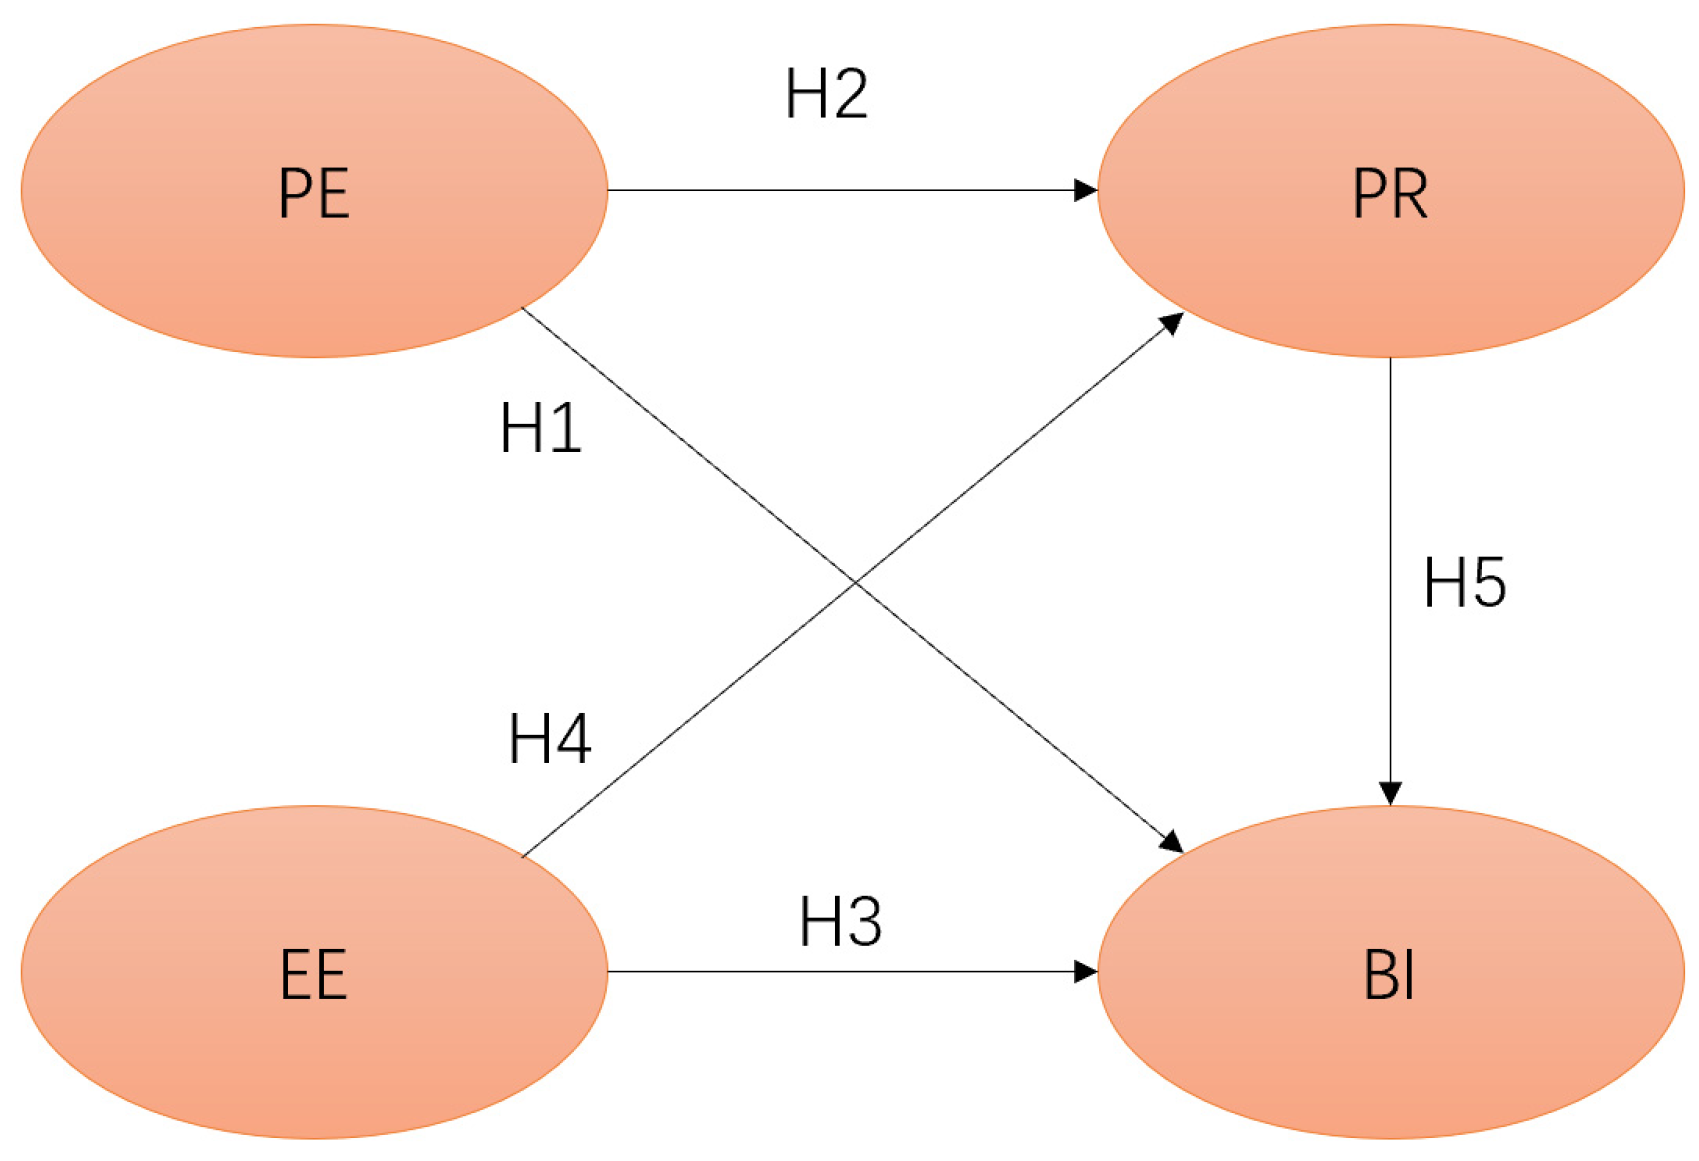
Considering the above discussion, this study proposes the following hypotheses and constructs a model based on the hypothetical relationship. The model includes four constructs, performance expectancy (PE), effort expectancy (EE), perceived risk (PR), and behavioral intention (BI), as well as five related research hypotheses (
Figure 1).
Hypothesis 1 (H1). Performance expectancy is significantly positively correlated with the consumers’ behavioral intention of robotaxi.
Hypothesis 2 (H2). Performance expectancy and consumers’ perceived risk for robotaxi are significantly negatively correlated.
Hypothesis 3 (H3). Effort expectancy is significantly positively correlated with the consumers’ behavioral intention of robotaxi.
Hypothesis 4 (H4). Effort expectancy and consumers’ perceived risk for robotaxi are significantly negatively correlated.
Hypothesis 5 (H5). Perceived risk is significantly negatively correlated with the consumers’ behavioral intention of robotaxi.
3.2. Definitions of Research Variables
According to the research topic and literature relevant to this study, the items of the questionnaire were designed. In
Table 1, we present the definition of variable operability and the reference source for the scale.
4. Results
This chapter focuses primarily on the research objectives of two stages: the distribution and collection of questionnaires, and the subsequent quantitative analysis of the data. A detailed description of the calculation process and statistical results is provided below:
4.1. Descriptive Analysis of Demographic Variables
From February to May 2022, a Chinese online questionnaire was distributed through the Questionnaire Star network platform to citizens in Beijing, Changsha, Guangzhou, and other cities with robotaxi pilot programs. As robotaxi is still in the pilot stage, consumers in these major cities, particularly those who have experienced autonomous taxis, constitute our primary target for investigation. Additionally, given the preliminary nature of this study, there are no extensive restrictions imposed on the consumer demographic.
In the survey, all subjects click on a link to view the survey description, while they also voluntarily answer the research questions and can launch the survey at any time. In this regard, all subjects are fully informed. After completing the questionnaire and scale, in order to express our gratitude, the subjects will receive a bonus of 15 RMB and a lottery on the platform.
With the exception of demographic variables, all variables were rated using a seven-point Likert scale (1. Strongly disagree; 2. Disagree; 3. Slightly disagree; 4. Neutral; 5. Slightly agree; 6. Agree; 7. Strongly agree). In this study, 750 questionnaires were sent out, and a total of 640 valid samples were obtained, which was in line with Jackson’s estimated parameter-to-sample ratio, greater than 1:10 [
24]. The distribution of demographic variables in this study is shown in
Table 2 based on the statistical analysis of the data collected from the valid questionnaire.
4.2. Reliability Analysis
This study recruited IBM SPSS 24 software to conduct reliability and validity analysis. A reliability analysis was conducted on the questionnaire in order to remove unstable questions to ensure reliability and discrimination. In
Table 3, Cronbach’s α value of each facet is greater than 0.6, and the CITC (corrected item-to-total correlation) is greater than 0.4, indicating high confidence for all constructs [
25]. Moreover, deleting any item will result in a lower aspect of Cronbach’s α than the current result, indicating that the item should not be deleted. The comprehensive data show that the data is reliable and can be used for further analysis.
4.3. Exploratory Factor Analysis
An exploratory factor analysis was conducted to test the validity of the questionnaire in this study. The method of analysis used in the calculation process is principal component analysis (PCA). In addition, factor rotation was performed using the varimax method.
Table 4 illustrates the results. The KMO (Kaiser–Meyer–Olkin) value of all constructs is greater than 0.5 and the significance of Bartlett’s Sphere test is less than 0.05, indicating that the data meet the criteria for factor analysis [
26,
27]. A further analysis shows that the commonality of each item exceeds 0.5 and the factor loading that contributes to its construct exceeds 0.6. This suggests that the construct has good validity [
28]. In the extraction of new factors, all items belonging to each construct are included. An eigenvalue greater than 1 can only be extracted from one new factor belonging to each construct [
29], indicating that it is a good single construct factor [
30].
4.4. Measurement Model
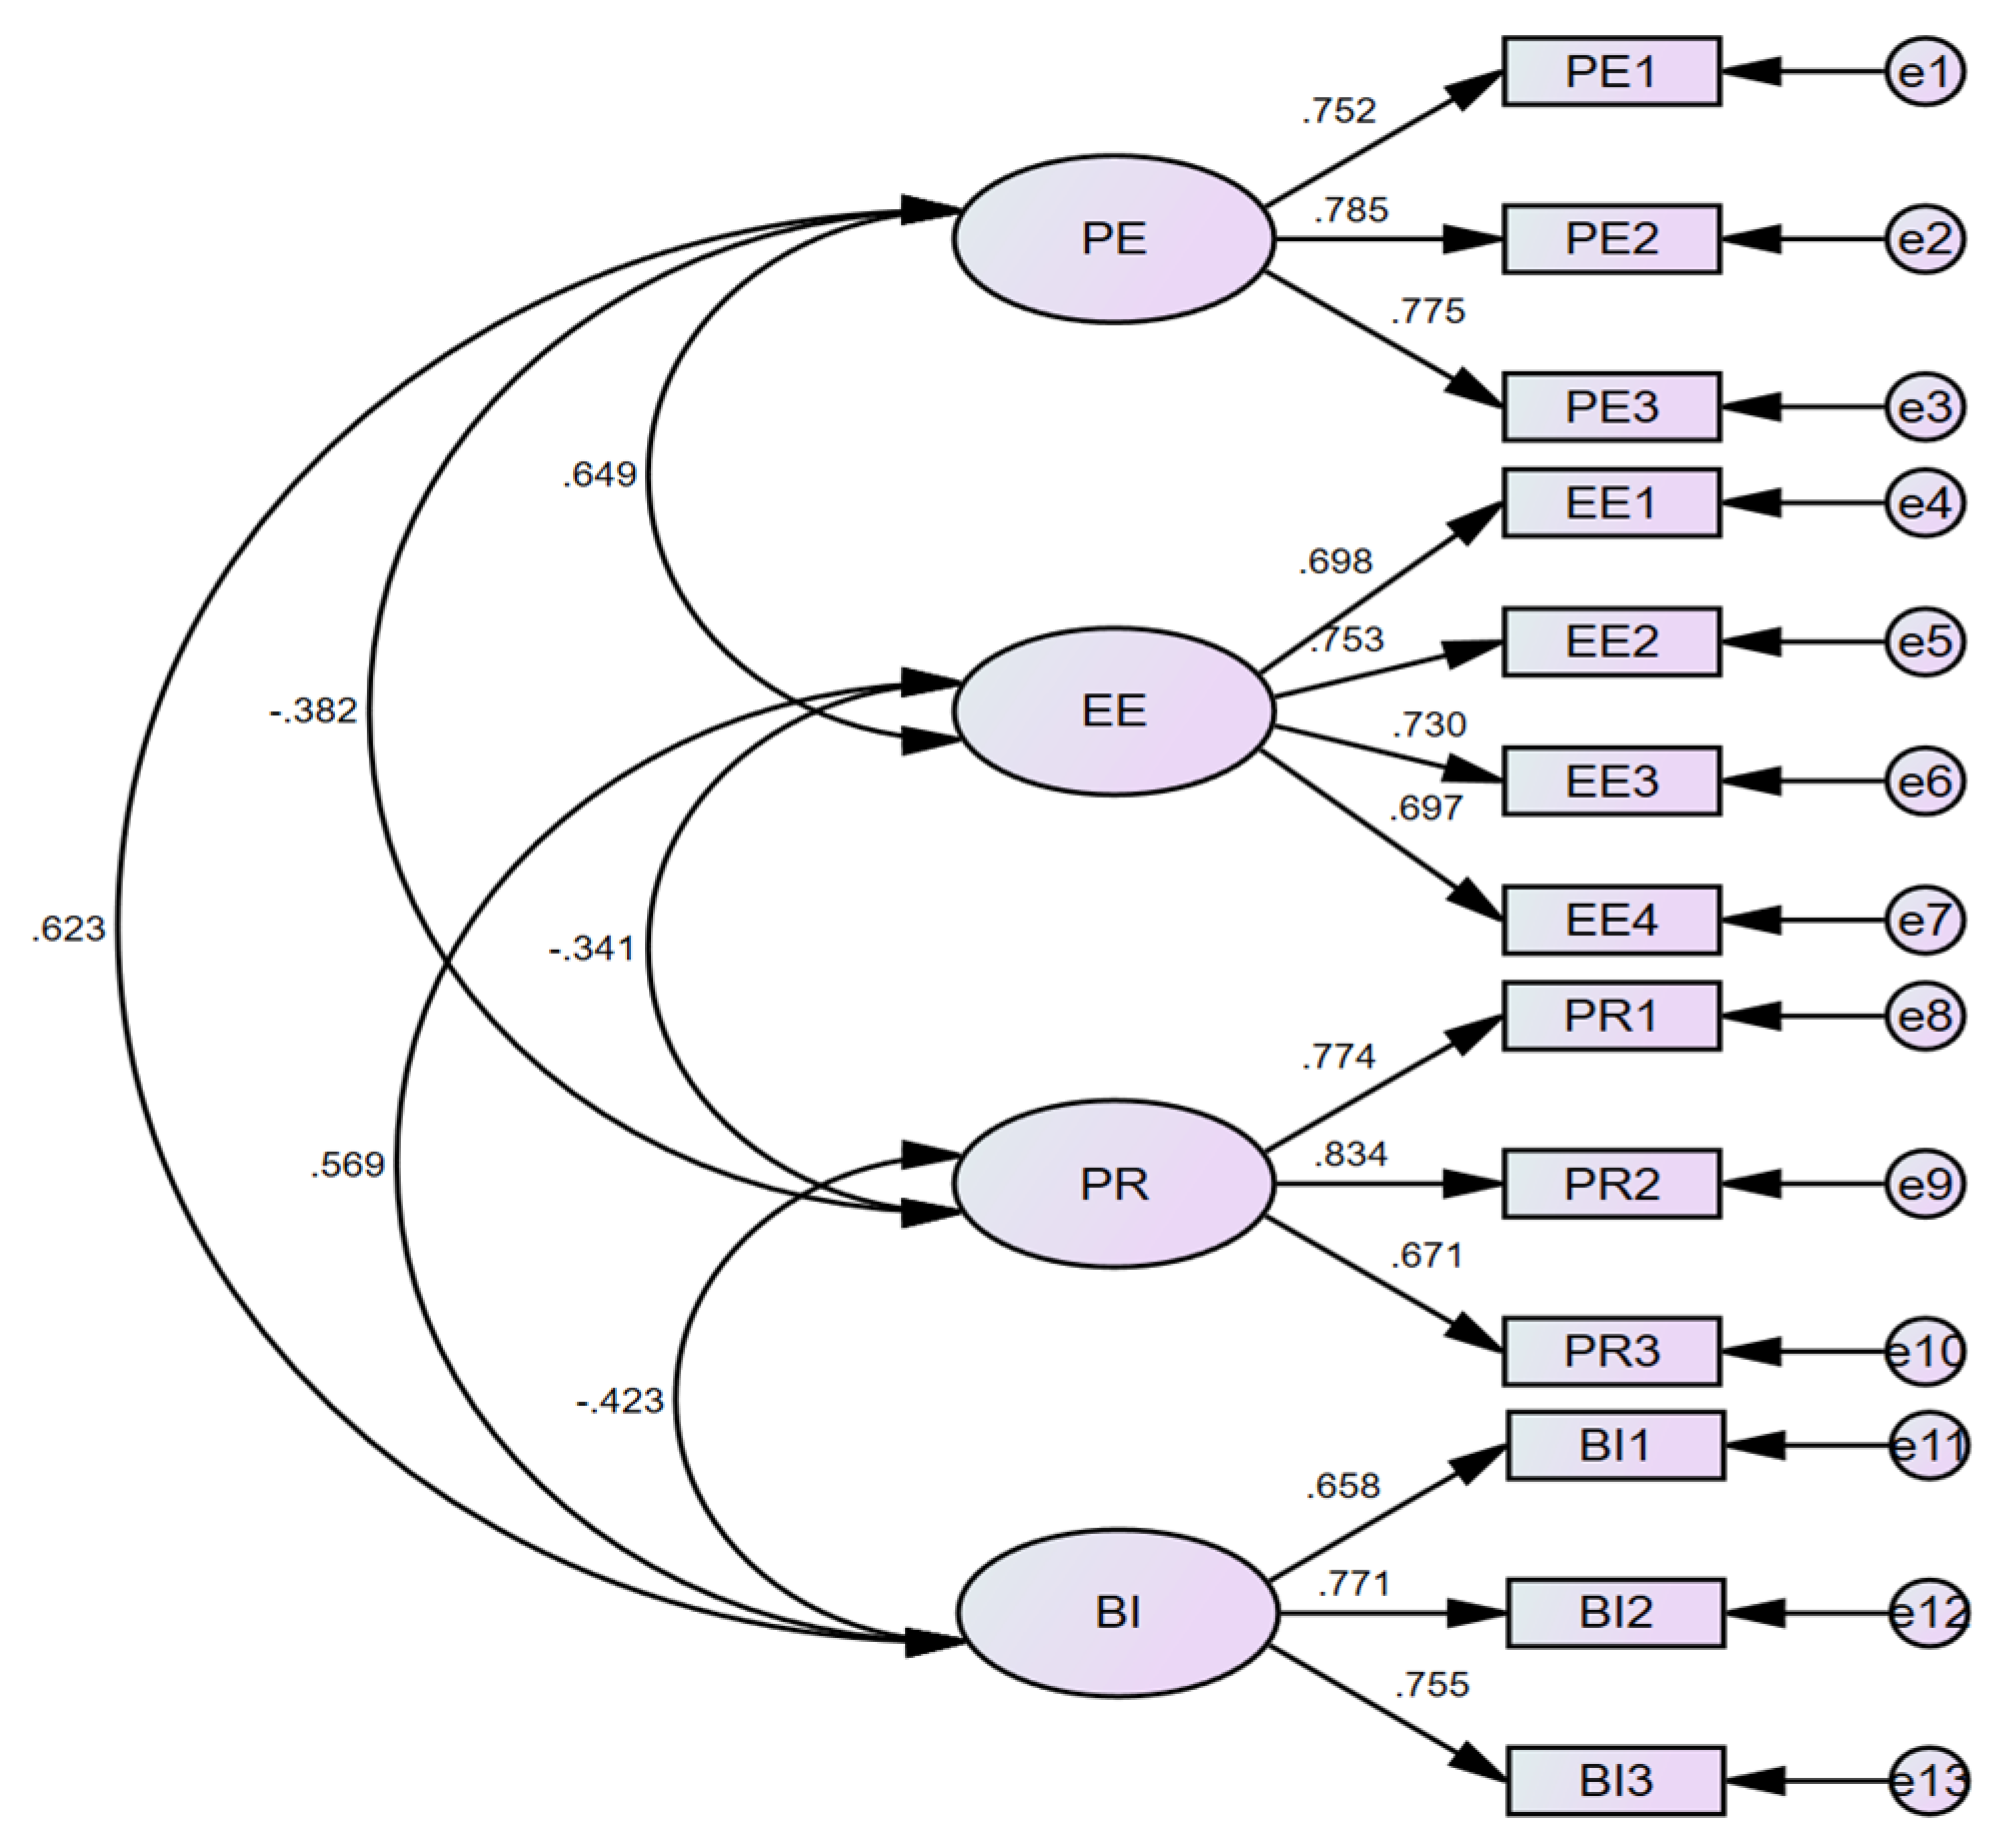
This study used IBM AMOS 22 software for structural equation model analysis. Because a large number of studies have used AMOS for analysis, AMOS is proven to be a reliable structural equation modeling software. In
Figure 2, all latent variables are correlated and satisfy the path analysis premise. Moreover, all fit points in this model meet the recommended criteria, as shown in
Table 5. This indicates that the first-order confirmatory factor analysis (CFA) model is well-fitted [
31].
Table 6 presents the results of convergent validity. Each item in the first-order CFA model has a factor loading greater than 0.5. There was a significant correlation between coefficient estimates and standard errors, t > 1.96,
p < 0.05, as indicated in the fit index. Each construct’s combined reliability (CR) exceeds 0.6 [
32], and the average variance extracted (AVE) exceeds the base value of 0.36 [
33]. According to the results of this study, the questionnaire data show good convergent validity.
The discriminant validity is based on the work of Fornell and Larcker [
31]. The model is considered discriminant if the square root of the AVE for each facet is greater than the correlation coefficient between the facets. In this study, all diagonal values are greater than the values outside the diagonal, and therefore all aspects of this study have good discriminant validity (
Table 7). This study shows that each construct has good discriminant validity.
4.5. Structural Equation Model
In this study, we used the research of Jackson et al. [
34], Kline [
35], Schumacker [
36], and Hu and Bentler [
37], as well as other scholars. To evaluate the fit of the structural model, multiple indicators (MLχ
2, DF, χ
2/DF, RMSEA, SRMR, AGFI, CFI, NFI, GFI) were selected. As shown in
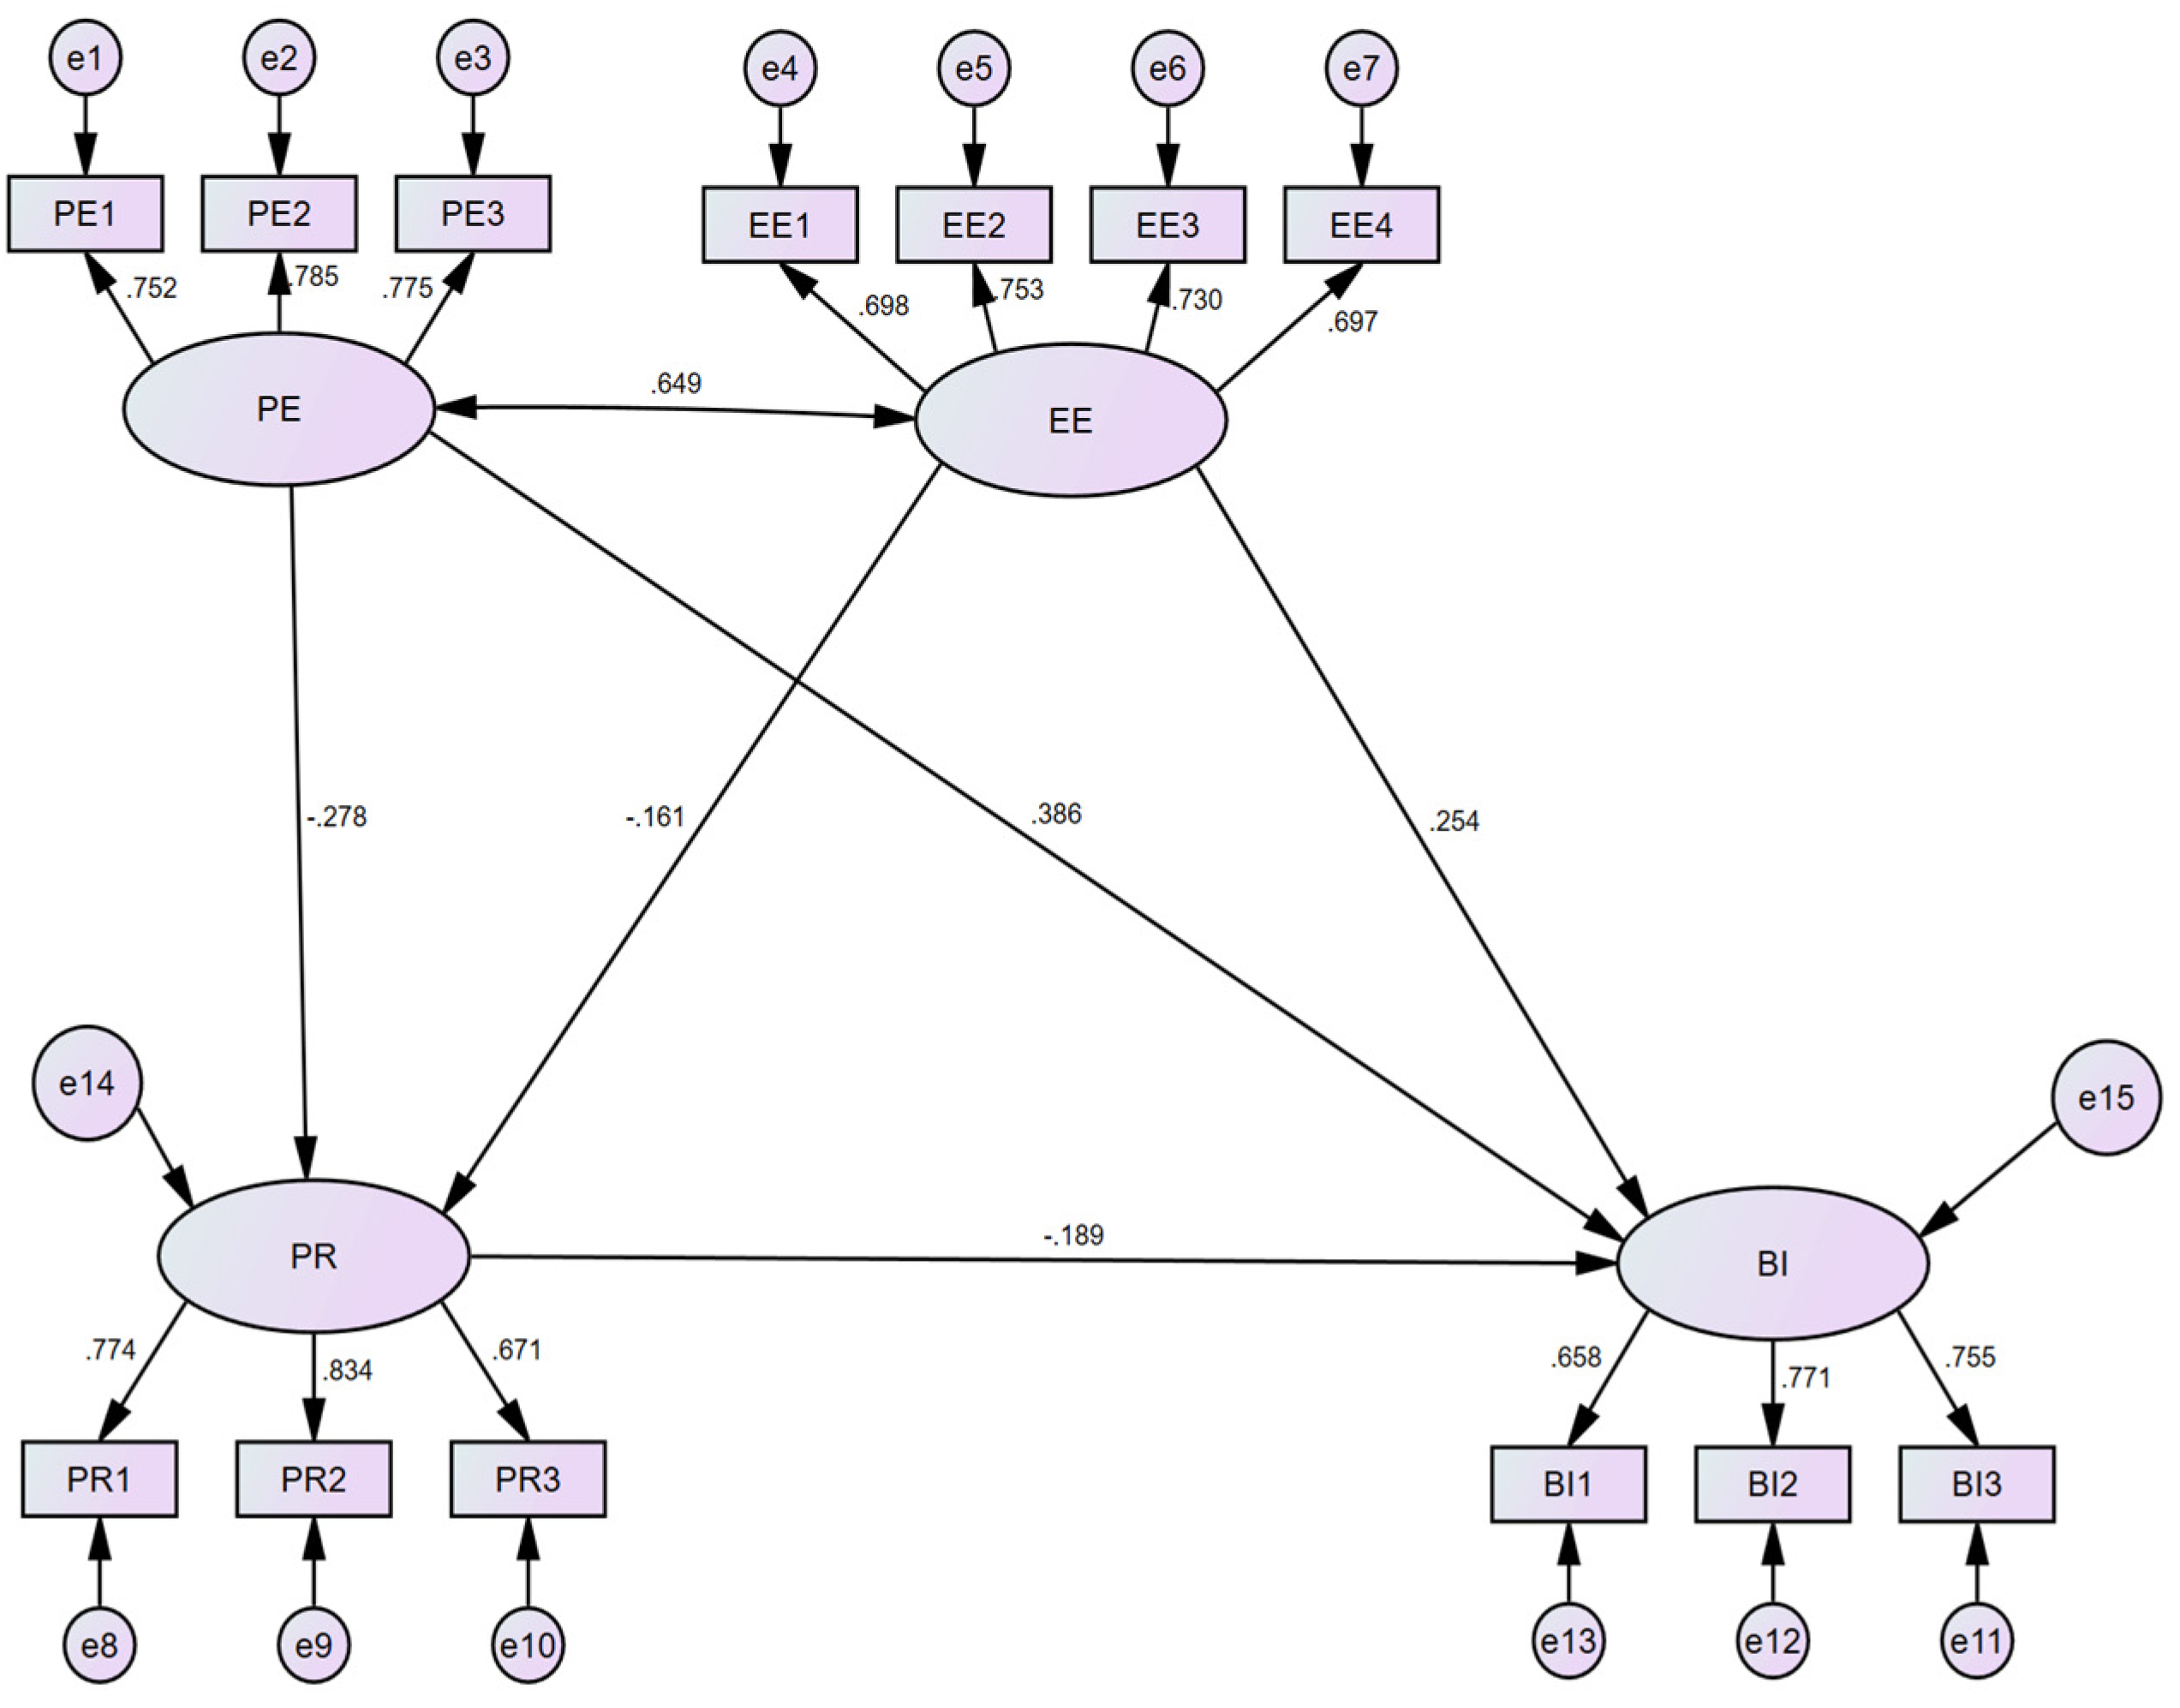
Table 8, the research constructs are measured according to the research assumptions and models. In addition, all standard model fit evaluation indicators satisfy the independent level and combination rule of recommended fit, which indicates that the structural model has a good fit. According to the study, the theoretical framework assumed is consistent with the actual survey results. The path coefficients are shown in
Figure 3.
According to Liao and Hu’s research, this study tests the path effect in the model [
38]. The test standard was set at *
p < 0.1, **
p < 0.05, and ***
p < 0.001. As can be seen from
Table 9, when PR is the dependent variable, PE has a direct negative effect on PR (
p = 0.001, β = −0.278), and EE also has a direct negative effect on PR (
p = 0.029, β = −0.161). When BI is the dependent variable, PR negatively affects BI (
p = 0.001, β = −0.189), while PE positively affects BI (
p = 0.001, β = 0.386). There is a positive indirect effect of PE on BI (
p = 0.001, β = 0.052) and a positive impact in total (
p = 0.001, β = 0.438). There is a direct positive effect of EE on BI (
p = 0.001, β = 0.254), as well as an indirect positive effect (
p = 0.016, β = 0.030), with a total positive effect (
p = 0.001, β = 0.285).
4.6. Analyzing Moderated Variables
The study further examined the moderating effect of gender as a moderator variable on each pathway, as shown in
Table 10. According to the results, only EE had a significant moderating effect on PR when gender was used as a moderator variable.
Further, as shown in
Table 11, we compared the path coefficients that moderated the effects of variables. When it comes to perceiving PR, only female consumers are sensitive to EE, whereas men are not.
5. Discussion
The results of the empirical analysis provide some key findings, which are discussed below.
The results of this study demonstrate that PE and EE have positive effects on BI(H1, H3), which is consistent with the results of previous studies [
9,
39]. It has been demonstrated that consumers’ expectations of whether or not to use robotaxi depend on their perceptions of its travel efficiency and ease of use—robotaxi’s commitment to meeting consumers’ commuting and travel needs in a cost-effective and efficient manner [
40]. In this regard, both researchers and related service organizations must take effective measures to improve the PE of potential users in order to increase the degree of acceptance or use of the product [
39]. In addition to improving travel efficiency, consumers also value robotaxi’s ease of use. In order to obtain relatively high benefits, consumers must spend the least amount of time, money, and effort (including time and economic costs) [
41]. Therefore, it is necessary to work closely with all relevant organizations and departments to develop an easier-to-use travel form, similar to the MaaS system, and to optimize the robotaxi experience.
It has been demonstrated that PE and EE negatively affect PR (H2, H4). Therefore, consumers perceive a lower risk when PE and EE are higher. Based on the interpretation of this study, consumers’ perceptions of robotaxis include service quality [
42], safety [
9], travel experience, etc. [
43]. The higher the robotaxi property, the lower the perceived risk. As a result, consumers’ judgment of PR is influenced by the positive perception of their peers represented by PE and EE. This study found that PR negatively impacted BI(H5). Thus, the higher the PR, the lower the BI of the consumer. A number of studies have confirmed the relationship between risks and BI in the context of autonomous vehicles [
43,
44]. Therefore, it is necessary to take measures to reduce the risk perception of consumers, thereby improving BI, such as providing timely customer service communication and ensuring the arrival of spare vehicles in the event of a vehicle failure.
It is interesting to note that PE has a direct influence coefficient of 0.386 and a total influence coefficient of 0.438 on BI. EE has a direct influence coefficient of 0.254 on BI, and a total influence coefficient of 0.285. It has been demonstrated that representing PR as a variable intermediary improves the perception of BI by consumers from PE and EE. The reason for this may be that robotaxi already has a certain degree of perfection in its form, function, and service in the current environment and conditions. Some of the concerns of consumers have been addressed by manufacturers and service providers. Consequently, consumers perceive less risk than they expect, which facilitates BI.
Furthermore, this study examined whether gender, as a moderator variable, affects different pathways. When gender was used as a moderator variable, it only had a moderating effect on the pathway from EE to PR. Further analysis reveals that only female consumers have sensitive perceptions. In line with previous research, female consumers may be more sensitive to public relations [
45]. The above phenomenon may be attributed to the fact that female consumers are less comfortable with new technologies than male consumers, and they have a greater sense of self-protection and insecurity.
6. Managerial Implication
The contribution of this study lies in deconstructing the impact of performance expectancy, effort expectancy, perceived risk, and gender on users’ intention to use robotaxi, and in providing relevant decision-making directions or suggestions for industry decision-makers.
Firstly, we identified that performance expectancy plays a key role in the model of consumer behavioral intention to use robotaxis. Manufacturers and service providers should adopt the latest technologies and intelligent dispatch systems to optimize service design, reduce consumers’ time costs, and improve overall service efficiency. Additionally, to enhance the convenience experience for users, manufacturers and service providers need to consider offering personalized services and integrated service chains, such as with Mobility-as-a-Service systems. This approach can reduce the learning curve for new users and increase user coverage, making it easier for consumers to use robotaxis. Such measures would help enhance effort expectancy, fostering a positive anticipation of the service among users.
To alleviate consumer concerns about the unknown risks associated with robotaxi services, manufacturers and service providers should offer detailed and transparent information, such as disclosures on safety measures and vehicle maintenance details. Improving transparency in information will help reduce users’ perceived risk, enhance their positive perception of the service, and provide them with a sufficient sense of security. Of course, manufacturers and service providers should also establish and implement stricter safety standards to further enhance the reliability and credibility of the overall service.
Additionally, the study on gender differences in this research reveals the high sensitivity of female consumers to perceived risk. Manufacturers and service providers can adopt differentiated marketing strategies, strengthen safety measures for female consumers, and provide more detailed information to alleviate their safety concerns, encouraging more female consumers to accept and trust robotaxi services. To increase service acceptance, manufacturers and service providers can also educate and inform consumers about the safety and convenience of the service, thereby strengthening positive expectations. Especially for female consumers, targeted advertising that emphasizes the safety of the service can be used to increase their acceptance.
7. Conclusions and Implications
In this study, we examined the factors that influence consumers’ adoption of robotaxi as a mode of transportation, specifically consumers’ perception of five constructs: PE, EE, PR, and BI. We used structural equation modeling to estimate the relationship between constructs and examined the moderating effect of gender. Our results can provide a certain degree of reference value for consumers, practitioners, and government agencies.
Based on the results, all assumptions are valid. PR stimulated PE and EE effects on BI through its role as a mediator. Gender as a moderator variable affects the effect of EE on PR. According to the hypotheses presented in this study, PE and EE have a positive impact on BI. This positive impact occurs as a result of consumers learning about robotaxi’s related systems, processes, and collection of related information, and then making a decision accordingly. Furthermore, the negative factors of robotaxi may also negatively affect consumers’ expectations, thereby affecting BI.
The academic contribution of this study is the deconstruction of UTAUT and the inclusion of PR as a mediating variable in PE, EE, and BI. Based on the results, it proves that the four constructs are causally related, which lays a certain foundation for further research related to unmanned driving and has a certain value as a reference for future researchers.
This study has a number of limitations that may suggest directions for future research:
Although all aspects of this study are related, there may be some latent variables or second-order aspects that have not been explored and discussed. To enhance the model’s explanatory power and improve its performance, researchers can add new facets, including second-order facets. As an example, the influence or interference of supplementary news media on consumers.
There are different responses of men and women to the use of robotaxi, and subsequent research will be able to investigate further into the internal reasons for these differences. In addition, it may also be able to conduct detailed research, analysis, or discussion on other different attributes associated with consumers.
Structural equation modeling has been used as the primary method of analysis and research of quantitative research papers. In the future, qualitative research (expert interviews, field investigations, etc.) may be added to complement quantitative data to convey deeper meanings.
Considering the focus of the study on Chinese consumers, researchers may be able to compare Chinese and foreign consumers in the future and facilitate the coordination of the different conditions on a global scale in the future.


