Abstract
Surface fluorination with pure F2 gas can easily make the surface on PP (polypropylene) hydrophobic, and it causes limited dyeability, as reported in a previous paper. In this study, to produce a more hydrophilic surface, surface fluorination of PP was performed at 25 °C, total gas pressure of 13.3 kPa, and reaction time of 1 h using F2 and O2 mixtures with different proportions of F2 gas. The surface roughness of the fluorinated PP samples was about 1.5 times higher than that of the untreated sample (5 nm). Fourier-transform infrared spectroscopy and X-ray photoelectron spectroscopy (XPS) results showed that the PP-derived bonds (-C-C- and -CHx) decreased because they were converted into polar groups (-C–O, -CHF-, and -CFx), which increased the surface electronegativity of the PP. The variation in the F2 gas proportion in the gas mixture significantly affected the hydrophilicity and surface composition of the PP. At F2 gas proportions of <70%, the hydrophilicity of the fluorinated PP samples was increased. Notably, the hydrophilic and negatively charged PP surface enhanced the dyeing of the polymer with basic methylene blue (MB). In contrast, at F2 gas proportions of >90%, the PP surface became hydrophobic owing to increased numbers of hydrophobic -CF3 bonds. Thus, enhanced PP dyeing can be controlled based on the composition of the F2 and O2 gas mixture.
1. Introduction
Polypropylene (PP) is one of the important olefin polymers, and it has become of great commercial importance because it is inexpensive and it has many attractive physical and chemical properties [1,2]. PP, which is a saturated hydrocarbon, has good abrasion resistance, good chemical resistance, and good antistatic properties. Despite these attractive properties, the dyeing of PP in water is almost impossible [3]. This is due to its high crystallinity and non-polar aliphatic structure, meaning that it does not possess reactive sites [4]. However, the main challenge is the absence of sites for hydrogen bonding or electrostatic attractions. To color PP, a pigment is generally added to the molten polymer before the spinning process [5]. Spin coloration of PP has been extensively used. However, this method has drawbacks such as pigment agglomeration [6] and the degradation, at high temperatures, of the thermally labile dyes used during resin molding. Without pigment addition, PP coloration has been investigated by staining with various dyes. Successful PP coloration depends on the surface modification of the PP. For example, hydrophilic modifications, metal plating, and other coating methods are beneficial for dyeing [7,8,9,10]. Surface modification by physical treatments (such as plasma [11], ozone [12], ultraviolet (UV) light [13], and corona discharge [14]) and by wet chemical treatments [15] and ion irradiation [16] all help to hydrophilize and roughen the PP. However, these treatments are high-cost and unsuitable for complex geometries. Compared with these conventional chemical and physical methods, direct fluorination is a gas-phase chemical reaction of gaseous F2 with a polymer surface, which is an effective chemical way to modify and control the physicochemical surface properties of polymers [17,18].
Previously, the surfaces of polyethylene terephthalate (PET), polycarbonate (PC), and PP were modified by direct fluorination, achieving high adhesion by plating and good dyability [19,20,21]. In particular, we reported that dyeing PP with basic dyes can be improved by surface fluorination because of increased roughness and the negative charge of the surface [21]. However, in the case of direct fluorination with pure fluorine gas, the fluorinated layer formed on the PP surface contains numerous hydrophobic fluorocarbons (-CF3), which prevented the wettability between PP and the staining solution, causing limited dyeability. Surface fluorination using a mixture of F2 and O2 gases produced a higher hydrophilic surface of PC resin, as reported previously [20]. The F-O hybrid state formed using F2 and O2 mixed gas can be controlled by the gas mixture ratio, and it has a big impact on surface properties (hydrophilicity and dyeability) of PP resin. This study aimed to enhance PP dyeing using a mixture of F2 and O2 gases. In addition, the effects on PP dyeability of the proportion of F2 in the gas mixture were investigated.
2. Materials and Methods
2.1. Surface Fluorination of Polypropylene
PP films were obtained from Takiron Corporation. The PP plates (10 × 10 × 1.2 mm3) were cut and washed with ethanol to remove organic residues from the PP surface. F2 gas (99.5% purity) was produced by the electrolysis of a KF/HF mixture in an HF solution. O2 gas (purity 99.5%) was supplied from a cylinder manufactured by Uno Sanso Co., Ltd. Before use, the PP plates were placed in a nickel reactor (24 × 32 × 5 mm3) and maintained at 25 °C under vacuum (0.1 Pa) for 10 h to eliminate impurities from the system. We have previously described the fluorination apparatus [22], where a reaction temperature of 25 °C, total gas pressure of 13.3 kPa, and reaction time of 1 h were used. The F2 and O2 gases were mixed in the fluorination apparatus and the sample names and the F2 and O2 gas mixing ratios are summarized in Table 1. The mixed gases filled the vacuumed reactor. After the reaction was complete, the reactor was purged with Ar gas.

Table 1.
Sample names and fluorination conditions.
2.2. Material Characterization
The chemical changes in the untreated and fluorinated PP samples were determined using Fourier-transform infrared spectroscopy (FTIR; Nicolet 6700, Thermo Electron Scientific, Waltham, MA, USA). FTIR analysis was carried out in the transmittance mode in the range of 650–4000 cm−1 by acquiring 32 scans and applying air background subtraction. The surface chemical states of the untreated and fluorinated PP samples were characterized using X-ray photoelectron spectroscopy (XPS; JPS-9010, JEOL, Tokyo, Japan). Adventitious carbon contamination is commonly used as a charge reference for XPS spectra. The surface morphologies of the untreated and fluorinated PP samples were characterized using confocal laser scanning microscopy (CLSM; OLS5000, Olympus, Tokyo, Japan), and atomic force microscopy (AFM; Nanoscope IIIa, Digital Instruments, Tonawanda, NY, USA) was used to examine the geometry and surface topographies of the PP samples. Scanning was carried out in the tapping mode over an area of 10 × 10 µm2. The AFM roughness profiles were used to determine the arithmetic mean of the surface roughness (Ra). The static contact angle is an advancing sessile droplet contact angle of water at a water droplet volume of 10 μL. The contact angles of PP samples were determined using a telescopic goniometer with a magnification power of 23× and protractor graduation of 1° (Model 100-00-(230), Rame-Hart, Succasunna, NJ, USA). The average contact angle of 5 locations was reported for each sample. The zeta potential of PP samples was measured using a zeta potential analyzer (ElSZ-2, Otsuka Electronics Co., Ltd., Osaka, Japan) equipped with an adjustable gap cell. The surface zeta potential was determined at pH 7 in a 0.001M KCl electrolyte solution varying the solution pH by addition of 0.05M HCl or 0.05M NaOH through the instrument automatic titration unit. Separate couples of samples were used for the acidic and basic titrations in order to avoid artifacts due to surface reactions during the measurement. Four measurements were carried out.
2.3. Dye Staining of Polypropylene
Methylene blue (MB, Hirono Pure Chemical Corp., Miki-city, Japan) and acid orange 7 (O2: orange II, Nacalai Tesque, Inc., Kyoto, Japan) were used as representative basic and acidic dyes, respectively. Dyeing solutions, prepared with 0.4 g/L of dye in ultrapure water, were placed in a water bath at 80 °C, and the PP samples were immersed for 30 min. Subsequently, the PP samples were washed with ultrapure water and air dried. By using a spectrophotometer (Spectro1TM, KLV Co., Ltd., Tokyo, Japan), the surface coloring of dyed samples was checked. The RGB-based reproducing method for absorption spectra was applied for colorimetric analysis using smartphone-captured digital color images. The surface dyeing of each sample was measured by the N content, which was analyzed by XPS. Furthermore, the aromatic C=C stretching peak derived from the MB and O2 dyes in each sample was examined at 1600 cm−1 by FTIR.
3. Results and Discussion
3.1. Effects of Fluorination Using F2 and O2 Gas Mixtures on the Surface Morphology of Polypropylene
The surface morphologies and hydrophilicities of the untreated and fluorinated PP samples are shown in Figure 1. The surface morphology was characterized by CLSM and AFM. No difference in the CLSM images of the untreated and fluorinated samples was observed. The AFM image of the untreated sample indicated a relatively flat and smooth surface with a low Ra of ~5.002 nm. However, the Ra of the fluorinated PP samples was higher than that of the untreated sample. Surface fluorination caused fine surface defects at the nanoscale level, but not at the microscale level. This was likely due to small molecules or amorphous regions present after fluorination, as well as to CF4 gasification. In addition, the Ra of the fluorinated PP samples generally increased with increasing F2 content in the gas mixture. The surface hydrophilicity of the samples was evaluated using a water-contact-angle test. The water contact angle of the untreated PP sample was approximately 94°. The hydrophilicity of the PP samples fluorinated using a F2 gas proportion of <70% was higher than that of the untreated sample, as shown in Figure 1. In particular, the F50 sample prepared with a fluorine gas concentration of 50% was the most hydrophilic, which may have been due to its increased surface roughness. Furthermore, the partial polarity of the surface was enhanced by the addition of F, whose high electronegativity and acidity easily attract water as a polar solvent. In contrast, the contact angle of the PP samples fluorinated using a F2 gas proportion of >90% was higher than that of the untreated sample, which may have been due to the formation of hydrophobic C-F3 bonds on the PP surface.
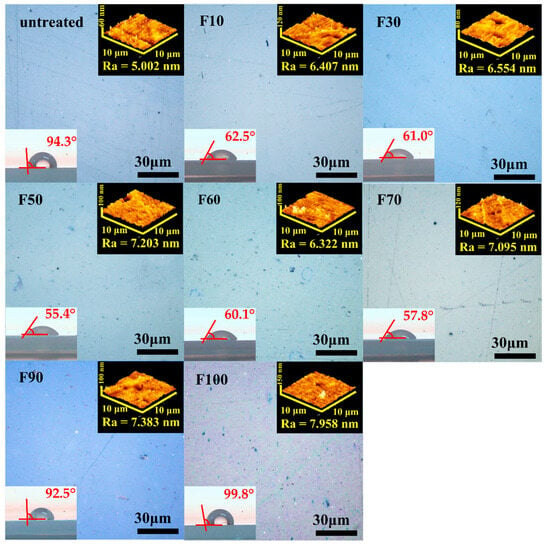
Figure 1.
CLSM, AFM, and contact angle measurements of untreated and fluorinated samples.
3.2. Effects of Fluorination on the Surface Composition and Structure of Polypropylene
The FTIR spectra of the untreated and fluorinated PP samples are shown in Figure 2. The untreated PP sample exhibited absorption bands at 2960 and 2950 cm−1 (-CH3, asymmetrical vibration), 2919 cm−1 (-CH2-, asymmetrical vibration), 2867 cm−1 (-CH3, symmetrical vibration), 2839 cm−1 (-CH2-, symmetrical vibration), 1458 cm−1 (-CH2-, bending vibration), and 1376 cm−1 (-CH3, wagging vibration) [23]. After surface fluorination, new absorption bands appeared at 700–770 cm−1 (-CF3) and 1000–1200 cm−1 (-CF-CF2-) [24], and the peak intensity of the PP bonds (-CH3, CH2) decreased. Fluorination at high F2 gas concentrations in the gas mixture increased the intensities of the peaks associated with fluorinated bonds (-CF, -CF2, -CF3), and decreased the intensity of the peaks associated with PP. Because the -CH2- and -CH3 peaks almost disappeared in the fluorinated samples with high F2 gas concentrations, such as F90 and F100, it is thought that a fluorinated layer formed up to the detection limit depth of several micrometers. Moreover, the surface fluorination using the F2 and O2 gas mixtures introduced C=O bonds (1755 and 1850 cm−1) into the PP samples, which may have enhanced dye adsorption. However, the intensity of the C=O peaks decreased significantly for gas mixtures with an F2 proportion of >90%, as shown in Figure 2.
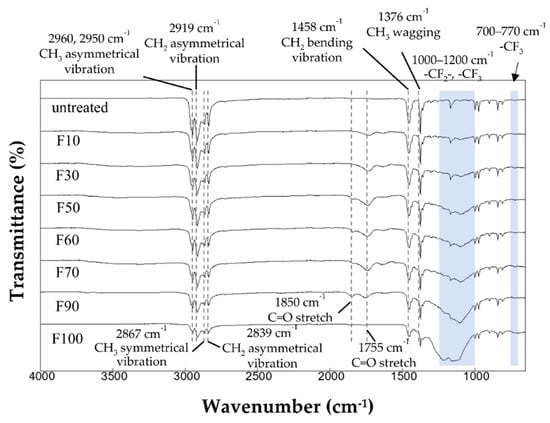
Figure 2.
FTIR spectra of the untreated and fluorinated samples.
The C 1s, O 1s, and F 1s XPS profiles of the untreated and fluorinated PP samples are shown in Figure 3. The untreated PP sample exhibited strong C-C bonding at 285.4 eV, which disappeared after fluorination. These C-C bonds reacted with water in air and were converted to -C-O and -C=O bonds (287.4 eV), forming a -C(=O)OH group, which facilitated covalent dye adsorption, or to -CHF- (289.5 eV), -CF2- (291.5 eV), and -CF3 (294.0 eV), which served as the main hydrogen bonding sites for water adsorption. Increasing the F2 gas proportion in the gas mixtures resulted in an increase in the numbers of polar groups (-CFx). For F 1s and O 1s, increasing the F2 gas proportion in the gas mixtures caused an increase in the F contents, whereas the O contents decreased. In particular, the trend was clearly observed for samples F90 and F100. This may have been due to the formation of stable CF3 bonds on the sample surface, which yielded a hydrophobic surface (Figure 1).
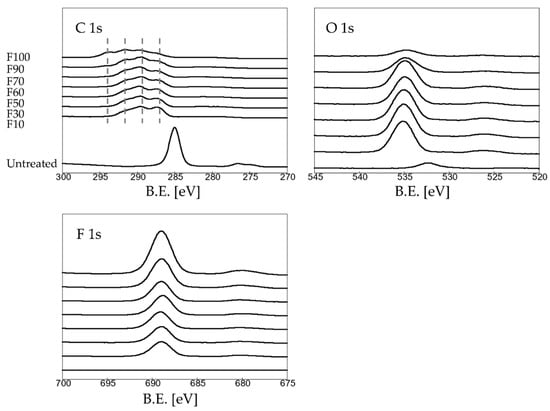
Figure 3.
XPS spectra of the untreated and fluorinated samples.
Table 2 shows the elemental concentration of C, O, and F on the untreated and fluorinated PP samples determined by XPS (Figure 3). Varying the F2 gas proportion in the gas mixture influenced the elemental composition of the surface layer. With an increase in the F2 gas proportion in the F2–O2 gas mixture, the F contents on the surface of the fluorinated PP samples increased, whereas the C and O contents decreased. For samples F90 and F100, the F contents on the surface increased significantly, whereas the O contents decreased.

Table 2.
The elemental concentrations of C, O, and F on the untreated and fluorinated PP samples determined by XPS (Figure 3).
Figure 4 shows the peak-fitting results for the C 1s spectra of the fluorinated samples (Figure 3). Figure 5 show the ratio (%) of each bond derived from Figure 4. For sample F10, the ratios of the C-O, -CHF-, and -CF2- bonds were approximately 39%, 38%, and 22%, respectively. As the F2 gas proportion in the F2–O2 gas mixture increased, the ratio of the C-O bonds decreased, whereas ratios of the -CHF- and -CF2- bonds increased. No CF3 bonds were detected on the sample surface when the F2 gas proportion in the F2–O2 gas mixture was <70%. In contrast, the ratio of the -CF3 bond increased significantly when the F2 gas proportion in the F2–O2 gas mixture was >90%. The formation of strong CF3 bonds on the surface may have influenced the wettability with the dye solution, so that the C-C bonds on the untreated surface were converted into -C=O bonds by reacting with moisture in the air, forming -C(=O)OH groups. In addition, the number of the polar groups (-CHF and -CF2-) increased after fluorination.
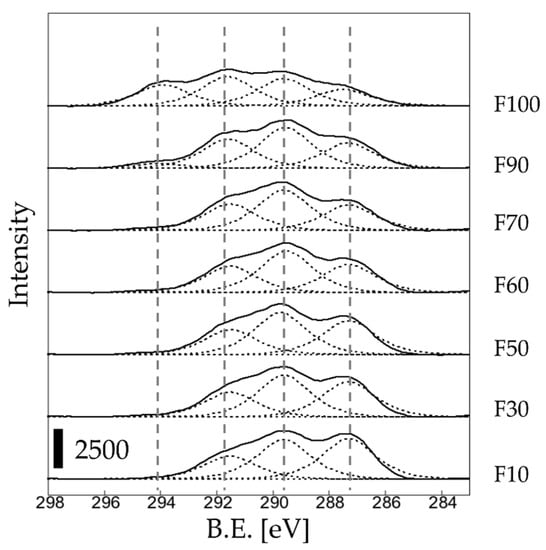
Figure 4.
C 1s peak separation for the fluorinated samples.
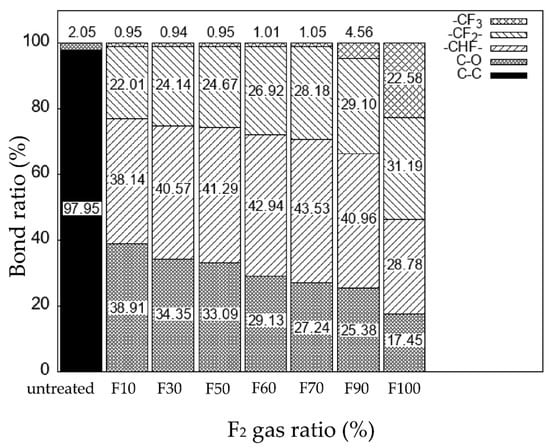
Figure 5.
The ratio of the different bonds in the untreated and fluorinated PP samples.
After surface fluorination, the number of PP-derived bonds decreased because they were converted into fluorinated -CFx bonds, which have high electronegativities according to the zeta potential results (Figure 6). In contrast, the zeta potential at the untreated surface was weakly negative. In particular, the zeta potential of sample F30 (−53 mV) was approximately four times higher than that of the untreated sample (−14 mV). This can be attributed to an increase in the number of polar groups (-C-O, -CHF-, and -CFx) in the samples. The negatively charged surface after fluorination corresponded to previously reported results [21]. However, the effect on the zeta potential of F2 proportion in the mixed gas did not change significantly. This may have been due to the various polar groups, which included -CFx and -C-O bonds.
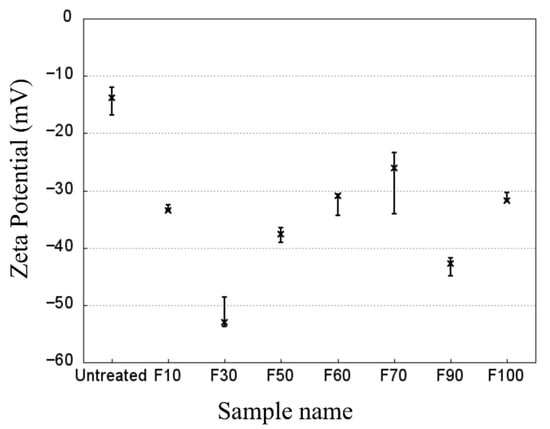
Figure 6.
Zeta potential of the untreated and fluorinated PP samples with water at a constant pH of 7.0.
3.3. Dyeing of the Surface-Modified PP Plates
The dye staining of the untreated and fluorinated PP samples is shown in Figure 7. Dyeing tests were performed using (a) O2 and (b) MB solutions as representative acidic and basic dyes, respectively. No staining was detected in the untreated samples using either dye. Moreover, the fluorinated PP samples were not stained by the acidic O2 dye. However, the fluorinated PP samples were stained by the basic MB dye, and an increasingly deeper color was observed as the F2 gas proportion in the gas mixture increased. This is attributed to the surface state of the fluorinated PP samples, which possesses high electronegativity and acidity. In contrast to O2, MB has cationic properties that facilitate facile adsorption on the enhanced negative surface of the fluorinated PP via Coulombic attraction [25]. Thus, fluorinated PP can be effectively stained with basic dyes but not with acidic dyes. However, at F2 gas proportions of >90%, the dye staining of the PP samples decreased despite the use of the MB solution. This was due to the formation of hydrophobic -CF3 bonds in samples F90 and F100, which had higher water contact angles, as shown in Figure 1. Thus, dye staining depends on the surface state of PP, such as the hydrophilicity, roughness, and surface charge. Moreover, dye staining can be controlled by the fluorination conditions.
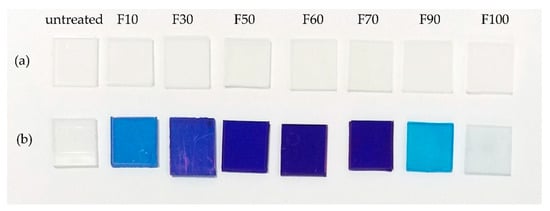
Figure 7.
Photographs of the dyeing of the untreated and fluorinated PP samples with (a) orange II (O2) and (b) methylene blue (MB) solutions.
By using the spectrophotometer, the surface coloring of dyed samples was checked and the RGB-based reproducing method for absorption spectra was applied to colorimetric analysis with smartphone-captured digital color images. The coloring of dyed samples was indicated as sRGB values, as shown in Table 3. The sRGB is a standard RGB (red, green, blue) color space. The blue (B) ratios in all sRGB values of F30~F70 samples were much higher, and it were consistent with the photographs of the dyed samples, as shown in Figure 7.

Table 3.
Surface coloring of dyed samples as measured by a spectrophotometer.
The surface state of the PP samples stained with the MB and O2 dyes was measured using FTIR (Figure 8 and Figure 9). The fluorocarbon peak was detected in all the dyed fluorinated samples. The surface of the fluorinated PP samples was still covered with fluorocarbons after staining. As shown in Figure 8, a peak attributed to aromatic C=C stretching bonds was detected at 1600 cm−1. The surface content of MB on the stained PP surface was determined from the peak area in the FTIR range of 1531–1685 cm−1, and the results obtained by applying a cubic function to the plots are shown in Figure 10. Notably, the depletion of the MB dye after surface staining of the PP samples was evaluated using FTIR analysis (Figure 8). The area of the C=C stretching peak (1600 cm−1) of the fluorinated PP samples was considerably higher than that of the untreated PP sample. In particular, the MB adsorption by the fluorinated sample F60 was approximately 23.7 times higher than that of the untreated sample. However, at F2 gas proportions of >90%, MB adsorption decreased because of the increased hydrophobicity of the PP surface. Therefore, it is crucial to control the surface state of PP, such as the hydrophilicity and surface charge, to enhance the dyeing of the polymer. Compared to the staining with the basic MB dye, the intensity of the C=C stretching peak at 1600 cm−1 in the samples stained with acidic O2 dye decreased, as shown in Figure 9. This may have been due to the negative surface charge of the PP samples.
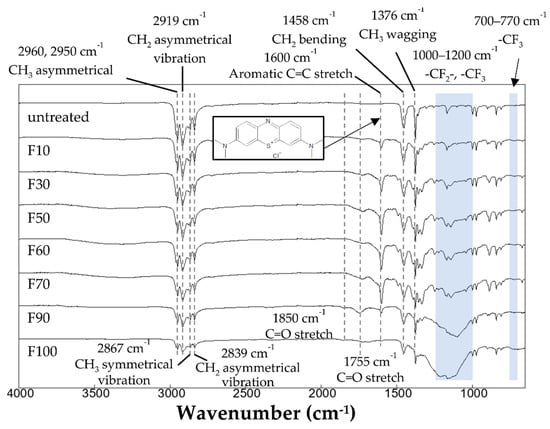
Figure 8.
FTIR spectra of the PP samples after dyeing with MB dye.
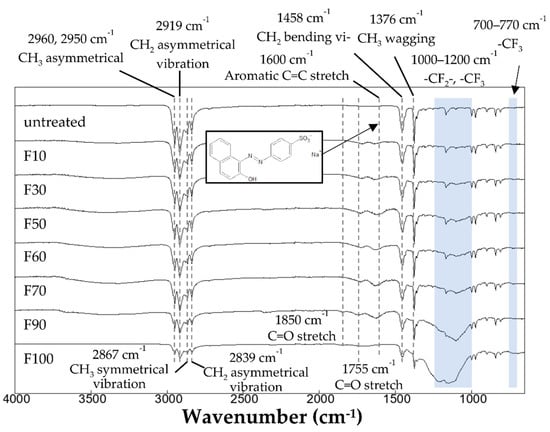
Figure 9.
FTIR spectra of the PP samples after dyeing with O2 dye.
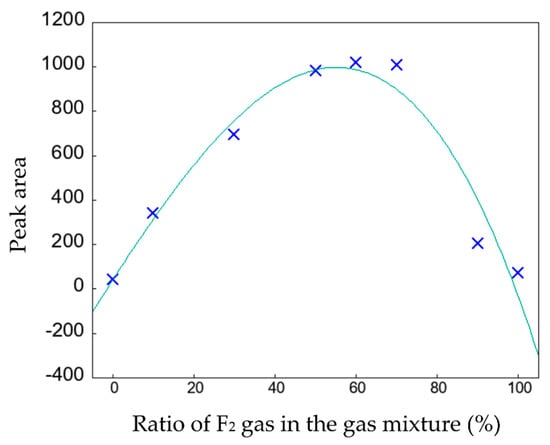
Figure 10.
Area of the 1600 cm−1 peak on the MB-dyed PP sample surfaces determined by FTIR (Figure 8).
The surface state before and after staining with MB dye was measured using XPS, as shown in Figure 11. Based on the MB chemical formula (C16H18ClN3S), the N content of the adsorbed MB was determined from the N 1s peak. Overall, the intensities of the N 1s peaks of the fluorinated PP samples were considerably higher than that of the untreated PP sample. In addition, the N 1s peak intensity was similar for all the fluorinated samples. Based on the results of the C 1s peak before (dotted line) and after (solid line) staining with the MB solution, the polar groups (-C-O, -CHF-, and -CFx) on the PP surface, as shown in Figure 4, decreased significantly and transformed into C-C bonds at 285 eV after MB staining. In addition, the intensities of the F 1s and O 1s peaks decreased and shifted to lower binding energies after MB staining. This may have been due to a substitution reaction between the basic MB dye and the negatively charged polar groups via Coulombic attraction that occurred in the fluorinated PP samples during MB staining [26].
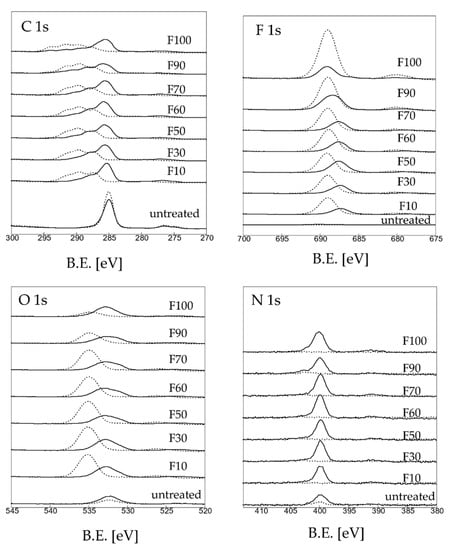
Figure 11.
XPS spectra of the PP samples before staining (dotted lines) and after staining (solid lines) with MB dye.
Although staining the PP resin with dye is difficult, surface fluorination can modify the PP surface into a dyeable one. The formed fluoride layer had a high surface roughness and negative surface charge, which facilitated MB retention. Moreover, it is crucial to maintain the hydrophilic surface and prevent hydrophobic -CF3 bond formation. Therefore, in this study, the dyeable surface of PP was controlled by adjusting the mixing ratio of F2 and O2 in a gas mixture. Furthermore, the surface modification with a mixture of F2 and O2 gases was beneficial for deep coloring of PP to a greater extent than that observed using pure F2 gas [21].
4. Conclusions
PP plates were successfully modified by surface fluorination with F2 and O2 gas mixtures. Increasing the F2 proportion in the gas mixture enhanced the peaks associated with fluorinated bonds and weakened those associated with PP. Moreover, it led to increased surface roughness and hydrophilicity of the PP plates. However, at an F2 gas proportion of >90%, the surface became hydrophobic owing to the increase in hydrophobic -CF3 bonds. After surface fluorination, the PP-derived bonds were converted into polar groups (-C-O, -CHF-, and -CFx), increasing the electronegativity of the surface. During dyeing, the fluorinated PP samples stained with basic MB exhibited deep coloring. Thus, PP can be effectively stained with basic dyes but not with acidic dyes. This may be attributed to a substitution reaction between the MB dye and fluorine, which enhanced the degree of PP dyeing via Coulombic attraction. However, at F2 gas proportions of >90%, PP dye staining decreased because of the increased numbers of hydrophobic -CF3 bonds. Thus, the enhanced dyeing of the PP resin can be obtained by surface fluorination with an F2 and O2 gas mixture. However, it is crucial to maintain a hydrophilic and negatively charged PP surface.
Author Contributions
M.N. conducted the surface fluorination of all the samples and wrote the manuscript. J.-H.K. conducted the XPS analysis of all the samples and contributed to the writing of the manuscript. S.Y. performed the FTIR analysis of all the samples. The manuscript was written with contributions from all the authors. All authors have read and agreed to the published version of the manuscript.
Funding
This research received no external funding.
Institutional Review Board Statement
Not applicable.
Informed Consent Statement
Not applicable.
Data Availability Statement
The data related to this study are all presented in the article.
Acknowledgments
The authors thank Fumihiro Nishimura for the zeta potential measurements.
Conflicts of Interest
The authors declare no conflict of interest.
References
- Hirai, S.; Phanthong, P.; Okubo, H.; Yao, S. Enhancement of the surface properties on polypropylene film using side-chain crystalline block copolymers. Polymers 2020, 12, 2736. [Google Scholar] [CrossRef]
- Hoff, A.; Jacobsson, S. Thermal oxidation of polypropylene in the temperature range of 120–280 °C. J. Appl. Polym. Sci. 1984, 29, 465–480. [Google Scholar] [CrossRef]
- Thakur, V.K.; Vennerberg, D.; Kessler, M.R. Green aqueous surface modification of polypropylene for novel polymer nanocomposites. ACS Appl. Mater. Interfaces 2014, 6, 9349–9356. [Google Scholar] [CrossRef]
- Akrman, J.; Prikryl, J. Dyeing Behavior of Polypropylene Blend Fiber. I. Kinetic and thermodynamic parameters of the dyeing ssystem. J. Appl. Polym. Sci. 1996, 62, 235–240. [Google Scholar] [CrossRef]
- Geleji, F.; Selim, B.; Szabo, K. Pigmentation of polypropylene fibers. Faserforsch. Textiltechnik 1965, 16, 395–400. [Google Scholar]
- Assmann, K.; Schrenk, V. Develops new vehicle for dyeing polypropylene fibers. Inter. Fiber J. 1997, 12, 44A. [Google Scholar]
- Tengsuwan, S.; Ohshima, M. Supercritical carbon dioxide-assisted electroless nickel plating on polypropylene—The effect of copolymer blend morphology on metal–polymer adhesion. J. Supercrit. Fluids 2014, 85, 123–134. [Google Scholar] [CrossRef]
- Shahidi, S.; Ghoranneviss, M.; Moazzenchi, B. Effect of using cold plasma on dyeing properties of polypropylene fabrics. Fibers Polym. 2007, 8, 123–129. [Google Scholar] [CrossRef]
- Honma, H. Plating technology for electronics packaging. Electr. Act. Polymers 2001, 47, 75–84. [Google Scholar] [CrossRef]
- Burkinshaw, S.M.; Froehling, P.E.; Mignanelli, M. The effect of hyperbranched polymers on the dyeing of polypropylene fibres. Dyes Pigm. 2002, 53, 229–235. [Google Scholar] [CrossRef]
- Hachim, D.; Brown, B.N. Surface modification of polypropylene for enhanced layer by layer deposition of polyelectrolytes. J. Biomed. Mater. Res. A 2018, 106, 2078–2085. [Google Scholar] [CrossRef]
- Walzak, M.J.; Flynn, S.; Foerch, R.; Hill, J.M. UV and ozone treatment of polypropylene and poly (ethylene terephthalate). J. Adhes. Sci. Technol. 1995, 9, 1229–1248. [Google Scholar] [CrossRef]
- Tanaka, S.; Naganuma, Y.; Kato, C.; Horie, K. Surface modification of vinyl polymers by vacuum ultraviolet light irradiation. J. Photopolym. Sci. Technol. 2003, 16, 165–170. [Google Scholar] [CrossRef]
- Strobe, M.; Jones, V.; Lyons, C.S.; Ulsh, M.; Kushner, M.J.; Dorai, R.; Branch, M.C. A comparison of corona-treated and flame-treated polypropylene films. Plasmas Polym. 2003, 8, 61–95. [Google Scholar] [CrossRef]
- Blais, P.; Carlsson, D.J.; Csullog, G.W.; Wiles, D.M. The chromic acid etching of polyolefin surfaces and adhesive bonding. J. Colloid Interface Sci. 1974, 47, 636–649. [Google Scholar] [CrossRef]
- Apel, P.Y.; Orelovich, O.L. Etching of submicron pores in thin polypropylene films irradiated with heavy ions. Nucl. Tracks Radiat. Meas. 1991, 19, 25–28. [Google Scholar] [CrossRef]
- Kharitonov, A.P.; Kharitonova, L.N. Surface modification of polymers by direct fluorination: A convenient approach to improve commercial properties of polymeric articles. Pure Appl. Chem. 2009, 81, 451–471. [Google Scholar] [CrossRef]
- Kirk, S.; Strobel, M.; Lee, C.; Pachuta, S.J.; Prokosch, M.; Lechuga, H.; Jones, M.E.; Lyons, C.S.; Degner, S.; Yang, Y.; et al. Fluorine plasma treatments of polypropylene films, 1-surface characterization. Plasma Process. Polym. 2010, 7, 107–122. [Google Scholar] [CrossRef]
- Kim, J.H.; Namie, M.; Yonezawa, S. Enhanced adhesion between polyethylene terephthalate and metal film by surface fluorination. Comp. Comm. 2018, 10, 205–208. [Google Scholar] [CrossRef]
- Kim, J.H.; Mishina, T.; Namie, M.; Nishimura, F.; Yonezawa, S. Effects of surface fluorination on the dyeing of polycarbonate (PC) resin. J. Coat. Res. 2021, 9, 617–624. [Google Scholar] [CrossRef]
- Namie, M.; Kim, J.H.; Yonezawa, S. Improving the dyeing of polypropylene by surface fluorination. Colorants 2022, 1, 121–131. [Google Scholar] [CrossRef]
- Kim, J.H.; Umeda, H.; Ohe, M.; Yonezawa, S.; Takashima, M. Preparation of pure LiPF6 using fluorine gas at room temperature. Chem. Lett. 2011, 40, 360–361. [Google Scholar] [CrossRef]
- Mohammadiaheri, S.; Jaleh, B.; Mohazzab, B.F.; Eslamipanah, M.; Nasrollahzadeh, M.; Varma, R.S. Greener hydrophilicity improvement of polypropylene membrane by ArF excimer laser treatment. Surf. Coat. Technol. 2020, 399, 126198. [Google Scholar] [CrossRef]
- Kobayashi, M.; Nishimura, F.; Kim, J.H.; Yonezawa, S. Dyeable hydrophilic surface modification for PTFE substrates by surface fluorination. Membranes 2023, 13, 57. [Google Scholar] [CrossRef]
- Yamaguchi, S.; Minbuta, S.; Matsui, K. Adsorption of the cationic dye methylene blue on anodic porous alumina in sodium dodecyl sulfate solutions. Langmuir 2020, 36, 4592–4599. [Google Scholar] [CrossRef] [PubMed]
- Fumoto, I. Studies on dyeing of polyolefins. (1) Dyeing properties of fluorinated polypropylene fiber. Sen’i Gakkaishi 1965, 21, 590–597. [Google Scholar] [CrossRef][Green Version]
Disclaimer/Publisher’s Note: The statements, opinions and data contained in all publications are solely those of the individual author(s) and contributor(s) and not of MDPI and/or the editor(s). MDPI and/or the editor(s) disclaim responsibility for any injury to people or property resulting from any ideas, methods, instructions or products referred to in the content. |
© 2023 by the authors. Licensee MDPI, Basel, Switzerland. This article is an open access article distributed under the terms and conditions of the Creative Commons Attribution (CC BY) license (https://creativecommons.org/licenses/by/4.0/).