Article

Anti-Icing Performance of Hydrophobic Silicone–Acrylate Resin Coatings on Wind Blades

1
State Key Laboratory of Power Transmission Equipments & System Security and New Technology, School of Electrical Engineering, Chongqing University, Chongqing 400030, China
2
State Grid Suining Power Supply Company, Suining 629000, China
*
Author to whom correspondence should be addressed.
Coatings 2018, 8(4), 151; https://doi.org/10.3390/coatings8040151
Submission received: 2 April 2018 / Revised: 15 April 2018 / Accepted: 19 April 2018 / Published: 23 April 2018
(This article belongs to the Special Issue Superhydrophobic Coatings)

Abstract

:
The icing of wind blades poses a serious threat to the operation of wind turbines. The application of superhydrophobic coatings on wind blades can serve as a potential anti-icing method. This study presents the findings of simulations of the icing environment of wind blades coated with hydrophobic silicone–acrylate resin in an artificial climate chamber. Artificial icing tests were performed on NACA7715 wind blades with four different silicone–acrylate resin coatings and on uncoated wind blades, with test performed at five different wind speeds and three different angles of attack. Results show that wind blade surfaces with higher hydrophobicity yield better anti-icing performance, and that the ice mass of the wind blades decreases with increasing wind speeds and angles of attack. In addition, variations in ice mass, shape, and distribution on different wind blades indicate that increased hydrophobicity can help limit the areas that are subject to freezing. Hydrophobicity can affect the air cavities of the ice deposited on the wind blades, and surfaces with increased hydrophobicity can lead to lower ice mass and less ice adhesion. In brief, surfaces with higher hydrophobicity demonstrate better anti-icing performance and benefit from active de-icing.

1. Introduction

In association with the growing need for renewable energies, wind energy projects in cold or high-altitude regions are becoming increasingly popular owing to their significant potential. However, the operation of wind turbines in these areas frequently faces icing conditions during the winter season. Ice accretion on wind turbines, particularly turbine blades, can severely degrade aerodynamic performance, resulting in reduced power output [1,2]. Therefore, it is vital to explore methods for anti-icing and de-icing wind turbines to better maintain their operation, and to increase the utilisation hours of wind power.
Extensive research studies have focused on the factors affecting the icing of wind blades. Prior studies [3,4,5,6,7] indicated that wind speed, precipitation intensity, and temperature influence the icing process of the wind blades. The angle of attack (AOA) mainly affects the ice distribution, but its effects on the icing process are unclear. Passive anti-icing methods, however, hold great potential for low energy consumption and easy maintenance [8]. To date, studies of passive anti-icing methods have focussed on the application of special coatings, especially superhydrophobic coatings. The mechanism of superhydrophobic coatings takes advantage of the water-repellency and the low adhesion of water drops in a liquid state in an effort to reduce or eliminate water accumulation on the surfaces before freezing occurs [9,10,11]. However, the icephobicity of a superhydrophobic surface is a controversial topic despite the increased attention it has received from industry and academia. Some studies proved that superhydrophobic surfaces can induce a significant delay on the initiation of freezing and reduce the ice adhesion strength [12,13,14]. Some researchers have shown that the application of a superhydrophobic surface is seriously limited in naturally freezing environments because of the frost formation on the surface and the coating’s durability [15,16]. With the rapid development of manufacturing technologies of durable superhydrophobic surfaces, the superhydrophobic material will be extensively applied in industry in the near future [17,18]. It is urgent to expand the research efforts expended on the anti-icing performance of superhydrophobic surfaces for the sake of engineering practices. This study focusses on wind blades as the test subjects used to verify the icephobicity of the hydrophobic coating.
To date, however, comparatively few studies have focussed on the application of hydrophobic coatings to wind blades for anti-icing. Peng et al. have developed and applied a superhydrophobic polyvinylidene fluoride (PVDF) coating on wind blades for anti-icing tests. Results showed lack of ice formation on the blade surface for 50 min at freezing temperatures [19]. Nevertheless, these tests may have not been completed in accordance with the actual operational performance characteristics of wind turbines in regard to the consideration of environmental factors and the AOA. Tarquini et al. [20] applied superhydrophobic material to helicopter wings in icing experiments and found that, compared with normal surfaces, the ice on superhydrophobic surfaces is much thinner, has a lower adhesive strength, and a shorter melting time.
In general, previous anti-icing studies of superhydrophobic coatings had the following features. First, many studies had been conducted on glass and aluminium sheets, but only a few of these studies targeted the wind blades. Second, the application of only one type of coating—as is usually implemented—and the simple test environment cannot match the properties and the anti-icing performance of the coating in a complex environment. To better understand the anti-icing performance of superhydrophobic coatings on wind blades, this study conducted icing tests on scaled wind blade sections, shaped according to the NACA7715 aerofoil profile, with four types of hydrophobic coatings in an artificial climate chamber. The icing performance of the superhydrophobic coatings on wind blades at different wind speeds and AOAs was measured, and the ice-adhesion forces on the wind blades were analysed with different hydrophobic coatings.

2. Experimental Details

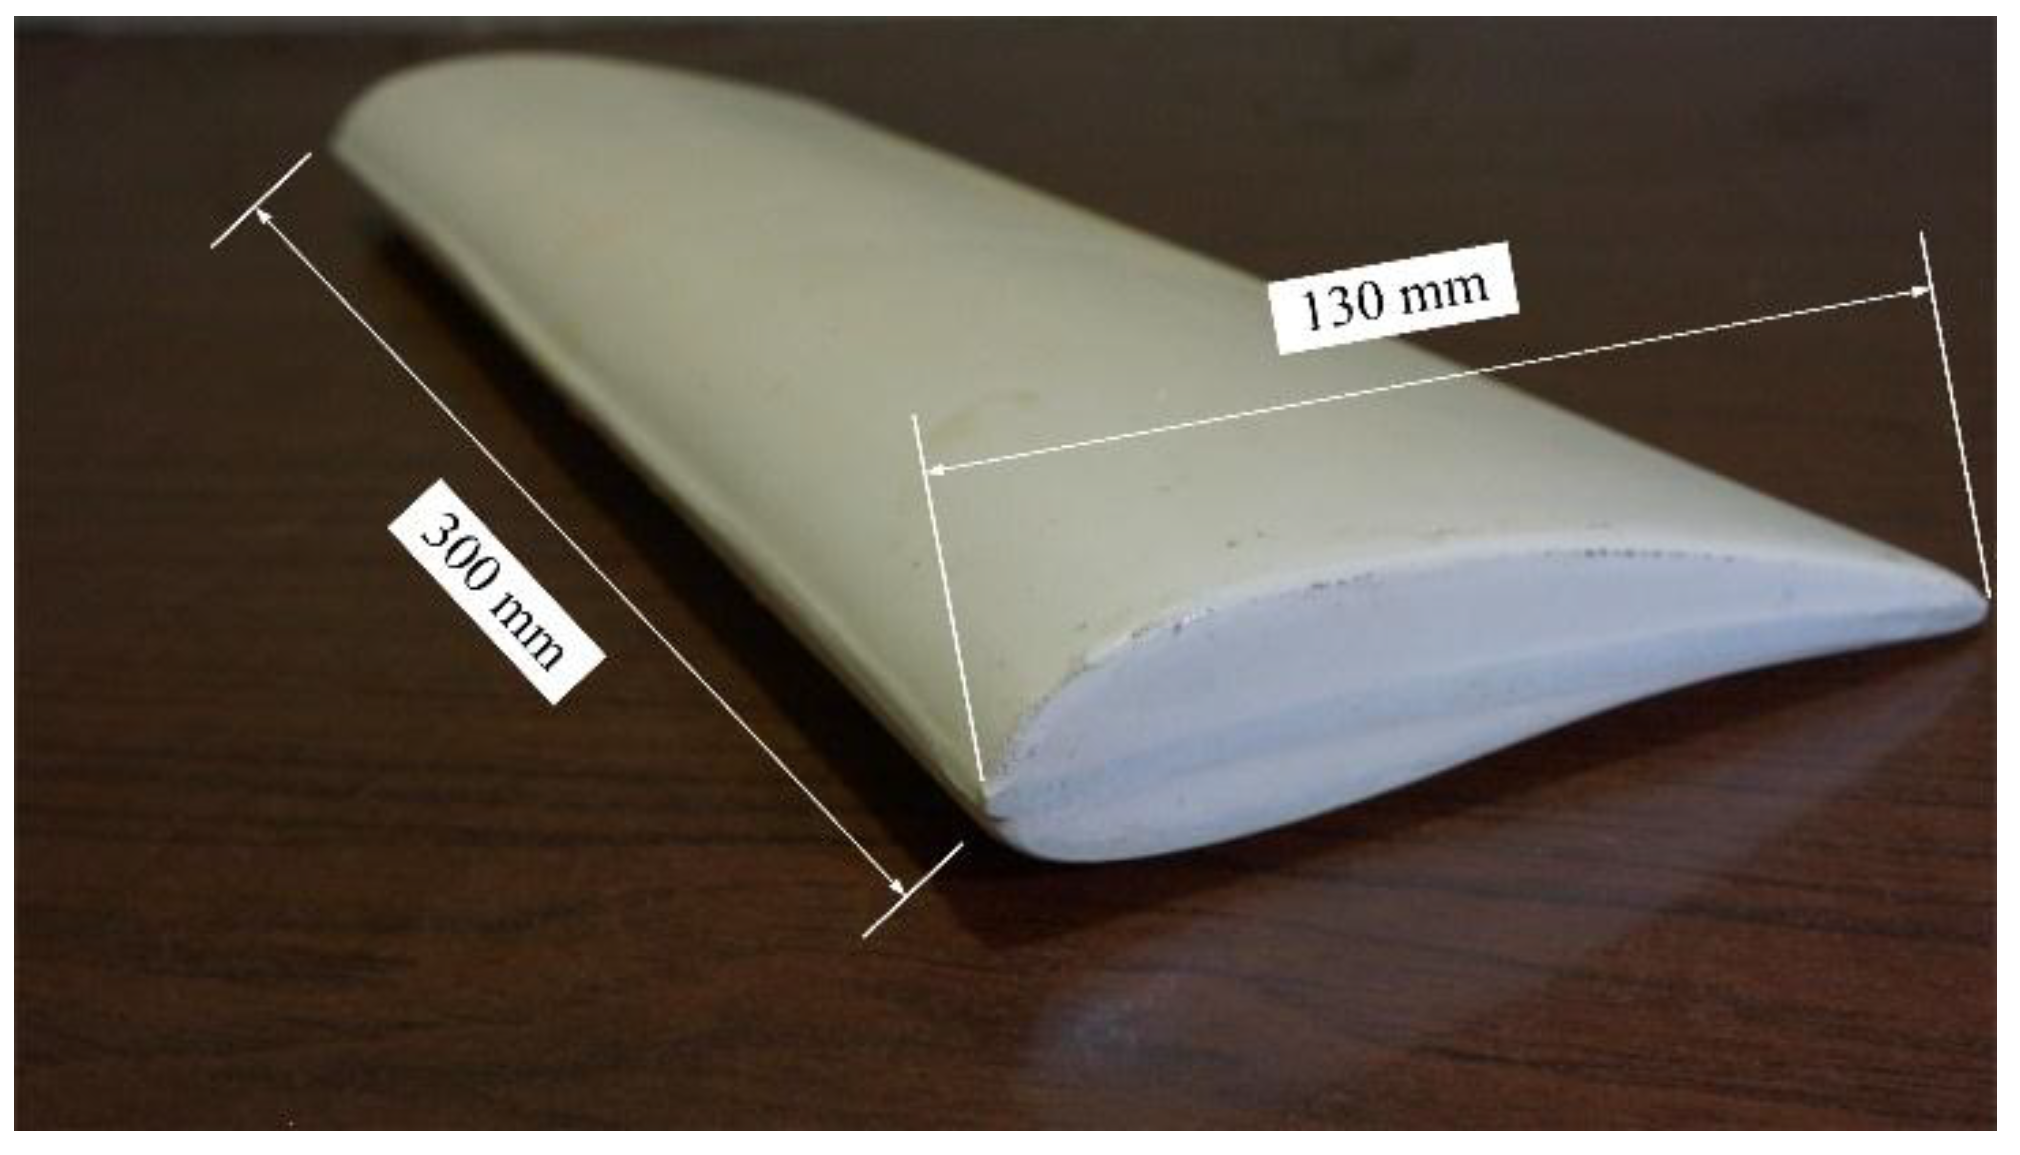
2.1. Wind Blade Samples and Hydrophobic Coatings

The test specimen was designed based on the shape of an NACA7715 aerofoil profile made of fibre-reinforced plastic with a cord length of 130 mm and a width of 300 mm (Figure 1). The selected NACA profile is commonly used in the manufacturing industry of wind turbine blades [5].
Because there is no mature product in the market, the hydrophobic coatings were customised by a professional superhydrophobic coating manufacturer (Shunye TechnologyTM Ltd., Wuxi, China) based on the requirements of the experiment. Four types of hydrophobic silicone–acrylate resin (SAR) coating samples were prepared and tested in this study. Contact angle (CA) and contact angle hysteresis (CAH) values are listed in Table 1. Coating sample C1 consists of 4 g of silicone–acrylate resin, which was dissolved in 30 g of dimethylformamide (DMF), and 20 g of n-butyl acetate. To make the silicone–acrylate resin disperse homogeneously, the mixture was stirred magnetically for 1 h at 500 rpm. The coating of sample C2 consisted of 25 wt % silicone–acrylate resin, 5 wt % silica particles, 40 wt % DMF, 25% n-butyl acetate, and 5 wt % other additives. The silica particles were made highly hydrophobic by modifying the surface with hexamethyldisilazane (HMDS). To prepare the coated sample C2, the silica particles were dispersed in DMF, which was poured into a homogeneously dispersed silicone–acrylate solution and stirred ultrasonically for 2 h to obtain the homogeneous mixture. Coated sample C3 consisted of 20 wt % silicone–acrylate resin, 10 wt % silica particles, 35 wt % DMF, 30 wt % n-butyl acetate, and 5 wt % other additives. The production procedure was the same as that used for sample C2. The dip-coating method was used to produce the coatings of samples C1, C2, and C3. Coated sample C4 consisted of the same components as C3, and was prepared by spraying solution onto airfoil samples with a compressed air pressure of 137.9 kPa, and a spray distance of approximately 25 cm. All the samples were dried in the thermostatic chamber at 50 °C for 24 h. Previous studies show that the existing superhydrophobic materials are up against the durability problem [16]. The hydrophobicity of the coatings will be weaker after icing and melting cycles. To avoid the reduction of the hydrophobicity, all the test samples were disposable.
A NACA7715 airfoil blade section without the hydrophobic coating, marked as C0, was used as the control group. The CA of C0 was 58 ± 2°, and the CAH was too large to measure.

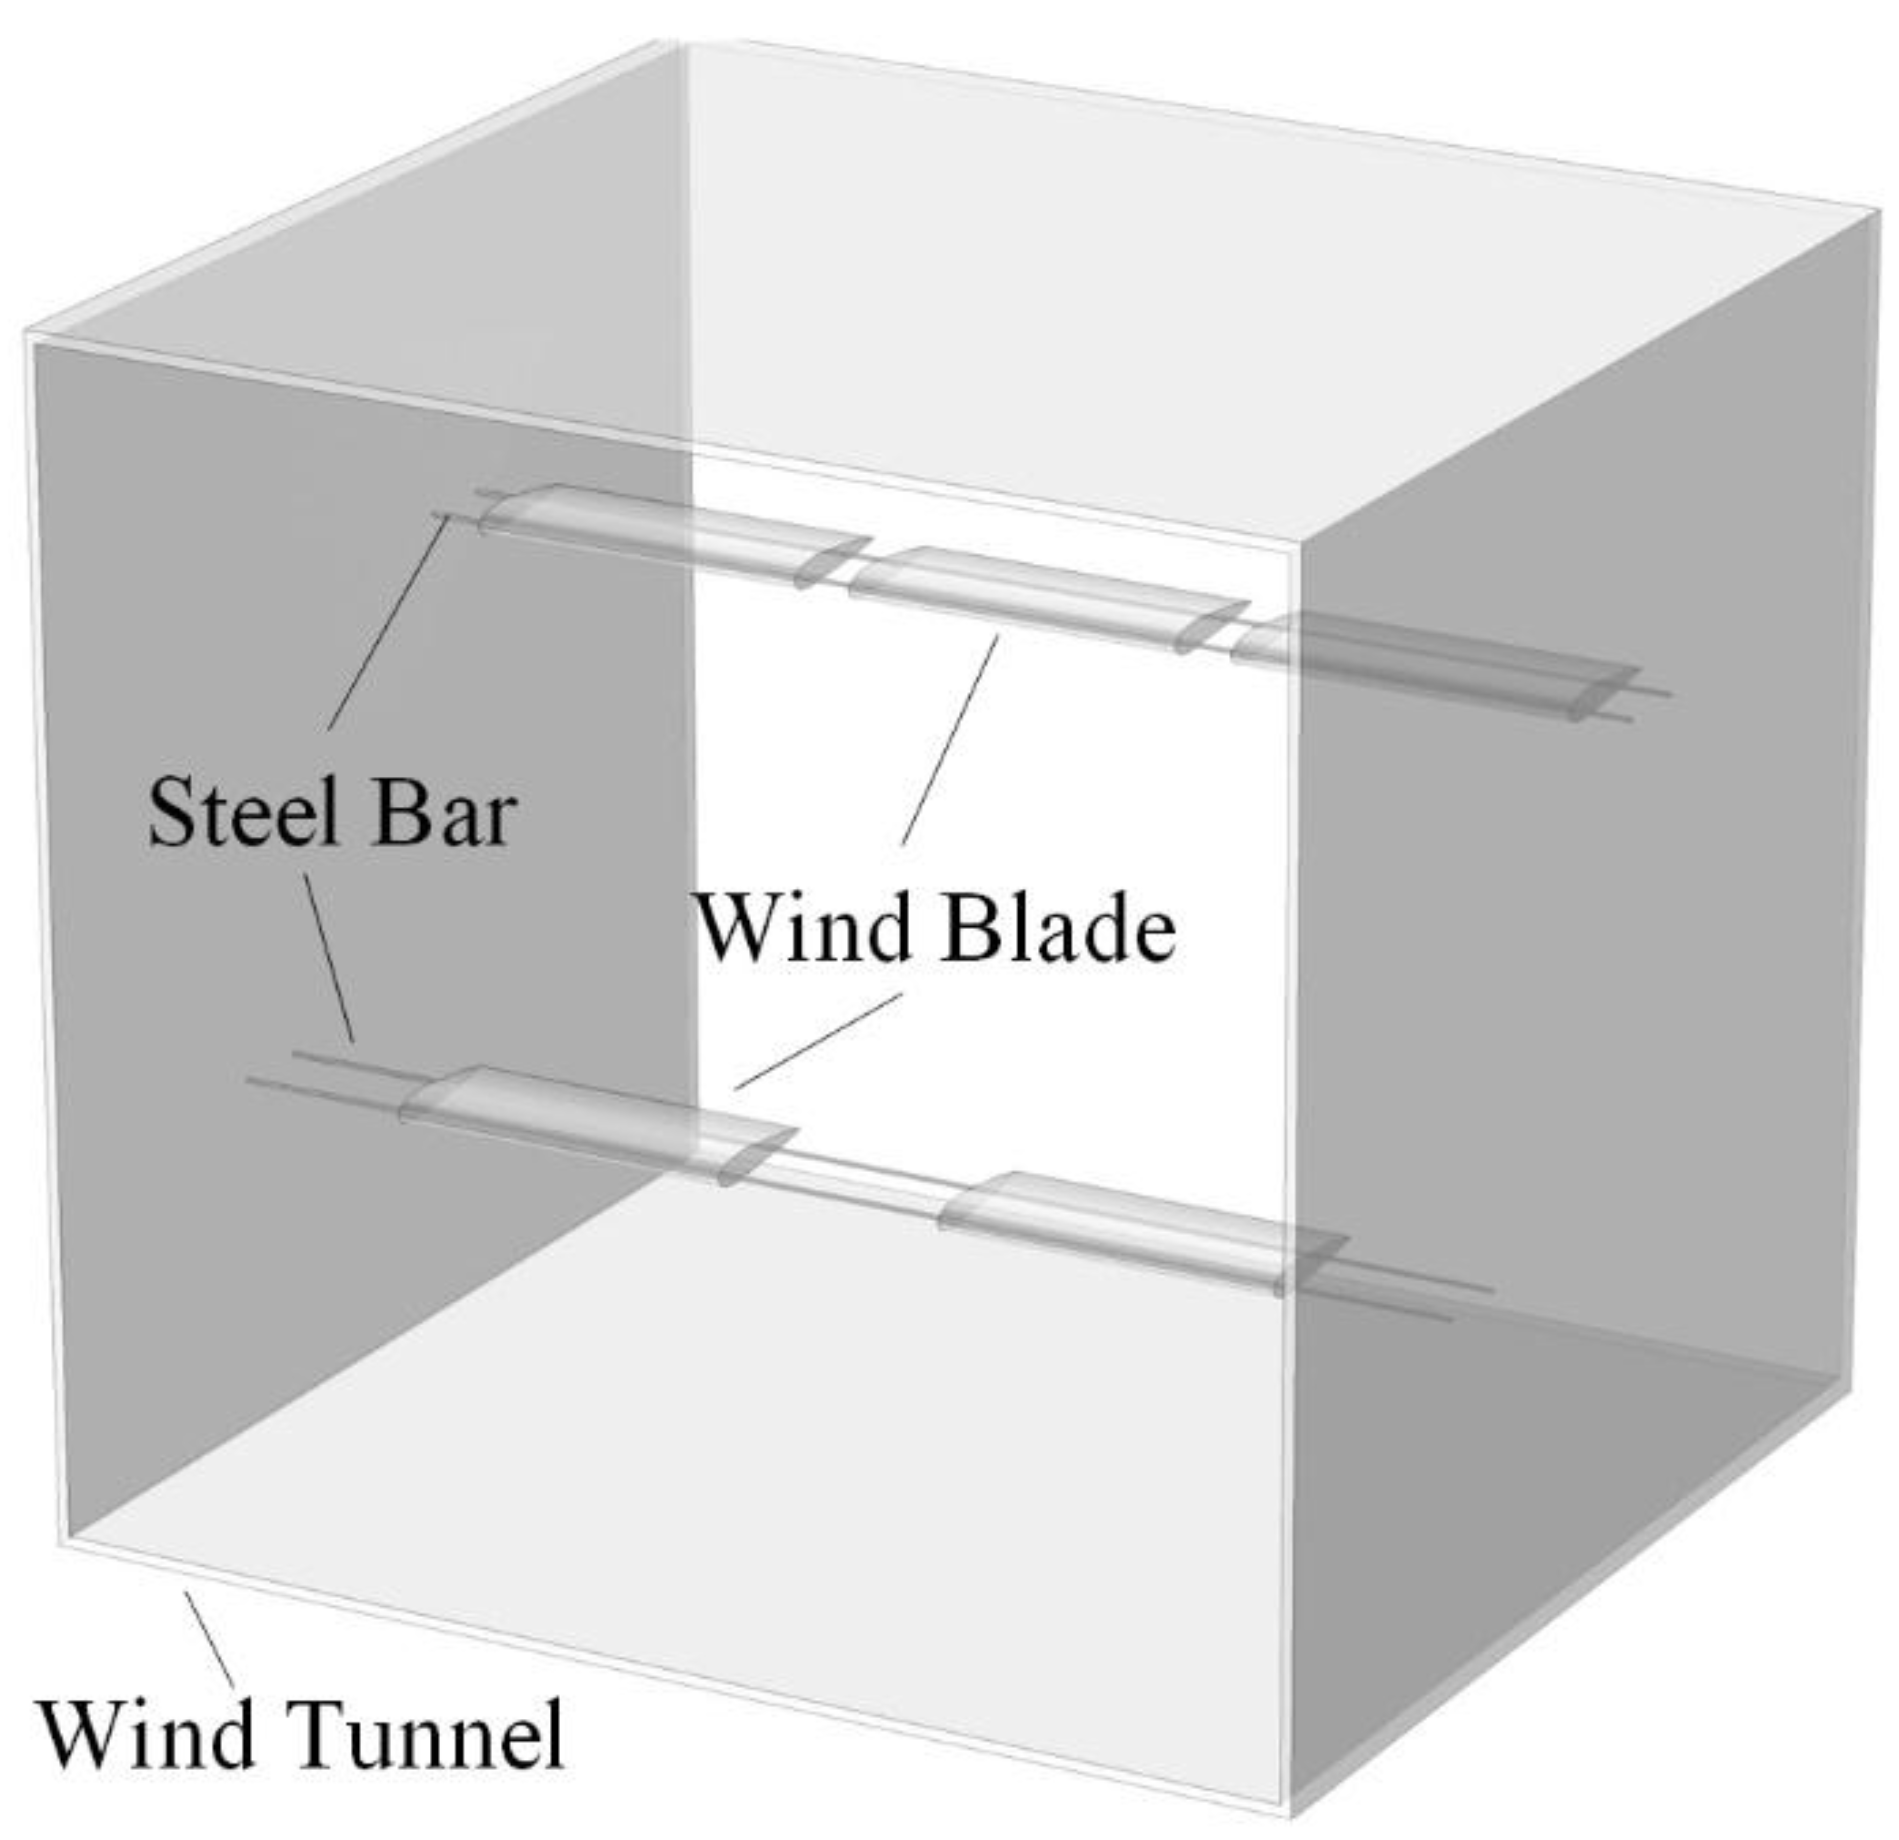
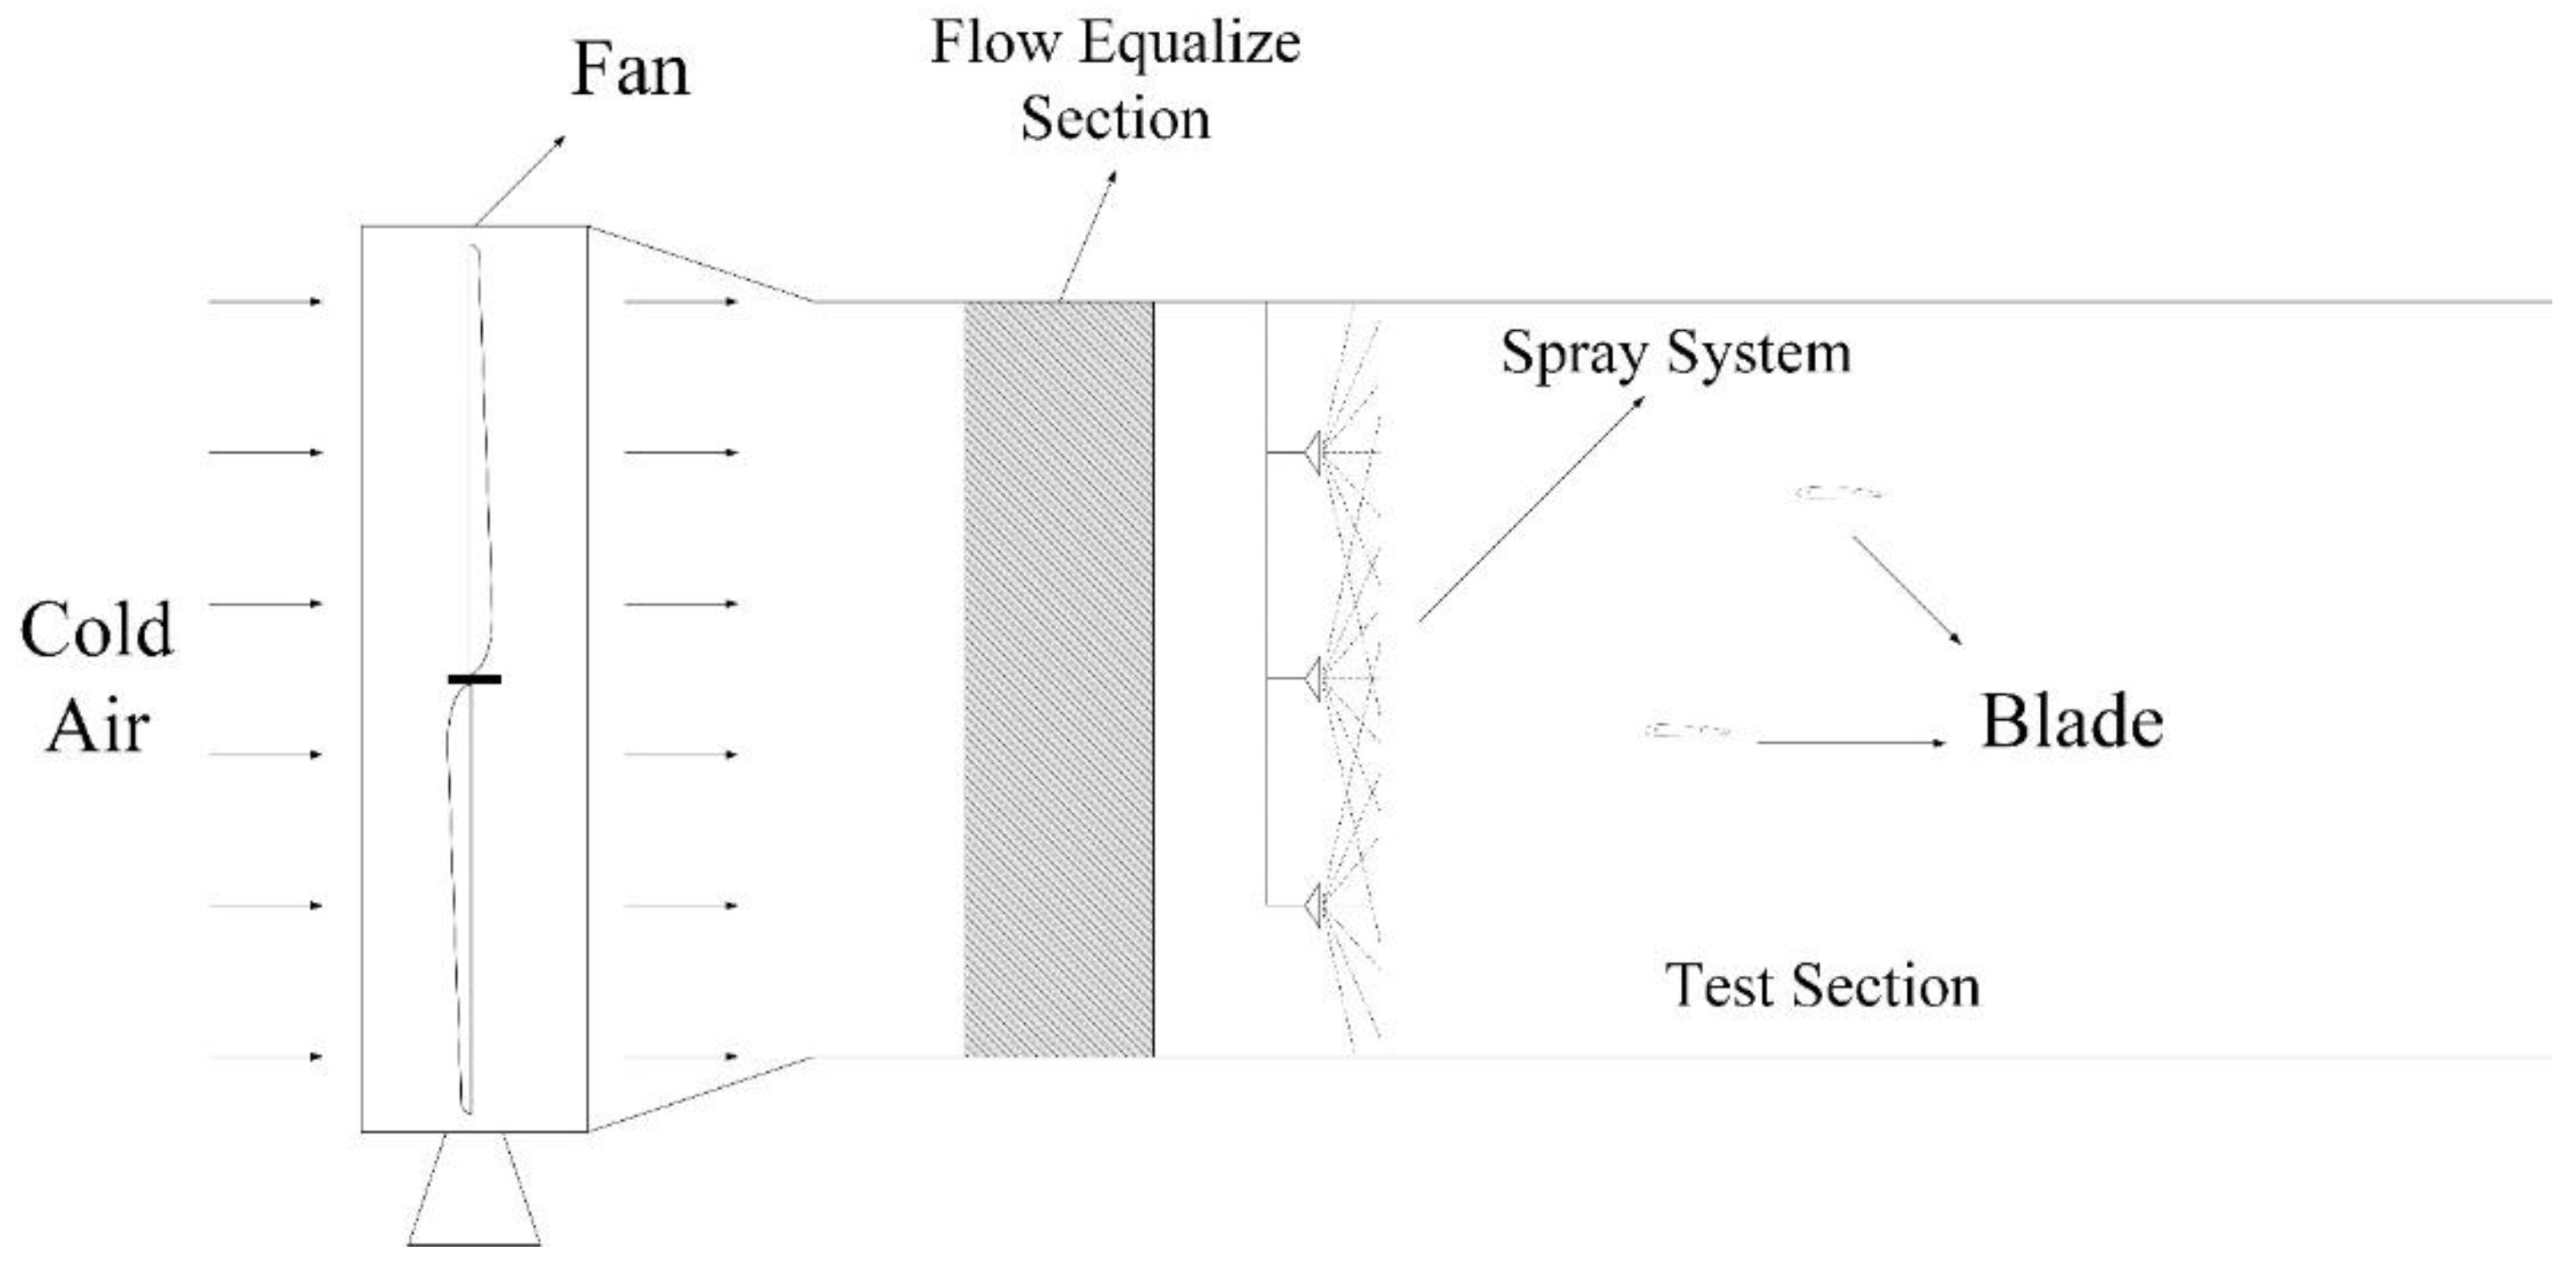
2.2. Artificial Icing Test Facilities

The tests were performed in an open-loop wind tunnel (Figure 2), which had a square test section of 1000 mm × 1000 mm and a length of 1000 mm. To ensure the wind speed was equally distributed, a flow equalisation section was set between the fan and the wind tunnel. The wind velocity in the test section could be adjusted from 0 to 15 m/s. To obtain icing conditions, the tunnel was placed inside a multifunctional artificial climate chamber at the Chongqing University, China. The artificial climate chamber had a diameter of 7.8 m and a height of 11.6 m [21]. The most dangerous type of ice deposited on wind turbines is that associated with the highest ice adhesiveness, and is known as wet-grown ice [1]. Thus, the ambient temperature was set within the range of −7 to −5 °C, and the airfoil samples were iced with glaze. A pneumatic nozzle spray system was used to produce continuous freezing water droplets. The diameter of the sprayed water droplets was approximately 80 μm and was measured with a Winner312 Laser Particle Size Analyser made by Jinan Winner Particle Instrument Stock Co., Ltd., Jinan, China. The freezing water flux was set at approximately 80 L·h−1·m−2 by adjusting the air pressure to 0.2 MPa and the water liquid pressure to 0.1 MPa. The freezing water was precooled to 0 °C. The compressor of the spray system was in the artificial climate chamber, so the temperature of the intake air was consistent with the ambient temperature of the climate chamber.

2.3. Artificial Icing Test Procedure

The degree of ice accretion on a blade surface can reflect the anti-icing performance of the surface. For testing, the influence of hydrophobicity on icing accretion was studied under several environmental conditions. According to previous studies, ice accretion is a complicated and continuous process, affected by many factors [4,18]. To avoid the randomness of an icing environment, experimental conditions included various types of samples with different hydrophobic surfaces at each icing test. Additionally, steel bars were used to affix the blades in the wind tunnel. Three blades were evenly arranged at a height that was equal to 2/3 height of the tunnel, and two blades were arranged at a height of 1/3 height of the tunnel. These two rows of blades were disposed in a staggered orientation in the vertical direction to ensure that the icing process on the blades was not affected by fixing devices and other blades. The blade arrangement is shown in Figure 2 and Figure 3. To analyse the degree of icing of the blade samples, the ice mass, ice morphology, and the distribution on the blades were measured and recorded. After 60 min of icing, the blades were removed from the steel bars in order to be photographed and measured. The ice mass was calculated by comparing the mass of the blades before and after icing. The ice morphology and distribution were visualised with photography.
The main test procedure was as follows. (i) Samples were arranged in the wind tunnel test zone according to Figure 3, with the wind tunnel placed in the middle of the artificial climate chamber. (ii) The freezing water was cooled to 0 °C (the water used in the test is deionised, and its conductivity was 6 μS cm−1 at 20 °C). (iii) The refrigeration system of the artificial climate chamber was switched on to reduce the ambient temperature in the chamber to the expected one. In this study, glaze ice was simulated, and the ambient temperature was controlled at −6 ± 1 °C. (iv) The fan of the wind tunnel was on, and it was adjusted according to the wind speed. The spray nozzles were turned on to begin ice accumulation. Pneumatic spray nozzles were used to produce freezing water droplets. The average diameter of the sprayed water droplets was approximately 80 μm. The freezing water flux was set at approximately 80 L·h−1·m−2 by adjusting the air pressure to 0.2 MPa and the liquid water pressure to 0.1 MPa. The ice-accumulation test for each sample lasted 60 min.
To study the anti-icing performance of hydrophobic coatings in different running environments (Table 2), this study executed the icing experiments on a wind blade using seven conditions. Conditions 1–5 were used to analyse the effects of wind speed on the ice mass and the distributions of hydrophobic coatings, whereas Conditions 3 and 6–7 focussed on the effects of the AOA on ice mass and the distributions of hydrophobic coatings.

3. Results and Discussion

3.1. Ice Mass

The mean value of the five repeated tests was used to compile the test results of each blade sample under each condition. Figure 4 shows the ice mass test results of samples C0–C4 under Conditions 1–5 after 60 min of icing. Figure 5 shows ice mass test results of samples C0–C4 under Conditions 3, 6, and 7, after 60 min of icing. The concrete dates are listed in Table 3 and Table 4, x ¯ represents the average value, and SD represents the standard deviation.
Figure 4 and Figure 5 and Table 3 and Table 4 present the following findings:
(i).
With the pre-set wind speed and AOA, the hydrophobic coatings significantly affect the icing on the blade samples. The ice mass on the coated blade samples is substantially less than the ice mass on the uncoated blade samples. Moreover, with an increase in the CAs of the hydrophobic coatings, the ice mass of the blade samples tends to decrease. The CAH of the hydrophobic surface has an apparent effect on the ice mass of the samples. The ice mass of C4—which has the same CA and a smaller CAH to C3—is obviously lighter than C3. With the largest CA and the smallest CAH, the surface of C4 can help droplets roll off easily and remain on the surface for the shortest amount of time. The droplets have the lowest probability of freezing, and result in the slowest icing growth, and the lowest final ice mass of C4 under each wind velocity and AOA condition. It can be concluded that higher CA and smaller CAH values are more beneficial to the sample’s anti-icing performance. Within all the test ranges of wind speed and AOAs, the ice mass of sample C4 decreased by 39.5% with respect to the maximum value, compared with that of sample C0, under the same icing conditions.
(ii).
With a fixed AOA, the ice mass of each sample increased significantly as a function of wind velocity. Possible reasons may include the following: (a) higher air velocity may accelerate the heat exchange between the supercooled water droplets and the environment as well as speed up the freezing process, which would then improve the icing probability; (b) under the influence of high wind velocity, the supercooled water droplets gained greater kinetic energy, which made it possible for them to cover more parts of the blade and increased the icing areas and the ice mass.
(iii).
With a fixed AOA, the effects of wind speed on ice mass were also related to the hydrophobic performance of the sample coating. For hydrophilic C0 and weak hydrophobic C1 and C2, the ice mass of each sample increased approximately linearly with the wind speed. However, for C3 and C4 that had CA values higher than 150°, the ice mass yielded a nonlinear relationship with wind speed. In regard to the change of ice mass (Table 3), maximum decreases of ice mass were noted for C3 and C4 compared to those for C0 at a wind speed of 6 m/s, thereby reaching values of 28.3% and 38.1%, respectively. At increasing wind speeds, the ice mass decreased gradually. At 12 m/s, the decrease rate in the ice masses for C3 and C4 were only 19.0 and 23.9%, respectively. One reason for this may be attributed to the fact that, at increasing wind speeds, the increasing kinetic energy accompanying colliding supercooled water droplets makes it easier for water droplets to split into smaller ones, which remain on the sample surface and form ice layers. According to a prior conducted study [22], supercooled water droplets must combine to reach the threshold diameter before they roll off the hydrophobic surfaces. Under the glaze condition, scattered, smaller-sized water droplets easily form ice layers, which makes it increasingly difficult for droplets to fall off, and results in a decreased anti-icing performance for hydrophobic coatings.
(iv).
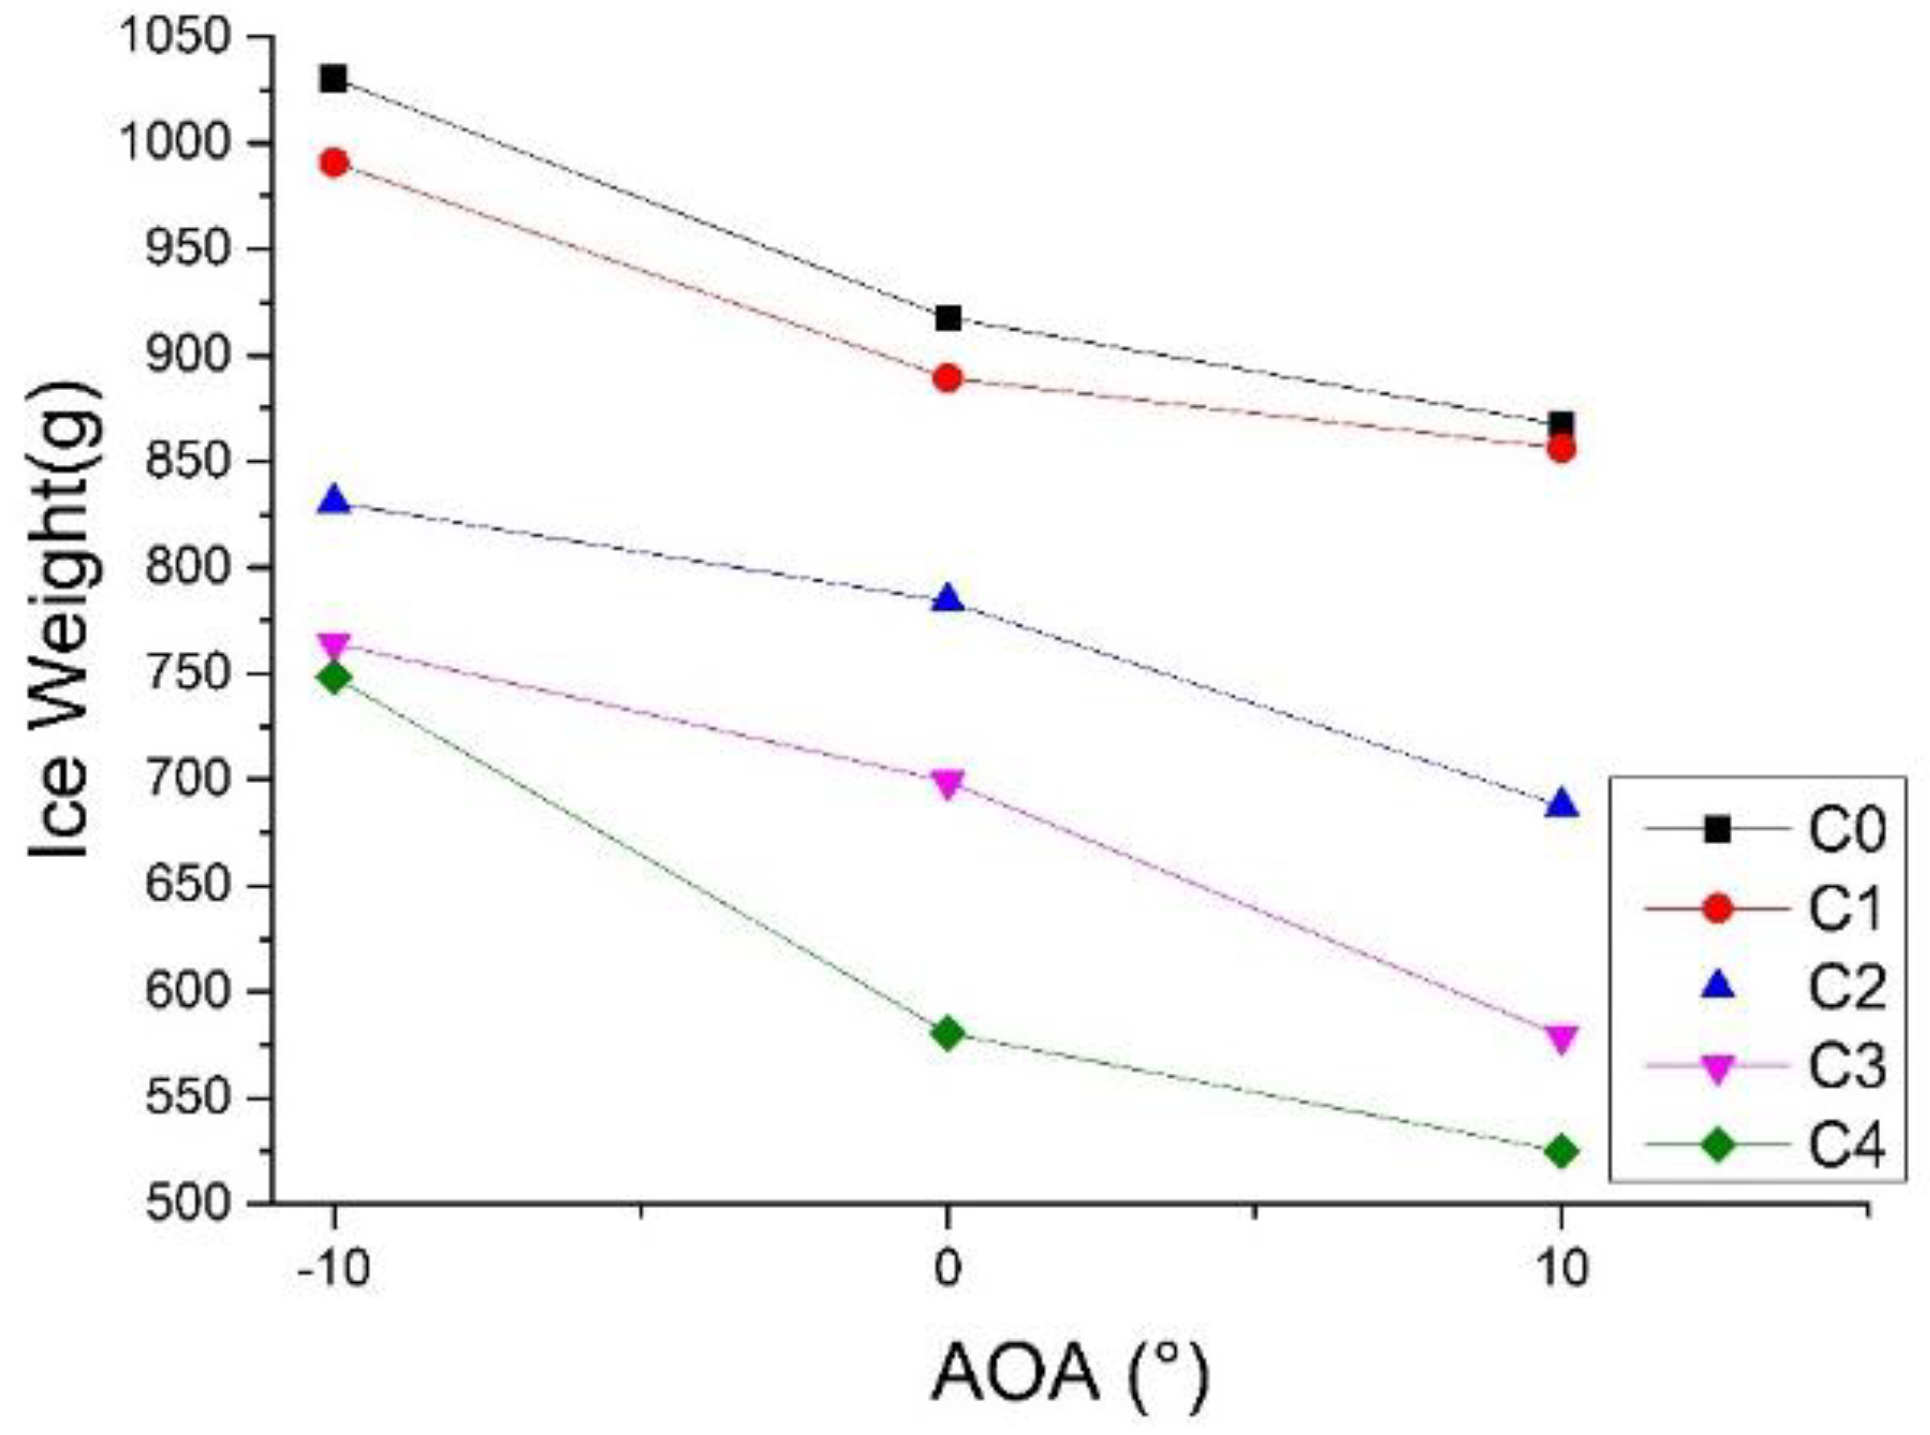
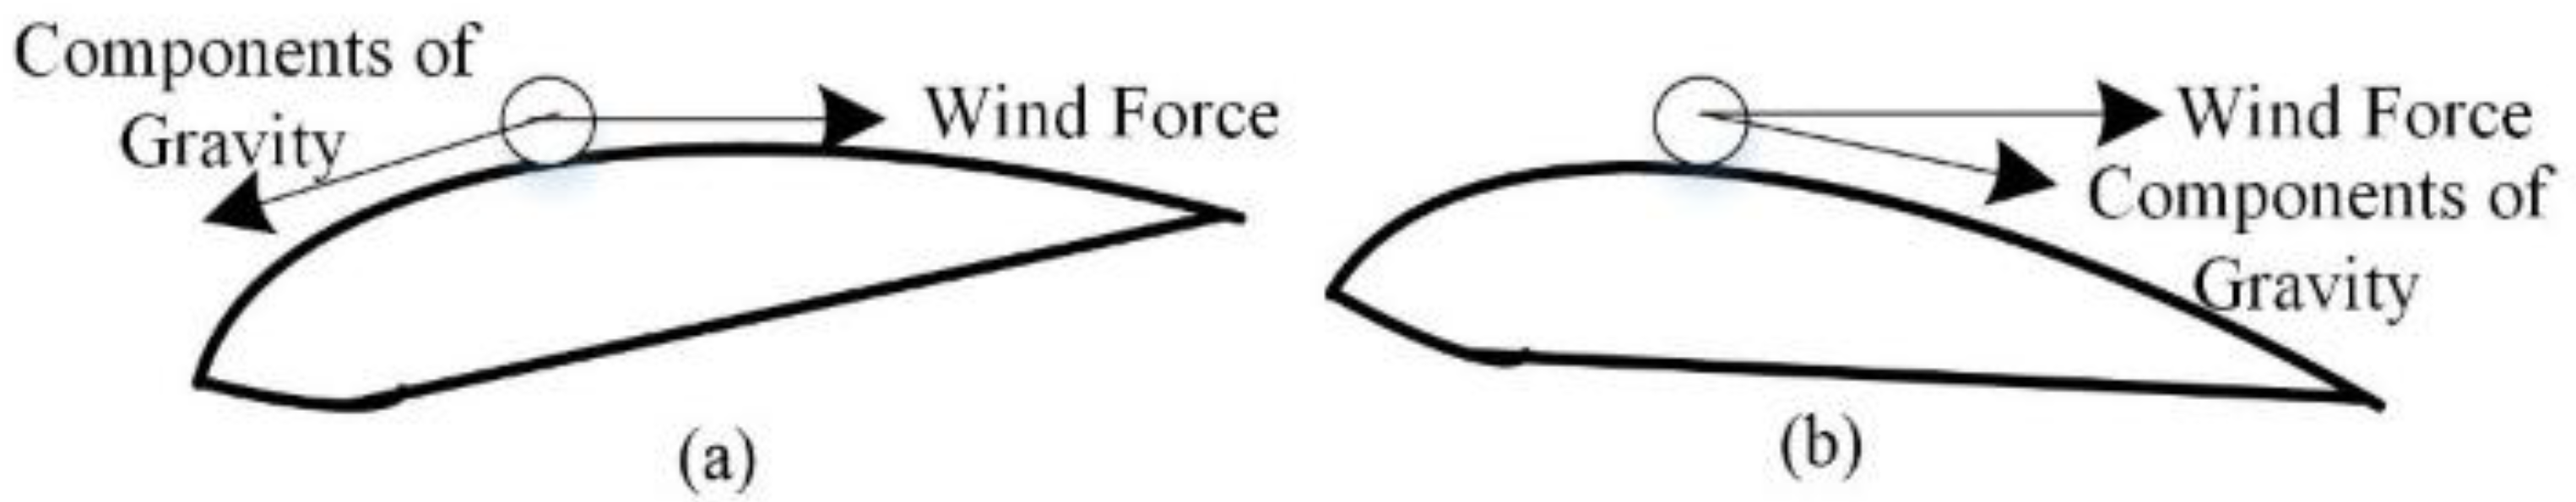
At a fixed wind speed, AOA exerted an effect on the ice masses of C0–C4. With the increase of AOA from −10° to 10°, the ice masses of C0–C4 decreased. However, the decreasing range was affected by the hydrophobic performance of the blade surface. With an increasing hydrophobic performance, the decreasing range of ice mass gradually increased. For instance, when AOA increased from −10° to 10° for C1 and C2 with poor hydrophobic performances, the ice mass was lowered by 13.6% and 17.2%, respectively. For C4 that had the maximum CA and the minimum CAH values, its ice mass declined by 29.9%. The water droplets on the blade were affected mainly by wind and gravity. Figure 6 shows the force analysis of the water droplets on the blade surface with AOA ranging from −10° to 10°. Droplets were assumed to be spherical. However, the force of friction that always obstructs the movement of droplets is not marked, given the uncertain direction of motion of the water droplets. When AOA was −10°, water droplets tended to roll along the front of the blade under the effects of gravity. Additionally, the wind force impeded the forward movement of the droplets. The two forces counteracted in the effort to maintain the droplets on the blade surface for a longer time, and to increase the probability of icing. When AOA was +10°, the movement of water by gravity was in the same direction as that of the wind, which was useful in causing the droplets to fall off the back edge of the blade and reduce the amount of water on the surface and the ice mass. In contrast, strong hydrophobicity means low energy on the surface, which facilitates the rolling of droplets. As a result, the decreasing range of ice mass enlarges with increasing AOA.

3.2. Ice Morphology and Distribution

The morphology and distribution of ice on the blade surface have a direct impact on the aerodynamic performance of the blade. If the blade is de-iced by an active method, the distribution of ice on the blade surface will also affect the configuration of the active de-icing equipment. Studies conducted thus far indicate that the anti-icing performance and ice distribution of the hydrophobic surface is affected mainly by the AOA [5]. Shown in Figure 7 are the icing photographs of samples C0–C4 under conditions 3, 6, and 7, after 60 min of icing.
On the basis of Figure 7, blades with different coatings take on significantly different ice forms and distributions for the same AOA conditions. Even the blade with the same coating yields significantly different ice forms and distributions under different AOAs conditions.
(i).
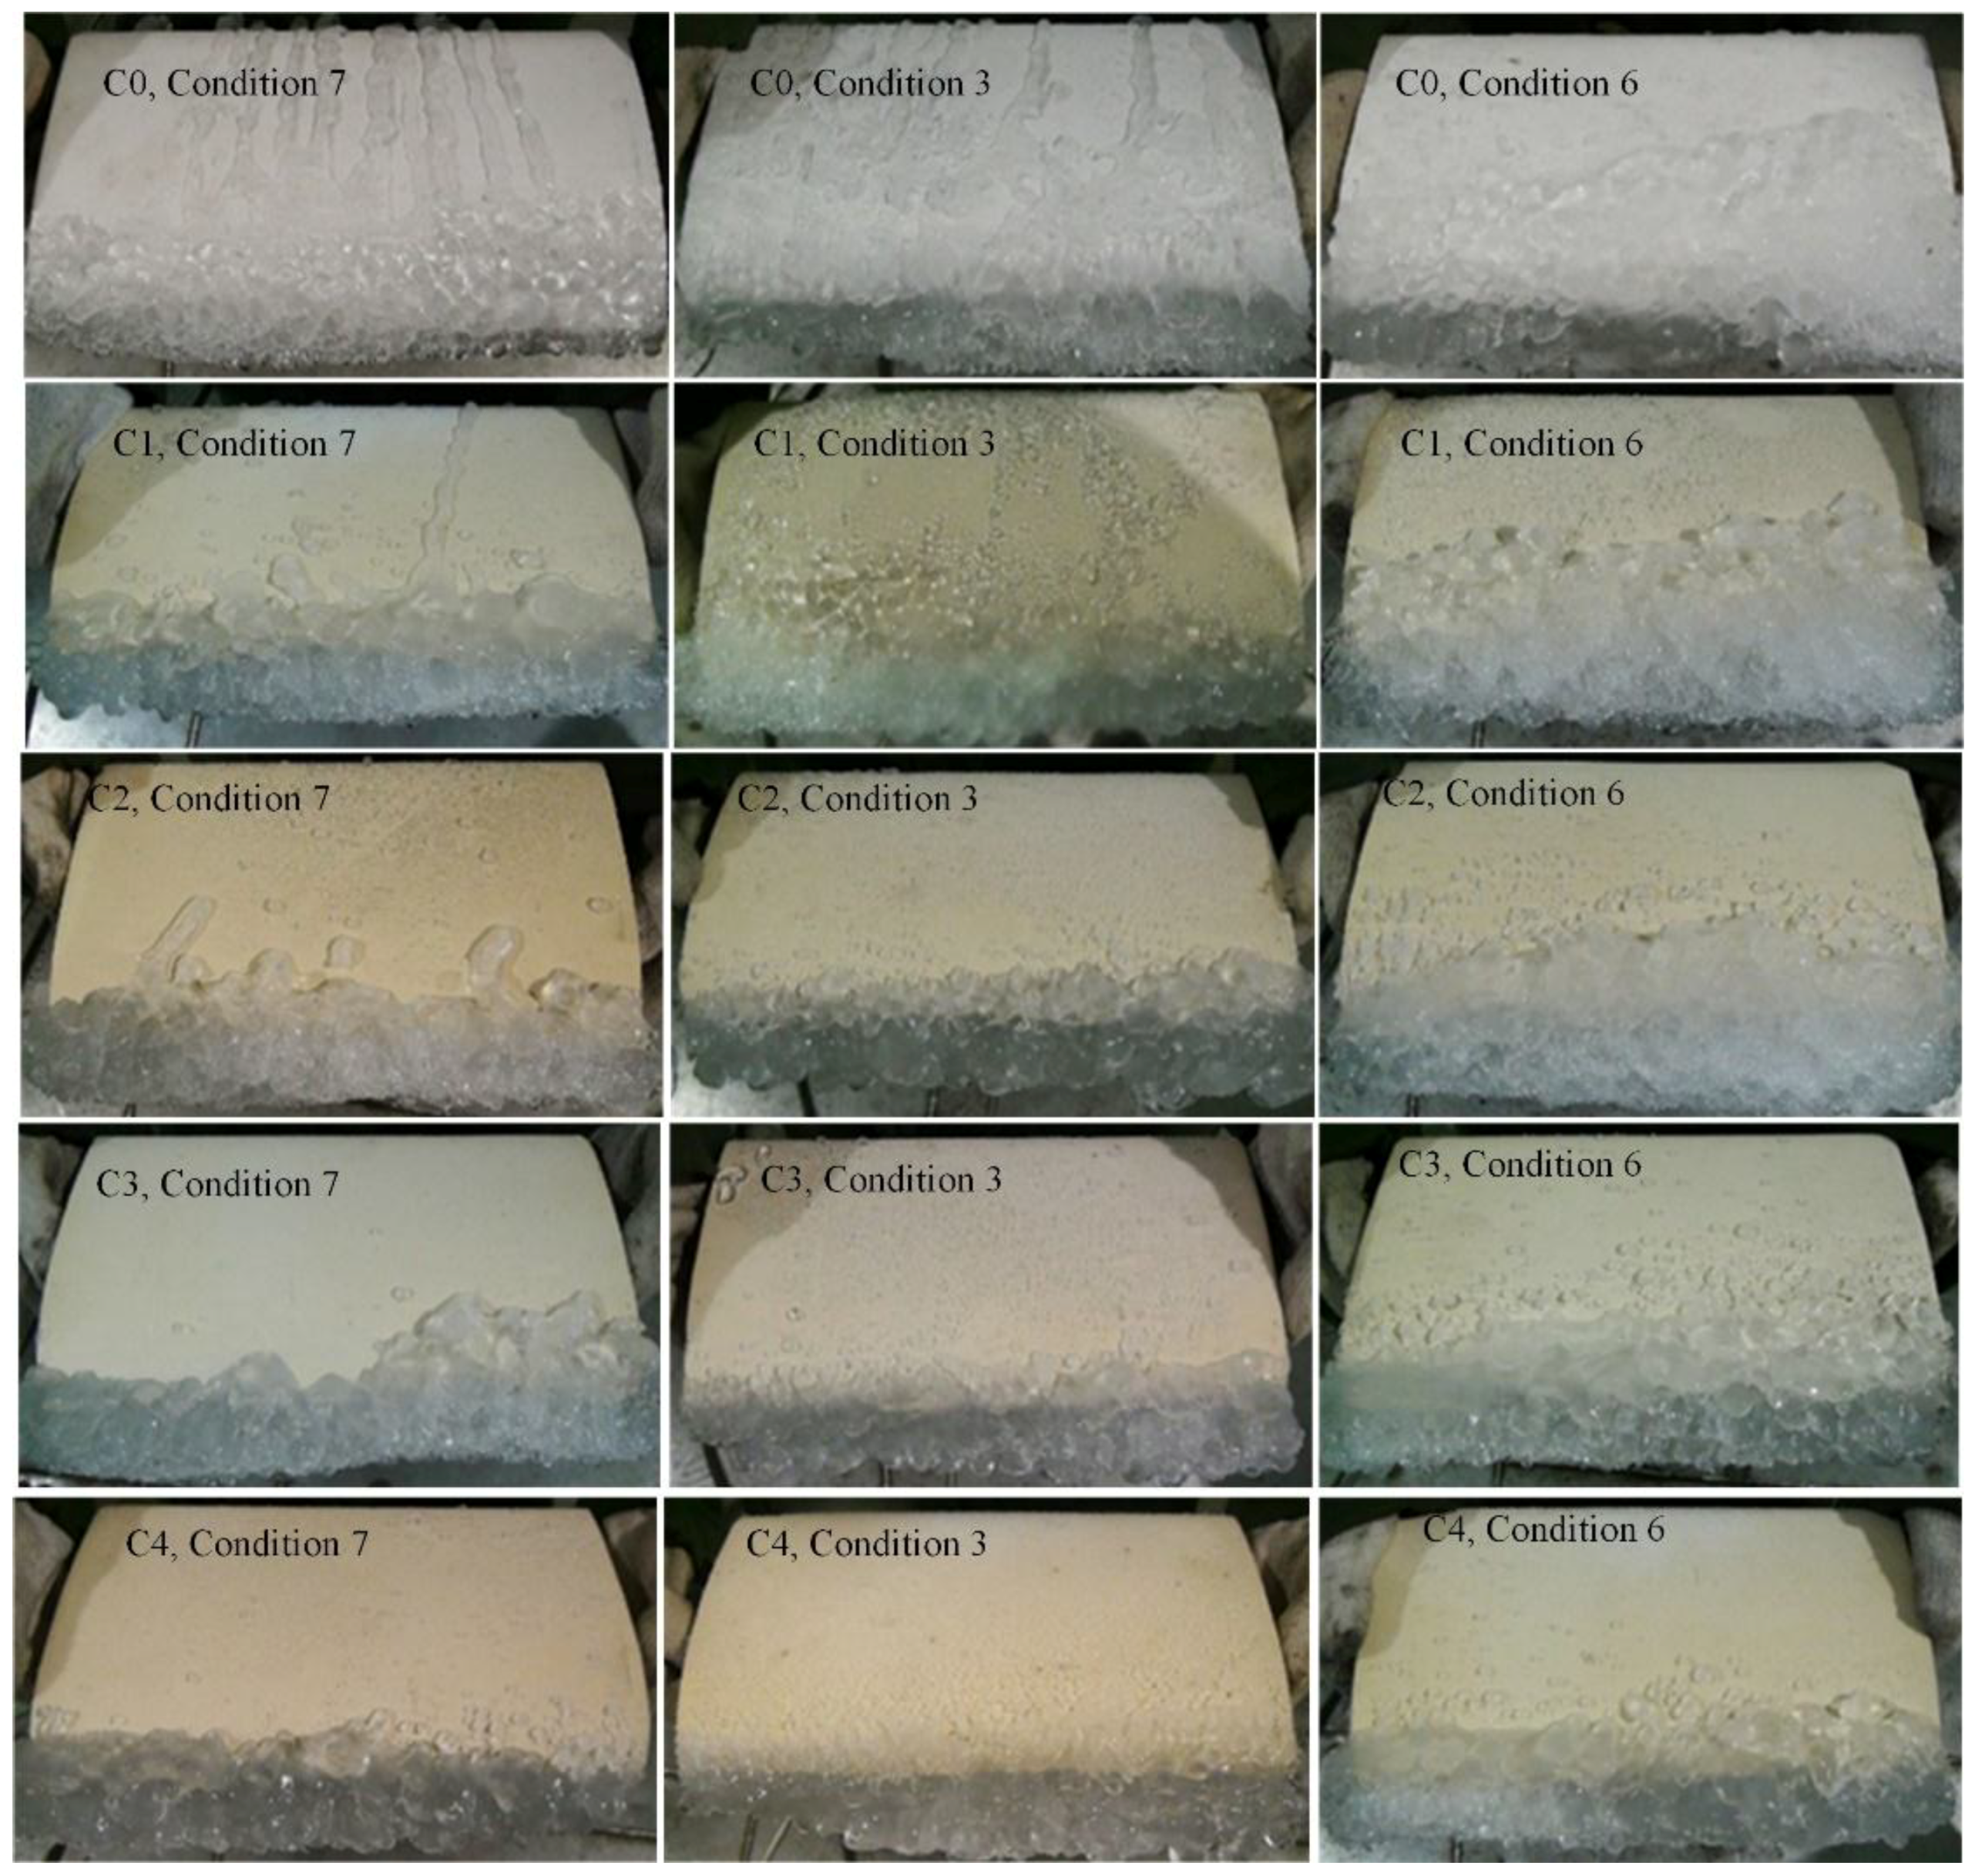
Under the same AOA and wind speed conditions, an improved hydrophobic performance of the blade surface leads to the concentration of freezing mostly on the leading edge of the blades. For example, ice present on the C3 and C4 surfaces exists mainly on the leading edge of the blades, and only at an AOA of −10°, thereby leading to the scattering of some ice particles on the surface. By contrast, ice layers exist on most parts of the C0 and C1 surfaces.
(ii).
With AOA changing from −10° to +10°, the freezing areas on the surfaces of the blades gradually narrow. This effect is exacerbated when the surface becomes more hydrophobic. For instance, for C0, ribbonlike ice layers form in areas spanning regions from the leading edge to the back edge of the blade surfaces when AOA is −10°. However, there is a reduction of the ribbonlike ice layer areas on the upper surface when AOA is +10°, and they mainly exist in regions near the leading edge. The ice is consisted of particles in the case of the surface of C4 that possessed the largest CA and the smallest CAH values. Larger AOA values lead to a fewer number of freezing areas on the upper surface of the blade.
The hydrophobicity of the blade surface affects the formation of the water droplets, and thus affects the force exerted on those droplets and their moving process. Figure 6 shows the water droplets on C3 and C4. Surfaces with increased hydrophobicity are approximately spherical and are subject to the negligible effects of the rolling friction, compared to the effects of gravity and wind force. With an AOA of −10°, water droplets tend to roll towards the leading edge of the surface and fall off, whereas, with an AOA of +10°, water droplets are more likely to roll towards the back edge and fall off. Thus, a smaller quantity of ice exists on the surface, and this is mainly accumulated on the leading edge of the blade. When the coating surface has decreased hydrophobicity, water droplet formation is flat, and the droplet movement is affected by gravity, wind, and by the force of the rolling friction. Therefore, with an AOA of −10°, because of the force of rolling friction, water droplets do not roll off so easily, irrespective of whether they are on the front edge or on the back edge. With an AOA of +10°, under the combined effects of wind and gravity, the weak hydrophobic surfaces make it difficult for the water droplets to roll off, and the slow movement of the water droplets increases the likelihood of chunk ice and flake ice formation. Because the increased hydrophobicity of the blade surface helps reduce the areas of freezing, de-icing devices can be affixed on the leading edge of the blade to reduce de-icing energy consumption and cost.
The influencing factors of ice adhesion include ice salinity and various properties, including ice–substrate interface, temperature, and substrate material [23]. Hydrophobic coatings have lower surface energy and more complex surface structures compared with uncoated surfaces. For the same icing conditions, the differences between different hydrophobic and uncoated surfaces are mainly differences in the shape of the water when maintained on the surface. Water droplets are spherically shaped on C4 with superhydrophobic coatings (Figure 8a). However, these droplets spread on C0 in the case when no coating is applied (Figure 8b). It is possible that air cavities exist among the water droplets when several droplets remain on the surface of C4 (Figure 8c), where the red circles denote air cavities). Air cavities reduce the adhesive strength between the ice and the blade surface. Under the effects of external forces, the ice can easily fall off. For C0 with a hydrophilic surface, water droplets are more likely to converge and form a water film. Consequently, almost no air cavity would exist among the water droplets (Figure 8d).
To verify this speculation, the ice was slit on the surface and the slit section was observed using electron microscopy. Photographs of this section are shown in Figure 9.
In Figure 9a, only one air cavity appears in the field-of-view of the camera, and the diameter of the air cavity is only 0.08 mm. This finding indicates that the ice on the uncoated blade fits very tightly onto the surface and contains no cavities. According to Figure 9b–d, the quantity and size of the air cavity increases with increasing hydrophobicity. In Figure 9b, the number of air cavities on C1 is much higher than that on C0, and their sizes are bigger, with diameters ranging from 0.08 to 0.12 mm. The number of air cavities on C2 is significantly higher compare to the cavities on C0 and C1, and the average air-cavity diameter is obviously larger. Most air cavities on C2 have diameters that are equal to 0.15 and 0.20 mm. For C3, air cavities are even larger, and most of them have diameters larger than 0.2 mm, but some are 0.3 mm in diameter, or larger (Figure 9d). Figure 9e shows a slightly increased number of air cavities on C4, with sizes similar to those for C3. C4 has similar CA and smaller CAH values compared with those of C3.
In summary, the differences in hydrophobicity lead to the variations in the quantity and size of the air cavities during the icing process. These finally lead to greater differences in ice mass. As is shown in Figure 8a, the water drop on the superhydrophobic surface remains comparatively spherical, and the bottom part of the ice does not fit perfectly to the blade surface because of the formation of a triangular space (Figure 8a). At normal temperatures above freezing, drops fuse together based on the surface tension, and the cavity disappears. However, under a continuous spray, some drops will freeze or partially freeze at sub-zero temperatures. The frozen drops will not melt when the water falls and will continue to grow as spherical objects. Eventually, the adjacent frozen drops will form air cavities (denoted using red circles in Figure 8c). If the air is not expelled before the drops freeze completely, it will form cavities or grooves in the ice, and an ice layer might even form with an air cavity inside. For larger CA values, the water drop on the surface is more spherically shaped, and the air cavity between the surface and the bottom part of the ice is larger, thereby improving the possibility of creating cavities and increasing the air proportion, cavity number, and size of the ice layers. Thus, these findings verify the reasons for which C3 and C4 have increased numbers of large cavities compared with the other three samples. When the surface is hydrophilic, the bottom part of C0 can completely fit the blade surface, and almost no cavities are formed. The morphology of the water drops on C0 is shown in Figure 9a, and the development of the icing process is shown in Figure 9c. Therefore, differences in the number and size of the cavities on the blades might lead to variations in the tensile stress and the shear stress of the samples. In addition, the superhydrophobic surface has, in theory, a nano–micro structure, which will form more space between ice and substrate, and reduce the interface area compared with the smooth surface. However, further studies are necessary to reveal the effects of superhydrophobic surfaces.

4. Conclusions

This study explored the effects of SAR hydrophobic coatings on the icing performance of wind blades through wind tunnel tests in an artificial climate chamber. The main conclusions are as follows:
(i).
The anti-icing performance can be more effective when the CA of the coatings increases and the CAH decreases. With CA > 130°, the coatings could significantly reduce ice mass. When CA equalled 110°, coatings showed no significant anti-icing effects. For C4 with a superhydrophobic coating, the ice mass of sample C4 decreased by 39.5% with respect to the maximum value in all test conditions.
(ii).
For hydrophobic coatings with a CA > 130°, the anti-icing performance was affected by the wind speed and the AOA. With an AOA of 0°, the decreasing rate of the ice mass of C4 (in the case where a superhydrophobic coating was used) increased and then decreased, compared to the trends observed for the uncoated sample C0. At a wind speed of 6 m/s, this decreasing rate reached its maximum value that showed that the high-speed wind was not beneficial to the anti-icing performance of coatings. However, by increasing the AOA, the anti-icing performance of coatings increased significantly.
(iii).
Under the same AOA and wind speed conditions, increased blade surface hydrophobicity led to increased concentration of freezing areas, mostly on the leading edge of the blades. The bigger the AOA was, the fewer the freezing areas on the blade surface were.
(iv).
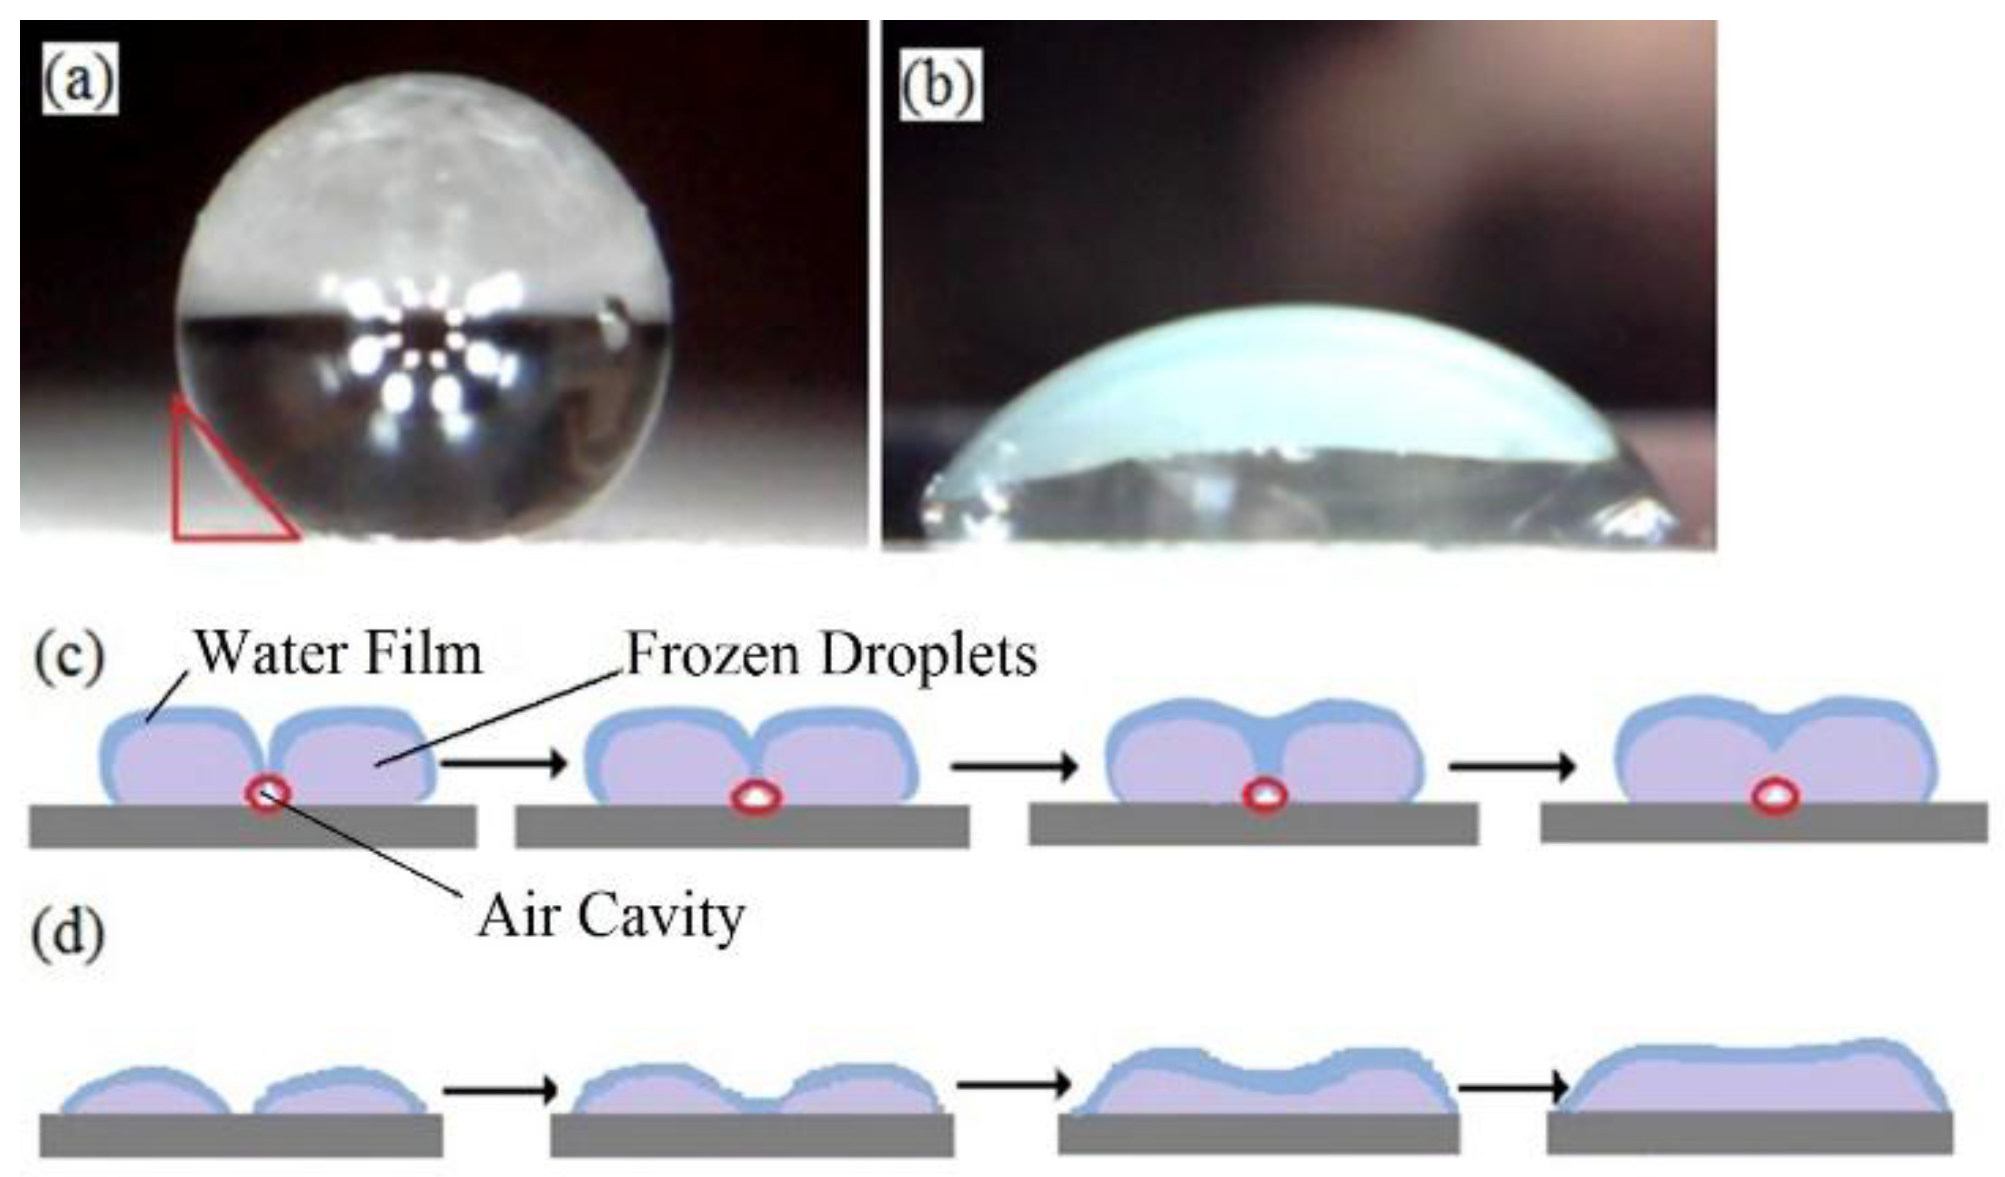
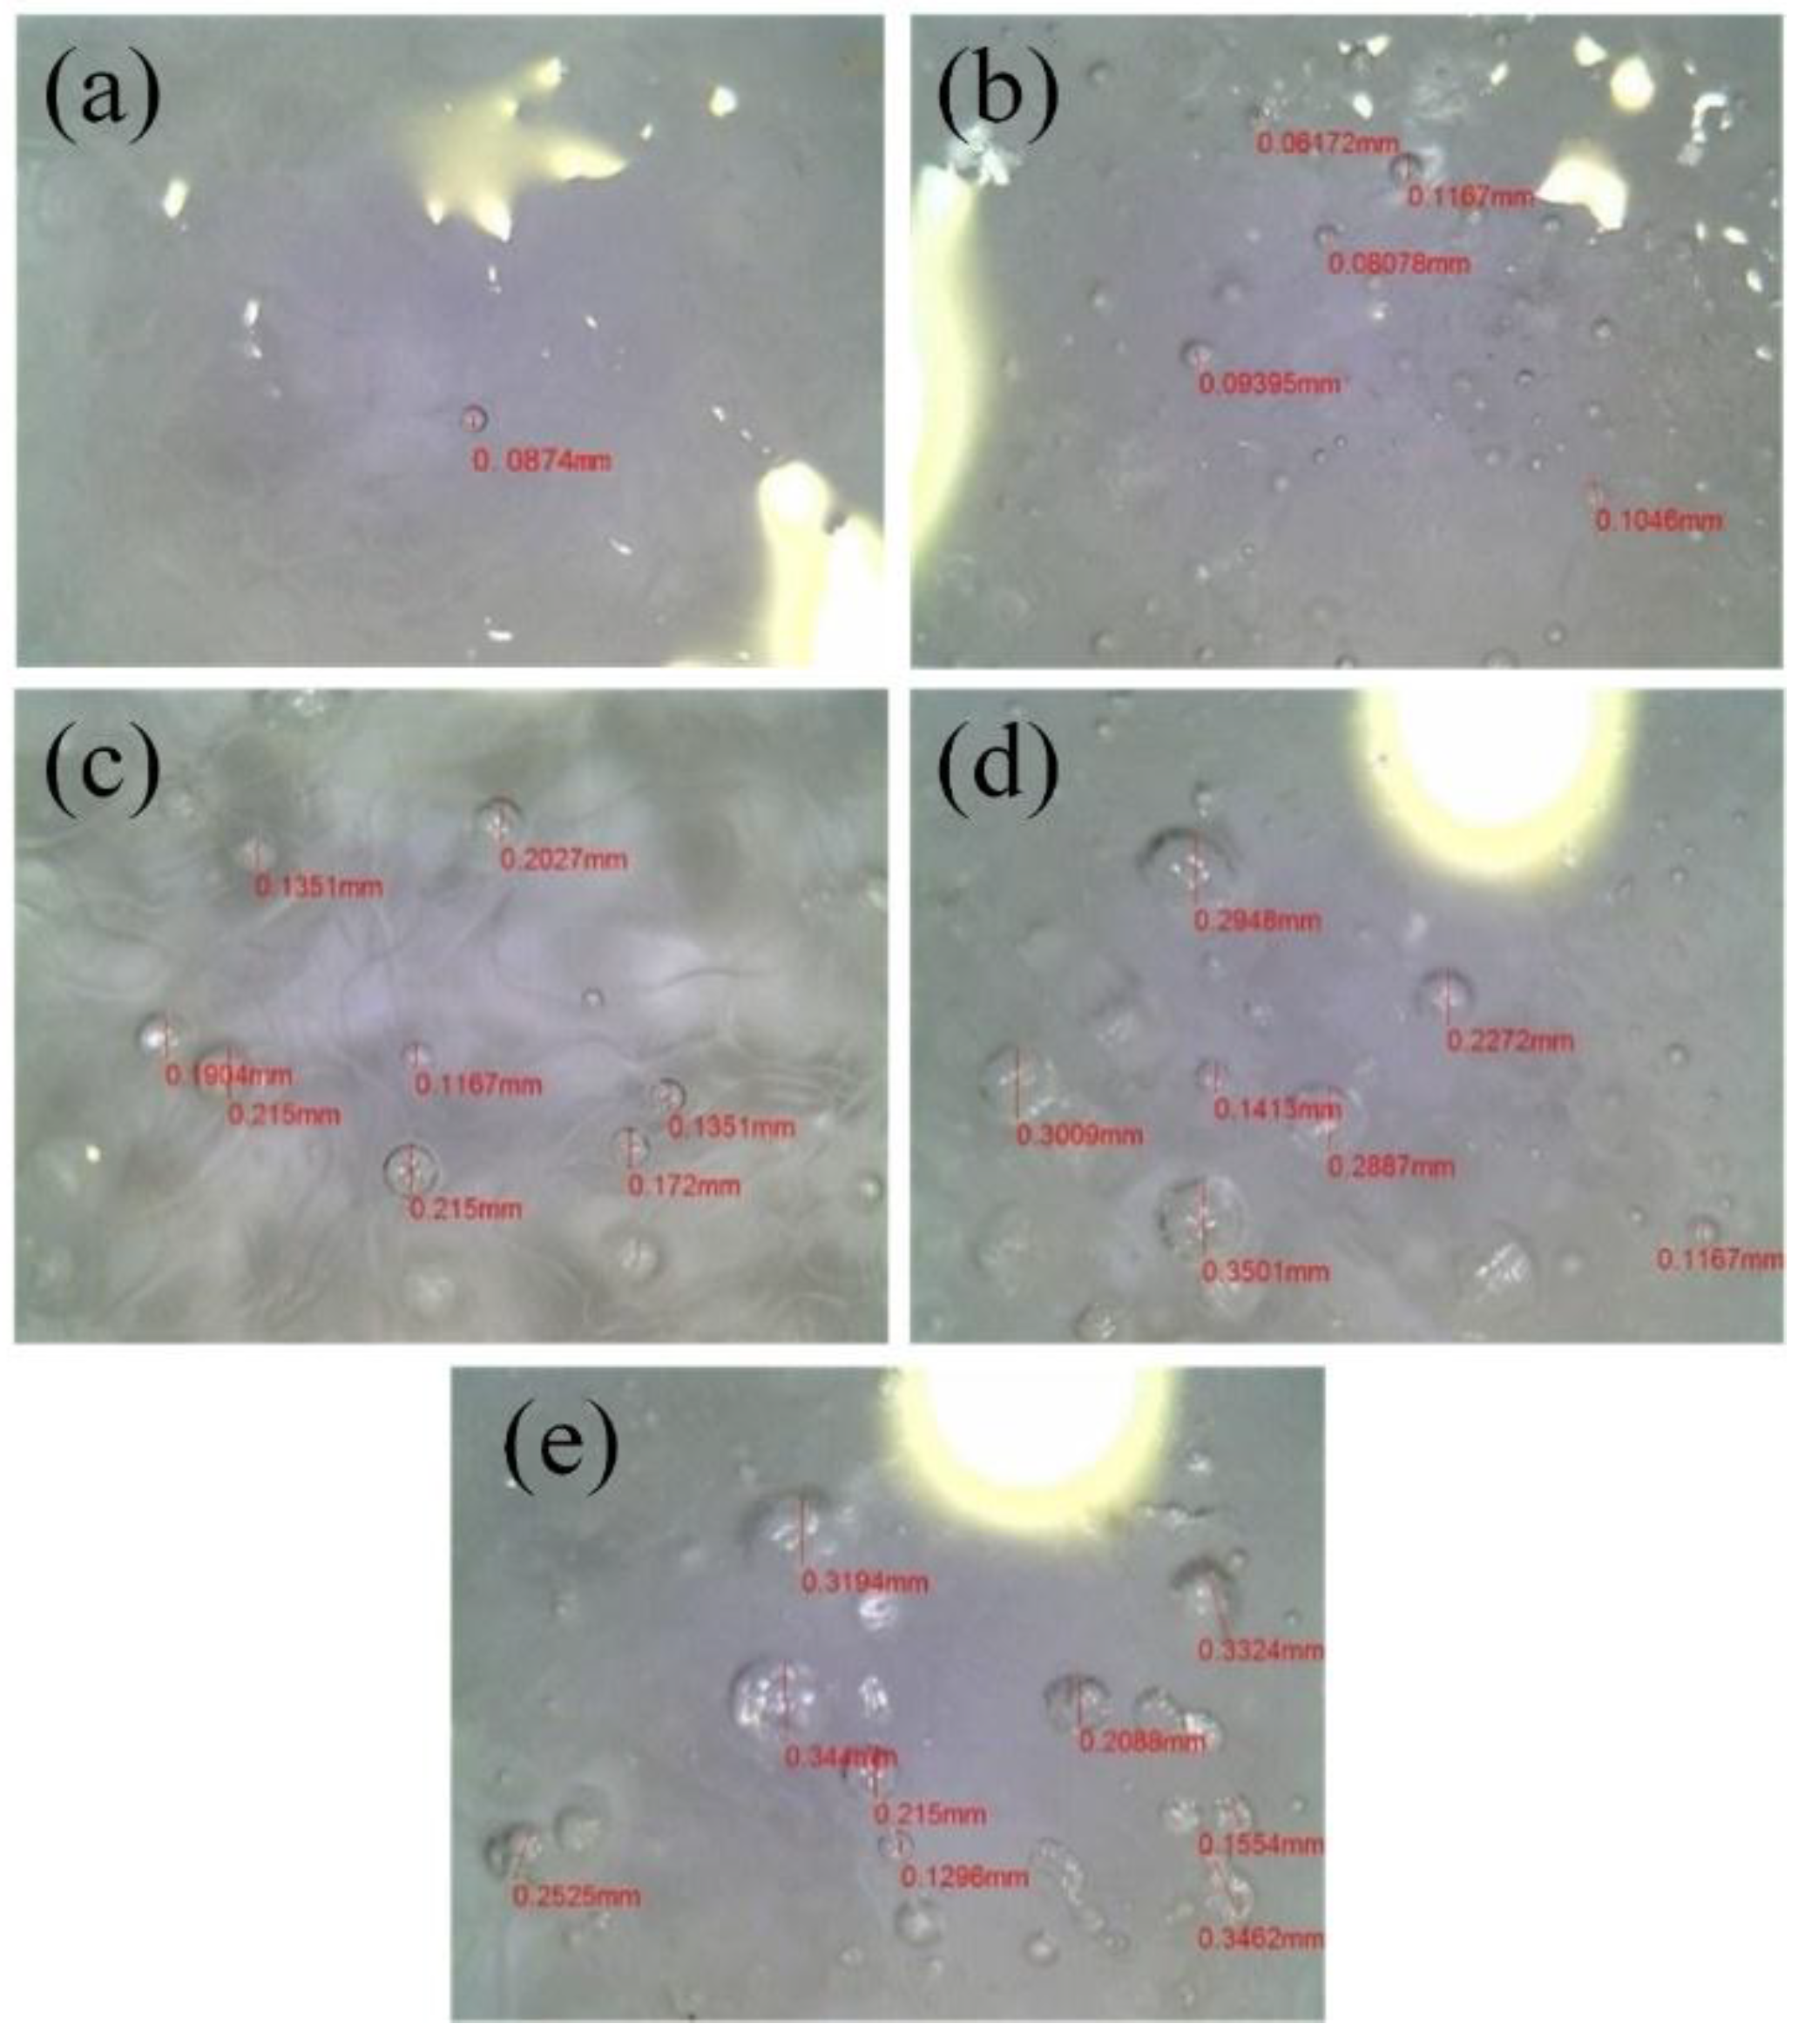
Air gaps formed at the bottom parts of the spherical drops on the superhydrophobic surface, which created grooves and cavities in the ice. The higher the surface of the CA was, the larger the diameters and the quantity of the air cavities were and reduce the ice mass on the blade surface.

Acknowledgments

The authors would like to thank the financial supports provided by the Key Project of Natural Science Foundation of China (No. 51637002) and the National “111” Project of China (B08036).

Author Contributions

Jianlin Hu designed experiments and revised the manuscript. Ke Xu, Binhuan Lan and Wei Meng carried out experiments and analysed the experimental results. Ke Xu and Binhuan Lan wrote the manuscript. Xingliang Jiang and Lichun Shu provided guidance to the experiments and analysis.

Conflicts of Interest

The authors declare no conflict of interest.

References

  1. Kumar, Y.; Ringenberg, J.; Depuru, S.S.; Devabhaktuni, V.K.; Lee, J.W.; Nikolaidis, E.; Andersen, B.; Afjeh, A. Wind energy: Trends and enabling technologies. Renew. Sustain. Energy Rev. 2016, 53, 209–224. [Google Scholar] [CrossRef]
  2. Fortin, G.; Perron, J. Wind Turbine Icing and De-Icing. In Proceedings of the 47th AIAA Aerspace Sciences Meeting Including The New Horizons Forum and Aerospace Exposition, Orlando, FL, USA, 5–8 January 2009; p. 247. [Google Scholar]
  3. Fu, P.; Farzaneh, M. A CFD approach for modeling the rime-ice accretion process on a horizontal-axis wind turbine. J. Wind Eng. Ind. Aerodyn. 2010, 98, 181–188. [Google Scholar] [CrossRef]
  4. Li, Y.; Tagawa, K.; Feng, F.; Li, Q.; He, Q. A wind tunnel experimental study of icing on wind turbine blade airfoil. Energy Convers. Manag. 2014, 85, 591–595. [Google Scholar] [CrossRef]
  5. Homola, M.C.; Virk, M.S.; Wallenius, T.; Nicklasson, P.J.; Sundsbø, P.A. Effect of atmospheric temperature and droplet size variation on ice accretion of wind turbine blades. J. Wind Eng. Ind. Aerodyn. 2010, 98, 724–729. [Google Scholar] [CrossRef]
  6. Tarquini, S.; Antonini, C.; Amirfazli, A.; Marengo, M.; Palacios, J. Investigation of ice shedding properties of superhydrophobic coatings on helicopter blades. Cold Reg. Sci. Technol. 2014, 100, 50–58. [Google Scholar] [CrossRef]
  7. Kulinich, S.A.; Farzaneh, M. Ice adhesion on super-hydrophobic surfaces. Appl. Surf. Sci. 2009, 255, 8153–8157. [Google Scholar] [CrossRef]
  8. Parent, O.; Ilinca, A. Anti-icing and de-icing techniques for wind turbines: Critical review. Cold Reg. Sci. Technol. 2011, 65, 88–96. [Google Scholar] [CrossRef]
  9. Yan, L.; Lu, G.; Liu, J.; Han, Z.; Liu, Z. Fabrication of biomimetic hydrophobic films with corrosion resistance on magnesium alloy by immersion process. Appl. Surf. Sci. 2013, 264, 527–532. [Google Scholar]
  10. Tian, H.; Gao, X.; Yang, T.; Li, D.; Chen, Y. Fabrication and characterization of superhydrophobic silica nanotrees. J. Sol-Gel Sci. Technol. 2008, 48, 277–282. [Google Scholar] [CrossRef]
  11. Chaudhary, G.; Li, R. Freezing of water droplets on solid surfaces: An experimental and numerical study. Exp. Therm. Fluid Sci. 2014, 57, 86–93. [Google Scholar] [CrossRef]
  12. Tavakoli, F.; Kavehpour, P. Cold-induced Spreading of Water Drops on Hydrophobic Surfaces. Langmuir ACS J. Surf. Colloids 2015, 31, 2120–2126. [Google Scholar] [CrossRef] [PubMed]
  13. Farhadi, S.; Farzaneh, M.; Kulinich, S.A. Anti-icing performance of superhydrophobic surfaces. Appl. Surf. Sci. 2011, 257, 6264–6269. [Google Scholar] [CrossRef]
  14. Alizadeh, A.; Yamada, M.; Li, R.; Shang, W.; Otta, S.; Zhong, S.; Ge, L.; Dhinojwala, A.; Conway, K.R.; Bahadur, V. Dynamics of ice nucleation on water repellent surfaces. Langmuir ACS J. Surf. Colloids 2012, 28, 3180–3186. [Google Scholar] [CrossRef] [PubMed]
  15. Zhang, P.; Lv, F.Y. A review of the recent advances in superhydrophobic surfaces and the emerging energy-related applications. Energy 2015, 82, 1068–1087. [Google Scholar] [CrossRef]
  16. Emelyanenko, A.M.; Boinovich, L.B.; Bezdomnikov, A.A.; Chulkova, E.V.; Emelyanenko, K.A. Reinforced superhydrophobic coating on silicone rubber for longstanding anti-icing performance in severe conditions. ACS Appl. Mater. Interfaces 2017, 9, 24210–24219. [Google Scholar] [CrossRef] [PubMed]
  17. Liu, J.; Huang, W.; Xing, Y.; Li, R.; Dai, J. Preparation of durable superhydrophobic surface by sol–gel method with water glass and citric acid. J. Sol-Gel Sci. Technol. 2011, 58, 18–23. [Google Scholar] [CrossRef]
  18. Li, J.; Zhao, Z.; Zhang, Y.; Xiang, B.; Tang, X.; She, H. Facile fabrication of superhydrophobic silica coatings with excellent corrosion resistance and liquid marbles. J. Sol-Gel Sci. Technol. 2016, 80, 208–214. [Google Scholar] [CrossRef]
  19. Peng, C.; Xing, S.; Yuan, Z.; Xiao, J.; Wang, C.; Zeng, J. Preparation and anti-icing of superhydrophobic PVDF coating on a wind turbine blade. Appl. Surf. Sci. 2012, 259, 764–768. [Google Scholar] [CrossRef]
  20. Antonini, C.; Innocenti, M.; Horn, T.; Marengo, M.; Amirfazli, A. Understanding the effect of superhydrophobic coatings on energy reduction in anti-icing systems. Cold Reg. Sci. Technol. 2011, 67, 58–67. [Google Scholar] [CrossRef]
  21. Jiang, X.; Ma, J.; Zhang, Z.; Hu, J. Effect of hydrophobicity coating on insulator icing and DC flashover performance of iced insulators. IEEE Trans. Dielectr. Electr. Insul. 2010, 17, 351–359. [Google Scholar] [CrossRef]
  22. Huang, L.; Liu, Z.; Liu, Y.; Gou, Y.; Wang, L. Effect of contact angle on water droplet freezing process on a cold flat surface. Exp. Therm. Fluid Sci. 2012, 40, 74–80. [Google Scholar] [CrossRef]
  23. Jellinek, H.H.G. Ice Adhesion. Can. J. Phys. 1962, 40, 1294–1309. [Google Scholar] [CrossRef]
Figure 1. Wind blade test section.
Coatings 08 00151 g001
Figure 2. Schematic of the test wind tunnel.
Coatings 08 00151 g002
Figure 3. Arrangement of wind blade samples in the wind tunnel.
Coatings 08 00151 g003
Figure 4. Ice mass of blade samples under Conditions 1–5.
Coatings 08 00151 g004
Figure 5. Ice mass of blade samples under Conditions 3, 6, and 7.
Coatings 08 00151 g005
Figure 6. Force analysis for droplets on blade surfaces, (a) AOA = −10°, (b) AOA = +10°.
Coatings 08 00151 g006
Figure 7. Ice morphology on blade sample under various conditions.
Coatings 08 00151 g007
Figure 8. Morphology and convergence process of droplets on C0 and C4 surfaces: (a) water drop on C4; (b) water drop on C0; (c) convergence process of water drops on C4; (d) convergence process of water drops on C0.
Coatings 08 00151 g008
Figure 9. Comparison of air cavities in the ice layers of different blade surfaces: (a) C0; (b) C1; (c) C2; (d) C3; (e) C4.
Coatings 08 00151 g009
Table 1. Static contact angle (CA) and contact angle hysteresis (CAH) of the coating samples.
Sample No.CA (°)CAH (°)
C1111 ± 1.633.1 ± 2.8
C2131 ± 1.927.5 ± 3.7
C3150 ± 1.720.7 ± 3.5
C4154 ± 0.98.5 ± 2.1
Table 2. Icing conditions for ice-accumulation tests on wind blade samples. AOA = angle of attack.
Temperature (°C)Freezing Water Flux (L/h·m2)Wind Speed (m/s)AOA (°)
Condition 1−6 ± 1~8040
Condition 2−6 ± 1~8060
Condition 3−6 ± 1~8080
Condition 4−6 ± 1~80100
Condition 5−6 ± 1~80120
Condition 6−6 ± 1~808−10
Condition 7−6 ± 1~80810
Table 3. The ice mass of C0–C5 under Conditions 1–5.
Wind Velocity
v (m/s)
Ice Mass
C0C1C2C3C4
x ¯ SD x ¯ SD x ¯ SD x ¯ SD x ¯ SD
4679.991.9691.187.7606.874.3527.049.4445.647.2
6793.092.5784.789.2696.684.3569.090.8491.381.0
8917.7164.6889.2126.0784.177.5699.1108.5580.575.7
101004.5175.9974.4156.3878.3130.2807.212.7747.1129.4
121067.6112.71025.775.0938.354.0864.465.8812.469.0
Table 4. The ice mass of C0–C5 under Conditions 3, 6, and 7.
AOA (°)Ice Mass
C0C1C2C3C4
x ¯ SD x ¯ SD x ¯ SD x ¯ SD x ¯ SD
−101030.2193.9990.9200.9830.5240.2764.3109.2748.594.7
0917.7164.6889.2126.0784.177.5699.1108.5580.575.7
10867.2165.3856.2103.8687.5119.6579.3104.8524.979.5

