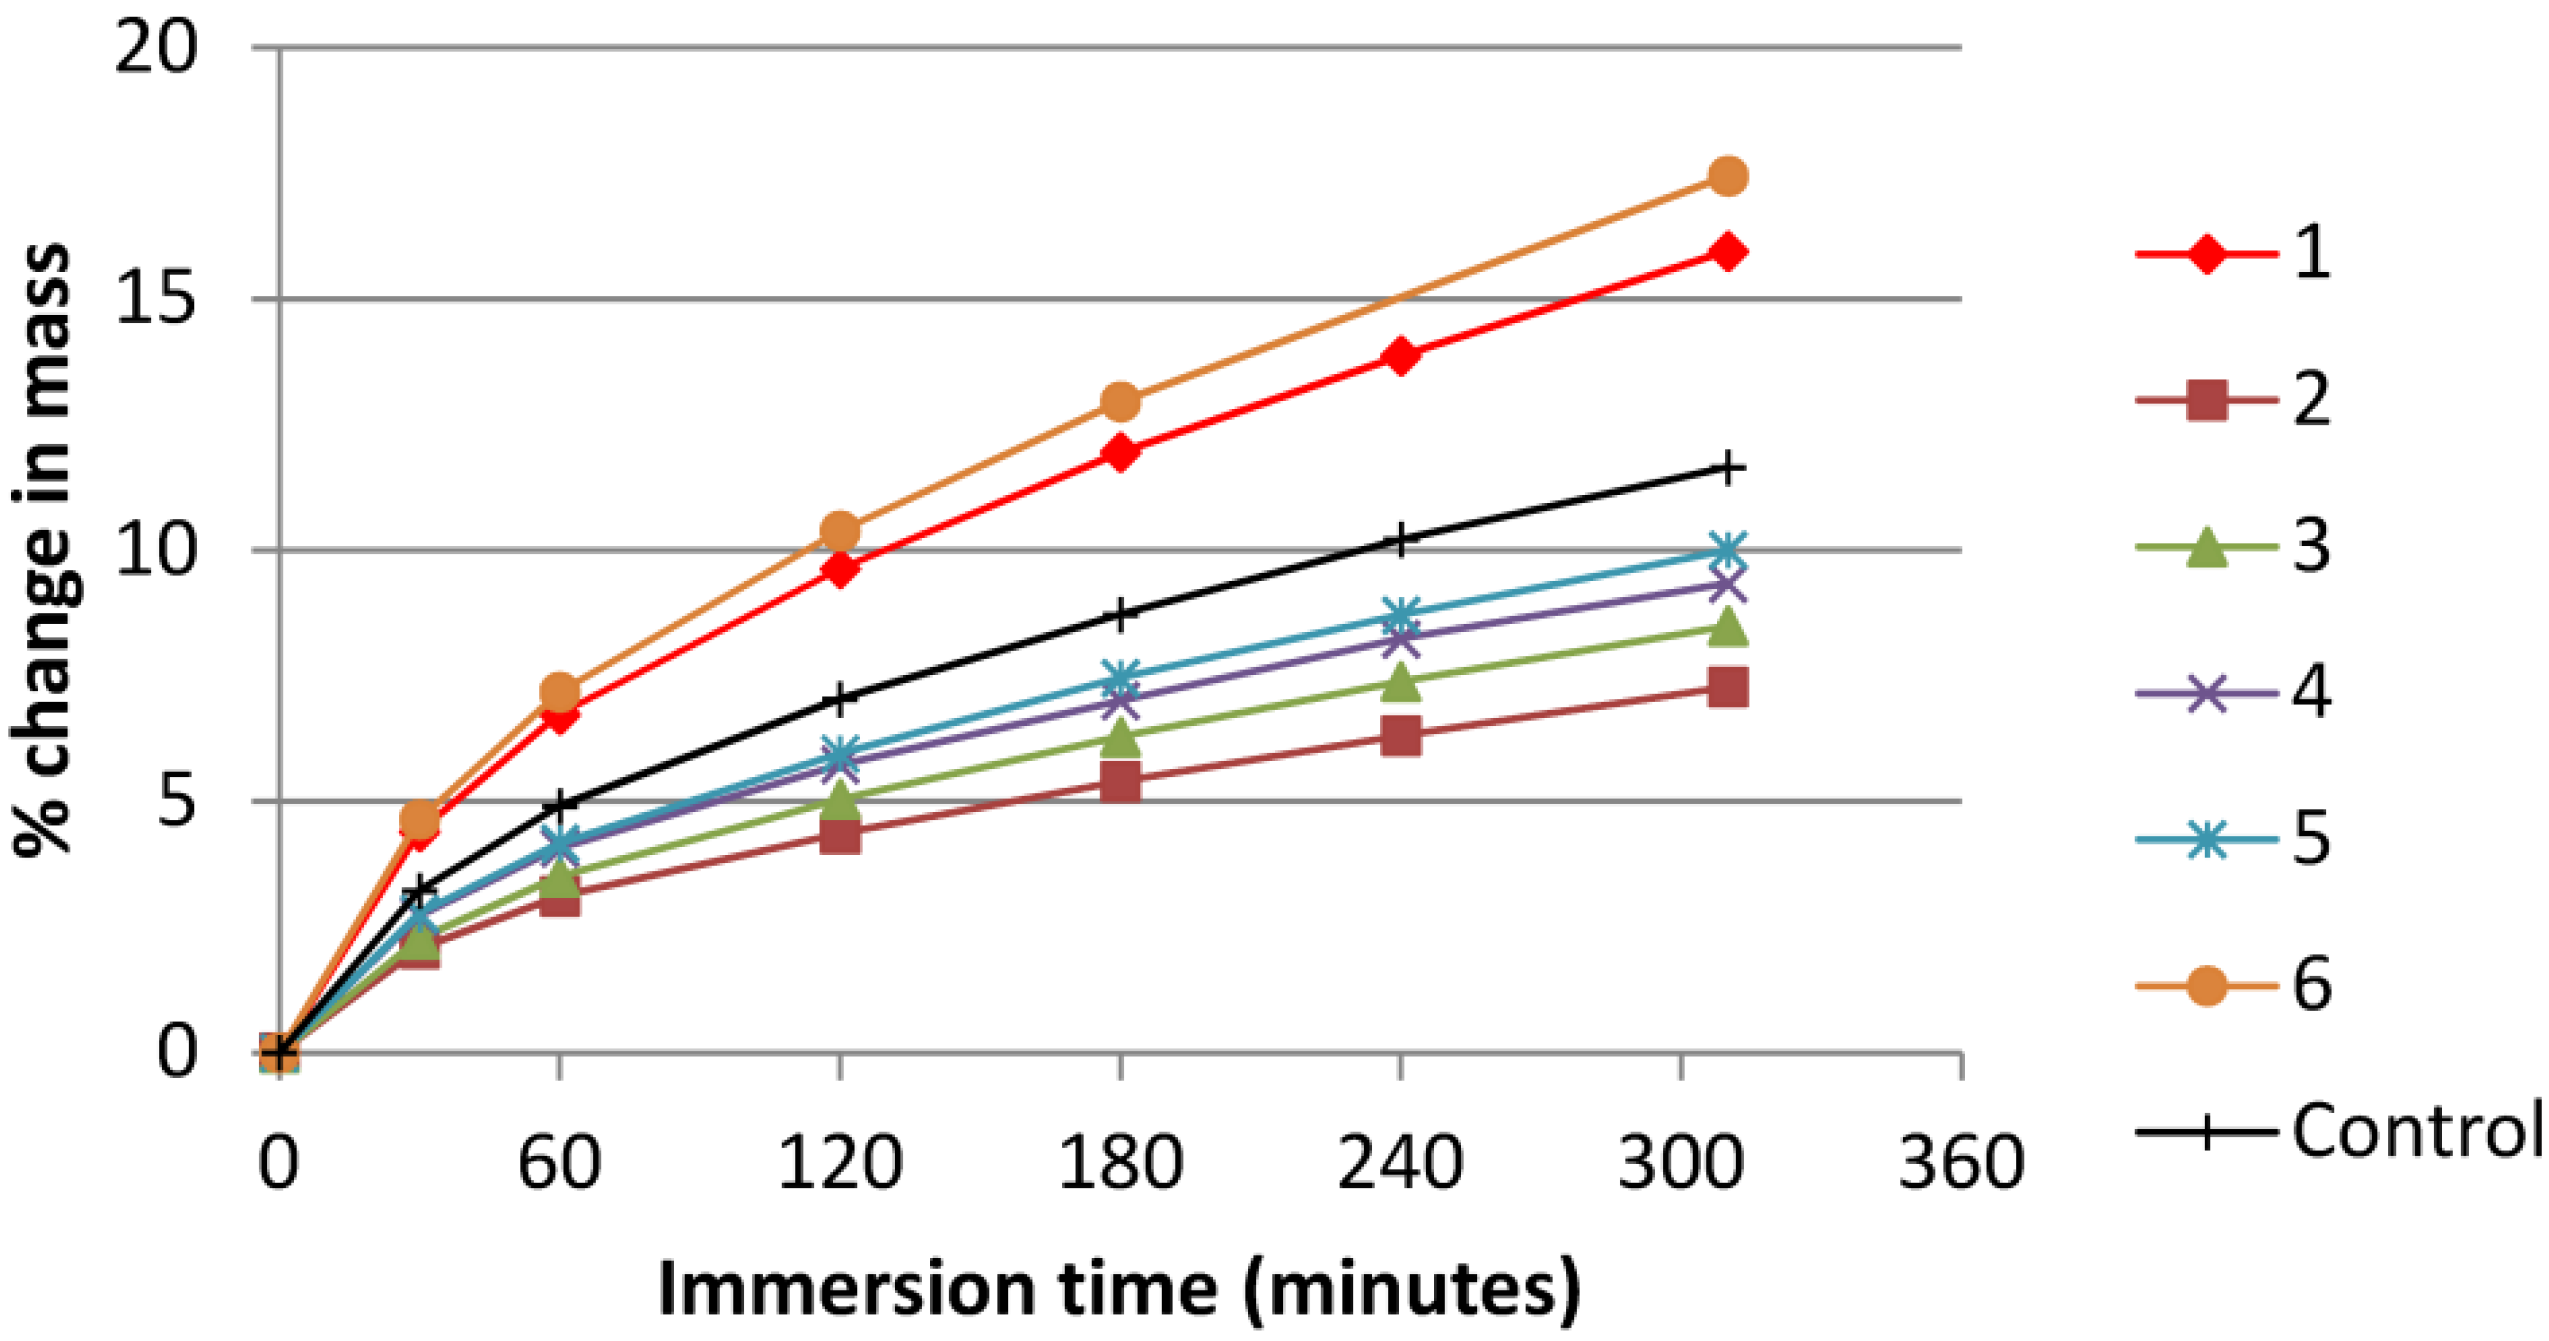
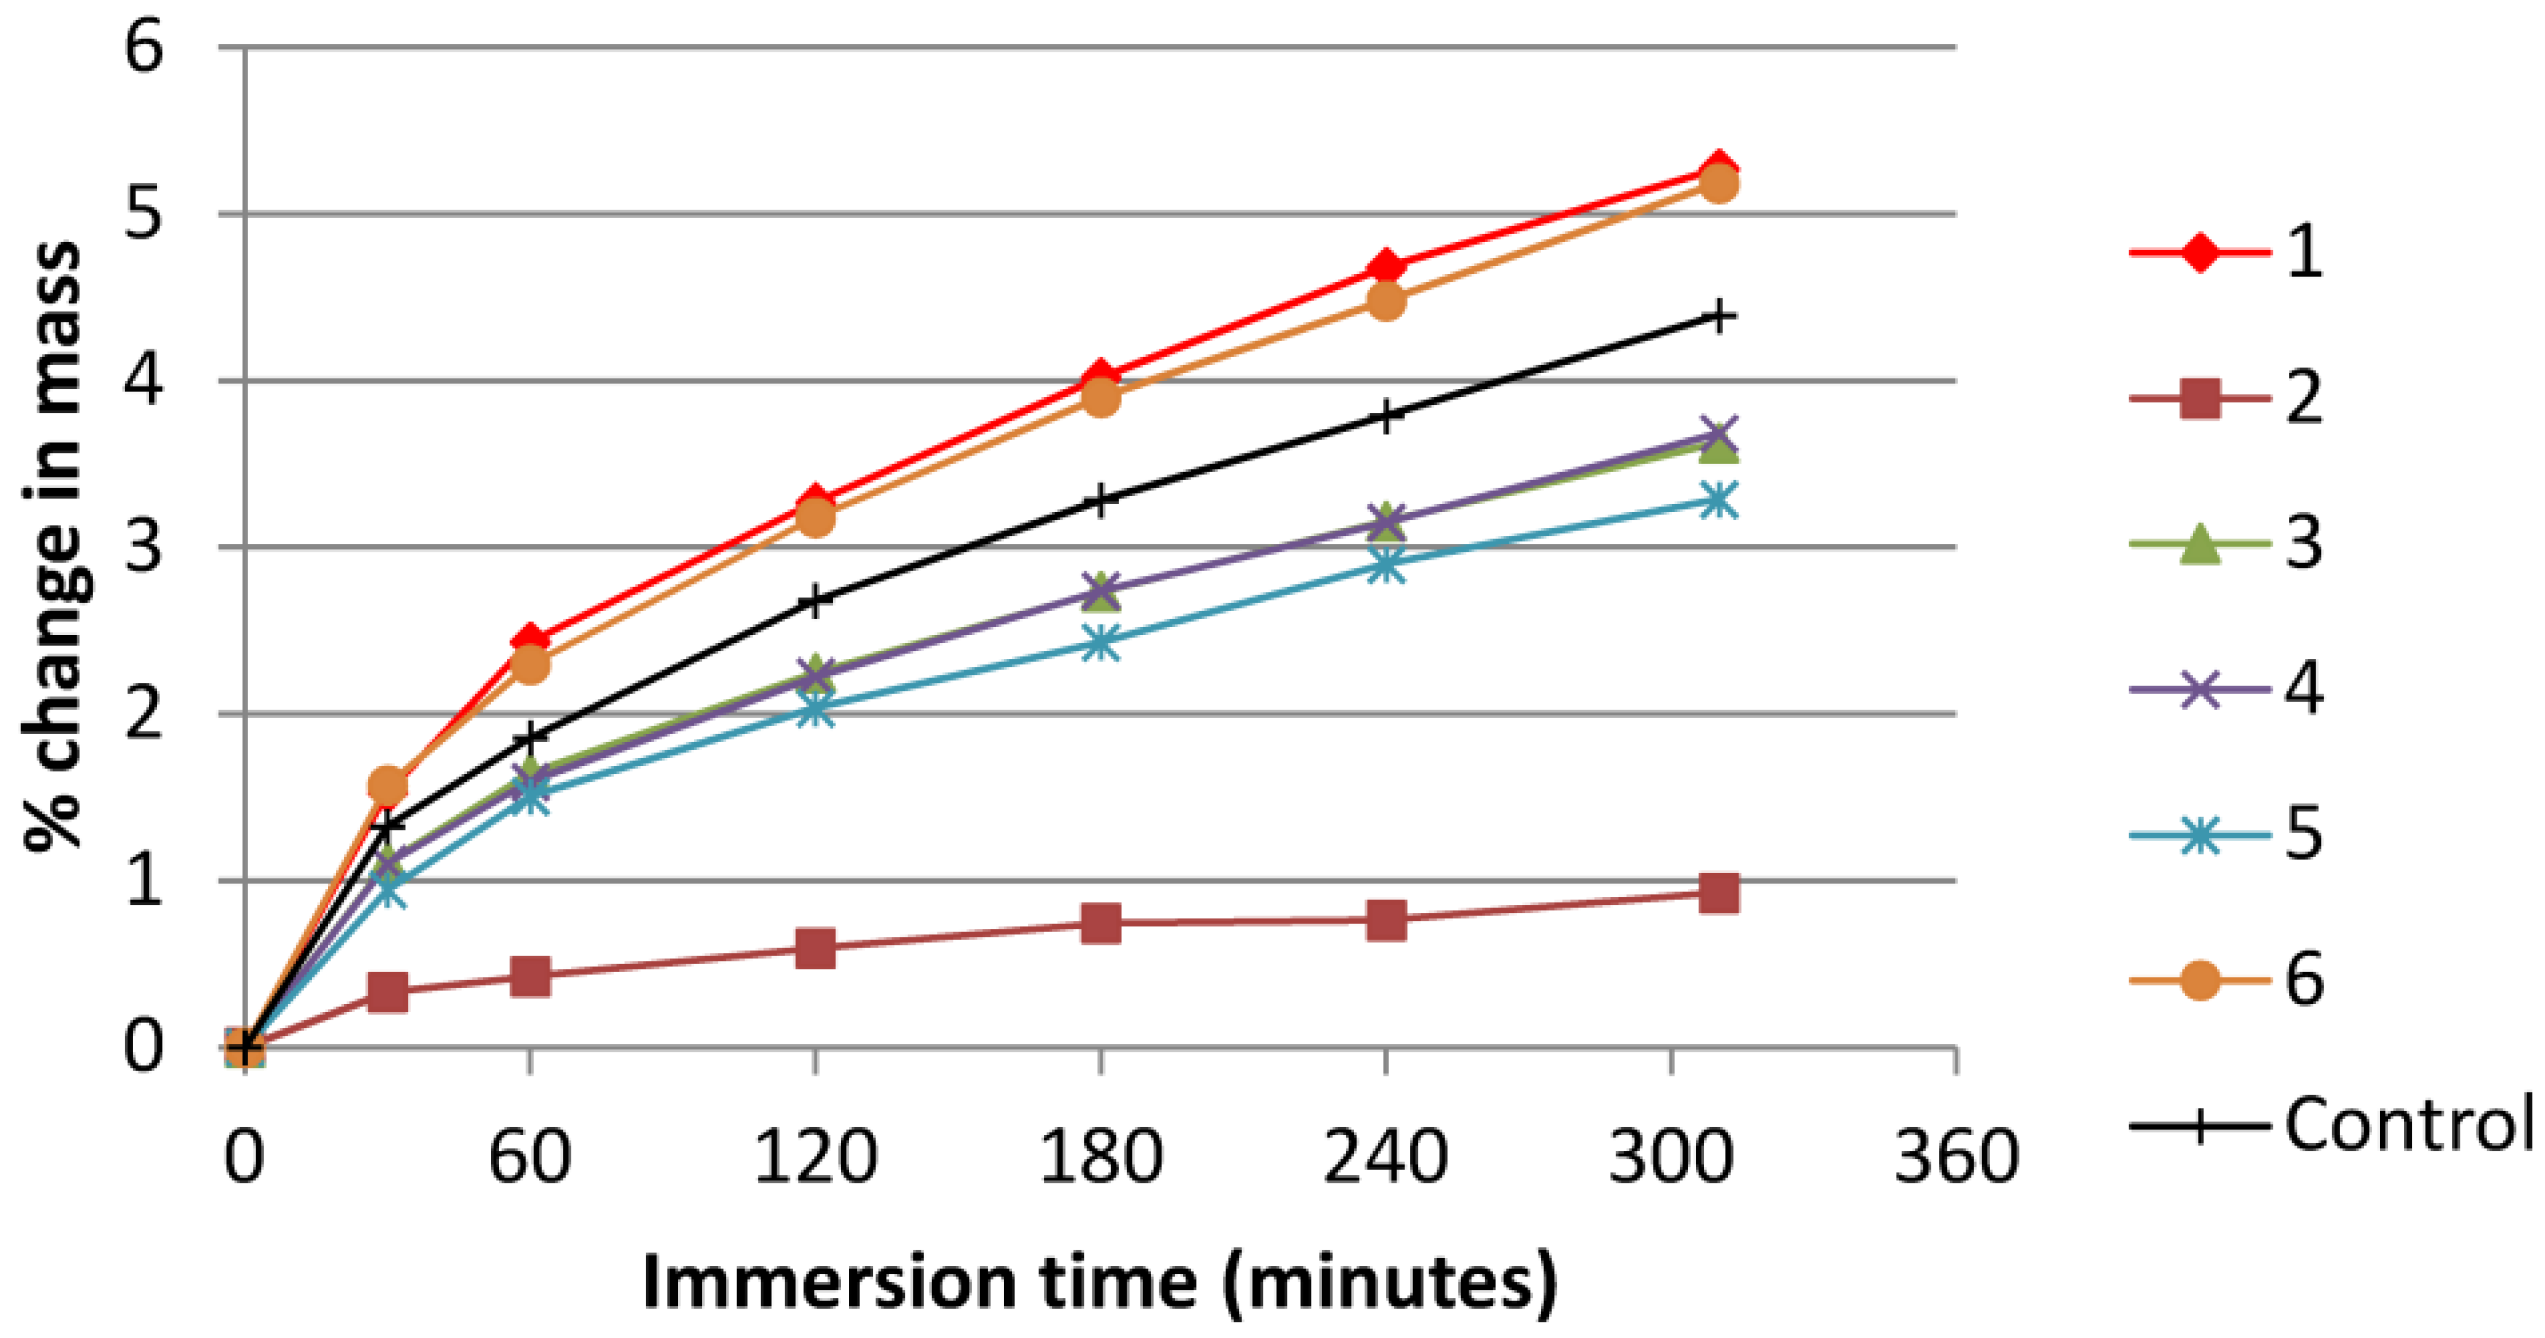
3.1. Solvent Absorption by Squeegees
The solvent absorption of the squeegee materials is shown in terms of the percentage change in mass [100 × (Mass−Original mass)/Original mass] for carbon ink and silver ink solvents in
Figure 5 and
Figure 6 respectively.
For all squeegees, there was a substantial difference in solvent absorption between the different solvents; overall there was on average 3.4 times more mass of ethylene glycol diacetate absorbed than the solvent blend used in the carbon ink over a given time period. The rate of solvent uptake was fastest at the onset of immersion but remained reasonably stable between one and five hours after immersion. The squeegees kept absorbing solvent throughout the duration of the experiment, even when quite substantial amounts of solvent (up to 17% mass increase) were absorbed. Squeegee 2 gave the lowest amount of solvent absorption of all the squeegees and was particularly resistant to absorption of the solvent blend used in the carbon ink; increasing in mass by less than 1% after five hours immersion. The greatest solvent uptake was observed in Squeegees 1 and 6, followed by the control squeegee. The remaining squeegees (3, 4 and 5) were broadly similar and displayed intermediate absorption levels between those of the control squeegee and Squeegee 2. The levels of solvent uptake were higher than what would be observed during printing due to the immersive nature of the test, use of neat solvent, test duration and small specimen size. However, the test illustrates the wide range of responses of the different squeegees as well as the continual absorption of solvent over time.
For most of the squeegees there appeared to be a trend of increasing solvent uptake as the Shore A hardness decreased. However, Squeegee 1 showed higher levels of solvent absorption compared with squeegees of the same hardness while Squeegee 2 showed lower levels of absorption.
Figure 5.
Percentage change in squeegee mass during immersion in solvent blend used in carbon (wear) ink.
Figure 5.
Percentage change in squeegee mass during immersion in solvent blend used in carbon (wear) ink.
Figure 6.
Percentage change in squeegee mass during immersion in ethylene glycol diacetate used in silver (print) ink.
Figure 6.
Percentage change in squeegee mass during immersion in ethylene glycol diacetate used in silver (print) ink.
3.3. Deflection of Squeegees
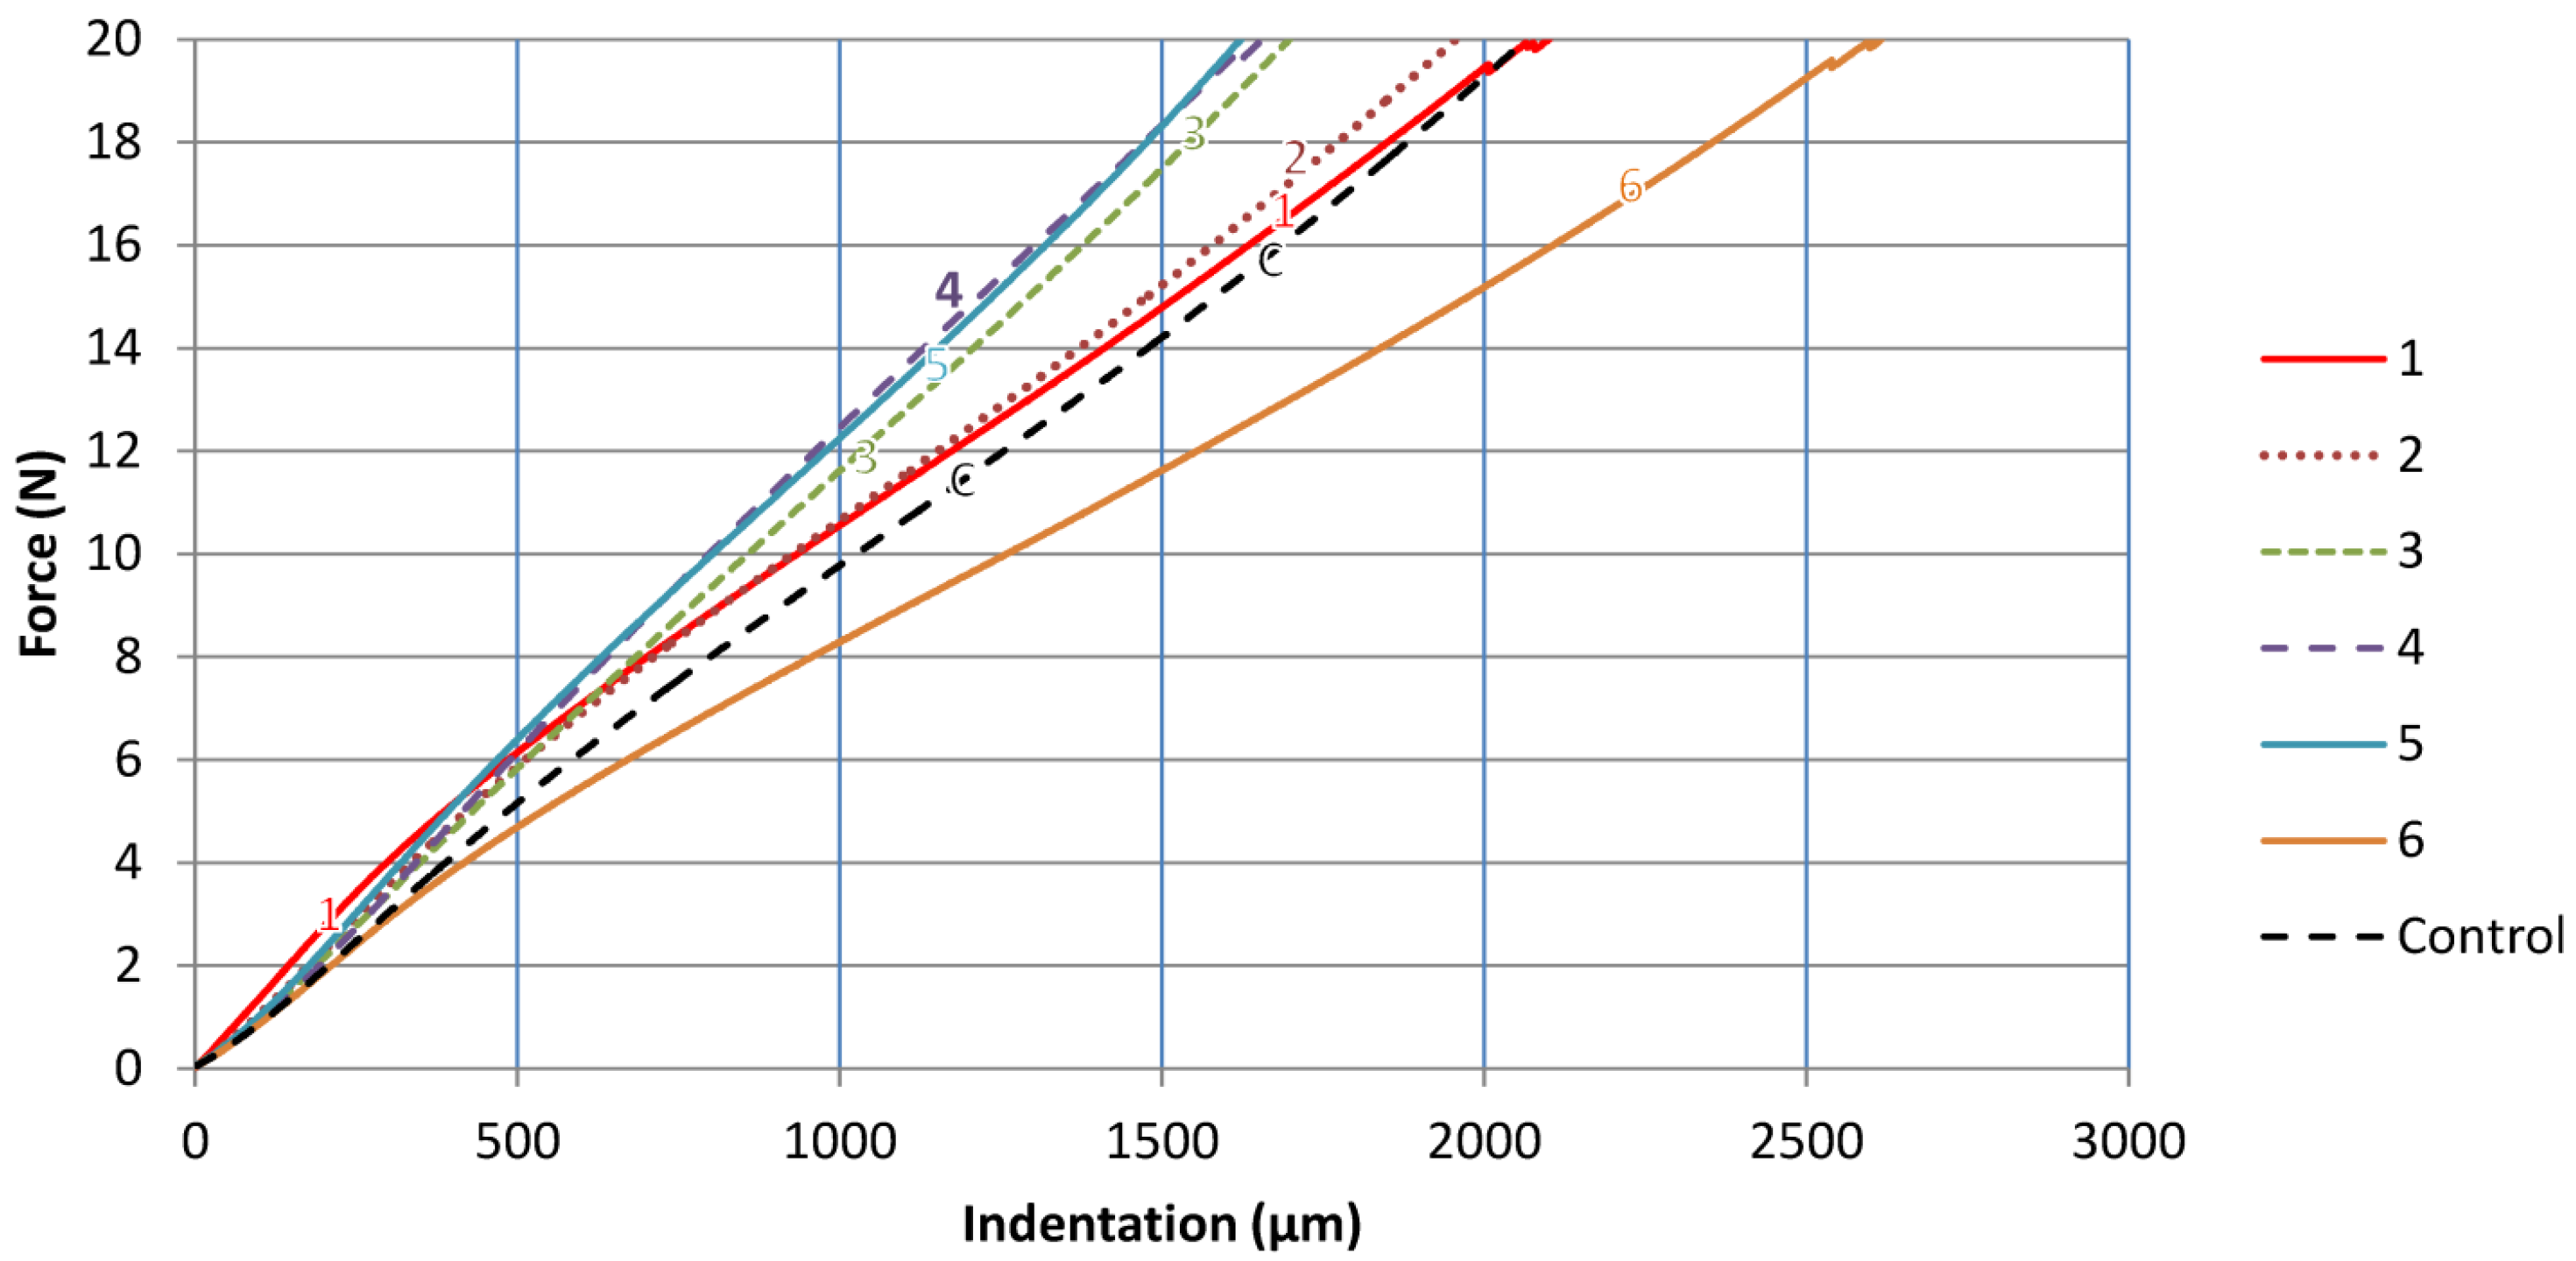
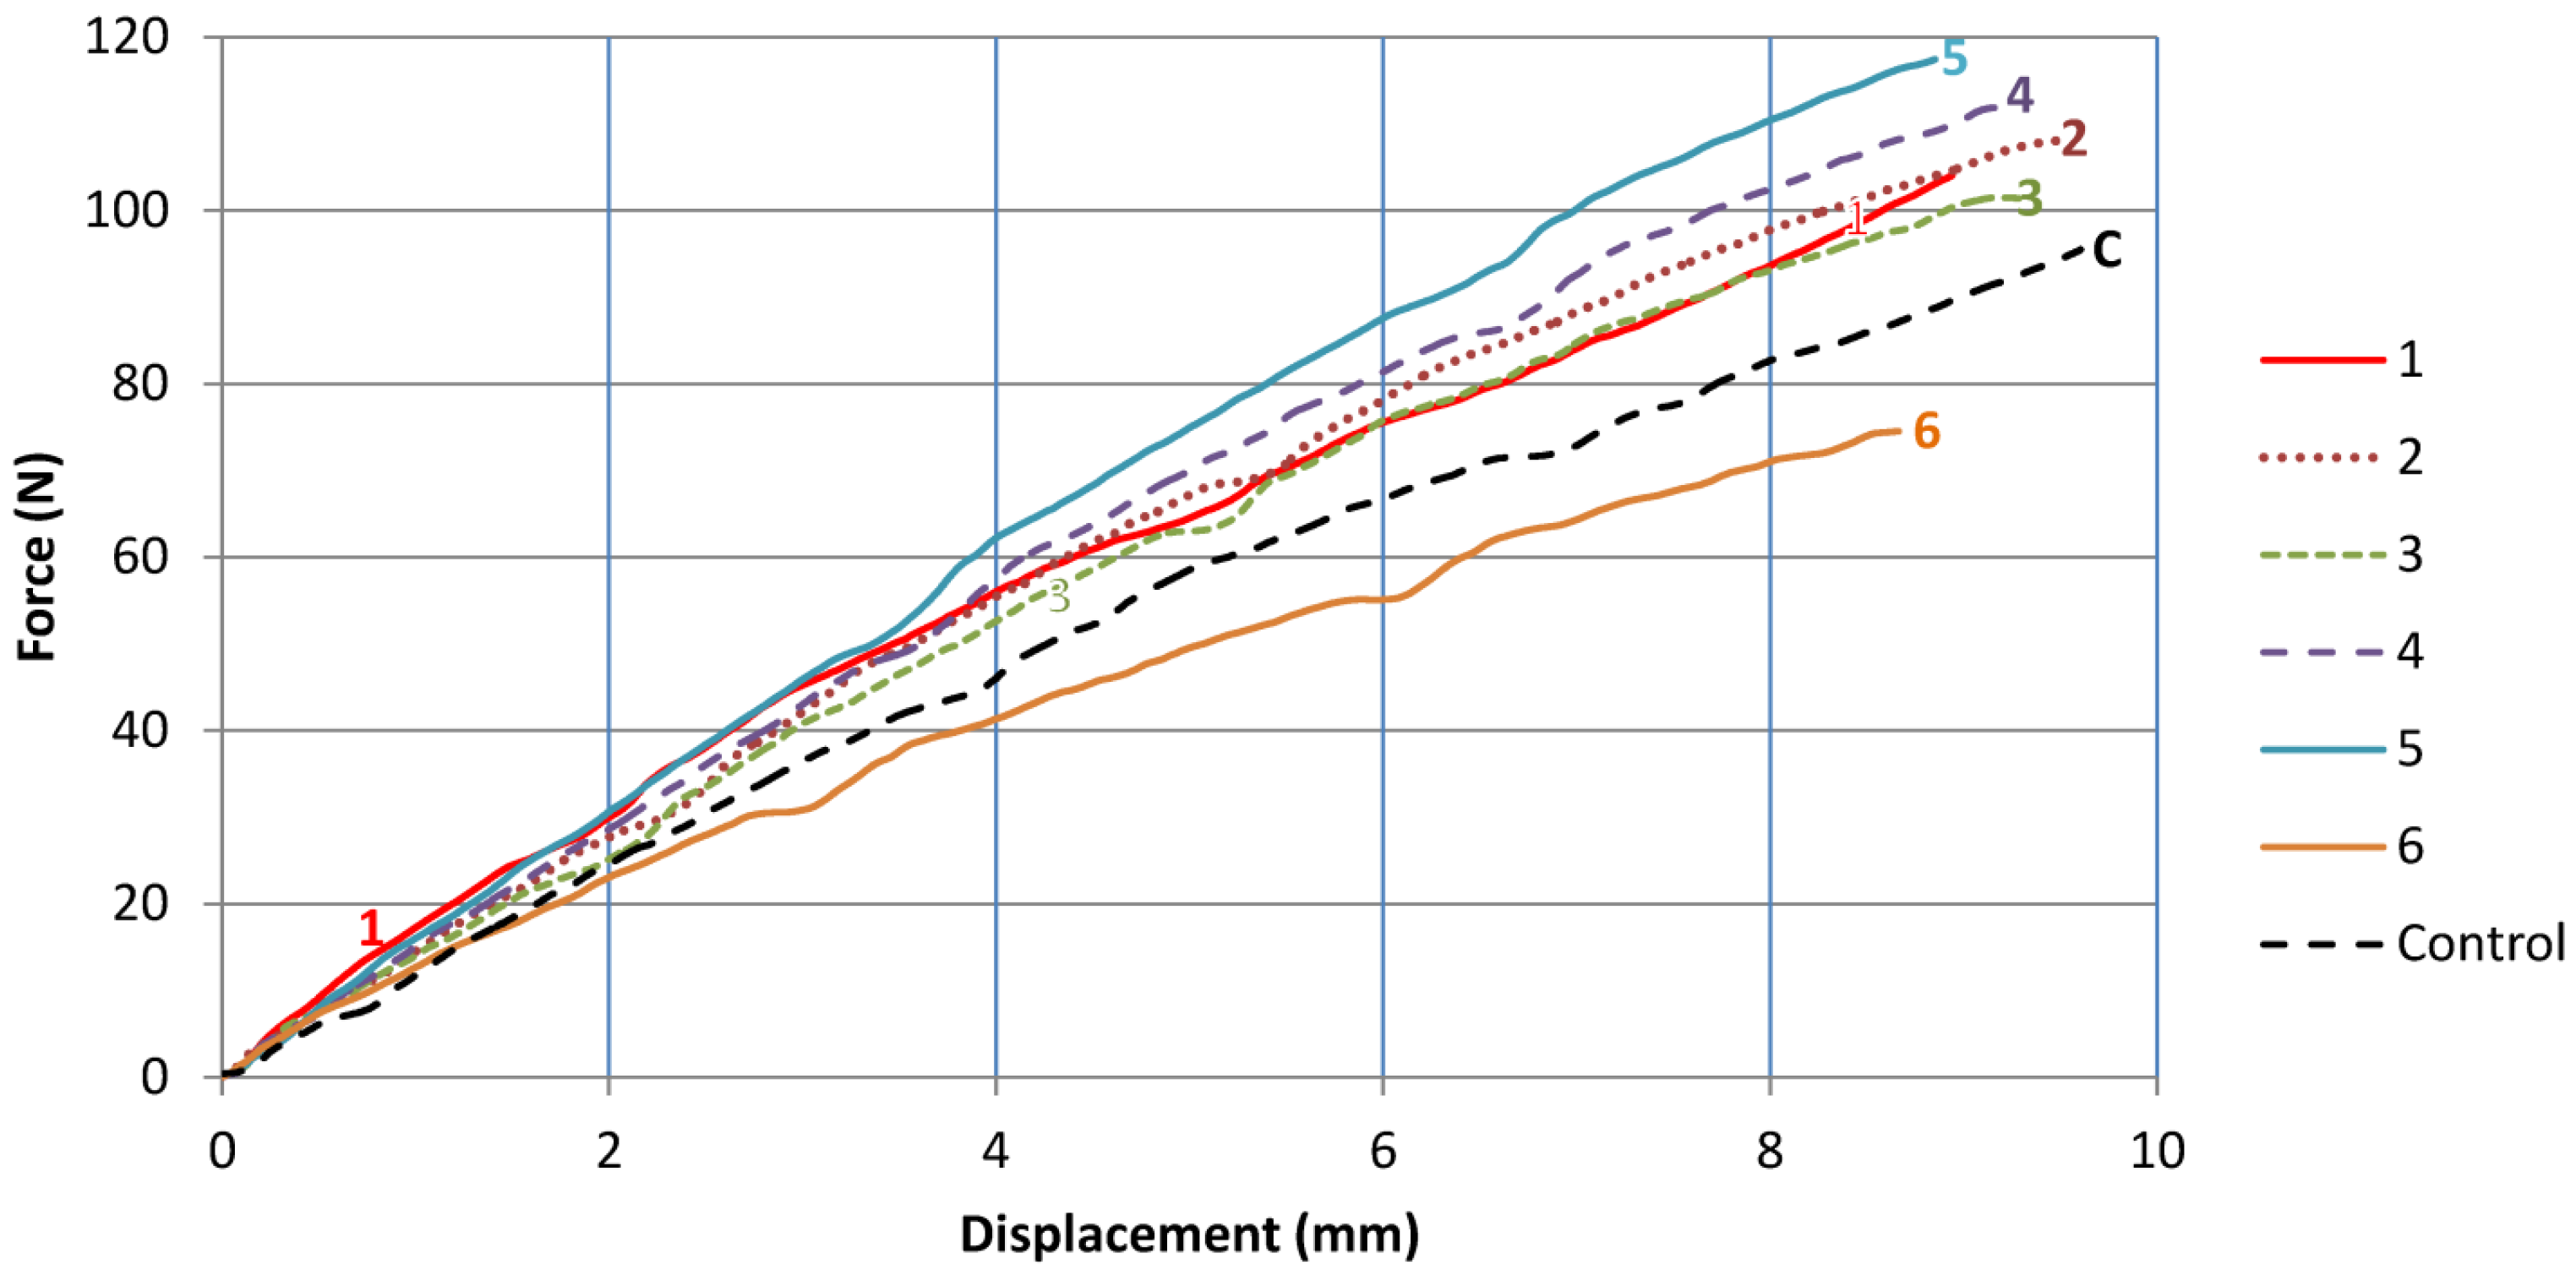
The relationship between squeegee deflection and force is shown in
Figure 8. The data shown is the average of five measurements (reading one was discarded). As the squeegee is deflected, progressively more force is required to increase the bending angle. The force response was not smooth due to occasional slip at the contact between the squeegee and the supporting rods. The data suggests that at large amounts of deflection, Squeegee 5 was the most resilient to bending, followed by 4, 2, 1 and 3, the control squeegee and finally Squeegee 6. However, when looking at smaller levels of deflection, which are more representative of screen printing, Squeegee 1 appeared to be the most resistant to bending. This has parallels with the observations made in the indentation testing, and there is a good correlation between the indentation produced at 5 N with the force required to deflect the squeegee to 3 mm (approximately 8°). Likewise there is a correlation at higher forces; and the correlation between Shore A hardness and deflection improves at higher amounts of deflection. This suggests that Shore A hardness is a more suitable indicator for squeegee behavior when under high deflection. However, behavior under low deflection, or indentation force, cannot always be inferred from Shore A hardness data. This is particularly true of Squeegee 1, which shows higher comparative hardness at low indentation than at higher indentations.
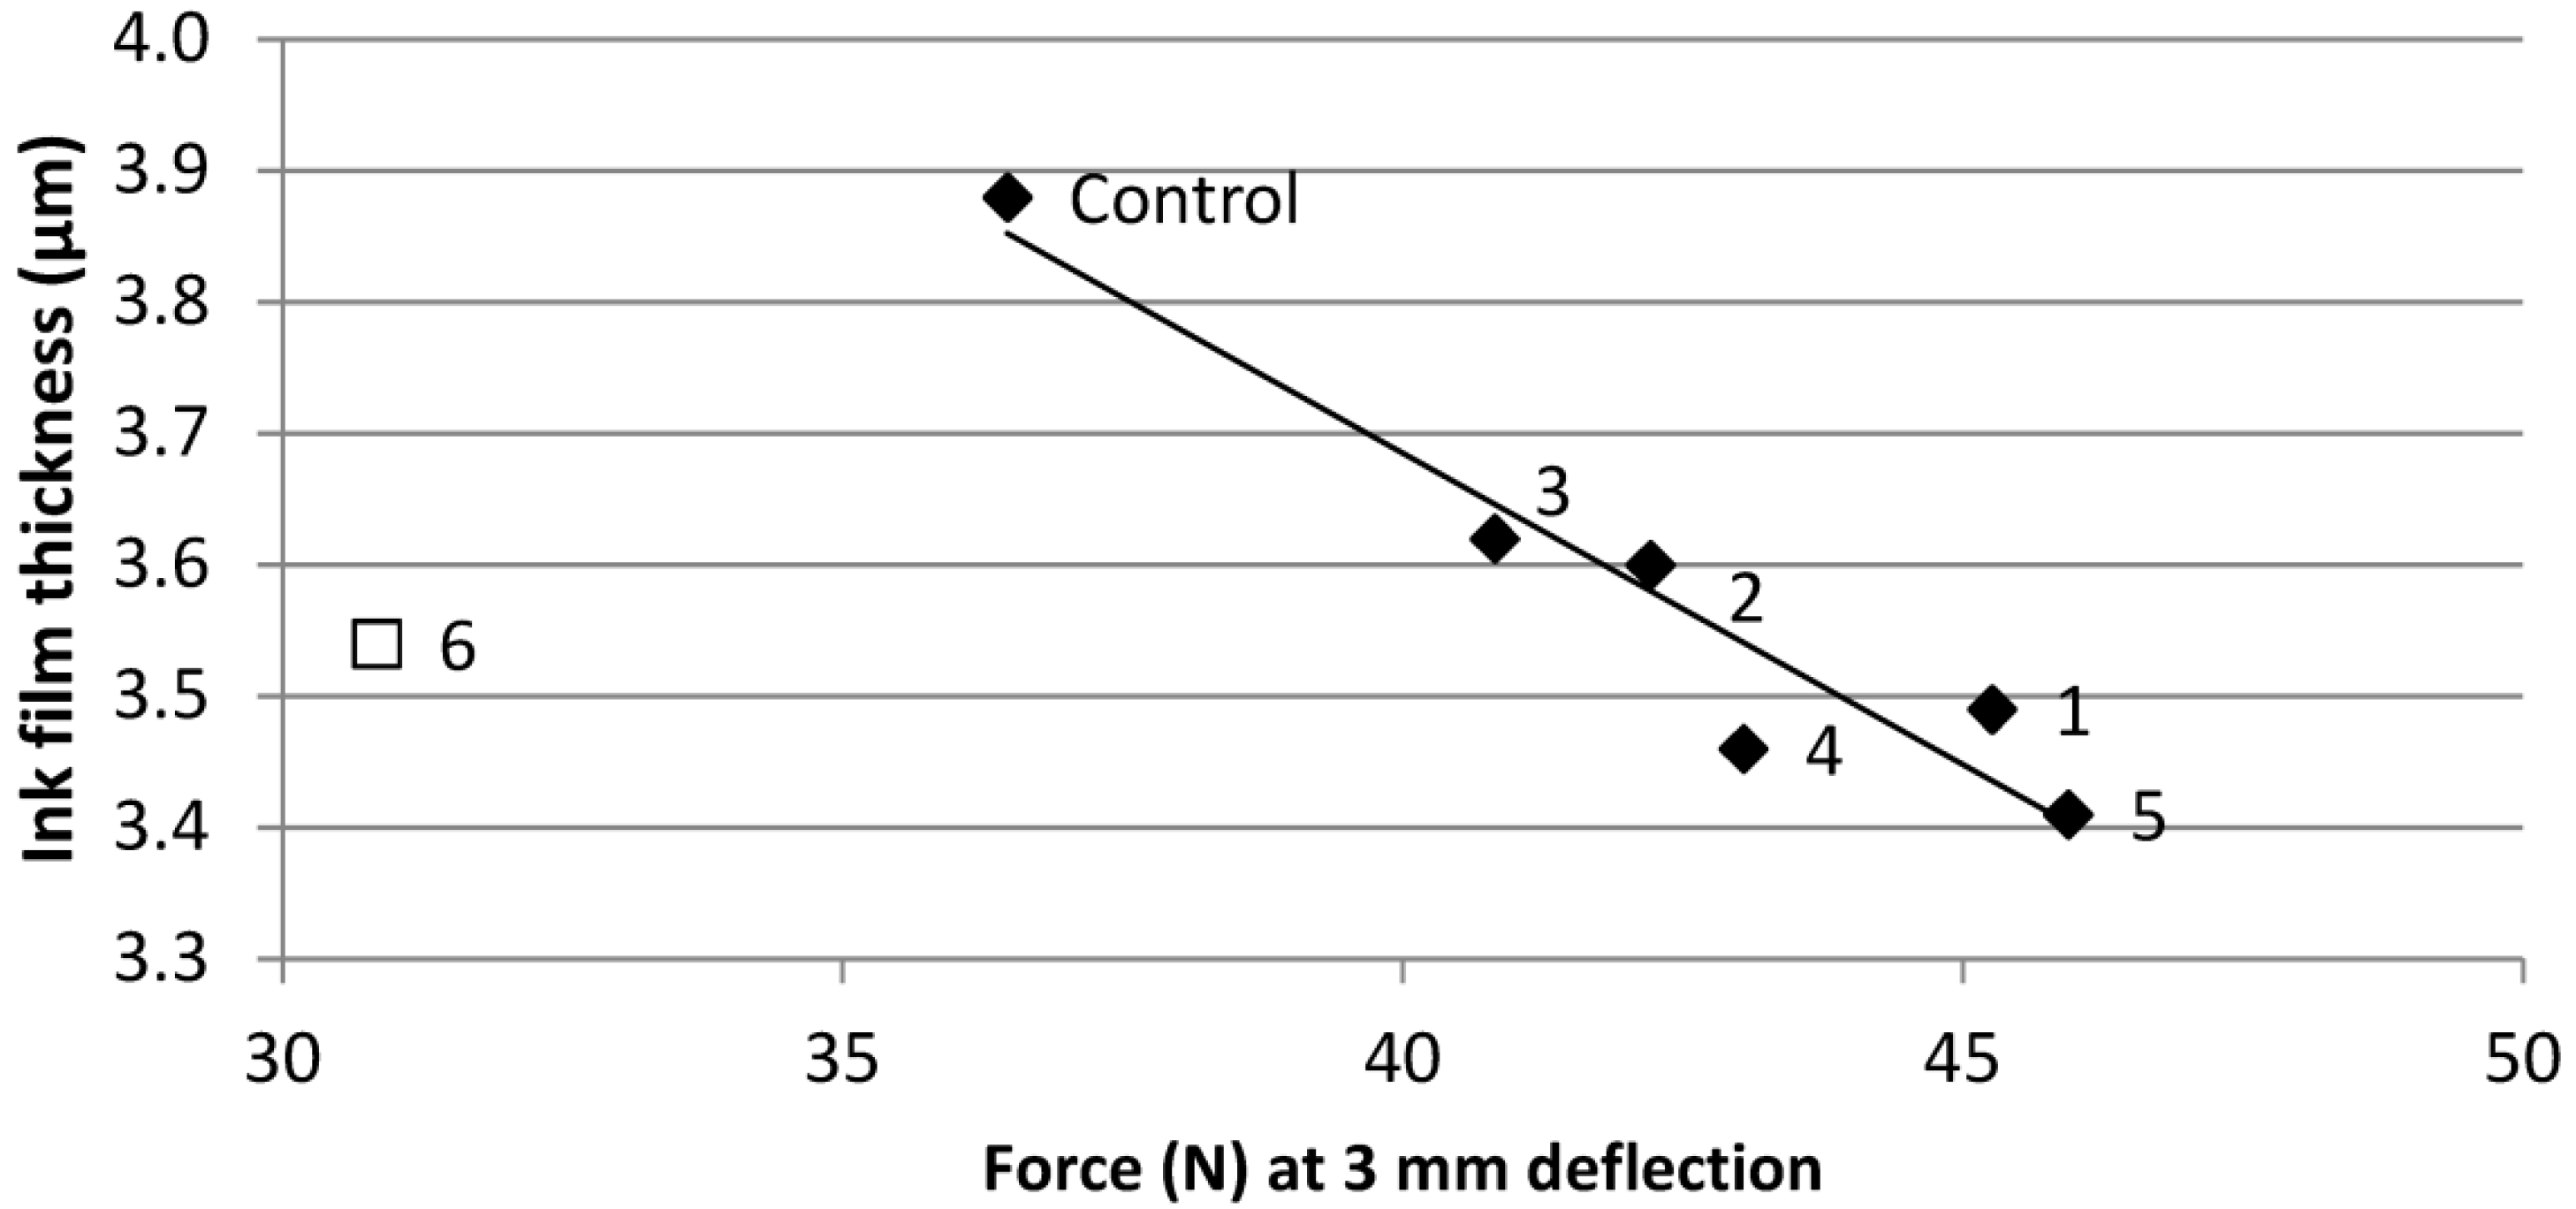
The data from squeegee testing was compared with ink film thickness data from the print tests for unworn squeegees (print methods detailed in
Table 3, ink film thickness data in
Table 6). The optimum predictor of ink thickness was found to be the force measured at 3 mm squeegee deflection. With the exception of Squeegee 6, there was a general pattern of increasing ink deposition with decreasing resistance to deflection (
Figure 9). This is due to the squeegee exerting a greater pressure on the screen and being forced in to the open areas of the mesh. Excluding Squeegee 6 there was an
R2 value of 0.92, indicating a good correlation. When considering indentation force, again with the exception of Squeegee 6, there was a general pattern of increasing ink deposition with decreasing resistance to indentation. The correlation was less effective with an
R2 value of 0.77 at an indentation force of 5 N. Finally, Shore A hardness gave the worst correlation with ink film thickness with an
R2 value of 0.47. Squeegee 1 did not fit the pattern when Shore A was used, for reasons outlined previously, which further demonstrates that Shore A hardness cannot necessarily reflect the behavior of a squeegee during printing. Analogous to selecting a softer squeegee, the softening of squeegees by solvent absorption has been shown to cause increased ink deposition [
14]. This should increase over time as the squeegee progressively absorbs solvent.
Figure 8.
Force vs. deflection tool displacement for squeegees.
Figure 8.
Force vs. deflection tool displacement for squeegees.
Figure 9.
Ink film thickness vs. force required to deflect squeegee (R2 0.92 when Squeegee 6 not included).
Figure 9.
Ink film thickness vs. force required to deflect squeegee (R2 0.92 when Squeegee 6 not included).
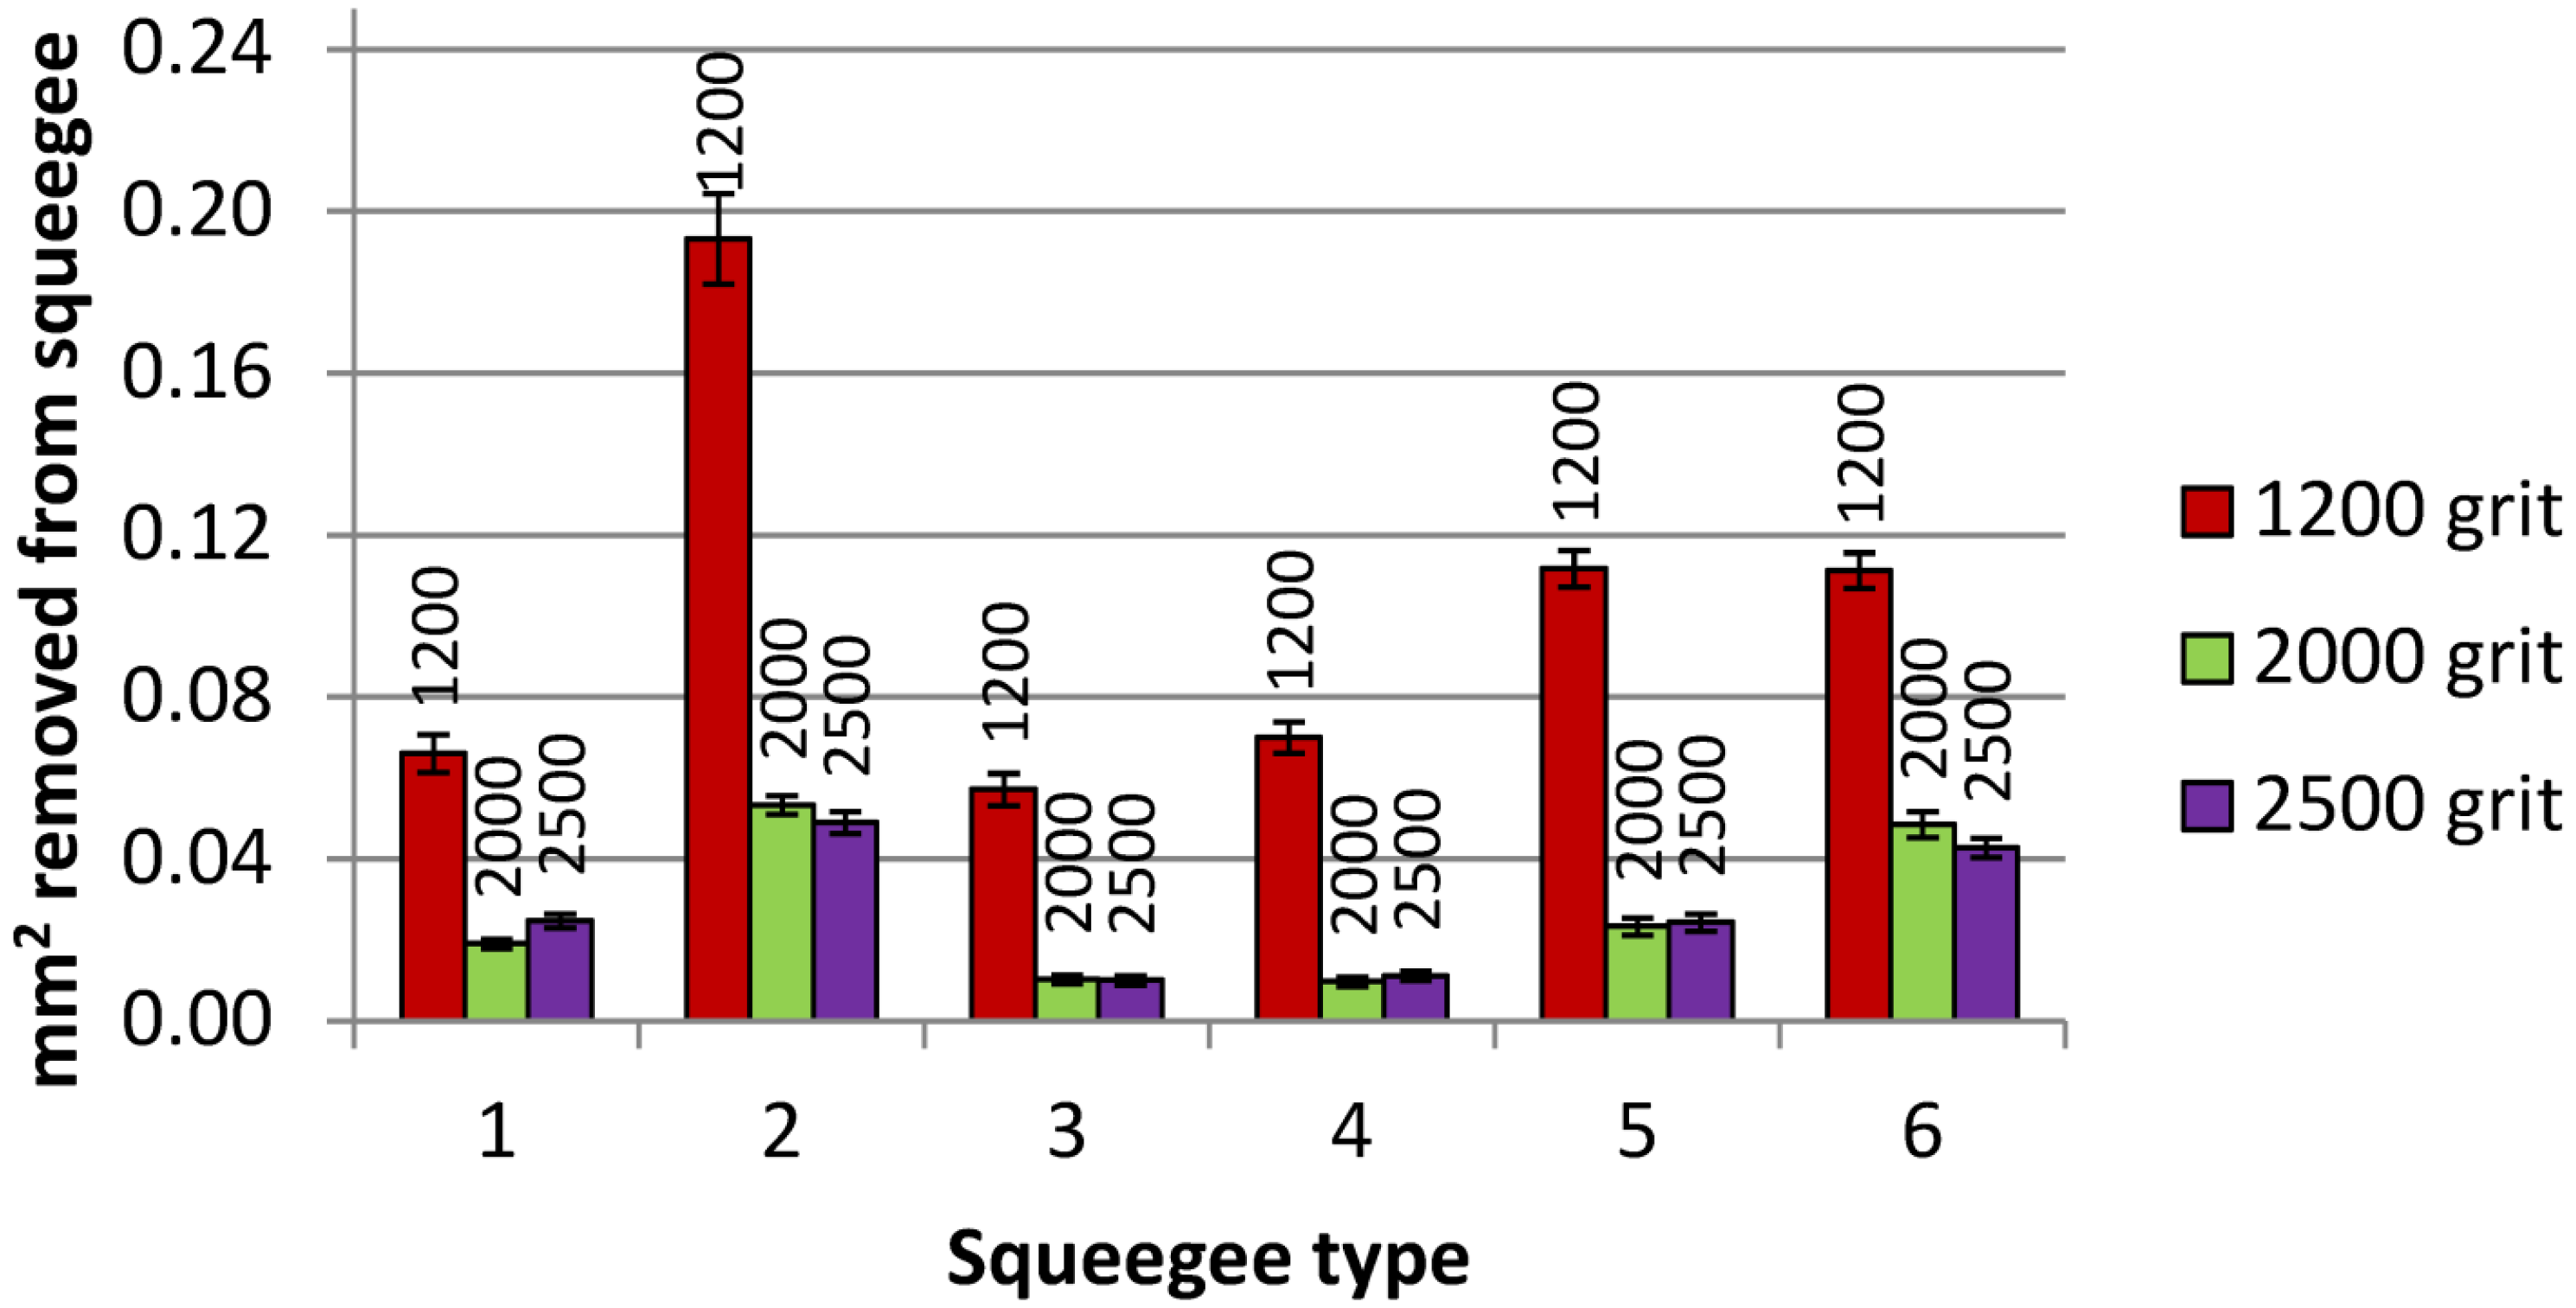
3.4. Squeegee Wear
The amount of wear, in terms of cross-sectional area removed from the squeegee and wear angle, is shown for the three wear bands (1200, 2000 and 2500) and for each squeegee in
Table 5. The squeegee removal is also shown graphically in
Figure 10. The roughest abrasive (1200 grit) gave the highest amount of wear, while the less rough papers (2000 and 2500 grit) gave less wear but were fairly similar to each other. For the roughest abrasive (1200 grit), the lowest amount of wear was observed in Squeegee 3, followed by 1 and 4, though all three were broadly similar with between 0.057 and 0.070 mm
2 removed. Squeegees 6 and 5 gave more wear than 1, 3 and 4, and performed similarly with 0.111 and 0.112 mm
2 removed. The most wear was observed in Squeegee 2 with 0.193 mm
2 removed; significantly more than any of the other squeegees. For the 2000 grit abrasive, Squeegees 3 and 4 gave the least wear, followed by 1, 5, 6 and finally 2. For the 2500 grit abrasive, Squeegee 3 gave the least wear, followed by 4, 5, 1, 6 and finally 2. For both 2000 and 2500 abrasives, Squeegees 2 and 6 gave substantially more wear than Squeegees 1, 3, 4 and 5. Overall, across all the abrasive types, the least wear was observed in Squeegee 3. Squeegees 2 and 6 were inferior to the other squeegees in terms of their resistance to wear.
Table 5.
Squeegee cross-sectional area removed and wear angle after 50 wear cycles with different silicon carbide abrasives. Standard deviation shown in parentheses.
Table 5.
Squeegee cross-sectional area removed and wear angle after 50 wear cycles with different silicon carbide abrasives. Standard deviation shown in parentheses.
| Squeegee Number | Removal (mm2) | Wear Angle (°) | Removal (mm2) | Wear Angle (°) | Removal (mm2) | Wear Angle (°) |
|---|
| 1200 grit | 2000 grit | 2500 grit |
|---|
| 1 | 0.066 (0.005) | 49.3 | 0.019 (0.001) | 51.9 | 0.025 (0.002) | 53.7 |
| 2 | 0.193 (0.011) | 44.4 | 0.053 (0.002) | 43.2 | 0.049 (0.003) | 43.8 |
| 3 | 0.057 (0.004) | 46.2 | 0.010 (0.001) | 46.4 | 0.010 (0.001) | 46.2 |
| 4 | 0.070 (0.004) | 48.3 | 0.010 (0.001) | 49.0 | 0.011 (0.001) | 48.1 |
| 5 | 0.112 (0.005) | 46.3 | 0.023 (0.002) | 49.7 | 0.024 (0.002) | 47.9 |
| 6 | 0.111 (0.004) | 45.5 | 0.048 (0.003) | 47.8 | 0.043 (0.002) | 47.0 |
Figure 10.
Squeegee cross-sectional area removed after 50 wear cycles with different silicon carbide abrasives. Error bars show standard deviations.
Figure 10.
Squeegee cross-sectional area removed after 50 wear cycles with different silicon carbide abrasives. Error bars show standard deviations.
The angle of wear differed depending on the squeegee type. Squeegee 1 had the highest wear angle, with more wear apparent from the bottom of the squeegee than from the face. The lowest wear angles were observed on Squeegee 2, with the other squeegees showing intermediate wear angles. There appeared to be a rough correlation between the ability of a squeegee to flex and the wear angle; the squeegees most resistant to bending tended to give the highest wear angles. The ratios of wear for the roughest abrasive to wear with the other abrasive materials was not consistent. So for example, Squeegee 4 showed seven times more wear with 1200 grit abrasive than for 2000 grit abrasive but Squeegee 6 showed only 2.3 times more wear with 1200 grit abrasive than for 2000 grit abrasive. The other squeegees showed intermediate wear ratios for the different abrasives.
3.5. Geometry and Electrical Resistance of Printed Silver Lines Using Unworn Squeegees
The geometry of the printed lines is described in terms of the average ink film thickness over the width of the line and the average line width over the measured length of the line. The dry ink contained in that line is thus ink film thickness multiplied by line width. This can be used as an indicator of ink consumption.
For prints made on the unworn squeegees, the ink film thickness varied between the different line orientations and widths, the different positions along the squeegee and between the different squeegees. The average data for all measurements on each unworn squeegee is shown in
Table 6. The average film thicknesses ranged from 3.41 to 3.62 µm (
i.e., a 6% increase from thinnest to thickest ink film) for the test squeegees, and were higher for the prints made with the control squeegee. The correlations with squeegee flexure, hardness,
etc., are detailed previously. There was a general decline in line width over the course of the experiment as demonstrated by the lower line widths recorded in the Control end when compared with Control start. Ink film thickness was also lower in the final control prints than in the starting control prints (by 3%). This suggested that there was some drying in the mesh during the printing that reduced ink transfer. However, the effect should be minimal between prints made with unworn and worn edges of the same squeegee.
Table 6.
Ink film thickness, line width and line resistance for unworn squeegees. Averaged over all measurements.
Table 6.
Ink film thickness, line width and line resistance for unworn squeegees. Averaged over all measurements.
| Squeegee Number | Ink Film Thickness (µm) | 400 µm Line Width (µm) | 600 µm Line Width (µm) | 400 µm Line Resistance (Ω) | 600 µm Line Resistance (Ω) |
|---|
| 1 | 3.49 | 346.9 | 541.8 | 7.93 | 4.72 |
| 2 | 3.60 | 334.5 | 531.5 | 8.24 | 4.65 |
| 3 | 3.62 | 338.6 | 534.1 | 8.17 | 4.79 |
| 4 | 3.46 | 323.5 | 525.0 | 8.80 | 5.00 |
| 5 | 3.41 | 316.9 | 513.3 | 9.38 | 5.41 |
| 6 | 3.54 | 313.2 | 510.2 | 9.33 | 5.40 |
| Control start | 3.88 | 380.5 | 577.1 | 5.87 | 3.74 |
| Control end | 3.76 | 326.8 | 524.4 | 8.17 | 4.66 |
| Percentage drift | −3.1% | −14.1% | −9.1% | +39.2% | +24.6% |
The mean standard deviation in ink film thickness over all sets of nine measured lines (for the various squeegee type, line width and orientation combinations) was 0.12 μm which is 3.3% of the mean ink film thickness. For line width this was 9.5 and 7.6 µm for 400 and 600 µm lines respectively (2.9% and 1.4% of the mean line widths). For line resistance this was 0.22 and 0.17 Ω for 400 and 600 µm lines respectively (2.6% and 3.4% of the mean resistances). The orientation of the printed lines affected the ink film thickness. Lines produced in the print direction (perpendicular to the squeegee) tended to have a greater amount of ink deposition than those printed at 90° to the print direction. This is described in more detail in the following section.
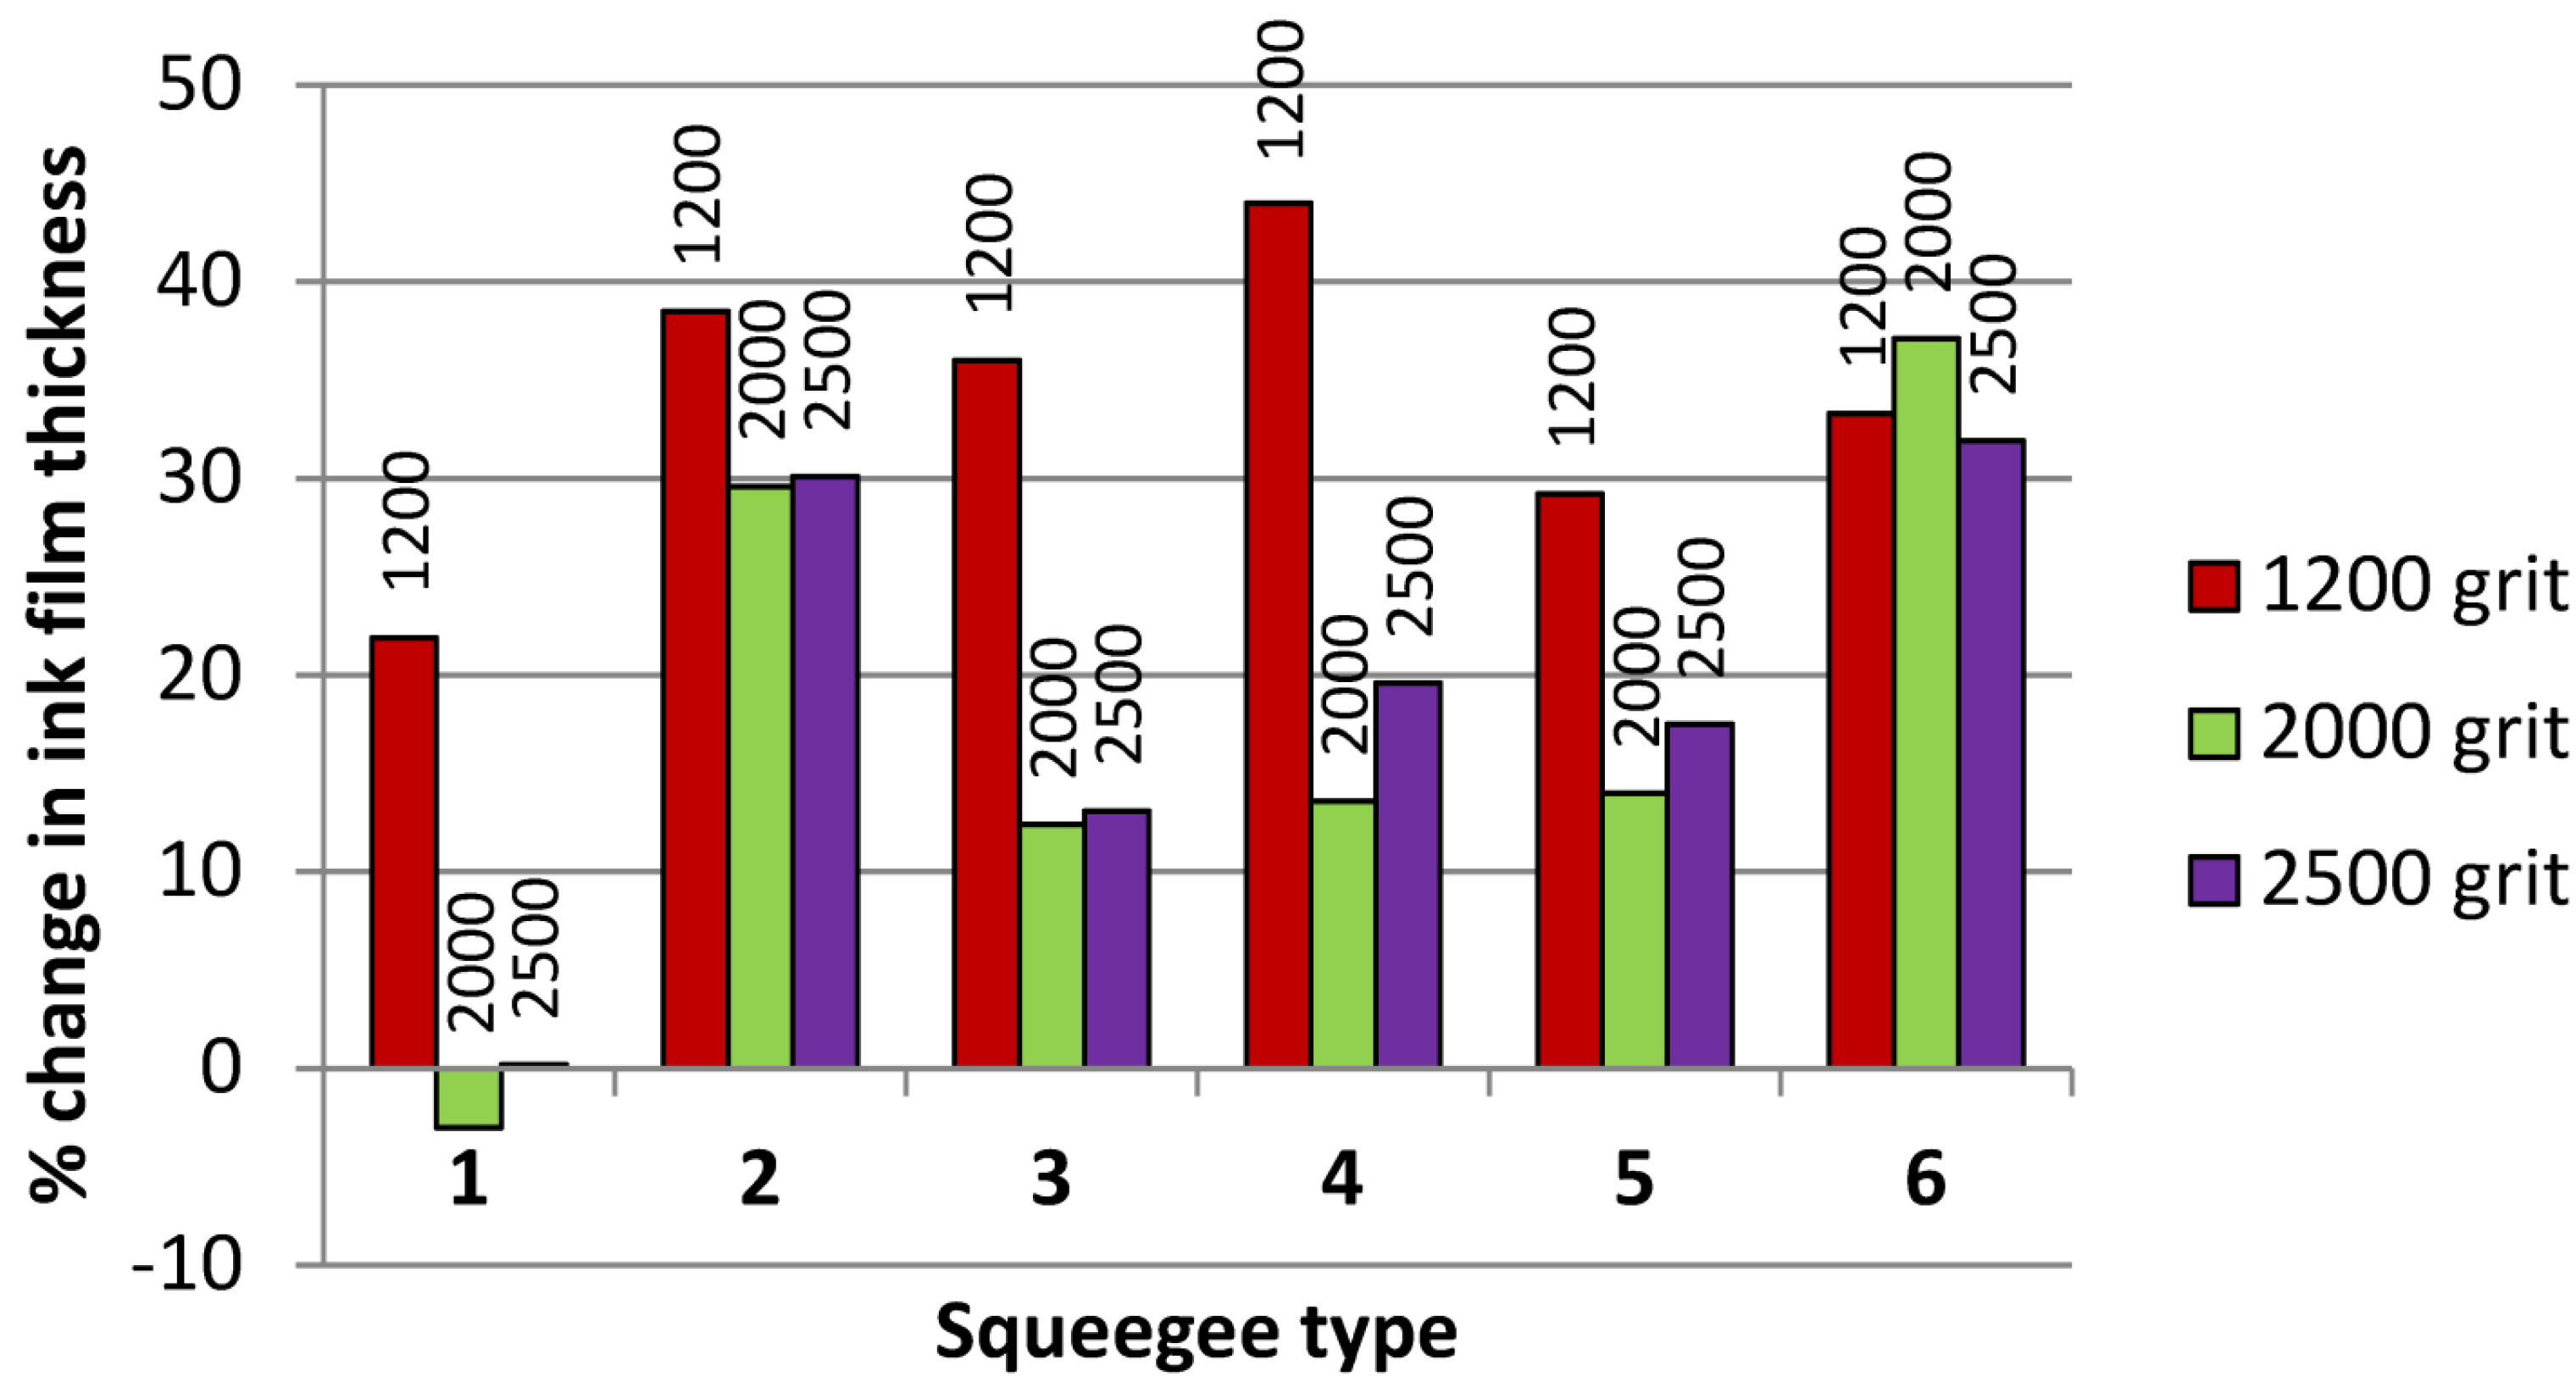
3.6. Geometry and Electrical Resistance of Printed Silver Lines Using Worn Squeegees
The effect of wear on print geometry is shown in terms of the percentage change in printed line thickness and line width when moving from unworn to worn squeegees [
i.e., 100 × (thickness worn−thickness unworn)/thickness unworn]. The average effect of wear on the ink film thickness, width, overall ink deposition (cross-sectional area) and resistance of printed lines are shown for each squeegee and abrasive type in
Table 7. The change in ink film thickness is illustrated graphically in
Figure 11.
Table 7.
Percentage change in printed ink film thickness, line width, ink deposition and line resistance as a result of squeegee wear. Data as average for all measured lines.
Table 7.
Percentage change in printed ink film thickness, line width, ink deposition and line resistance as a result of squeegee wear. Data as average for all measured lines.
| Squeegee | Change in Ink Film Thickness (%) | Change in Line Width (%) |
|---|
| 1200 grit | 2000 grit | 2500 grit | 1200 grit | 2000 grit | 2500 grit |
|---|
| 1 | 21.9 | −3.0 | 0.2 | 3.0 | −0.2 | 0.5 |
| 2 | 38.5 | 29.6 | 30.1 | 7.9 | 5.4 | 6.7 |
| 3 | 36.0 | 12.4 | 13.1 | 5.9 | 0.6 | 1.1 |
| 4 | 44.0 | 13.6 | 19.6 | 6.9 | 0.7 | 1.9 |
| 5 | 29.2 | 14.0 | 17.5 | 5.9 | −0.3 | 1.9 |
| 6 | 33.3 | 37.1 | 31.9 | 4.7 | 5.4 | 7.6 |
| |
| Squeegee | Change in Deposition (%) | Change in Line Resistance (%) |
| 1200 grit | 2000 grit | 2500 grit | 1200 grit | 2000 grit | 2500 grit |
| 1 | 25.5 | −3.1 | 0.8 | −21.1 | 3.1 | 1.5 |
| 2 | 49.5 | 36.6 | 38.8 | −33.2 | −29.8 | −27.8 |
| 3 | 44.0 | 13.0 | 14.5 | −34.1 | −33.2 | −17.8 |
| 4 | 53.9 | 14.4 | 21.9 | −37.0 | −12.7 | −19.1 |
| 5 | 36.8 | 13.7 | 19.7 | −29.3 | −17.4 | −22.4 |
| 6 | 39.5 | 44.6 | 41.9 | −30.3 | −37.8 | −32.3 |
Figure 11.
Percentage change in printed ink film thickness as a result of squeegee wear (average for all measured lines).
Figure 11.
Percentage change in printed ink film thickness as a result of squeegee wear (average for all measured lines).
Worn squeegees, for the most part, gave greater ink film thickness than unworn squeegees. This was most severe in the higher levels of wear given by the roughest, 1200 grit abrasive, with Squeegee 1 showing the lowest increase in ink film thickness due to wear (average 21.9% increase overall). This was followed by Squeegees 5, 6, 3, 2 and 4 with overall increases up to 44%. For the mid roughness abrasive, Squeegee 1 showed a small decrease of 3% in ink film thickness due to wear while the other squeegees all increased their ink film thickness, in varying amounts, between 12.4% and 37.1%. For the smoothest abrasive, Squeegee 1 showed only a negligible increase in average ink film thickness of 0.2% while the other squeegees all increased their ink film thickness, in varying amounts, between 13.1% and 31.9%. There was a print defect in Squeegee 3 for the mid wear range lines at 90° to the print direction. This caused break-up in the lines and the formation of satellite drops of ink around the line but was not observed with any of the other squeegees, in either worn or unworn states, or for lines printed in the print direction. Squeegee 1 was the best performing in terms of maintaining consistency in the print as a result of wear and there was a marked contrast between its performance and that of the other squeegees. Of the remaining squeegees, 3, 4 and 5 were substantially better than 2 and 6 when using the 2000 and 2500 abrasives but this was not the case for the roughest 1200 abrasive. The wear levels for the roughest abrasive would be unlikely to be tolerated in practice. Variability within the individual sets of measurements was similar to that measured for the unworn squeegees (standard deviation of 0.13 µm, 3.0% of the mean).
Squeegee wear tended to influence line width in a similar way to ink film thickness but the effect on overall deposition was generally lower. Squeegee wear also tended, for the most part, to increase the width of the printed lines up to a maximum of around 8%, depending on the squeegee and abrasive type, but showed decreased line width in some instances. Squeegee 1 showed the least variation in line width between worn and unworn squeegees. Overall, Squeegees 3, 4 and 5 gave intermediate behavior, while 2 and 6 generally gave the greatest increase in printed line width. The 2000 and 2500 abrasives gave only marginal changes in line width for Squeegees 1, 3, 4 and 5, while Squeegees 2 and 6 showed more substantial changes for these abrasives. Variability within the individual sets of measurements was similar to that measured for the unworn squeegees (standard deviation of 9.7 µm and 8.9 µm for 400 and 600 µm lines respectively: 2.8% and 1.7% of the mean line widths respectively).
Ink film thickness, line width, and hence ink deposition generally increased with the amount of wear on the squeegee. However, the dominant factor in the deposition was the change in ink film thickness rather than the width of the line. In line with the trends for ink film thickness and line width, Squeegee 1 gave the smallest changes in ink deposition between worn and unworn states. For, the roughest abrasive, an increase in ink deposition of 25.5% was recorded for Squeegee 1, while the other squeegees showed increases between 36.8% and 53.9%. For the mid roughness abrasive, Squeegee 1 showed a small decrease of 3% in ink deposition due to wear while the other squeegees all increased deposition, in varying amounts, between 13% and 44.6%. For the smoothest abrasive, Squeegee 1 showed only a negligible change in deposition (+0.8%) while the other squeegees all increased deposition, in varying amounts, between 14.5% and 41.9%. The small reduction in deposition observed in Squeegee 1 for the 2000 abrasive was most likely within the inherent variability in the process and the gradual drying in the mesh (demonstrated by the change in the control prints). There was not an intermediate increase in ink deposition for the 2000 grit abrasive. However, this abrasive did not produce intermediate wear levels (
Figure 10).
For squeegees worn with the roughest, 1200, abrasive, there was a reduction in electrical resistance for all printed lines. The average reduction was between 21% (Squeegee 1) and 37% of the initial values, depending on the squeegee type. This was due to the increase in ink deposition from the worn squeegees, primarily due to the increased ink film thickness but also increased line width, as described previously. Reductions in ink film deposition gave the higher resistances noted for Squeegee 1 when using the 2000 and 2500 abrasives. For the mid roughness abrasive, Squeegee 1 showed a small increase of 3% in line resistance due to wear while the other squeegees all showed a reduction in resistance, in varying amounts between 12.7% and 37.8%. For the smoothest abrasive, Squeegee 1 showed only a very small increase in resistance of 1.5% while the other squeegees all gave reduced resistances, in varying amounts between 17.8% and 32.3%. For worn squeegees mean standard deviations in resistance were 0.13 Ω (2% of mean) and 0.20 Ω (5.2% of mean) for 400 and 600 µm lines respectively.
The effect of wear on the print varied depending on the orientation of the printed lines. Ink film thickness in unworn and worn states, as well as the percentage change in printed ink film thickness resulting from squeegee wear, is shown both in the print direction and at 90° to the print (parallel to the squeegee) in
Table 8.
Table 8.
Printed ink film thickness (µm) in unworn and worn states and percentage change in ink film thickness as a result of squeegee wear for lines printed in the print direction and at 90° (parallel to squeegee).
Table 8.
Printed ink film thickness (µm) in unworn and worn states and percentage change in ink film thickness as a result of squeegee wear for lines printed in the print direction and at 90° (parallel to squeegee).
| Squeegee | Printed Ink Film Thickness (µm) |
|---|
| 1200 grit | 2000 grit | 2500 grit |
|---|
| Line Width | Line Width | Line Width | Line Width | Line Width | Line Width |
|---|
| 400 µm | 600 µm | 400 µm | 600 µm | 400 µm | 600 µm |
|---|
| Print | 90° | Print | 90° | Print | 90° | Print | 90° | Print | 90° | Print | 90° |
|---|
| 1 | Unworn | 3.69 | 3.11 | 3.91 | 3.47 | 3.58 | 3.15 | 3.62 | 3.45 | 3.55 | 3.14 | 3.65 | 3.57 |
| Worn | 4.26 | 3.98 | 4.72 | 4.27 | 3.36 | 3.13 | 3.47 | 3.42 | 3.46 | 3.24 | 3.54 | 3.69 |
| Change (%) | 15.4 | 28.2 | 20.8 | 23.1 | −6.1 | −0.5 | −4.3 | −1.0 | −2.6 | 3.4 | −3.1 | 3.2 |
| 2 | Unworn | 4.02 | 3.12 | 4.21 | 3.60 | 3.51 | 3.26 | 3.69 | 3.62 | 3.58 | 3.08 | 3.93 | 3.62 |
| Worn | 5.00 | 4.69 | 5.68 | 5.21 | 4.49 | 4.24 | 4.90 | 4.62 | 4.45 | 4.29 | 4.94 | 4.76 |
| Change (%) | 24.2 | 50.1 | 34.9 | 44.6 | 27.9 | 30.2 | 32.8 | 27.4 | 24.3 | 39.0 | 25.5 | 31.5 |
| 3 | Unworn | 3.61 | 3.39 | 4.13 | 3.56 | 3.74 | 3.26 | 3.83 | 3.59 | 3.64 | 3.17 | 4.07 | 3.45 |
| Worn | 5.05 | 4.46 | 5.48 | 4.98 | 4.16 | N/A | 4.35 | N/A | 3.97 | 3.76 | 4.21 | 4.18 |
| Change (%) | 39.9 | 31.4 | 32.7 | 40.0 | 11.1 | N/A | 13.7 | N/A | 9.1 | 18.6 | 3.5 | 21.1 |
| 4 | Unworn | 3.75 | 2.98 | 3.80 | 3.38 | 3.56 | 3.44 | 3.57 | 3.61 | 3.41 | 2.98 | 3.71 | 3.35 |
| Worn | 5.01 | 4.46 | 5.59 | 4.94 | 4.05 | 3.64 | 4.25 | 4.17 | 3.86 | 3.70 | 4.21 | 4.27 |
| Change (%) | 33.5 | 49.4 | 47.1 | 46.1 | 14.0 | 5.9 | 19.1 | 15.5 | 13.2 | 24.2 | 13.5 | 27.4 |
| 5 | Unworn | 3.69 | 3.35 | 3.81 | 3.73 | 3.45 | 3.10 | 3.39 | 3.39 | 3.33 | 2.91 | 3.37 | 3.40 |
| Worn | 4.76 | 4.23 | 5.23 | 4.63 | 3.96 | 3.54 | 4.07 | 3.63 | 3.62 | 3.53 | 4.04 | 4.09 |
| Change (%) | 29.0 | 26.4 | 37.3 | 24.1 | 15.0 | 14.1 | 20.0 | 6.9 | 8.7 | 21.2 | 19.9 | 20.2 |
| 6 | Unworn | 3.97 | 3.37 | 4.30 | 3.57 | 3.71 | 3.07 | 3.50 | 3.17 | 3.37 | 3.21 | 3.71 | 3.60 |
| Worn | 4.97 | 4.61 | 5.40 | 5.18 | 4.49 | 4.43 | 4.83 | 4.60 | 4.35 | 4.30 | 4.87 | 4.78 |
| Change (%) | 25.4 | 36.8 | 25.7 | 45.2 | 21.0 | 44.4 | 38.1 | 44.9 | 29.3 | 34.0 | 31.3 | 32.8 |
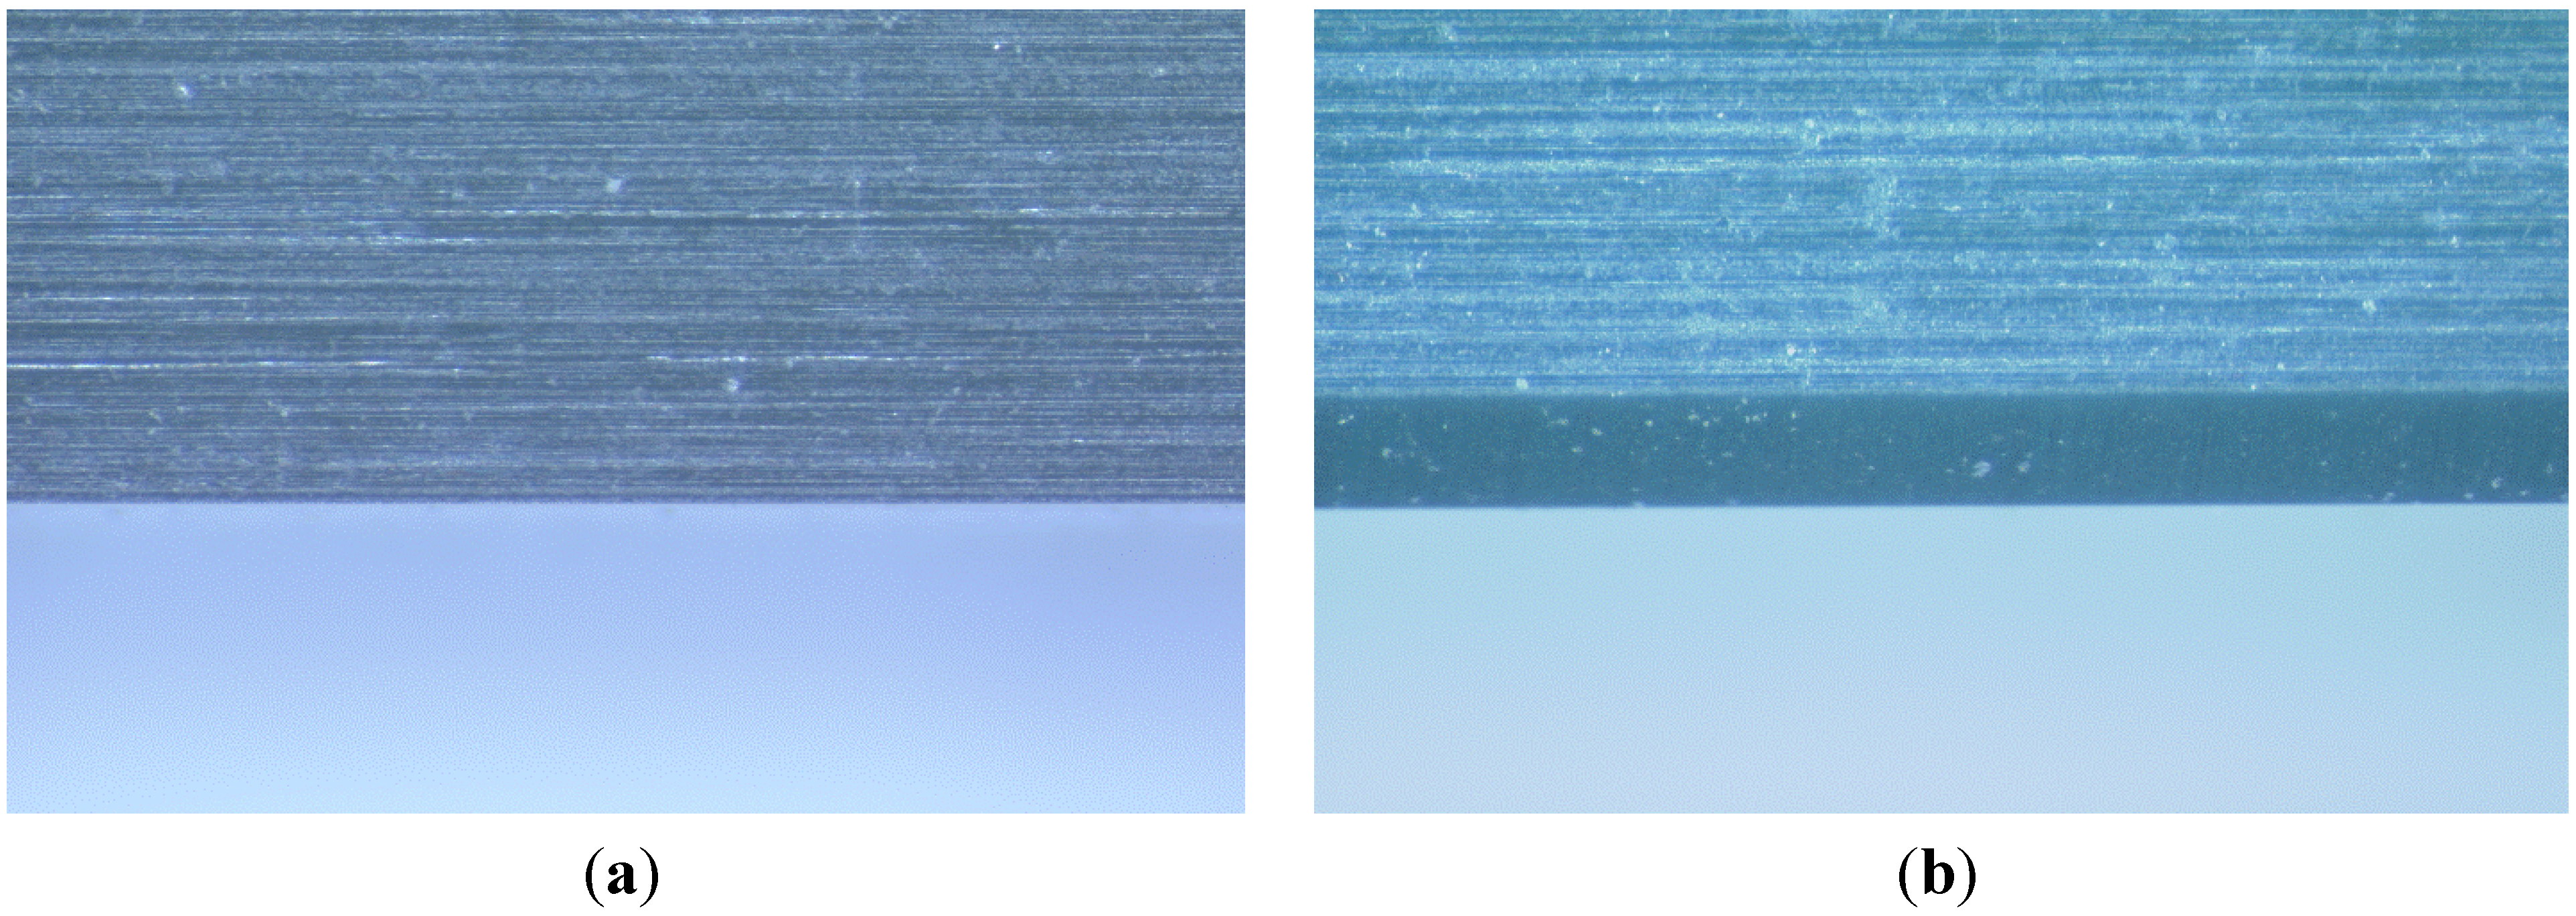
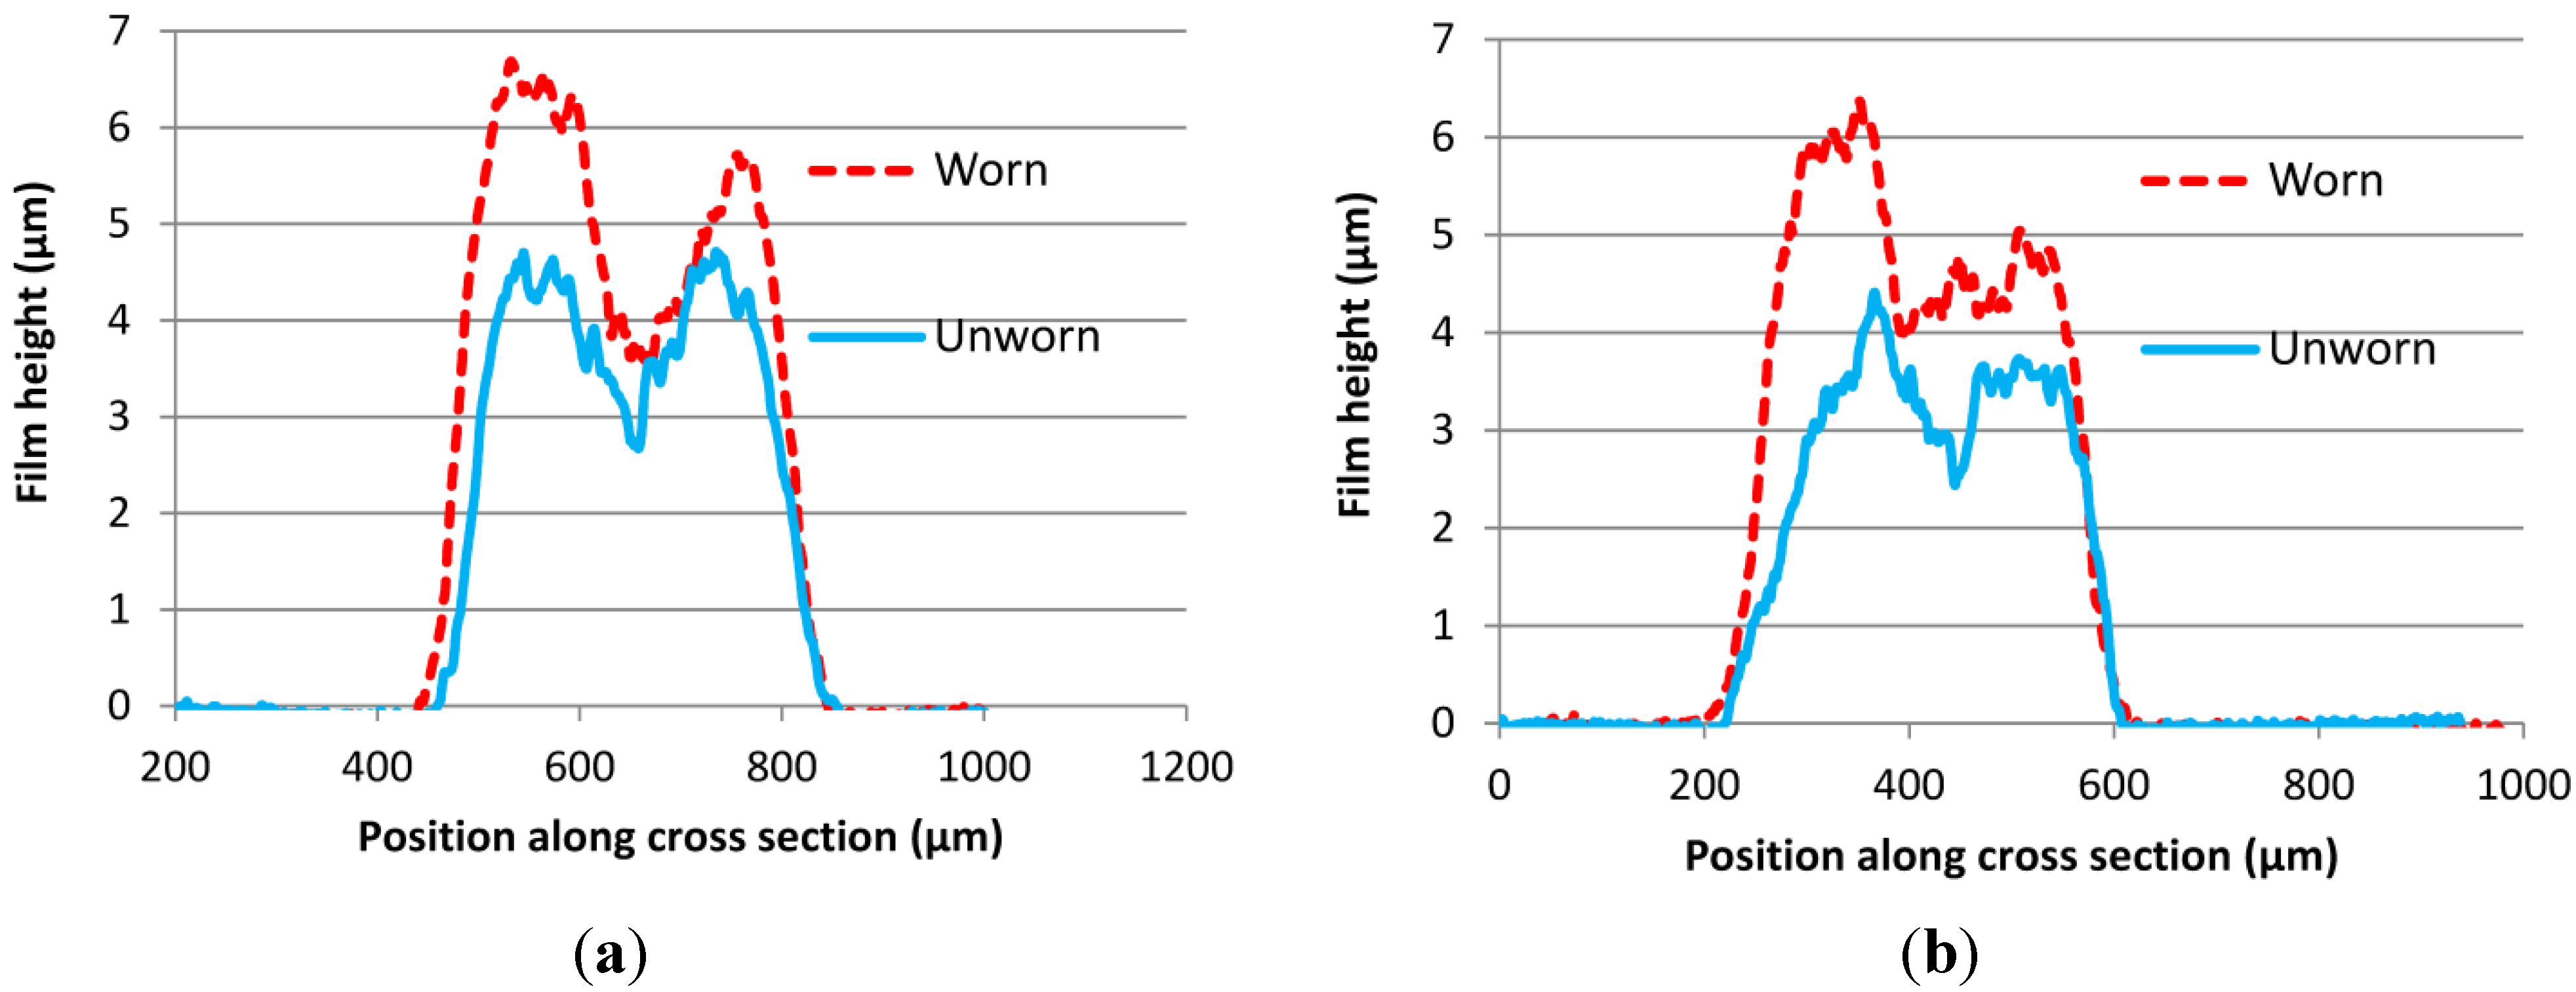
For lines printed at 90°, there tended to be a greater increase in ink deposition (as a proportion of unworn ink film thickness) as a result of wear than for lines produced in the print direction. However, it should be noted that ink film thicknesses in both unworn and worn states were lower for lines printed at 90°. In this orientation, it is postulated that there is greater “scooping-out” as the squeegee is less restricted by the stencil after travelling over the edge of the stencil. For lines printed at 90°, there was also a greater increase in ink film thickness on the leading edge of the line when compared with that on the trailing edge. However, for lines deposited in the print direction, wear related increases in ink film thickness were observed more equally on both edges of the lines. Regardless of line orientation, the middle of the line was lower than the edges. This is illustrated in
Figure 12, sample graphs of the cross-sectional profiles of different orientation lines before and after wear. It is postulated that this greater ink deposition after wear is due to the worn edge of the squeegee no longer being able to deform into the mesh to the same extent as the unworn squeegee. This effect varied depending on the squeegee type, the amount of wear and the orientation of the lines.
Figure 12.
Sample images of variation in ink deposition (cross-section) as a result of squeegee wear at different orientations: (a) Parallel to print direction (90° to squeegee); (b) 90° to print direction (parallel to squeegee); using 1200 grit abrasive, Squeegee 4. Note this effect varies depending on squeegee/abrasive types.
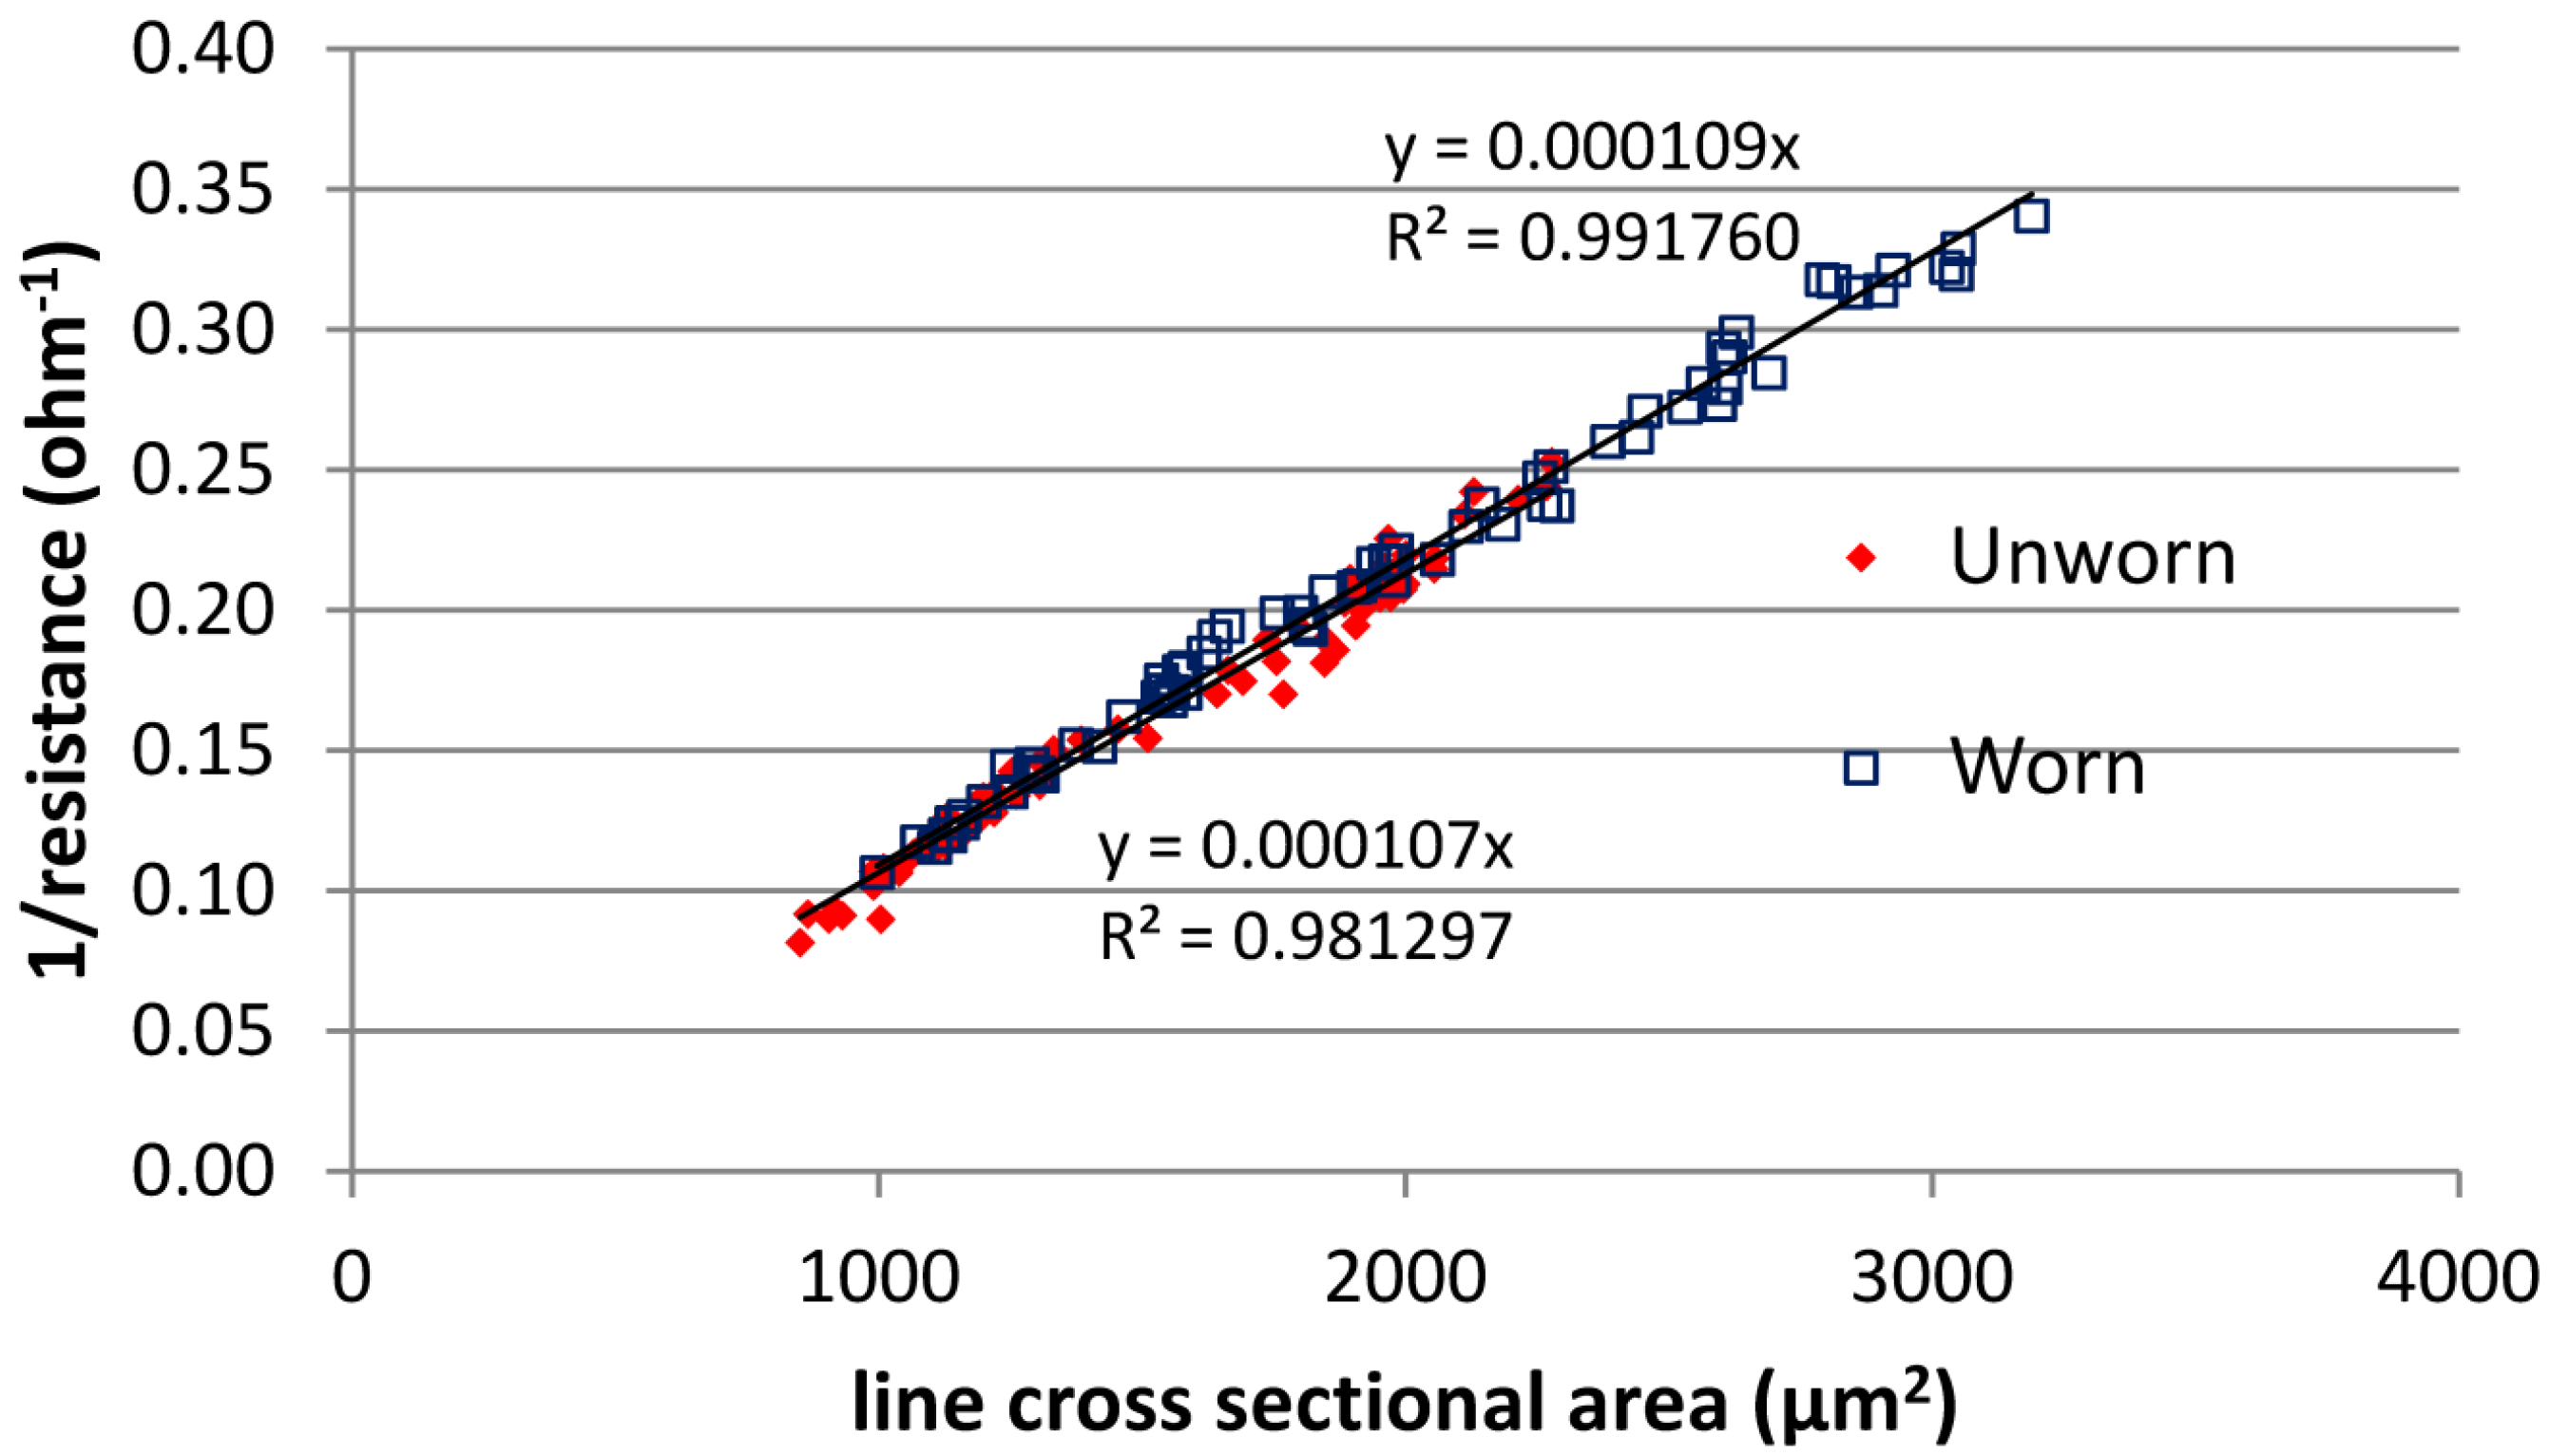
The relationship between the ink deposition (cross-sectional area of the printed lines—ink film thickness × line width) and the reciprocal of the measured line resistance is shown in
Figure 13. The relationship was very similar regardless of whether the lines were printed with the worn or unworn squeegees. There was a linear relationship with high
R2 values. While the worn squeegees gave a general increase in ink deposition, which gave a reduction in line resistance, there was no deviation from the relationship which would suggest print defects, such as broken lines, which would lead to higher than expected resistances. The data confirms that resistance measurements are sufficient to accurately characterize the amount of ink deposition for silver prints made with unworn and worn squeegees.
Figure 13.
Correlations between ink deposition (line cross-sectional area) and line resistance.
Figure 13.
Correlations between ink deposition (line cross-sectional area) and line resistance.
3.7. Discussion
The indentation and bending tests described in this report have been able to characterize the squeegees in a more effective manner than traditional Shore A hardness measurement. Measuring indentation at a lower pressure than a Shore A hardness meter gives data which is more representative of what occurs during printing, while squeegee deflection tests offered an even better correlation with ink film thickness. However different values will be obtained if any of the settings such as pin or deflection tool geometry are altered. The method of immersing only one surface of the squeegee in solvent, coupled with the indentation method, allowed solvent related softening of the squeegees to be reliably measured. Solvent absorption softens the squeegee which should lead to an increase in ink transfer as indicated both by the correlation between hardness and ink transfer and by previous work [
14]. Squeegee hardness after exposure to solvent could also be linked with wear characteristics and there appeared to be a correlation between squeegee hardness and the amount of wear, with harder squeegees wearing more. However, this was only observed at a 5 N indentation force and did not apply at higher forces, or indeed when using Shore A hardness. It was also only apparent when solvent treated indentation data was used and this observation should therefore be treated with caution. Both squeegee hardness and pressure should influence the amount of wear but these factors will interact, with a harder squeegee having a higher pressure. The squeegee contact needs to be better understood so that wear can be anticipated from measurable squeegee parameters. Furthermore, each squeegee responded differently to the various abrasives. The amount of wear from one abrasive could not be used to anticipate the wear from another and there was not a consistent ratio of wear for a certain abrasive against wear for another.
There were distinct differences in the amount of wear observed in the different squeegees and a large range in the effects of this wear on the printed lines. There was a general trend of increasing wear levels giving greater levels of ink film thickness and line width and hence reduced line resistance for silver lines. The effect of wear on ink film thickness was more significant than the effect on line width. During production, such an increase in ink transfer would lead to an increase in ink consumption as well as a variation in the quality of the printed features. In the case of functional screen printing for electronics or sensors, this would have an effect on the functional of the end product, while for graphics the appearance of the product would be affected. This would have cost implications in terms of ink consumption but would also lead to greater product failure and rejection.
White
et al. [
9] state that ink flux through the screen is proportional to the square root of the squeegee tip curvature; provided other factors remain unchanged. Although this is based on modeling using a Newtonian fluid, when screen printing inks are usually shear thinning, worn squeegees should give greater ink transfer as their sharp edges are gradually rounded. It is proposed that the change in line geometry is due to a reduced ability for the squeegee to deform into the mesh and displace the ink from the mesh. However, the relationship between the amount of wear and ink deposition was not straightforward and depended on the squeegee. Squeegee 1 suffered similar levels of wear to other squeegees yet it was much more effective at maintaining consistency in the print. Even with the wear suffered in 2000 and 2500 abrasives, the squeegee remained usable. The others squeegees all showed substantial increases in ink deposition (up to 44%) indicating that they would not be useable at this point and would consume much higher amounts of ink in the printing process.
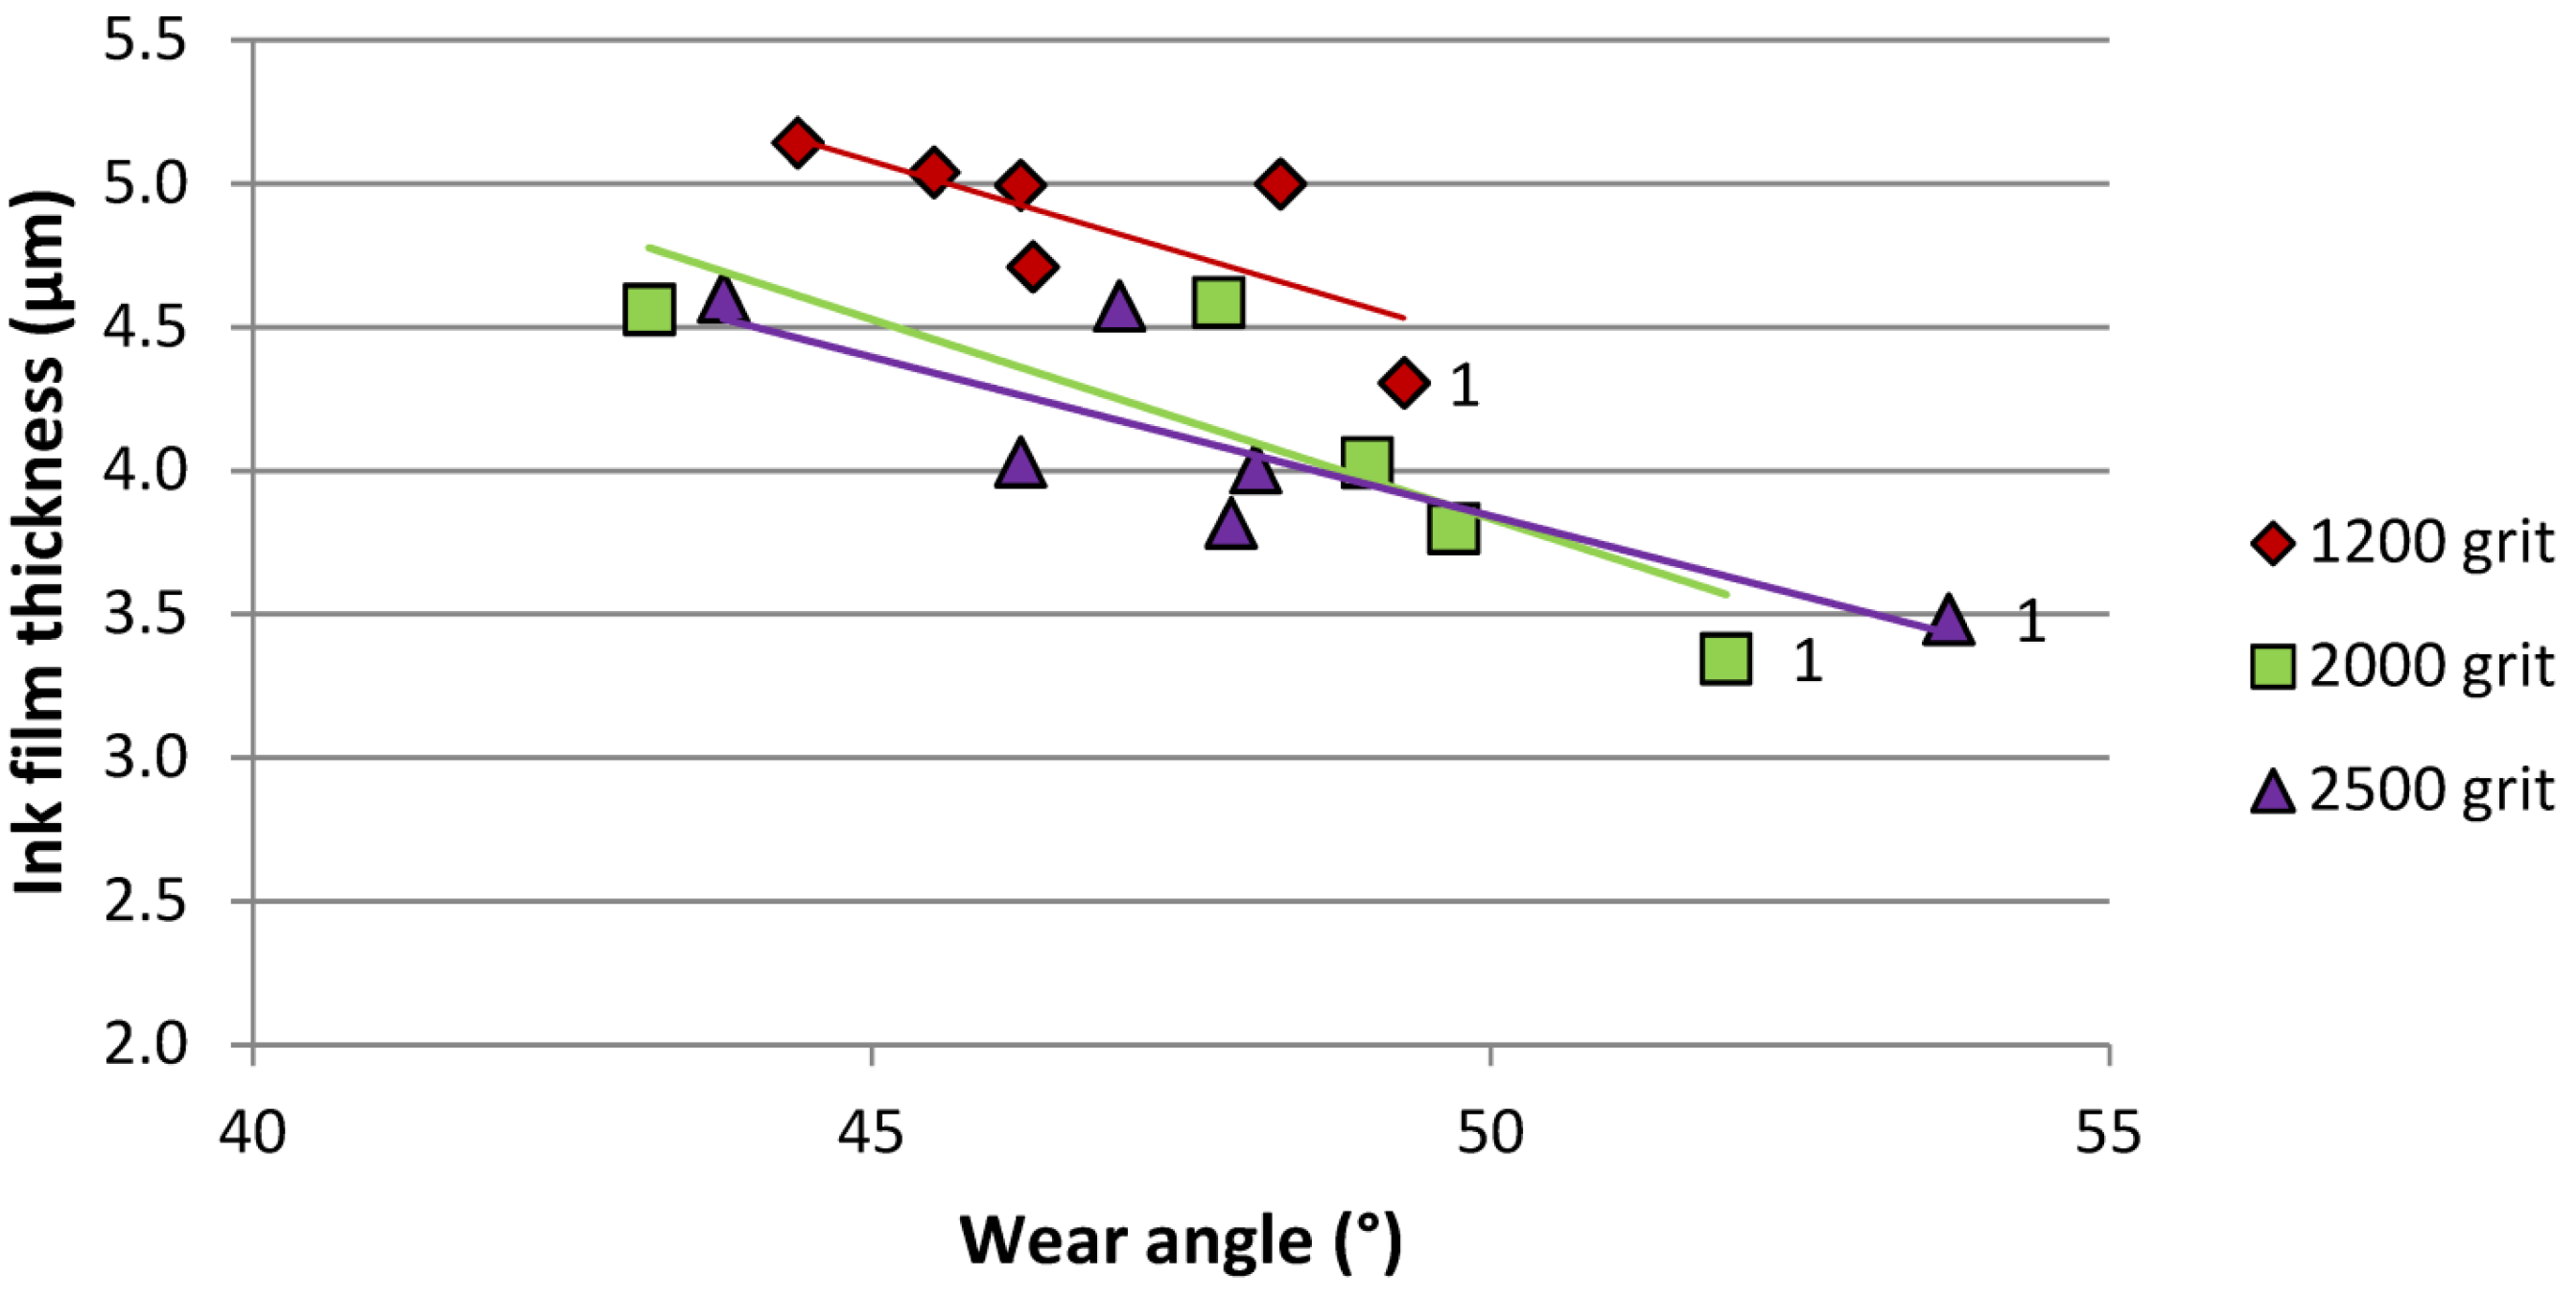
The higher comparative resistance to both indentation and flexing at lower forces, previously noted, suggested that Squeegee 1 would print with a high pressure which would give a reduced ink film thickness. This also influences the angle of wear, which changes the effective squeegee angle during printing and in turn also affects the ink film thickness. The influence of wear angles on ink film thickness is shown in
Figure 14. The ink film thickness appears to be affected by a combination of squeegee wear angle and the amount of squeegee removed during wear. Squeegee 1 had both the highest wear angles and the lowest ink film thickness after wear, despite other squeegees having lower levels of wear. The combination of resistance to bending and a high wear angle presents a sharper edge and higher pressure at the squeegee/screen interface. This reduces the ink film thickness.
Figure 14.
Ink film thickness vs. wear angle in worn squeegees.
Figure 14.
Ink film thickness vs. wear angle in worn squeegees.
The controlled wear did not, apart from one line orientation for Squeegee 3, cause any print defects, such as breakages, pinholes in the lines, or satellite drops of ink around lines that would be detrimental to their electrical performance. This highlights the benefit of a controlled wear methodology rather than testing squeegees worn through printing which might suffer nicks or other uneven damage and cause broken lines. Wear trials performed using both silver and carbon inks on a screen with a blocked mesh, did not show such levels of wear, even after thousands of cycles.
The roughest abrasive material gave very high levels of wear which would not be tolerated in practice. This was reduced when using smoother abrasives but still gave substantial increases in ink consumption for most squeegees. There was a drift in the print characteristics over the duration of the printing experiment with a small reduction in ink film thickness was observed but a more noticeable reduction in line width. This also gave an increase in line resistance. Assuming this is a gradual effect related to ink build-up in the mesh, the drift anticipated between the sequential prints of an unworn and worn state of a given squeegee is only a small pro-rata proportion of this. Averaged over all features this would be of the order of 0.25% for ink film thickness and less than 1% for line width. This would not be significant for most of the observations, where large changes in deposition were observed.
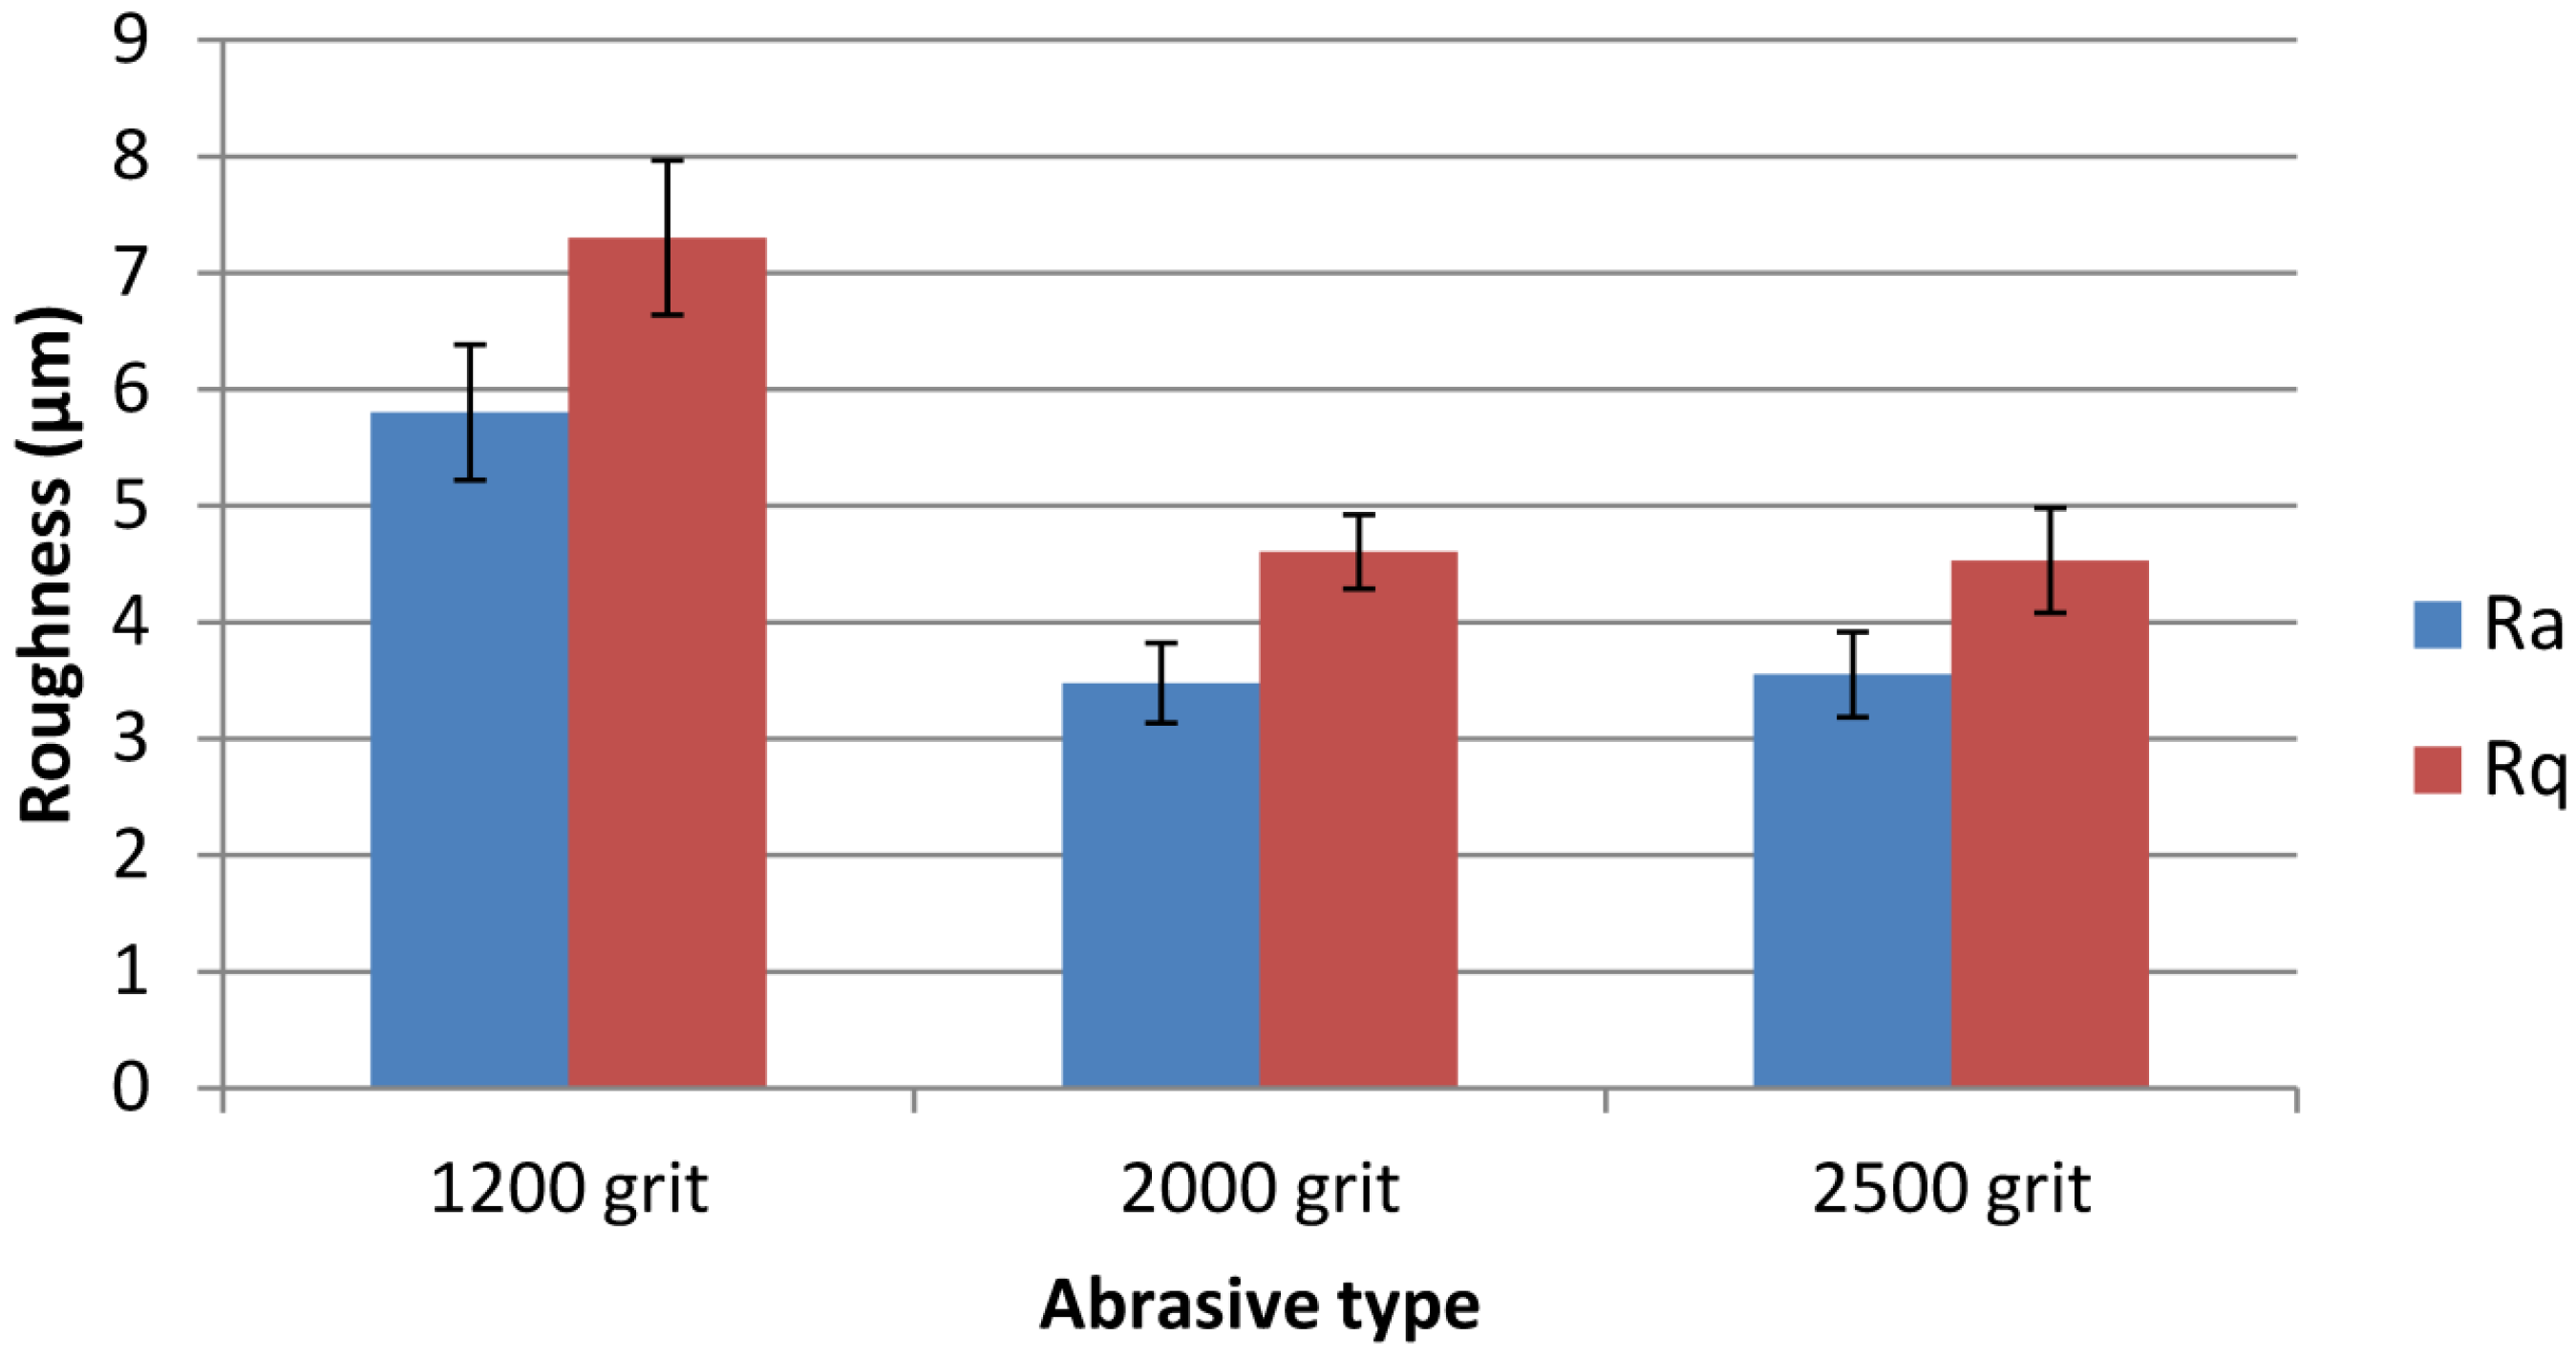
The 2000 and 2500 grit abrasives did not appear to differ substantially from one another, either in their ability to abrade the squeegee or change the ink deposition after wear. The particle size of the intermediate 2000 grit abrasive was closer to that of the 2500 grit than the 1200 grit abrasive. There might also be some variations in pressure due to the positions of the different bands which will affect wear. Preliminary analysis of the surface topography of the abrasives using white light interferometry [Veeco NT2000 (Veeco Instruments, Inc., Plainview, NY, USA) with array size 305 µm × 232 µm] suggested that roughness characteristics, in terms of average and root mean squared roughness surface roughness (
Ra and
Rq respectively) were very similar for 2000 and 2500 grit abrasives (
Figure 15). An alternative intermediate 1500 grit abrasive has a particle size profile much closer to the 1200 grit abrasive and hence would be expected to give wear results more similar to that.
Figure 15.
Surface roughness data for abrasives obtained using white light interferometry. Five measurements per abrasive type with error bars showing standard deviations.
Figure 15.
Surface roughness data for abrasives obtained using white light interferometry. Five measurements per abrasive type with error bars showing standard deviations.
The ink used in the wear testing can be selected to match a particular application. The various inks use different solvents which will affect how the squeegee abrades. This is particularly relevant for novel formulations whose effect on squeegee material is unknown.
During printing, squeegee wear would be expected to be inconsistent and localized, due to varying topography from the patterning in the screen and possible build-up of material in certain areas over time. This would then give rise to localized variations in ink film thickness within the printed sheet. Although these experiments do not simulate the localized defects that would occur during printing, the findings are applicable in terms of the consequences of wear on the print.


