Abstract
This study investigates the molecular interactions and interfacial behaviors of a carboxylate-sulfonate gemini surfactant (CSGS) with four heavy-oil components (SARA: saturates, aromatics, resins, and asphaltenes) using molecular dynamics (MD) simulations. To provide a comprehensive analysis, two distinct systems were constructed: a homogeneous bulk oil phase (System 1) and a solid–liquid interfacial system containing a calcite (CaCO3) substrate (System 2). In System 1, results showed that CSGS remained well dispersed in the bulk heavy-oil phase and promoted a more uniform distribution of the SARA components. The differences in mobility among the components were mainly determined by molecular structure, resulting in a consistent diffusion trend in the CSGS-containing bulk system. In contrast, the introduction of a calcite substrate (System 2) shifted the distribution from a largely disordered bulk-like state to a confined interfacial organization, with clear layering and enrichment near the mineral surface. Compared with the CaCO3-free system, molecular migration was noticeably restricted, indicating that the carbonate layer imposed additional constraints on mass transport. At the same time, CSGS preferentially accumulated in the SARA components–CaCO3 region, consistent with competitive adsorption at the carbonate interface, and further reorganized the local interfacial structure.
1. Introduction
With the depletion of conventional reserves, heavy oil has emerged as a critical component of the global energy landscape [1,2]. However, its exploitation is hindered by high viscosity, intense molecular aggregation, and intricate physicochemical properties. These factors impede flowability and recovery efficiency and also complicate refining processes [3]. A fundamental strategy for improving recovery lies in resolving the molecular mechanisms governing heavy oil’s aggregation and dispersion [4]. Heavy oil is a complex multicomponent mixture. It is generally categorized into saturates, aromatics, resins, and asphaltenes (SARA components) based on variations in polarity and solubility [5]. The saturates and aromatics components are classified as light components. They are distinguished by low molecular weight and weak intermolecular interactions [6]. Conversely, resins and asphaltenes exhibit high polarity and elevated density, and are abundant in heteroatoms and polycyclic aromatic hydrocarbon structures [7]. Asphaltenes primarily aggregate via π-π stacking, van der Waals forces, and polar interactions. These factors significantly contribute to the fluid’s elevated viscosity and inadequate flow characteristics. Resins additionally stabilize these asphaltene aggregates, enhancing the system’s molecular complexity [8,9,10]. The interactions among these SARA components predominantly dictate the macroscopic rheological properties of heavy oil. This underscores the need to clarify their mechanisms to achieve efficient viscosity reduction and enhanced dispersion.
Oil sands development is largely dictated by burial depth rather than by the production pattern typical of conventional crude oil. Deposits deeper than 75 m are generally produced by in situ recovery, whereas shallower deposits are mainly developed by surface mining [11,12]. For surface-mined oil sands, downstream separation is most often carried out using water-based extraction methods, including hot alkaline water washing, surfactant-assisted washing, and organic solvent extraction [13,14]. Surface mining contributes roughly half of China’s oil sands output [15]. Surfactants are widely applied in this context because they regulate interfacial properties and promote bitumen separation [16]. Laboratory studies have reported macroscopic improvements consistent with these roles, including viscosity reduction [17], lower interfacial tension [18], and enhanced oil recovery [19]. Zhang et al. examined sodium dodecylbenzene sulfonate (SDBS) and found that it reduces the contact angle on the substrate and alters wettability, which promotes bitumen desorption [16]. Gemini surfactants possess a deliberately doubled architecture, consisting of two ionic headgroups and two hydrophobic chains. This structural configuration results in exceptionally strong interfacial performance, with reported interfacial tensions as low as 10−3 mN/m, thermal stability exceeding 300 °C, and significant salt tolerance. Even at low dosages, viscosity reductions greater than 95% have been observed, establishing these surfactants as effective chemical agents for unconventional oil and gas production [20].
Surfactants are widely used to enhance oil recovery, but direct observation in heavy oil is difficult because many components have overlapping chemical signatures, experiments are performed under harsh conditions, and molecular aggregates continuously form and reorganize. The result is a familiar gap: the specific molecular contacts between surfactants and SARA components remain poorly resolved, and the way those contacts translate into improved removal remains mechanistically ambiguous. Molecular dynamics (MD) simulation has become a workhorse for addressing this problem in heavy-oil research and is widely used to interrogate surfactant-assisted separation at the molecular level [21]. Prior MD studies have characterized asphaltene aggregation [22], resin–asphaltene association [23], and the impact of additives such as surfactants and ionic liquids on the structure and properties of these systems [24,25]. Together, these simulations provide molecular-scale evidence that supports chemical-agent selection and guides the rational tuning of operating conditions in heavy-oil processing [26,27,28,29,30,31,32]. Ahmadi et al. used molecular dynamics simulations to systematically evaluate the interaction mechanisms between three representative asphaltene molecules and anionic surfactants in Athabasca oil sands. The study found that the benzene ring structures in the surfactants can significantly enhance intermolecular van der Waals interactions, while the number and arrangement of heteroatoms in asphaltene molecules play a decisive role in their dynamic behavior in solution [33]. Yuan et al. found, through molecular dynamics simulations, that the efficiency of surfactant-assisted oil recovery depends on surfactants ability to induce the formation of water channels at the oil/solid interface. The evolution of this microscopic structure reduces the oil’s adsorption strength on the calcite surface, enabling effective desorption from hydrophobic surfaces [34]. MD studies on heavy oil have increased in recent years; however, most research still concentrates on single components (asphaltenes). Studies that simultaneously consider the interactions of SARA components with a specific surfactant are relatively limited. The diffusion behavior, spatial concentration distribution, and conformational evolution of different SARA components in the presence of gemini surfactants have not been systematically investigated [31,32,35,36,37,38,39,40,41,42]. Clarifying these aspects is important for developing a more complete and reliable molecular understanding of surfactant-regulated heavy oil systems [43,44,45].
This study established two comparable models, a bulk system (System 1) and a carbonate-confined interfacial system (System 2), to account for CSGS-driven bulk dispersion and competitive adsorption near CaCO3 within a unified mechanistic framework. Using a dual-headgroup CSGS surfactant revealed fraction-dependent effects on different SARA components, providing guidance for designing efficient surfactants for heavy-oil recovery and separation. System equilibration was verified using temperature and energy profiles. MSD (Mean Squared Displacement), RDF (radial distribution function), concentration distributions, and diffusion-frame analyses were then performed for both systems.
2. Experiment and Molecular Dynamics Simulation
2.1. Models
The molecular dynamic simulation was used to simulate the molecular interaction role [46]. Molecular dynamics (MD) simulations were performed using BIOVIA Materials Studio 2020 (Version 20.1.0.2729). The most stable calcite was selected as the representative mineral component of the reservoir rock, and a calcite (CaCO3) surface with dimensions of 2.934 nm × 2.994 nm × 1.500 nm was constructed. For heavy oil molecules, the SARA components (saturates, aromatics, resins, and asphaltenes) were selected. Saturates and aromatics are nonpolar organic molecules composed mainly of C and H elements. Resins and asphaltenes, as the strongly polar components of crude oil, are rich in heteroatoms such as N, S, and O. Based on practical considerations of the system and previous studies [47], the representative molecular structures of the four heavy oil components selected in this work are shown in Figure 1. The present study investigates two systems: (i) SARA components–CSGS (System 1). The initial molecular configurations were generated using the Amorphous Cell module to obtain stable structures with reasonable densities. System 1 was designed to examine the molecular interactions between the SARA components and CSGS. (ii) SARA components–CSGS–CaCO3 (System 2). First, a binary system comprising SARA components and a CaCO3 surface was constructed to investigate the adsorption behavior of saturates, aromatics, resins, and asphaltenes on the CaCO3 surface, thereby ensuring a realistic reservoir surface morphology. Subsequently, a three-layer model was built using the Build Layers module, comprising water, CSGS, SARA components, and CaCO3 from top to bottom, to represent a surfactant aqueous solution washing oil sands. The simulation settings for System 1 and System 2 are summarized in Table 1 and Table 2, respectively.
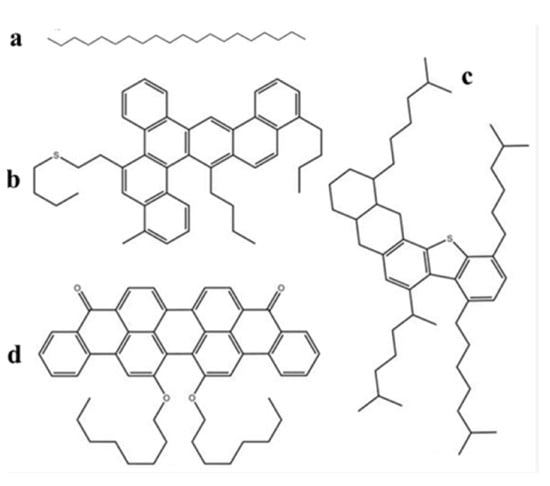
Figure 1.
Molecular structure of SARA components: (a) saturates (C20H42), (b) aromatics (C46H50S), (c) resins (C50H80S), and (d) asphaltenes (C50H48O4) (white = hydrogen, grey = carbon, red = O; yellow = S) [48].

Table 1.
Simulation setting for System 1.
Table 2.
Simulation setting for System 2.
2.2. Force Fields and MD Simulations
Interatomic interactions among SARA components, CSGS, and CaCO3 were described using the COMPASS II force field, an ab initio-derived model parameterized for polymers, surfactants, and hydrocarbons. This force field accurately represents π–π stacking and hydrogen bonding [13,49,50] and reliably captures interactions between heavy-oil molecules and solvents [51,52,53]. Equation (1) shows the potential energy functions. Long-range electrostatic interactions were computed using the Ewald summation method with an accuracy of 10−4 kcal/mol. Van der Waals interactions were calculated by atom-based summation with a cutoff radius of 12.5 Å.
In the above equation, the first five terms correspond to bonded interactions. These include bond stretching, angle bending, dihedral torsion, cross terms, and out-of-plane potential functions. Here, b denotes the bond length between two covalently bonded atoms. θ represents the bond angle formed by three consecutively bonded atoms. ϕ is the dihedral angle (torsion) defined by a sequence of four atoms. χ signifies the out-of-plane (inversion) coordinate, which describes the displacement of an atom from the plane formed by three neighboring atoms. The cross terms account for the dynamic coupling between different internal coordinates. The last two terms represent non-bonded interactions: van der Waals and electrostatic interactions. The electrostatic and van der Waals interactions were calculated using the Ewald summation method and the Lennard-Jones 9-6 potential function, respectively. These calculations are expressed in Equations (2) and (3).
where i and j denote different atoms, q represents the atomic charge, r is the interatomic distance, and ε denotes the potential well depth. After building System 1 and System 2, the MD workflow was performed in following explicit stages: (i) energy minimization and (ii) production.
(i) Energy minimization: Geometry Optimization was carried out in the Forcite module. The COMPASS II force field and the Smart algorithm were used until convergence (ΔE < 0.001 kcal/mol; max force < 0.5 kcal/mol/Å).
(ii) Production: MD was then performed in the NVT ensemble at 298.15 K for 2500 ps with a 1 fs time step. Temperature control employed the Berendsen thermostat with a coupling constant τ = 0.1 ps. For System 2, the bottom two layers of the CaCO3 layer were kept fixed during equilibration to maintain a bulk-like substrate.
Trajectory analysis windows were defined explicitly as follows. Diffusion coefficients were obtained from the linear MSD regime over 200–2000 ps for Systems 1 and 2. RDFs and concentration profiles were computed by averaging over the last 1000 ps of each trajectory, using configurations sampled every 1 ps.
2.3. SARA Analysis
A quantity of 0.1 g carboxylate-sulfonate gemini surfactant was weighed, then diluted by 1 L deionized water, and then ultrasonically dispersed for 90 min. The nanofluids and biosurfactants could be further used to extract the bitumen from oil sands. The detailed operational steps are given as follows: first, the oil sands (50 g) were crushed, sieved, and weighed. The pH of aqueous solutions was adjusted to 8.50. Second, 50 g of oil sands ores was transferred into the Denver Flotation Cell. Third, 1L of aqueous solution (50 °C) was poured into the Denver Flotation Cell. The condition process lasted for 5 min, while 150 mL/min air was injected into the Flotation Cell. Finally, after floatation time of 15 min, the froth was collected for analysis by a Dean–Stark apparatus. Then the SARA analysis was conducted, referring to the references [54,55]. The Soxhlet extraction followed reference [55].
3. Results and Discussion
3.1. CSGS-SARA Components System
3.1.1. CSGS-SARA Energy Balance
Figure 2a–d present the energy evolution of System 1 for the SARA components. In all cases, the energies exhibited a brief transient at the beginning of the simulation (50 ps) and then approached a stable plateau, indicating that the systems relaxed from the initial configuration to a thermodynamically steady state. Throughout the trajectories, the relative magnitudes of the energy components remained consistent, with kinetic energy being the largest term, followed by total energy and potential energy, whereas non-bonded energy contributed the most negative component. At the end of the equilibration run (2500 ps), each SARA–CSGS mixture showed a well-converged energy profile, with no systematic drift in total energy. Notably, the total energy converged rapidly within the early stage of the simulation, after which only small fluctuations around the mean were observed. These features collectively confirmed that 2500 ps was sufficient to achieve energetic stability for System 1, and that the equilibrated trajectories could be used for subsequent structural and dynamical analyses. Throughout the trajectories, the relative magnitudes of the energy components remained consistent: the kinetic energy was dominant, the total and potential energies were smaller in magnitude, and the non-bonded term provided the largest negative contribution [26]. By the end of the equilibration run (2500 ps), all SARA–CSGS mixtures showed well-converged energy profiles with no systematic drift in total energy, indicating that the simulations were adequately equilibrated for subsequent analysis.
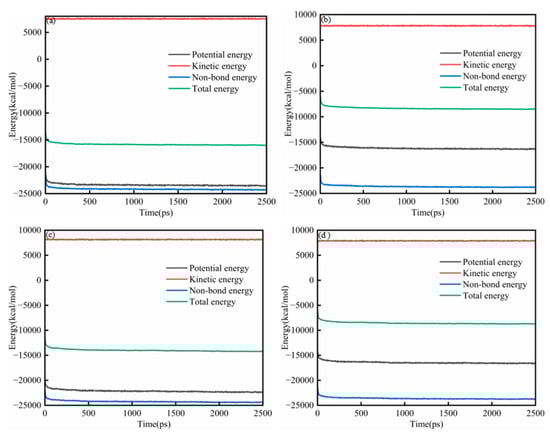
Figure 2.
Energy balance diagram of System 1: (a) saturates; (b) aromatics; (c) resins; and (d) asphaltenes.
3.1.2. CSGS-SARA Temperature Equilibrium
In MD simulations, temperature is not a property of an individual molecule; it is a statistical quantity defined from the kinetic energy of the atomic ensemble. The instantaneous temperature is defined at the system level and obtained from the total kinetic energy via the equipartition theorem, as expressed in Equation (4).
where K is the total kinetic energy of the system, kB is the Boltzmann constant, and f is the number of translational degrees of freedom after applying constraints. Figure 3a–d show the temperature diagram of System 1. In all cases, the temperature quickly settled into small fluctuations around the target value (298 K) and remained stable throughout the simulation, indicating that thermal equilibration was achieved and the trajectories were suitable for subsequent analysis. For the saturates–CSGS system (Figure 3a), the temperature was maintained within 292–304 K, with an average close to 298 K. Similar behavior was observed for the aromatics–CSGS (291–304 K; Figure 3b) and resins–CSGS systems (292–304 K; Figure 3c). The asphaltenes–CSGS system (Figure 3d) showed a comparably narrow range of 292–303 K and an average near 298 K. The temperature ranged from 292 to 305 K, corresponding to a maximum deviation of 2.35%. This fluctuation was minor and could be considered negligible, indicating that the trajectory was suitable for subsequent analysis and calculations. The variations in Figure 3 reflect normal fluctuations of the instantaneous system temperature, which can appear more or less pronounced depending on the coupling constant and the sampling interval. They do not indicate abnormal single-molecule behavior or insufficient equilibration [27].
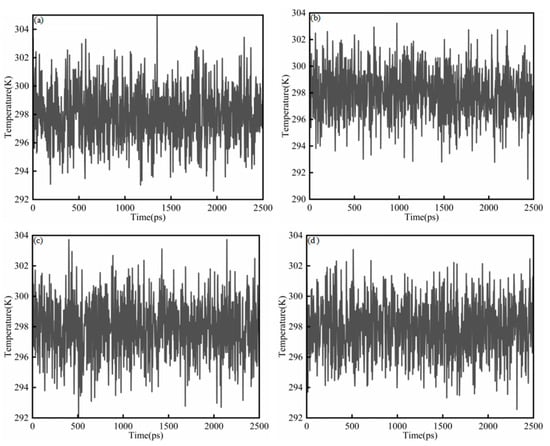
Figure 3.
Temperature equilibrium diagram of System 1: (a) saturates; (b) aromatics; (c) resins; and (d) asphaltenes.
3.1.3. CSGS-SARA MSD Analysis
The diffusion behavior of CSGS and SARA components was quantified using the diffusion coefficient (D); a higher D value indicates a greater diffusion capacity of the CSGS surfactant or SARA components within the system. The common unit is Å2/ps, calculated from the slope of MSD curves using the Einstein relation, as expressed in Equation (5).
where represents the MSD, and ri(0) and ri(t) are the position vectors of particle i at the initial time and time t, respectively. We performed a linear regression on the MSD–time plot within the equilibrated period (from 200 to 2000). The high corresponding correlation coefficient (R2) value obtained confirms that the term reached a constant value, satisfying the requirements for a valid diffusion analysis [28].
To further investigate the microscopic mobility of SARA components in the presence of CSGS, the MSD of the SARA components was analyzed as a function of simulation time (Figure 4a–d). The MSD of each component increases monotonically, consistent with ongoing diffusive motion throughout the simulations. As shown in Figure 4, the MSD profiles evolve through three regimes. During the early period (0–200 ps), the curves rise rapidly and then begin to level off, a pattern associated with structural relaxation as the initially nonequilibrium configuration approaches a steady state. From 200 to 2000 ps, the MSD shows approximately linear time dependence, indicating normal diffusion behavior [29]. Beyond 2000 ps, the curves show an abrupt increase. This apparent acceleration does not reflect a physical change in mobility but instead arises from the sharp reduction in the number of statistically independent time origins for averaging as the lag time (Δt) approaches the total trajectory length (T), which amplifies noise in the MSD estimate. The interval from 200 to 2000 ps was therefore used for linear fitting. D and corresponding R2 values were calculated from the Einstein relation and are listed in Table 3 to quantify the mobility of each component. Saturates and resins show comparatively higher diffusion coefficients, consistent with their lower molecular weights and weaker intermolecular constraints. In contrast, aromatics and asphaltenes display slower MSD growth in the early stages, together with noticeable local variations in slope, reflecting more restricted and heterogeneous motion [30]. The resulting D follows the descending order of: saturates > resins > aromatics > asphaltenes. These findings suggest that although the presence of CSGS enhances the dynamic dispersion of all SARA components, the intrinsic molecular structure remains the primary determinant in governing the ultimate diffusion rates [31].
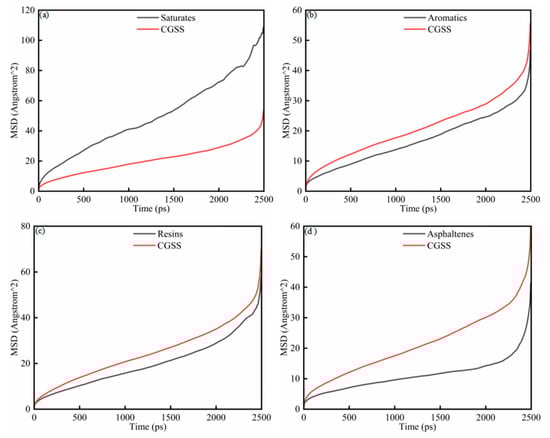
Figure 4.
MSD diagram of System 1: (a) saturates; (b) aromatics; (c) resins; and (d) asphaltenes.
Table 3.
Molecular diffusion coefficients of SARA components and CSGS.
Compared with prior MD studies that often focus on a single heavy-oil component or consider surfactant effects without a unified protocol, Table 3 enables a fraction-by-fraction comparison of mobility changes induced by CSGS under identical simulation settings. The resulting trend of higher mobility for light fractions and reduced mobility for heavier, more polar fractions supports the expected role of aromatic cores and heteroatom-containing structures in strengthening intermolecular association and slowing diffusion, as reported in previous heavy-oil MD literature [22,33].
3.1.4. CSGS-SARA RDF Analysis
Figure 5 shows the RDF for System 1. The RDF peak indicates the relative likelihood of finding the target species at a distance (r) from the reference species. When (g(r) > 1), the target species is enriched at that distance, and a locally ordered structure is present. A higher peak suggests a stronger tendency to form contacts or local coordination at that separation. When g(r) was to 1, the distribution becomes close to uniform, and the correlation weakens with distance. Figure 5a,b show the RDF for interactions among the SARA components and for CSGS–CSGS, respectively. In both cases, a sharp peak appears at very short distances (1 Å), followed by damped oscillations at larger distances and a gradual approach to (g(r)→1). It should be noted that a peak around 1 Å usually reflects extremely short-range geometric correlations; if the atom/group definitions are not sufficiently strict, this feature may include intramolecular correlations [32]. Therefore, this region is not suitable for judging the strength of intermolecular interactions. By contrast, features near 2.6–3.2 Å are commonly associated with hydrogen-bond or electrostatics-dominated close contacts, while the 3.4–4.5 Å range typically matches van der Waals contact distances [35]. For aromatic-rich components, this range may also be consistent with the tight packing of aromatic structures. Figure 5c shows the RDF between CSGS and SARA components. In all cases, g(r) increases rapidly from near 2 to a broad maximum in the 4–8 Å range and then gradually converges to g(r) ≈ 1 at larger distances (>12 Å). The curve intensities differ across components. In the near-contact region (especially within the 3.4–4.5 Å range where van der Waals contacts are expected to dominate), the saturates–CSGS pair shows a higher overall (g(r)), indicating that CSGS is more likely to form close local contacts and coexist with saturates. In contrast, the aromatics–CSGS curve has a lower (g(r)), suggesting a lower probability of short-range contact with CSGS, while resins–CSGS and asphaltenes–CSGS fall in between. Overall, the differences in RDF peak intensity reflect distinct tendencies for local enrichment and contact between CSGS and the various SARA components near the interface.
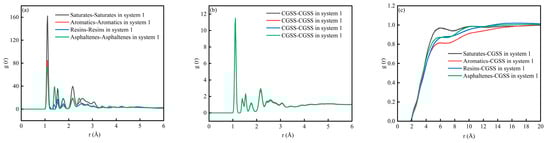
Figure 5.
RDF diagram of System 1: (a) SARA-SARA System 1; (b) CSGS-CSGS in System 1; and (c) CSGS-SARA in System 1.
3.1.5. CSGS-SARA Concentration Analysis
Figure 6a–c present the concentration distributions of SARA components on the Z, X, and Y axes within the CSGS system, showing distinct adsorption behaviors among the different planes. In Figure 6, the relative concentration profiles of all components reveal significant structural fluctuations. Within the 0–45 Å range, the relative concentration profiles calculated along the X, Y, and Z directions showed clear component-dependent differences. Saturates and aromatics displayed larger-amplitude oscillations with higher peaks, whereas resins and asphaltenes remained at lower levels and exhibited much flatter distributions. This behavior is consistent with molecular mobility and cohesion. Saturates and aromatics are generally smaller and more flexible, with weaker cohesive constraints, which leads to faster diffusion and more frequent crossing of spatial bins; as a result, their concentration profiles show more pronounced peak–valley variations and a higher probability of local enrichment [36]. In contrast, resins and asphaltenes have larger molecular masses, more developed aromatic cores, and often contain polar groups. Their stronger intermolecular interactions favor the formation and persistence of localized clusters, keeping them confined to limited regions for longer times and yielding lower average relative concentrations across most spatial slices, producing the characteristically low and flat profiles [37]. Figure 7a–c show the CSGS concentration diagram of System 1. As illustrated in Figure 7, the relative concentration values across the three dimensions fluctuate primarily within a narrow range of 0.6 to 1.3. These oscillations represent typical instantaneous density variations inherent in a well-equilibrated amorphous state. The absence of localized high-intensity peaks in the profiles confirms that no significant molecular aggregation of the surfactant has occurred within the oil matrix, indicating that the CSGS molecules are effectively dispersed throughout the system.
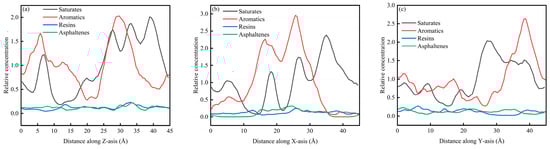
Figure 6.
SARA concentration diagram of System 1: (a) distance along Z axis; (b) distance along X axis; and (c) distance along Y axis.
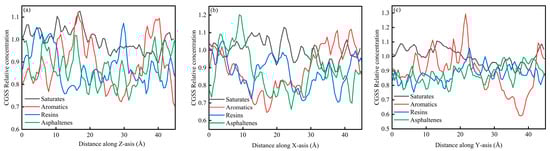
Figure 7.
CSGS concentration diagram of System 1: (a) distance along Z axis; (b) distance along X axis; and (c) distance along Y axis.
From the concentration profiles, CSGS remains broadly dispersed in the bulk oil phase, without forming pronounced surfactant-rich domains, which contrasts with many reported surfactants, which tend to self-associate and reduce effective contact with oil components. This uniform distribution is advantageous for extraction/dispersion across the full SARA spectrum because it enables sustained interaction with both light fractions (saturates/aromatics, showing stronger spatial fluctuations consistent with higher mobility) and heavy fractions (resins/asphaltenes). In other words, the concentration analysis suggests that CSGS can provide “whole-system coverage” rather than acting only locally, which is beneficial for simultaneous handling of all four SARA components.
3.1.6. CSGS-SARA Diffusion-Frame Number Analysis
Figure 8a–d present the diffusion-frame number of the SARA components in CSGS in System 1, providing direct visual support for the trends discussed above. Overall, the SARA components showed clearly different migration ranges and spatial footprints in the presence of CSGS, indicating that CSGS promoted dispersion and dissolution in a component-dependent manner. Saturates exhibited some local clustering at the early stage, but their trajectory coverage rapidly expanded, suggesting that the aggregates gradually dissociated under the action of CSGS and dispersed into the solvent phase. Resins and asphaltenes also underwent a transition from aggregation to dispersion; however, their trajectory expansion and spatial coverage were much smaller than those of saturates, implying stronger local constraints on their mobility, consistent with their slower MSD growth and lower diffusivity. In particular, the asphaltene trajectories stabilized within a relatively short time and showed the smallest spatial footprint, indicating the most restricted motion. Consistent with the MSD results, the overall diffusion capability in System 1 followed the order: saturates > aromatics ≈ resins > asphaltenes.
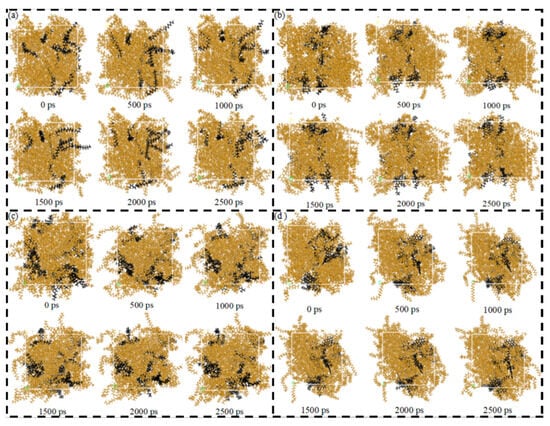
Figure 8.
Diffusion-frame number plot of SARA components in CSGS in System 1: (a) saturates; (b) aromatics; (c) resins; and (d) asphaltenes (yellow = CSGS; black = SARA components).
3.2. CSGS–SARA–CaCO3 System
3.2.1. CSGS-SARA-CaCO3 Energy Balance Analysis
Figure 9a–d illustrate the energy balance diagrams of System 2. The energies show pronounced relaxation during the first 0–50 ps, followed by plateaus over 200–2500 ps, indicating that equilibrium was attained. The relative ordering of energy components remained consistent across all trajectories: kinetic energy was the largest contribution, followed by the total and potential energies, while the non-bonded term provided the most negative contribution. After the initial relaxation, the total energy showed no discernible long-time drift, indicating adequate energy convergence for the analyses that follow. System 2 mirrors System 1 in its overall energetic evolution, but the plateau regime carries a clear message: the non-bonded term reaches its minimum and dominates the energy budget, consistent with an interface controlled by van der Waals and electrostatic interactions rather than any covalent contribution. The key difference is quantitative. Non-bonded interactions are markedly stronger in System 2 than in System 1, implying that the CaCO3 substrate promotes a more stable interfacial structure and a tighter energetic anchoring. Such strengthening is typically accompanied by higher adsorption affinity and reduced molecular mobility, consistent with more constrained diffusion of the participating components [38,39,40].
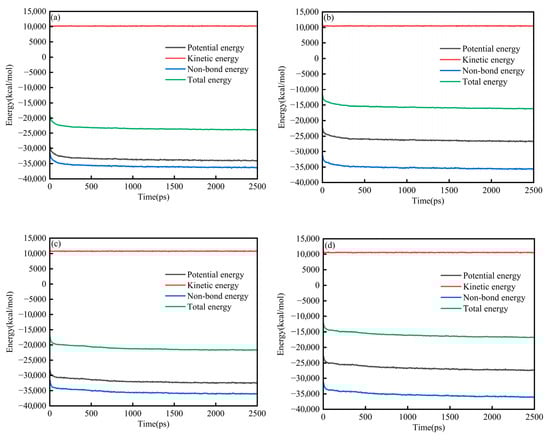
Figure 9.
Energy balance diagram of System 2: (a) saturates; (b) aromatics; (c) resins; and (d) asphaltenes.
3.2.2. CSGS-SARA-CaCO3 Temperature Equilibrium Analysis
Figure 10a–d present the temperature equilibrium diagrams of System 2. In each system, the temperature trace showed only small-amplitude fluctuations and settled into a stable regime as the simulation progressed. The overall temperature in each system remained close to 298 K, indicating that temperature equilibrium had been achieved and that the simulation data were reliable. Specifically, the saturates–CSGS system spans 293–304 K (Figure 10a), the aromatics–CSGS system 292–302 K (Figure 10b), the resins–CSGS system 293–303 K (Figure 10c), and the asphaltenes–CSGS system 292–304 K (Figure 10d); in each case the mean temperature is 298 K.
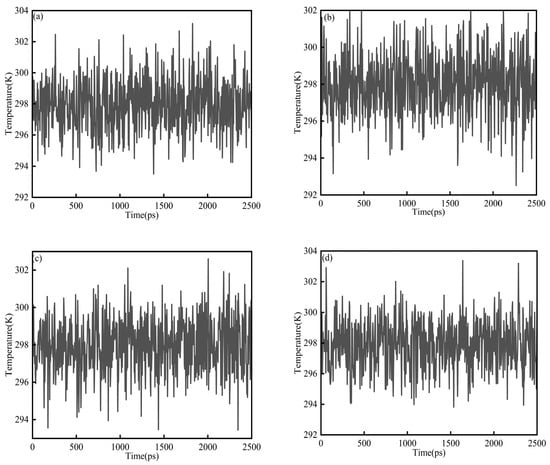
Figure 10.
Temperature equilibrium diagram of System 2: (a) saturates; (b) aromatics; (c) resins; and (d) asphaltenes.
3.2.3. CSGS-SARA-CaCO3 MSD Analysis
To assess the displacement behavior of CSGS under a mineral constraint, we examined the MSD in System 2 (Figure 11a–d). In every case, the MSD increases monotonically for both the SARA fractions and CSGS, consistent with sustained diffusive motion. The trajectories exhibit the same three-regime pattern observed in System 1. A clear linear window is observed between 200 and 2000 ps in Figure 11; this interval was used for regression, and the resulting D values with the corresponding R2 values are summarized in Table 4. The calculated D values follow: saturates > resins > aromatics > asphaltenes, aligning with the trend observed in System 1. This correlation underscores that the intrinsic molecular architecture of SARA components remains the primary determinant governing oil recovery rates. Saturates diffuse most rapidly and show little discernible sensitivity to the CaCO3 surface, a behavior consistent with their simpler molecular frameworks and weak non-bonded affinity for the substrate. Mobility is much more limited for aromatics, resins, and asphaltenes; their polycyclic aromatic cores and heteroatom-bearing functionalities favor stronger non-bonded interactions with CaCO3, increasing interfacial resistance and restricting diffusion. This inhibitory effect is most pronounced in asphaltenes, which possess the highest degree of aromaticity and the most extensive ring systems [40].
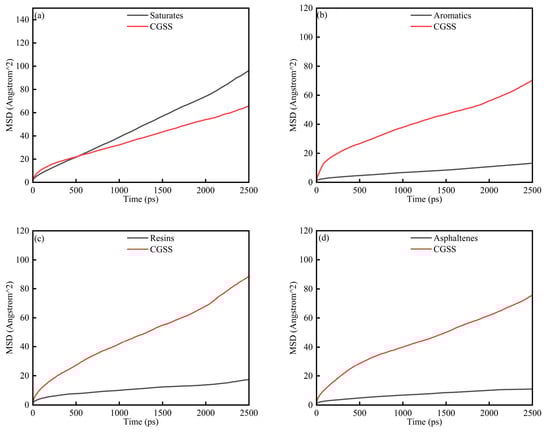
Figure 11.
MSD diagram of System 2: (a) saturates; (b) aromatics; (c) resins; and (d) asphaltenes.
Table 4.
Molecular diffusion coefficients of SARA components and CSGS in CaCO3.
Adding the CaCO3 layer introduced interfacial confinement and reduced mobility relative to System 1, consistent with earlier calcite-interface simulations that showed adsorption and geometric restrictions suppressed transport. Importantly, CSGS remained mobile enough to access the oil–mineral region, enabling competitive adsorption effects discussed below. A limitation is that only one calcite surface orientation and one water content were considered, whereas real reservoirs can involve defects, brines, and variable surface states.
3.2.4. CSGS-SARA-CaCO3 RDF Analysis
To quantify the atomistic affinity of CSGS for the calcite surface, radial distribution functions, g(r), were evaluated between surface Ca atoms and the key atoms of CSGS (C, O, and S), together with the representative atoms of the SARA components (Figure 12a–d). The RDF describes the probability of finding an atom pair at a separation r during adsorption, and the position and magnitude of the first maximum provide a direct measure of short-range interfacial association. Across all four environments, CSGS exhibits clear first-shell features at small r, indicating that the surfactant is enriched at the carbonate interface through localized, Ca-centered interactions rather than solely through diffuse, long-range attraction. Beyond the first coordination shell, broader and weaker peaks extend to larger r, consistent with additional stabilization from van der Waals and electrostatic contributions within the interfacial layer.
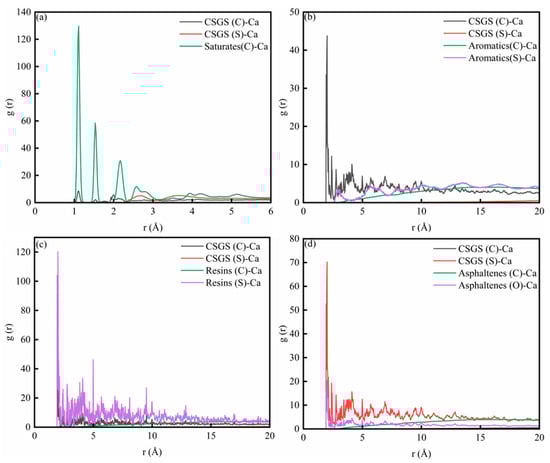
Figure 12.
RDF diagram of System 2: (a) saturates; (b) aromatics; (c) resins; and (d) asphaltenes.
Importantly, the relative contributions of different atom types vary across oil fractions. In the saturate-containing system (Figure 12a), the oil–Ca correlation is comparatively prominent, while the CSGS–Ca signatures are mainly expressed through the headgroup atoms and remain more localized. In the aromatic- and resin-containing systems (Figure 12b,c), the CSGS–Ca correlations become more pronounced, indicating a tighter surfactant-controlled interfacial organization. In the asphaltene-containing system (Figure 12d), the interfacial association is dominated by the polar headgroup contribution, with a particularly strong near-surface signal for the sulfonate-related interaction, consistent with enhanced binding of CSGS at Ca sites. Taken together, the research indicated that that CSGS adsorption on calcite is governed by short-range Ca-centered interactions whose strength and dominant atomistic channel depend on the local SARA structures, providing structural support for a competitive-adsorption picture of interfacial restructuring and component displacement near the mineral surface [41,42].
3.2.5. CSGS-SARA-CaCO3 Concentration Analysis
In System 2, the CaCO3 substrate exhibits a well-defined crystalline lattice structure with the surface exposed along the (001) crystallographic plane. Consequently, the analysis of concentration profiles in this system was conducted exclusively along the C (001) direction. Figure 13 illustrates the concentration distribution characteristics of the SARA components and CSGS on the CaCO3 (001) surface. As shown in Figure 13a, the region from 0 to 12.50 Å corresponds to the internal lattice of the CaCO3 crystal, where no concentration curves are observed. The SARA components are primarily distributed within the interfacial region (12.50–30 Å), with the primary concentration peaks for saturates, aromatics, resins, and asphaltenes located at 16.59 Å, 15.27 Å, 16.17 Å, and 15.40 Å, respectively. Overall, the spatial distribution characteristics of the SARA components are consistent with the diffusion trends observed in the MSD analysis. Overall, the peaks for saturates and resins are located farther from the CaCO3 surface, which can be attributed to their lower aromaticity or fewer aromatic structures, indicating a weaker affinity for the mineral surface. In contrast, the aromatics and asphaltenes exhibit concentration maxima shifted toward the calcite surface, indicating a stronger interfacial preference. This trend agrees with prior simulations showing that π–surface contacts, together with polar functionalities, can enhance the adsorption of aromatic-rich species on carbonate minerals [43]. As shown in Figure 13b, CSGS is also enriched near the CaCO3 surface within the saturate-dominated region, suggesting that the surfactant preferentially accumulates at the mineral interface and promotes local redistribution of saturates, thereby facilitating their dispersion and near-surface transport. Mechanistically, CSGS can displace oil molecules from CaCO3 via competitive adsorption, thereby modifying surface wettability and improving oil removal during oil sands washing [44].
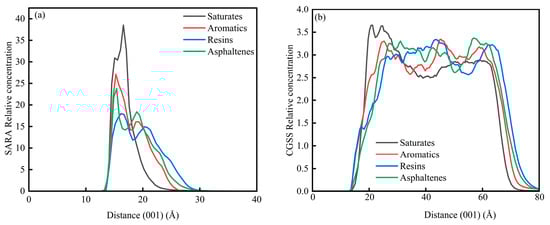
Figure 13.
Concentration diagram of C (001) in the System 2: (a) SARA components and (b) CSGS.
The concentration profiles indicate that CSGS preferentially accumulates at the CaCO3 (001) interface, within the same near-surface region where the aromatic-rich fractions (aromatics/asphaltenes) show their strongest enrichment in System 2. Such interfacial localization is beneficial for carbonate reservoirs because it places the surfactant directly at the oil–mineral contact, where competitive adsorption can reduce oil–surface affinity, consistent with mechanisms reported for carbonate/oil-sands washing systems. By contrast, in System 1, CSGS remains broadly distributed throughout the bulk phase and shows little self-aggregation, suggesting sustained accessibility to all SARA fractions. Overall, these profiles support a dual action of CSGS: bulk-phase dispersion and interface-focused enrichment that facilitate the desorption of strongly adsorbing aromatic components.
3.2.6. CSGS-SARA-CaCO3 Diffusion-Frame Number Analysis
Figure 14a–d show the diffusion plot number of the SARA components in System 2. For all components, the trajectory coverage gradually expanded with simulation time and then leveled off at later stages, indicating that the diffusion behavior approached a dynamic steady state. From the evolution of the molecular configurations, the SARA components generally formed local aggregates or clusters at the beginning, which then progressively dissociated and dispersed into the CSGS phase as the simulation proceeded. This suggests that CSGS still provided a dispersing and stabilizing effect, reducing further growth or repeated re-aggregation of the clusters. However, compared with the CaCO3-free system, the trajectory expansion in System 2 was clearly more limited. This indicates that the presence of the CaCO3 ore layer imposed additional constraints on molecular migration. On the one hand, the mineral surface could restrict the motion of some molecules through adsorption or local confinement. On the other hand, geometric confinement introduced by the ore layer could reduce the effective diffusion pathways, making molecules more likely to remain within a restricted region. As a result, the trajectory footprints became smaller and expanded more slowly.
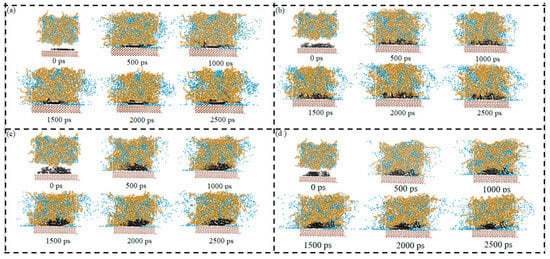
Figure 14.
Diffusion-frame number plot of SARA components in CSGS in System 2: (a) saturates; (b) aromatics; (c) resins; and (d) asphaltenes (yellow = CSGS; black = SARA components; blue = water).
Overall, the diffusion-frame analysis provided direct visual support for the transport limitation in the mineral-containing system. Although CSGS promoted gradual dispersion, CaCO3 still reduced the overall migration scale. Diffusion was less extensive than in the system without CaCO3. This observation also provides visual evidence supporting the earlier discussion of interfacial confinement, component enrichment, and diffusion differences in the mineral-containing environment.
3.3. Practical Implications and Future Work
The SARA analysis is shown in Figure 15. As shown in Figure 15, the surfactant could enhance the heavy component (resins, asphaltenes) content, and the light components (saturates, aromatics) would decrease, and the results were in accordance with the simulation results, which indicated that the surfactant had an interaction with the heavy components.
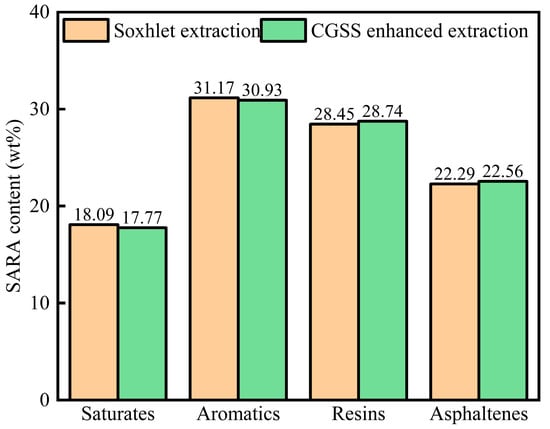
Figure 15.
The SARA of heavy oil by Soxhlet extraction and CSGS-enhanced extraction methods.
The practical implications of this paper are as follows: (1) Surfactant design for carbonate reservoirs and oil-sands processing. This work’s results suggest that achieving high oil recovery requires balancing two aspects: (i) promoting bulk-phase dispersion to reduce aggregation and viscosity (System 1); and (ii) ensuring strong interfacial affinity to carbonate surfaces to facilitate heavy-oil detachment (System 2). (2) The differences among SARA components in mobility and interfacial enrichment provide useful guidance for tuning the gemini surfactant structure, including the polarity of the headgroups and the architecture of the hydrophobic chains.
Future work will focus on the following aspects: (1) introducing a broader diversity of SARA molecules and more realistic mixed heavy-oil models, while systematically examining the effects of salinity/ion type, water content, temperature, and surfactant concentration; and (2) exploring a wider range of carbonate surfaces and defect structures, different surface charge states, and competitive ion environments, so that the simulations better represent reservoir and oil-sands conditions.
3.4. Limitations
This study aimed to clarify, at the molecular level, how CSGS interacts with representative SARA components in a bulk heavy-oil system (System 1) and in a carbonate-constrained interfacial environment (System 2). Nevertheless, several limitations should be noted. (1) Each SARA component was represented by a limited number of model molecules. Although these models captured the main structural features, real heavy oil exhibits much broader chemical diversity; therefore, quantitative trends may vary with greater molecular diversity and different resin/asphaltene architectures. (2) Molecular dynamics simulations are inherently limited by nanometer length scales and nanosecond time scales, and the systems were constructed under controlled compositions. As a result, the present findings are best interpreted as mechanistic insights and relative trends, rather than as direct quantitative predictions of field-scale recovery or separation efficiency. (3) Real reservoir conditions involve additional factors that were not explicitly included here, such as salinity and multivalent ions, variations in water content, mineral surface defects and heterogeneity, and a wider range of temperature and pressure conditions. Future work will incorporate broader SARA molecular diversity, more realistic aqueous/brine chemistry, and different carbonate surface states, and will further connect the molecular descriptors used here to experimentally measurable macroscopic observables (interfacial tension and wettability changes).
4. Conclusions
This work used MD simulations to clarify how a carboxylate–sulfonate gemini surfactant (CSGS) interacts with representative heavy-oil SARA components in both a homogeneous bulk phase (System 1) and a CaCO3-containing interfacial environment (System 2). In System 1, CSGS remained well dispersed and gradually disrupted the local clusters formed by the heavier fractions, leading to a more homogeneous distribution and improved molecular mobility. The simulations indicated that the mobility of the SARA components was largely governed by molecular structure: saturates and aromatics diffused more readily than resins and asphaltenes, while CSGS helped promote dispersion and reduced persistent aggregation. When a CaCO3 substrate was introduced (System 2), the system evolved from a disordered bulk phase to a more confined interfacial structure. CSGS tended to accumulate at the heavy-oil–CaCO3 interfacial region, resulting in clear enrichment and thereby weakening the retention of heavy-oil components on the mineral surface. However, the presence of CaCO3 also strengthened the interactions among SARA molecules and, compared with the CaCO3-free system, significantly restricted molecular diffusion.
Author Contributions
Conceptualization, W.W. (Wu Wen), Y.W., J.D., C.N.; methodology, W.W. (Wu Wen), Y.W., J.H.; software, S.Z., W.W. (Wenwen Wang); validation, W.W. (Wenjuan Wang), Y.S.; formal analysis, J.H., J.D., W.W. (Wenjuan Wang), C.N.; investigation, J.H., J.D., C.N.; resources, J.H.; data curation, J.H.; writing—original draft preparation, W.W. (Wu Wen), J.D., C.N.; writing—review and editing, J.H., J.D., C.N.; visualization, J.D., C.N.; supervision, J.D.; project administration, J.D.; funding acquisition, J.D. and C.N. All authors have read and agreed to the published version of the manuscript.
Funding
This Project is Supported by Hainan Provincial Research Institute Technology Innovation Project (KYYSGY2024-004), Key Research and Development Program of Hainan Province (ZDYF2024SHFZ136), Ningbo Natural Science Foundation (2023J393), Hainan Provincial Natural Science Foundation of China (224QN187), Open Project Program of Shandong Engineering Research Center for Environmental Protection and Remediation on Groundwater (801KF2025-6), Hainan Province Graduate Innovation Research Project (Qhys2024-104), Experimental Teaching Center for Basic Chemistry, School of Chemistry and Chemical Engineering, Hainan University (S202510589135, SA2500002086).
Institutional Review Board Statement
Not applicable.
Informed Consent Statement
Not applicable.
Data Availability Statement
The data will be made available on request.
Conflicts of Interest
The authors declare no conflicts of interest.
References
- He, L.; Lin, F.; Li, X.G.; Sui, H.; Xu, Z.H. Interfacial sciences in unconventional petroleum production: From fundamentals to applications. Chem. Soc. Rev. 2015, 44, 5446–5494. [Google Scholar] [CrossRef]
- Rao, F.; Liu, Q. Froth treatment in Athabasca oil sands bitumen recovery process: A review. Energy Fuels 2013, 27, 7199–7207. [Google Scholar] [CrossRef]
- Santos, R.G.; Loh, W.; Bannwart, A.C.; Trevisan, O.V. An overview of heavy oil properties and its recovery and transportation methods. Braz. J. Chem. Eng. 2014, 31, 571–590. [Google Scholar] [CrossRef]
- Lin, F.; Stoyanov, S.R.; Xu, Y. Recent advances in nonaqueous extraction of bitumen from mineable oil sands: A review. Org. Process Res. Dev. 2017, 21, 492–510. [Google Scholar] [CrossRef]
- Alimohammadi, S.; Zendehboudi, S.; James, L. A comprehensive review of asphaltene deposition in petroleum reservoirs: Theory, challenges and tips. Fuel 2019, 252, 753–791. [Google Scholar] [CrossRef]
- Chen, Q.; Liu, Q. Bitumen Coating on Oil Sands Clay Minerals: A Review. Energy Fuels 2019, 33, 5933–5943. [Google Scholar] [CrossRef]
- Dang-Vu, T.; Jha, R.; Wu, S.Y.; Tannant, D.D.; Masliyah, J.; Xu, Z. Wettability determination of solids isolated from oil sands. Colloids Surf. A Physicochem. Eng. Asp. 2009, 337, 80–90. [Google Scholar] [CrossRef]
- Wang, D.; Wang, D.; Tan, X.; Yeung, A.; Liu, Q. A review of the roles of constituent minerals and residual bitumen in the solid-liquid separation of oil sands tailings. J. Hazard. Mater. 2023, 454, 131178. [Google Scholar] [CrossRef]
- Wang, T.; Zhang, C.; Zhao, R.; Zhu, C.; Yang, C.; Liu, C. Solvent Extraction of Bitumen from Oil Sands. Energy Fuels 2014, 28, 2297–2304. [Google Scholar] [CrossRef]
- Alvarez-Majmutov, A.; Gieleciak, R.; Chen, J. Modeling the molecular composition of vacuum residue from oil sand bitumen. Fuel 2019, 241, 744–752. [Google Scholar] [CrossRef]
- Fu, L.P.; Zhang, G.C.; Ge, J.J.; Liao, K.L.; He, Y.F.; Wang, X.; Li, H.T. Study on dual-frequency ultrasounds assisted surfactant extraction of oil sands. Fuel Process. Technol. 2017, 167, 146–152. [Google Scholar] [CrossRef]
- Gates, I.D. Solvent-aided steam-assisted gravity drainage in thin oil sand reservoirs. J. Pet. Sci. Eng. 2010, 74, 138–146. [Google Scholar] [CrossRef]
- Ruan, J.X.; Liu, C.L.; Su, Z.H.; Ma, Y.X.; Zhu, Z.Y.; Wang, Y.L.; Cui, P.Z. Applications and microscopic mechanism analysis of deep eutectic solvents in liquid–liquid extraction. J. Ind. Eng. Chem. 2025, 144, 18–31. [Google Scholar] [CrossRef]
- Sui, H.; Ma, G.Q.; He, L.; Zhang, Z.S.; Li, X.G. Recovery of heavy hydrocarbons from Indonesian carbonate asphalt rocks. Part 1: Solvent extraction, particle sedimentation, and solvent recycling. Energy Fuels 2016, 30, 9242–9249. [Google Scholar] [CrossRef]
- Liu, R.H.; Wang, H.Y.; Wang, G.J.; Bai, W.H.; Zhao, Q. Potentials and prospects of tar sands resources in China. Nat. Gas Ind. 2009, 29, 126–128. [Google Scholar] [CrossRef]
- Zhang, Y.; Zhang, Y.X.; Ding, M.S.; Wu, Y.Z.; Gao, H.T.; Qu, Z.; Zang, W.K. Multi-scale evaluation of surfactant effects on asphalt desorption behavior from oil sand surfaces. Surf. Interfaces 2024, 55, 105314. [Google Scholar] [CrossRef]
- Zhang, C.; Oostrom, M.; Wietsma, T.W.; Grate, J.W.; Warner, M.G. Influence of viscous and capillary forces on immiscible fluid displacement: Pore-scale experimental study in a water-wet micromodel demonstrating viscous and capillary fingering. Energy Fuels 2011, 25, 3493–3505. [Google Scholar] [CrossRef]
- Tofigh, S.; Rafat, P.; Masoud, R.; Yousef, K. An insight into the effect of surface-active agents on the interfacial viscosity and stability of oil-in-water emulsions. J. Mol. Liq. 2025, 323, 127370. [Google Scholar] [CrossRef]
- Zhou, Y.; Yin, D.; Chen, W.; Liu, B.; Zhang, X. A comprehensive review of emulsion and its field application for enhanced oil recovery. Energy Sci. Eng. 2019, 7, 1046–1058. [Google Scholar] [CrossRef]
- Liu, P.; Li, X.H.; Li, H.; Liu, S.H.; Wang, J.Q.; Zhang, P. Application and synthesis of gemini surfactant in heavy oil development. ACS Omega 2025, 10, 8832–8842. [Google Scholar] [CrossRef]
- Cheng, Y.; Yuan, S. Emulsification of Surfactant on Oil Droplets by Molecular Dynamics Simulation. Molecules 2020, 25, 3008. [Google Scholar] [CrossRef]
- Yang, S.; Liu, P.; Deng, S.; Wang, Y. Oil Detachment Mechanism in Natural Surfactant Flooding from Silica Surface: Molecular Dynamics Simulation. SPE J. 2024, 29, 2662–2671. [Google Scholar] [CrossRef]
- Bai, S.; Kubelka, J.; Piri, M. Wettability Reversal on Dolomite Surfaces by Divalent Ions and Surfactants: An Experimental and Molecular Dynamics Simulation Study. Langmuir 2021, 37, 6641–6649. [Google Scholar] [CrossRef]
- Liang, H.; Liu, X.; Jia, Y.; Jiang, H.; Xu, Y. Mechanistic Study of the Effects of Surfactants and Asphaltenes on the Action of Emulsions with Different Water Contents: Based on Dissipative Particle Dynamics. Energy Fuels 2024, 38, 7758–7772. [Google Scholar] [CrossRef]
- Li, B.; Liu, G.; Xing, X.; Chen, L.; Lu, X.; Teng, H.; Wang, J. Molecular dynamics simulation of CO2 dissolution in heavy oil resin-asphaltene. J. CO2 Util. 2019, 30, 303–310. [Google Scholar] [CrossRef]
- Sun, H. COMPASS: An Ab Initio Force-Field Optimized for Condensed-Phase Applications—Overview with Details on Alkane and Benzene Compounds. J. Phys. Chem. B 1998, 102, 7338–7364. [Google Scholar] [CrossRef]
- Berendsen, H.J.C.; Postma, J.P.M.; van Gunsteren, W.F.; Di Nola, A.; Haak, J.R. Molecular Dynamics with Coupling to an External Bath. J. Chem. Phys. 1984, 81, 3684–3690. [Google Scholar] [CrossRef]
- Maginn, E.J.; Messerly, R.A.; Carlson, D.J.; Roe, D.R.; Elliott, J.R. Best Practices for Computing Transport Properties 1: Self-Diffusivity and Viscosity from Equilibrium Molecular Dynamics. Living J. Comput. Mol. Sci. 2018, 1, 6324. [Google Scholar] [CrossRef]
- Bullerjahn, J.T.; von Bülow, S.; Hummer, G. Optimal Estimates of Self-Diffusion Coefficients from Molecular Dynamics Simulations. J. Chem. Phys. 2020, 153, 024116. [Google Scholar] [CrossRef]
- Wu, G.; He, L.; Chen, D. Sorption and Distribution of Asphaltene, Resin, Aromatic and Saturate Fractions of Heavy Crude Oil on Quartz Surface: Molecular Dynamic Simulation. Chemosphere 2013, 92, 1465–1471. [Google Scholar] [CrossRef]
- Headen, T.F.; Boek, E.S.; Jackson, G.; Totton, T.S.; Müller, E.A. Simulation of Asphaltene Aggregation through Molecular Dynamics: Insights and Limitations. Energy Fuels 2017, 31, 1108–1125. [Google Scholar] [CrossRef]
- Willock, D.J. Molecular Dynamics 1. ISIS Neutron Training Course Lecture Notes. 2014. Available online: https://www.isis.stfc.ac.uk/Pages/md-lecture-1.pdf (accessed on 31 December 2025).
- Ahmadi, M.; Chen, Z.X. Comprehensive molecular scale modeling of anionic surfactant-asphaltene interactions. Fuel 2021, 288, 119729. [Google Scholar] [CrossRef]
- Yuan, S.D.; Wang, S.Y.; Wang, X.Y.; Guo, M.M.; Wang, Y.D.; Wang, D.S. Molecular dynamics simulation of oil detachment from calcite surface in aqueous surfactant solution. Comput. Theor. Chem. 2016, 1092, 82–89. [Google Scholar] [CrossRef]
- Keffer, D. Structural Properties from Molecular Dynamics Simulation. University of Tennessee Lecture Notes. 2016. Available online: https://utkstair.org/clausius/docs/mse614/pdf/structure_intro_v01.pdf (accessed on 31 December 2025).
- Shishehbor, M.; Esmaeeli, H.S.; Pouranian, M.R. The Adhesion and Diffusion of Saturate, Asphaltene, Resin and Aromatic (SARA) Molecules on Oxygenated and Hydrogenated Carbon Nanotubes (CNTs). Infrastructures 2021, 6, 123. [Google Scholar] [CrossRef]
- Liu, X.Y.; Gao, J.Z.; Huang, A.; Lei, Y.; Chen, Y.Q. Ionic liquid-ethanol mixed solvent design exemplified for the decarbonization of shale gas and biogas. Chem. Eng. Sci. 2024, 293, 120022. [Google Scholar] [CrossRef]
- Hou, J.; Liu, X.; Liu, C.; Liu, Y.; Zhang, Q. Study of the Adsorption Behavior of Surfactants on Calcite Surface by Molecular Dynamics Simulation. Molecules 2022, 27, 2195. [Google Scholar] [CrossRef]
- Bahmani, P.; Manteghian, M.; Jafari, A.; Tohidi, Z.; Pahlavanzadeh, H. Molecular dynamics simulation of surface roughness effect on oil adsorption and detachment onto calcite surface. J. Mol. Liq. 2025, 439, 128758. [Google Scholar] [CrossRef]
- Fenter, P.; Qin, T.; Lee, S.S.; AlOtaibi, M.B.; Ayirala, S.; Yousef, A.A. Molecular-scale origins of wettability at petroleum–brine–carbonate interfaces. Sci. Rep. 2020, 10, 20507. [Google Scholar] [CrossRef]
- Hakim, S.S.; Olsson, M.H.M.; Sørensen, H.O.; Bovet, N.; Bohr, J.; Feidenhans’l, R.; Stipp, S.L.S. Interactions of the Calcite {10.4} Surface with Organic Compounds: Structure and Behaviour at Mineral–Organic Interfaces. Sci. Rep. 2017, 7, 7592. [Google Scholar] [CrossRef] [PubMed]
- Hou, J.J.; Lin, S.L.; Du, J.Z.; Sui, H. Study of the Adsorption Behavior of Surfactants on Carbonate Surface by Experiment and Molecular Dynamics Simulation. Front. Chem. 2022, 10, 847986. [Google Scholar] [CrossRef]
- Alvim, R.S.; Lima, F.C.D.A.; Sánchez, V.M.; Headen, T.F.; Boek, E.S.; Miranda, C.R. Adsorption of asphaltenes on the calcite (10.4) surface by first-principles calculations. RSC Adv. 2016, 6, 95328–95336. [Google Scholar] [CrossRef]
- Ahmadi, M.; Chen, Z. Spotlight onto surfactant–steam–bitumen interfacial behavior via molecular dynamics simulation. Sci. Rep. 2021, 11, 19660. [Google Scholar] [CrossRef] [PubMed]
- Hue, K.Y.; Lew, J.H.; Myo Thant, M.M.; Matar, O.K.; Luckham, P.F.; Müller, E.A. Molecular Dynamics Simulation of Polyacrylamide Adsorption on Calcite. Molecules 2023, 28, 6367. [Google Scholar] [CrossRef]
- Pétuya, R.; Punase, A.; Bosoni, E.; de Oliveira Filho, A.P.; Sarria, J.; Purkayastha, N.; Wylde, J.J.; Mohr, S. Molecular Dynamics Simulations of Asphaltene Aggregation: Machine-Learning Identification of Representative Molecules, Molecular Polydispersity, and Inhibitor Performance. ACS Omega 2023, 8, 4862–4877. [Google Scholar] [CrossRef]
- Chai, R.K.; Liu, Y.T.; He, Y.T.; Liu, Q.J.; Xue, L. Dynamic behaviors and mechanisms of fluid-fluid interaction in low salinity waterflooding. J. Pet. Sci. Eng. 2022, 208, 109256. [Google Scholar] [CrossRef]
- Hou, J.J.; Du, J.Z.; Sui, H.; Sun, L.Y. Surfactants Enhanced Heavy Oil–Solid Separation from Carbonate Asphalt Rocks—Experiment and Molecular Dynamic Simulation. Nanomaterials 2021, 11, 1835. [Google Scholar] [CrossRef] [PubMed]
- Sun, H.; Jin, Z.; Yang, C.; Akkermans, R.L.; Robertson, S.H.; Spenley, N.A.; Miller, S.; Todd, S.M. COMPASS II: Extended coverage for polymer and drug-like molecule databases. J. Mol. Model. 2016, 22, 47. [Google Scholar] [CrossRef] [PubMed]
- Xu, Z.; Xiong, Z.; Gong, M.; Zeng, Q.; Hong, J.; Fan, J. Molecular dynamics-based study of the modification mechanism of asphalt by graphene oxide. J. Mol. Model. 2023, 29, 368. [Google Scholar] [CrossRef]
- Sun, H.; Ren, P.; Fried, J.R. The COMPASS force field: Parameterization and validation for phosphazenes. Comput. Theor. Polym. Sci. 1998, 8, 229–246. [Google Scholar] [CrossRef]
- Eftekhari, A.; Amin, J.S.; Zendehboudi, S. A molecular dynamics approach to investigate effect of pressure on asphaltene self-aggregation. J. Mol. Liq. 2023, 376, 121347. [Google Scholar] [CrossRef]
- Braun, E.; Gilmer, J.; Mayes, H.B.; Mobley, D.L.; Monroe, J.I.; Prasad, S.; Zuckerman, D.M. Best Practices for Foundations in Molecular Simulations. Living J. Comput. Mol. Sci. 2019, 1, 5957. [Google Scholar] [CrossRef] [PubMed]
- Hou, J.J.; Sui, H.; Du, J.Z.; Sun, L.Y. Synergistic effect of silica nanofluid and biosurfactant on bitumen recovery from unconventional oil. J. Dispers. Sci. Technol. 2020, 43, 704–715. [Google Scholar] [CrossRef]
- Hou, J.J.; Wang, W.J.; Fu, Z.L.; Hu, Y.T.; Wu, Z.C.; Wu, X.J.; Hu, J.N.; Hu, H.M.; Yu, G.B.; Li, J.C. Imidazole-ionic liquid-assisted solvent extraction mechanism-macro perspective and molecular aspect. J. Hazard. Mater. 2025, 494, 138617. [Google Scholar] [CrossRef] [PubMed]


Disclaimer/Publisher’s Note: The statements, opinions and data contained in all publications are solely those of the individual author(s) and contributor(s) and not of MDPI and/or the editor(s). MDPI and/or the editor(s) disclaim responsibility for any injury to people or property resulting from any ideas, methods, instructions or products referred to in the content. |
© 2026 by the authors. Licensee MDPI, Basel, Switzerland. This article is an open access article distributed under the terms and conditions of the Creative Commons Attribution (CC BY) license.