Abstract
Surface charge accumulation and trap distribution are the core factors affecting the surface flashover characteristics of insulating materials. Considering the low-temperature gradient environment of superconducting energy pipeline terminations, this paper systematically studies the surface charge dynamic characteristics and trap distribution law of epoxy glass fiber (GFRP) by using the isothermal surface potential decay (ISPD) method combined with finite element simulation. A temperature-controlled ISPD test platform of −30~20 °C (193~293 K) was built to measure the surface potential decay curves at different temperatures and calculate the trap energy level and density; a charge migration model considering temperature gradient was established to analyze the influence of trapped charges on surface potential and electric field distribution. The results show that low temperature significantly reduces the surface potential decay rate (the residual potential after 5000 s is 92.91% of the initial value at 193 K, and only 3.51% at 293 K); the traps of GFRP at 193 K are dominated by deep traps (central energy level 0.68 eV, density 1.63 × 10²⁰ m−3·eV), while there is a bimodal distribution of shallow traps (0.92 eV) and deep traps (0.98 eV) at 293 K; under temperature gradient, the accumulation of deep trap charges in the low-temperature region leads to a surface electric field distortion rate of 12.60, which is the key microscopic mechanism for the decrease of flashover voltage.
1. Introduction
Surface charge accumulation is a key factor in the failure of surface insulation of insulating materials. Its irregular deposition at the gas solid interface will directly lead to severe distortion of the surface electric field, destroy the uniformity of electric field distribution, and make the local electric field strength exceed the material’s tolerance limit, thereby significantly reducing the surface flashover voltage of insulating materials, and even causing sudden insulation breakdown accidents [1,2]. This problem is particularly prominent in the actual operation of superconducting energy pipeline terminations, becoming a core bottleneck restricting the safe and stable operation of superconducting power transmission systems. In the unique low-temperature gradient environment of superconducting terminations, this problem is further amplified: the main insulating material of the termination, epoxy glass fiber (GFRP), must withstand the dual effects of 77 K liquid nitrogen low temperature and 293 K room temperature, and the huge temperature difference of nearly 200 K forms a significant radial temperature gradient inside it. This difference in temperature distribution directly causes spatial heterogeneity of material conductivity and trap characteristics—molecular thermal motion is restricted in the low-temperature region, conductivity drops sharply and trap density increases, making charges easily captured and retained; molecular kinetic energy increases in the high-temperature region, conductivity improves and trap effect weakens, and charge migration ability is enhanced. This characteristic difference will accelerate the accumulation of charges towards the low-temperature and high-trap region, aggravating the charge accumulation effect. However, the quantitative law of temperature gradient regulating GFRP conductivity and trap characteristics and the microscopic physical mechanism of their synergistic driving charge accumulation are still in a state of ambiguity [3,4].
In recent years, scholars have conducted extensive research on characteristics such as charge accumulation of insulating materials under low temperature and temperature gradient. Yin et al. [4] studied the electric field distribution of GFRP-based SFCL bushings in the temperature range of 77 K–300 K based on the temperature coefficient of conductivity, confirming that temperature-dependent conductivity can cause electric field distortion, but did not involve the synergistic effect between temperature gradient and trap distribution. Zhou et al. [5] demonstrated that increasing temperature (298–378 K) significantly enhances surface charge accumulation on insulators in SF6-filled DC-GIL, while lower-temperature conditions were not addressed.
Numerical simulations by Luo et al. [6] showed that temperature gradient can lead to uneven conductivity distribution in High-Voltage Direct Current(HVDC) Gas-Insulated Switchgear(GIS)/Gas-Insulated Line(GIL), which further induces charge accumulation, but the specific mechanism of this induced charge accumulation was not analyzed in depth.
Cooke [7] proposed an insulator surface charging model dominated by gas ionization and transport, comparing the roles of gas conduction versus bulk conduction under different conditions. This provided a theoretical foundation for understanding charge accumulation mechanisms in gas insulated systems. Fujinami et al. [8] found that the charge accumulation of DC insulators in SF6 gas is closely related to the normal component of the electric field. Straumann et al. [9] analyzed the charging process of HVDC GIS spacers under temperature gradient through simulation, confirming that uneven temperature distribution will exacerbate charge accumulation, and emphasized the impact of temperature-dependent conductivity on charge behavior. Experimental data published by Zhang et al. [10] at the International Conference on Electrical Insulation and Dielectric Phenomena(CEIDP) conference thermal gradients significantly alter the distribution characteristics of surface charges on insulators in HVDC gas-insulated systems, particularly under significant thermal gradients where surface charge density increases and follows an exponential distribution.
The isothermal surface potential decay (ISPD) method has become a classic means to characterize the trap distribution characteristics and charge transport law of insulating materials due to its high sensitivity and easy operation [11]. which is of great significance for analyzing charge accumulation mechanisms under low temperature. By tracking the decay process of material surface potential with time, this method can indirectly invert key parameters such as trap energy level, trap density, and carrier mobility, providing reliable data support for analyzing the entire chain of charge capture, detrapping, and transport behaviors under low-temperature conditions.
Shen et al. [11] established an ISPD model capable of distinguishing between electron and hole traps by integrating isothermal relaxation current theory, and validated the model’s effectiveness through positive and negative corona charging on polyethylene and polypropylene films, thereby providing an important foundation for studying charge behavior from an energy perspective. Zhou et al. [12] proposed a method for extracting trap energy levels and densities from space charge decay data based on the PEA technique and a two-level trap model. However, their study was conducted only on LDPE materials at room temperature and did not involve low-temperature conditions. Du et al. [13] investigated the nonlinear conductivity characteristics of SiC/silicone rubber composites and their inhibitory effect on space charge behavior. They found that space charge accumulation was significantly reduced at high filler content, but this study also did not include low-temperature environments. Zhang et al. [14] experimentally observed that the partial discharge inception voltage of GFRP increased at low temperatures, but surface discharge development accelerated and insulation life shortened during long-term aging. They speculated that this might be related to space charge accumulation and changes in surface morphology under low temperatures, but did not conduct an in-depth analysis from the perspective of trap characteristics.
In conclusion, relevant explorations based on the ISPD method in existing studies are mostly limited to a single temperature environment, which can only reflect the charge behavior characteristics under isothermal conditions, fail to match the actual operating conditions of dynamic temperature gradient distribution in superconducting terminations, and lack targeted analysis of dynamic charge transport and accumulation processes under temperature gradients. Considering the above research gaps and engineering requirements, this paper takes GFRP materials for superconducting terminations as the core research object and constructs a research system combining ISPD experiments and numerical simulations. By building an ISPD test platform with coordinated regulation of multiple temperature zones, it simulates different low-temperature gradient scenarios, obtains the surface potential decay curves of GFRP materials and extracts key parameters. Meanwhile, a multi-physics field simulation model coupling temperature field, electric field and charge transport is established to quantitatively analyze the regulatory effect of temperature gradients on the charge accumulation process. Ultimately, it not only reveals the evolution law of trap characteristics and charge accumulation mechanism of GFRP under low-temperature gradients, as well as clarifying the influence path of trapped charges on surface flashover, but it also achieves a series of innovative results: For the first time, the trap distribution of GFRP under low-temperature gradients is measured using the ISPD method, the effect of deep trap charge stability on charge accumulation is clarified, and trap parameters are innovatively correlated with macro flashover characteristics. The trap regulation law of GFRP is revealed; that is, deep traps dominate at 193 K (energy level 0.68 eV), while a bimodal distribution of shallow traps (0.92 eV) and deep traps (0.98 eV) is presented at 293 K. It is found that low-temperature gradients can lead to severe charge enrichment (68.68 μC/m2) and electric field distortion (non-uniformity coefficient 12.60) at the high-voltage end, thereby revealing the microscopic mechanism of reduced flashover voltage, providing a solid theoretical basis for the targeted modification of low-temperature insulating materials and facilitating the optimization and upgrading of the insulation performance of superconducting terminations.
2. Experimental Methods and Platform
Since traps in solid dielectrics can capture and release charges, resulting in charge accumulation, which has a certain impact on surface flashover, it is particularly important to study the influence of material surface trap distribution on surface flashover characteristics. The isothermal surface potential decay method has the advantages of simple operation, low test cost, and rich test results. Through the ISPD method, the surface trap characteristics and charge transport characteristics of dielectrics can be easily obtained, so this method has become the focus of more and more domestic and foreign scholars in dielectric research in recent years. In the isothermal surface potential decay test, it is first necessary to deposit charges on the dielectric surface, and the main charge deposition methods are electron beam type, contact type, and corona type [12].
In the isothermal surface potential decay test established in this chapter, the corona charging method is adopted. First, a high voltage is applied to the needle electrode. Due to the electric field concentration after applying high voltage to the needle electrode, electrons are ionized at the needle tip, and at the same time, the electrons move to the solid dielectric surface under the action of the external electric field. During the movement of electrons, they will be gradually accelerated under the action of the electric field and collide with gas molecules to ionize, producing additional electrons and positive ions. In order to consider the uniformity of charge deposition on the sample surface, a grid with negative voltage is placed between the needle electrode and the sample. The particles generated by collision ionization move to the epoxy glass fiber sample under the action of the applied electric field, but due to the existence of the grid voltage, the electrons in the gas are accelerated, so most of the electrons pass through the grid and are finally deposited on the solid dielectric surface, while the grid voltage decelerates the positive ions, resulting in most of the positive ions being unable to reach the dielectric surface. Under the combined action of the above two aspects, the uniform distribution of negative charges on the dielectric surface is ensured. The schematic diagram for corona charging is illustrated in the Figure 1 below [15].
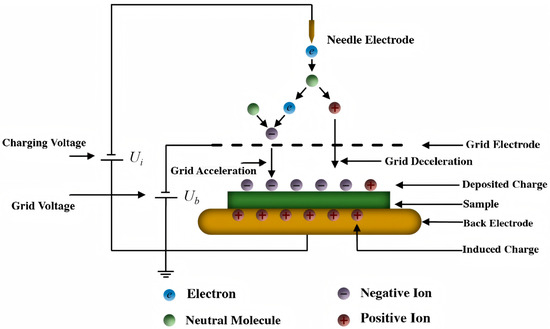
Figure 1.
Schematic diagram of corona charging.
The charges deposited on the sample surface will exchange charges with the solid dielectric, and electrons will enter the solid dielectric interior during this process and be captured by traps inside the material during migration. At the same time, the captured charges will induce opposite polarity charges on the back of the solid dielectric. During the charging process, with the increase in the number of moving electrons, the surface potential of the epoxy glass fiber sample gradually increases, resulting in a gradual decrease in the synthetic electric field between the grid and the sample. When the field strength decreases to 0, the charges passing through the grid will no longer move to the sample surface, and the sample charging reaches a stable state.
2.1. ISPD Test Platform
Temperature control system: Low-temperature test chamber (193~293 K), temperature controlled by liquid nitrogen circulation and heating wire, temperature stability ±1 K.
Corona charging module: Needle-grid-plate electrode system. The needle electrode (−5 kV) generates negative ions, the grid (−3 kV) controls charge uniformity, and negative charges are deposited on the sample surface.
Potential measurement: Trek 347 electrostatic voltmeter (accuracy ±1%), scanning step 0.5 mm, recording surface potential decay curves from 0 to 5000 s.
The isothermal surface potential decay test platform is shown in the following Figure 2.
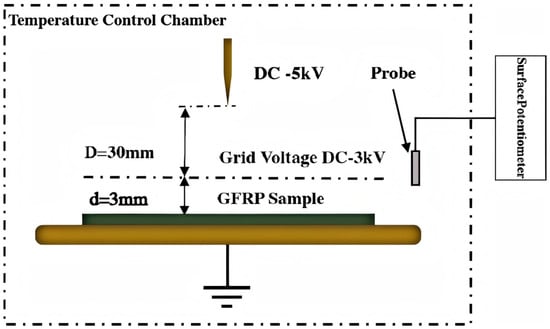
Figure 2.
Isothermal surface potential decay test platform.
Before the test, the sample needs to be fully dried, and one of its surfaces should be gold-plated (Q150T ES Ion Sputter Coater, manufactured by QUORUM, East Sussex, UK is shown in Figure 3), The electrode utilized in the experimental system was a needle electrode made of brass, whose detailed parameters were specified as: a diameter of 3 mm and a curvature radius of the needle tip of 30 μm. The tested GFRP sample has a thickness of 300 μm and a diameter of 80 mm. An AC high-voltage source is connected to the needle electrode via a DC silicon stack. The entire test is conducted in a temperature-controllable low-temperature chamber, which achieves temperature regulation down to 183 K through heat transfer by a metal immersed in liquid nitrogen.
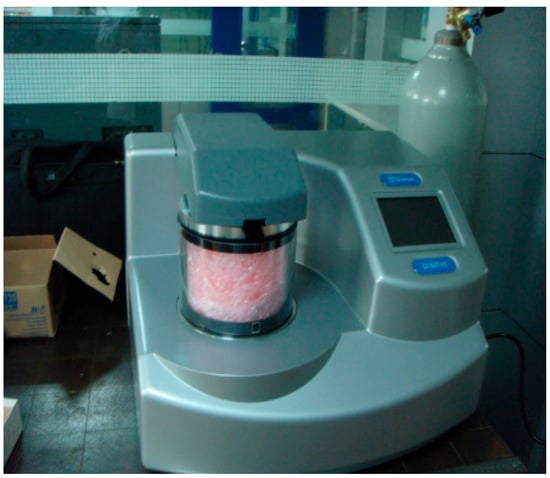
Figure 3.
Q150T ES Ion Sputter Coater.
Trap parameter calculation: Due to the complex aggregated structure of dielectrics, the energy depth of traps inside them will vary, which may be a continuous energy level distribution or a discrete energy level distribution [13]. The charge transport process in dielectrics is closely related to the charge trapping and detrapping processes. For the isothermal surface potential decay method, the charges deposited on the dielectric surface will be captured by surface traps to form trapped charges. Existing studies have shown that there are three dissipation paths for charges deposited on the surface of solid dielectrics: the first is that surface charges migrate along the dielectric surface and are absorbed by the ground electrode; the second is that surface charges neutralize with charged particles in the gas atmosphere; the third is that charges deposited on the surface are injected into the dielectric interior and migrate to the ground electrode [13]. Relevant literature points out that in general, the proportion of charge neutralization with air particles in the total surface charge can be ignored. At the same time, during the surface potential charging process, under the action of the grid, the charges ionized by the needle electrode are uniformly distributed on the dielectric surface, resulting in uniform overall surface potential distribution after corona charging of the dielectric. Therefore, the induced electric field along the tangential direction of the dielectric surface caused by surface charge deposition can be ignored, so charges basically do not dissipate along the dielectric surface [12]. Due to charge deposition, the dielectric surface potential rises and forms an electric field with the ground electrode. The charges in the dielectric surface traps will detrap under the action of this electric field and gradually transport to the dielectric interior, as shown in Figure 4. Among them, x = 0 is the back metal electrode, and L is the thickness of the dielectric material.
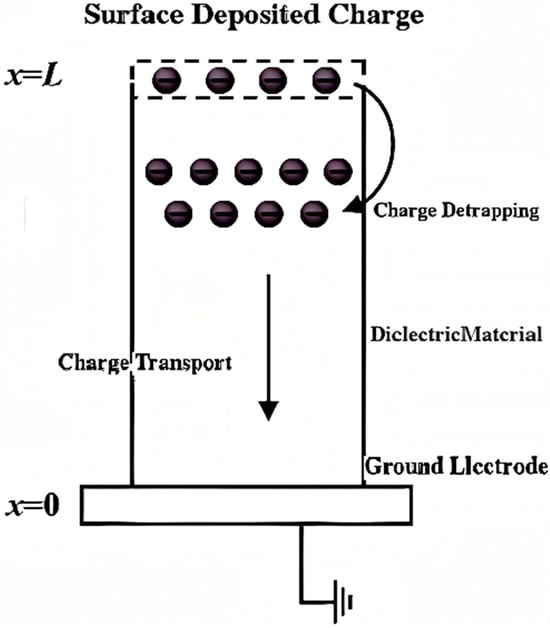
Figure 4.
Schematic diagram of deposited charge transport.
During the surface potential decay test, after the charging process is completed, the charges deposited on the dielectric surface and captured by traps will start to detrap under the action of external factors. The mechanisms affecting charge detrapping are mainly photoelectron-assisted detrapping, ion collision detrapping, and thermal-assisted detrapping.
In general, ion collision detrapping mainly occurs under extremely high electric fields (>106 V/cm), which can be basically ignored under the test conditions of this paper. At the same time, the sample is not exposed to strong light during the potential decay process, so the photoelectron-assisted detrapping effect can also be ignored. However, the trapped charges in the dielectric will gain energy under the action of thermal motion, thereby detrapping from the traps. Therefore, in the research of this paper, only the thermal-assisted detrapping effect is considered for charge detrapping.
2.2. Calculation of Surface Trap Distribution
The isothermal surface potential decay model is derived by correlating the isothermal relaxation current (IRC) theory with the distribution of space charges in dielectrics. Therefore, in the derivation process of the isothermal surface potential decay model, it is mainly divided into two parts: the isothermal relaxation current part and the potential decay part.
First, the isothermal relaxation current theory. Under the test conditions set in this paper, only the charge detrapping caused by thermal-assisted detrapping is considered, and it is assumed that the traps are uniformly distributed inside the material, and the secondary capture of detrapped charges is not considered. According to the isothermal relaxation current theory, during the corona charging process, the charges deposited on the dielectric surface will be randomly captured by traps with energy levels higher than the equilibrium Fermi level to form trapped charges. And in the subsequent process, the charges will detrap from the traps and finally dissipate through the above paths. During the detrapping process of electrons, the emission rate of detrapped charges has the following relationship with the energy increment:
By integrating from the energy level to , the total number of detrapped electrons can be obtained:
Through Simmons simplification, the function is introduced:
Gn(E,t) characterizes the weight of the electrons trapped at the trap energy level E that detrap at time t and contribute to the current density by the detrapped charges. The function graph of Gn(E,t) is a symmetric bell shape with a full width at half maximum of 3 kT and a maximum value at = . And at the maximum value = , the following is satisfied:
Solving the above equation, the trap energy level can be obtained:
At the same time, Gn = (E,t) can be expressed by the delta function δ(E — ) as:
The total rate of electrons emitted into the conduction band can be obtained:
The relationship between surface potential decay and internal space charge of the dielectric can be derived as follows: when the sample is uniformly charged with negative corona, the ionized charges are injected into the dielectric surface to a depth of 1~2 μm under the acceleration of the electric field, and at the same time, opposite polarity charges are injected into the back of the sample due to the Schottky or Fowler-Nordheim effect [11]. The schematic diagram of charge injection is shown in Figure 5. The space charge densities in the ranges of 0~δ and L-δ~L are and respectively, and the space charge density in the range of δ~L-δ is ρ. The calculation method of surface potential can be obtained by the following formula:
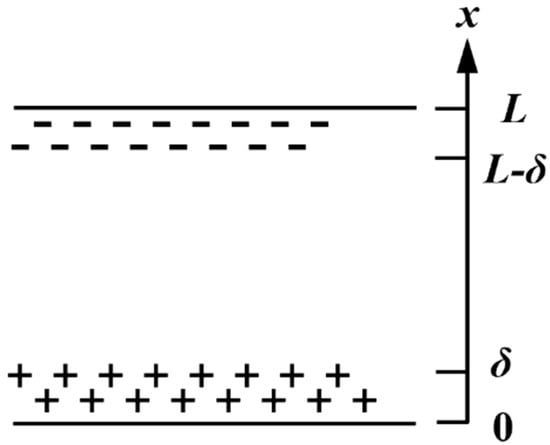
Figure 5.
Schematic diagram of space charge distribution in the sample after corona charging.
As mentioned above, we believe that charge injection into the dielectric only occurs on the material surface, so there are no charges in most areas of the dielectric, that is, ρ = 0 and δ << 2 L. Then the surface potential can be simplified as:
It can be seen from the above formula that the charges injected into the surface layer of epoxy glass fiber determine the surface potential of the sample. Therefore, the trap parameters obtained by this method mainly explain the surface trap state of the material. The surface potential decay corresponds to the detrapping process of charges in the surface layer of the material, which is given by the following formula:
The expression for the dielectric trap density can be obtained:
where: —relative permittivity of GFRP; δ—charge injection depth into the epoxy glass fiber sample; L—thickness of the epoxy glass fiber sample; q—electronic charge.
In summary, the surface potential decay model can be obtained as:
Based on the ISPD model established in this section, the epoxy glass fiber samples are corona charged under different temperature conditions, and the variation characteristics of their surface potential with time are recorded to obtain the isothermal surface potential decay curves of epoxy glass fiber. The surface potential decay curve function is obtained by exponential function fitting, and the surface trap distribution characteristics of epoxy glass fiber samples under different temperature conditions are obtained by solving the ISPD model.
3. Test Results and Analysis
3.1. Analysis of Surface Potential Decay Characteristics
Through the isothermal surface potential decay test platform established in Section 1, the isothermal surface potential decay curves of epoxy glass fiber at 193 K and 293 K were measured, as shown in Figure 6. Since the charging voltage used in this test is a negative voltage, the absolute value of the surface potential is taken for plotting for easy reading.
Figure 6.
Isothermal surface potential decay curves of GFRP materials at two temperatures.
The Initial value of the surface potential after corona charging Is mainly determined by the grid voltage at steady state. This is because the charged particles ionized by the electrode pass through the grid under the action of the electric field, are uniformly deposited on the dielectric surface and captured by the material surface traps [11], and gradually raise the sample surface potential to make the charging process gradually enter a steady state. However, during the test, due to the limitation of the test environment, the saturated surface potential is generally lower than the grid voltage. It can be seen from Figure 6 that after corona charging of epoxy glass fiber at different temperatures, the initial surface potential at 293 K is 2795 V, and the initial surface potential at 193 K is 2904 V, both lower than the grid voltage (−3 kV).
It can be seen from Figure 6 that in the entire charge decay test, the surface potential decay curves at 193 K and 293 K show an exponential downward trend as a whole. The reason for the above phenomenon is that at the end of charging, the surface potential is at the maximum value due to the clamping effect of the grid, and the electric field between the sample surface and the back metal ground is also at the peak value. When the charging voltage and grid are removed, the charges captured by shallow traps on the sample surface will quickly detrap under the action of this electric field, resulting in a high surface potential decay rate in the initial stage of potential decay; at the same time, the charges captured by shallow traps are gradually detrapped during the potential decay process, leading to a decrease in their number. In addition, with the decrease of the surface potential, the induced electric field between the dielectric surface and the ground electrode gradually decreases, making it more difficult for the charges captured by deep traps to detrap in the later stage of potential decay. Therefore, the potential drop rate decreases significantly in the later stage of potential decay.
Comparing the potential decay curves in Figure 6, it can be seen that under low temperature, the decay rate of the surface potential of epoxy glass fiber is significantly lower than that at room temperature. After 5000 s of decay, the surface potential at 293 K is 98 V, which is 3.51% of the initial potential, while the surface potential at 193 K is 2711 V, which is 92.91% of the initial potential. At the end of the test, the residual surface charges of epoxy glass fiber at low temperature are significantly higher than those at room temperature. At the end of the test, the surface potential at 293 K is basically 0, and the charges are basically completely dissipated; while at 193 K, the surface potential basically does not change in the later stage of decay, and the residual surface potential is 2373 V, which is 81.32% of the initial surface potential. A large number of charges are not dissipated during the test. The reason for the above phenomenon is that the conductivity of epoxy glass fiber decreases at low temperature, leading to a decrease in the charge transport speed inside the dielectric and a slower charge dissipation speed. The higher residual surface charges at low temperature also indicate that low temperature has a certain influence on the accumulation of surface charges of epoxy glass fiber. The above surface potential decay curves are fitted, and the surface trap distribution parameters of epoxy glass fiber are calculated by the ISPD model established earlier. For the fitting of the surface potential decay curve at 293 K, a double exponential function is used, and the goodness of fit is 99.77%; for the surface potential decay curve at 193 K, since the surface potential decay basically does not change in the later stage of decay, the goodness of fit of the double exponential function is poor, so a single exponential function is used for fitting, and the goodness of fit reaches 98.16%.
3.2. Trap Distribution Characteristics
The trap distribution characteristics of epoxy glass fiber at different temperatures are shown in Figure 7. It can be found that at 293.15 K, the trapped charge distribution of the sample at 293 K shows a bimodal shape, but the two peaks are relatively overlapping. The traps are generally distributed between 0.85 eV and 1.05 eV. The center of the shallow trap peak is located at 0.92 eV with a peak value of 3.75 × 10²⁰ m−3·eV, and the center energy level of the deep trap is around 0.98 eV with a peak value of 4.02 × 10²⁰ m−3·eV. At 193 K, the trapped charge distribution of epoxy glass fiber material shows a single peak shape, the trapped charge distribution is concentrated between 0.58 eV and 0.74 eV, the central trap energy level is about 0.68 eV, and the peak value is 1.63 × 10²⁰ m−3·eV. At 193 K, since the surface potential does not change for a long time at the end of decay, there is a constant term when fitting the single exponential function. Therefore, the trap energy level and density at 193 K in the figure only represent the trap level of the charges detrapped from the shallow traps during the test. The remaining charges need more standing time to detrap and dissipate from the traps. These charges are captured by deeper energy level traps and are difficult to detrap at low temperature, resulting in a very slow decrease in the surface potential at the end of the test. It can be seen that in a low-temperature environment, after the surface charges of epoxy glass fiber material are captured by traps, the charges in shallow traps are more likely to detrap and decay, but more charges are captured by deeper traps, resulting in a slow decay rate and high residual potential of epoxy glass fiber samples at low temperature.
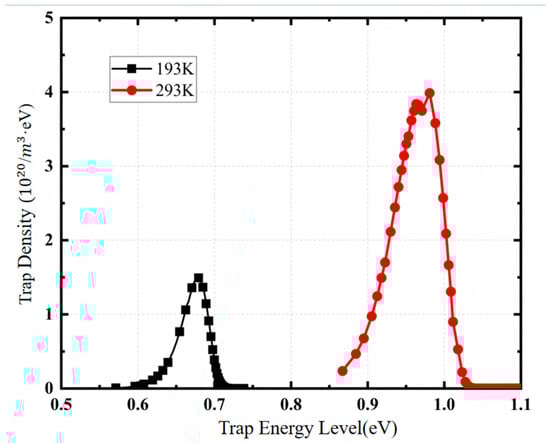
Figure 7.
Surface trapped charge distribution of GFRP materials at two temperatures.
Therefore, at low temperature, charges are more likely to be captured by deeper traps near the surface of epoxy glass fiber material, and the probability of charge detrapping is lower at low temperature, leading to difficult charge dissipation and easy formation of surface charge accumulation [14]. At room temperature, the probability of charge detrapping is high, so the surface potential of epoxy glass fiber material decays rapidly at room temperature, and the degree of charge accumulation is limited.
4. Simulation Analysis of Charge Accumulation Under Temperature Gradient
To clarify the surface charge behavior characteristics and electric field distribution characteristics under low-temperature gradient conditions, this chapter establishes a gas-solid interface charge migration model based on COMSOL6.2. Figure 8 shows the finite element simulation model.
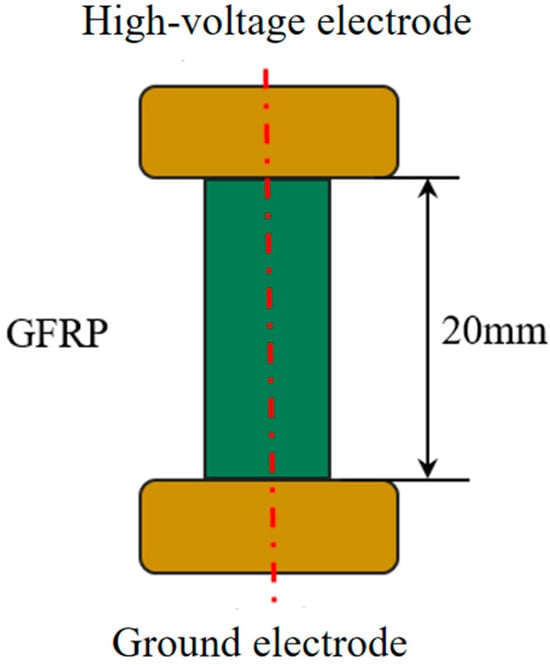
Figure 8.
Finite element simulation model.
The relevant parameters of the materials required in the above model are shown in Table 1. Since the high-voltage copper electrode has no concept of dielectric constant, its dielectric constant should be set to an extremely large value in the subsequent simulation model to represent an infinite dielectric constant.

Table 1.
Material Parameter Table for Simulation Model.
For mesh generation, a triangular unstructured mesh was adopted. Critical regions such as the GFRP surface and electrode interfaces were set with a mesh size of 0.1 mm plus 3 layers of boundary layers, while non-critical regions were enlarged to a mesh size of 0.5 mm. During the solution process, the Poisson electric field equation, charge convection-diffusion equation, and electro-thermal field equation were coupled. The key focus was on capturing the charge accumulation and electric field distortion on the GFRP surface under temperature gradients.
During the charge migration process, there are three main current conduction mechanisms affecting the charge accumulation characteristics [2]:
① Bulk conduction charges in solid dielectrics: described by the normal component Jbn of the bulk conduction current flowing through the GFRP sample;
② Surface conduction charges in solid dielectrics: described by the surface current Js conducted along the GFRP surface;
③ Gas-side conduction adsorbed charges: described by the normal component Jan of the gas-side surface adsorbed current.
Considering the above three current conduction processes comprehensively, the surface charge density of the epoxy glass fiber sample can be expressed as [2,5]:
where: —normal component of the bulk conduction current of the GFRP sample; —surface conduction current of the GFRP sample; Jan—normal component of the gas-side volume current.
The bulk conduction current inside the epoxy glass fiber can be expressed as within a certain field strength range:
where: —electric flux density; —material bulk conductivity; —normal electric field strength perpendicular to the material surface. The relationship between and temperature T can be approximately expressed as:
where A and B—coefficients related to the material. Within a certain field strength range, the surface conduction current of solid dielectrics can also be expressed by Ohm’s law as:
where: —material bulk conductivity; —tangential electric field strength of the dielectric surface.
The material surface conductivity is affected by many factors such as ambient temperature, surface roughness, surface humidity, and electric field strength. Since the assumed environment of the simulation model is dry and the surface of the epoxy glass fiber is clean, the surface conductivity of the GFRP material is 4~5 orders of magnitude smaller than the bulk conductivity [6] in this case. Therefore, the correlation between the surface conductivity of the epoxy glass fiber and temperature can be ignored in the simulation process [16]. Since the surface conductivity of solid dielectrics is related to the tangential electric field of the dielectric surface, the surface conductivity in the simulation model established in this chapter is set as follows:
where —solid dielectric material coefficient, and here = 10−20 s is selected; α—electric field sensitivity coefficient, and here α = 1.25 m/MV [17] is selected. In summary, the surface conduction current of the solid dielectric can be expressed as:
The number densities of positive and negative particles in the gas environment can be determined by the following differential equations:
where is the natural ion pair generation rate, and is the recombination coefficient of positive and negative particles.
The gas-side volume current model established above describes the drift, diffusion, and recombination processes of charged positive and negative particles in the gas, and can simulate the charge behavior in the gas atmosphere. At the same time, assuming that the dielectric constant of the gas atmosphere is independent of temperature and field strength in the simulation model, the relationship between the number of particles and the potential can be obtained by coupling the number of positive and negative particles with the Poisson equation, which can be used to describe the change between the electric field and charge in the gas atmosphere, as shown below:
where: —potential (V), —gas dielectric constant (F/m).
When a solid dielectric is placed in a constant electric field, if the dielectric is a heterogeneous material, free charge accumulation will occur inside it under the action of the external electric field. Since the dielectric constant of epoxy glass fiber is not sensitive to temperature changes, only the influence of temperature on the conductivity of epoxy glass fiber is considered in the simulation model established in this section. The relationship between space charge density, electric field, and conductivity is:
When the space charge accumulation of epoxy glass fiber reaches a steady state, we have:
This paper measures the bulk conductivity of GFRP materials at different temperatures, performs curve fitting, and inputs it into the finite element calculation model. Due to the range limitation of the microammeter Keithley 6517B used, the conductivity current cannot be accurately measured at 193 K. Therefore, in this chapter, the conductivity at 213 K~293 K is measured, the measurement setup is shown in the Figure 9 below.
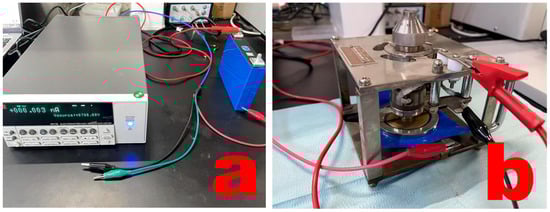
Figure 9.
Keithley 6517B (a); Three-electrode fixture (b).
The conductivity of GFRP at 193 K is obtained by curve fitting and extrapolation, as shown in Figure 10. Through curve fitting, the relationship between the conductivity of epoxy glass fiber and temperature can be obtained as:
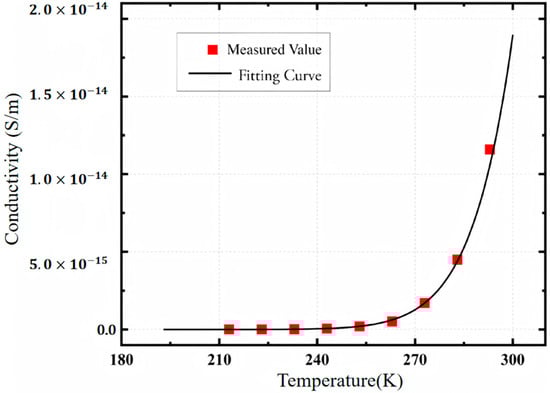
Figure 10.
Variation of bulk conductivity of GFRP material with temperature.
To guarantee the credibility of the bulk conductivity data, we performed five replicate measurements for each temperature point, keeping the experimental environment and device states consistent throughout the tests, and then averaged the measured conductivity values to derive the final temperature-dependent conductivity relationship.
We substitute the above relationship between conductivity and temperature into the simulation model established in this section to complete the coupling calculation of the electric-thermal field and explore the influence of temperature changes on the charge behavior of epoxy glass fiber.
In the numerical model of charge accumulation under temperature gradient established in the previous section, it is necessary to solve the Poisson equation of the electric field and the convection-diffusion equation in the gas atmosphere. When solving the above equations, it is necessary to determine the corresponding boundary conditions and initial values according to the actual situation of the simulation model. Correct boundary conditions and appropriate initial values can accelerate the convergence speed of the simulation and obtain correct simulation results.
In the setting of the temperature field, the temperatures of the high-voltage electrode and the ground electrode can be directly set according to the simulation requirements, and the temperatures of the two electrodes are fixed. The specific settings are:
where: —temperature of the high-voltage electrode, —temperature of the ground electrode, —input temperature at the ground electrode, which is set to 193 K, 213 K, 233 K, 253 K, 273 K, 293 K in this paper; —temperature of the high-voltage electrode, which is set to = 193 K in this paper.
In the process of solving the Poisson equation in the electric field, fixed potential values can be set at the boundaries of the high-voltage electrode and the ground electrode, specifically:
where U—DC voltage applied to the high-voltage electrode, U = 3 kV is selected in the model.
In solving the convection-diffusion equations for the number of positive and negative particles, Dirichlet boundary conditions and Neumann boundary conditions can be set for the high-voltage electrode and the ground electrode. A positive voltage is applied to the high-voltage electrode, and the current flows out from the high-voltage electrode side. Therefore, it can be assumed that the number density of positive particles at the high-voltage electrode is 0, and negative particles flow out from the boundary of the high-voltage electrode side; similarly, the number density of negative particles at the ground electrode is 0, and positive particles flow out from the boundary of the ground electrode side. The specific boundary conditions are shown in Table 2.
Table 2.
Boundary condition settings.
In addition to the above boundary condition settings, in the calculation of the simulation model, it is also necessary to set important model parameters. The specific parameter settings are as follows:
Since local discharge in the model is not considered and the material surface is sufficiently smooth in the simulation model set in this paper, field emission under DC voltage is ignored. Therefore, only natural ion pairs generated by natural radiation are considered in the gas atmosphere, so = 2 IP·m−3·s−1 [18] is selected in this paper.
For the mobility of positive and negative particles, = = 1.113 m2·V−1·s−1 [19] is selected in this paper. According to the Einstein relationship, the diffusion coefficients of positive and negative particles are physical quantities related to the ambient temperature, which can be expressed as [12]:
where K—Boltzmann constant (J·K−1), K = 1.380649 × 10⁻²³ J·K−1; Tm—ambient temperature (K).
At the same time, the recombination coefficient of positive and negative particles can be obtained by the Langevin theorem:
where —gas dielectric constant (F/m).
In summary, the parameters involved in the simulation model are summarized in Table 3.
Table 3.
Simulation parameter settings.
Spatial charge accumulation within epoxy glass fiber (GFRP) specimens is predominantly localized at the electrode-specimen interfaces, with positive charges accumulating adjacent to the high-voltage electrode and negative charges concentrating near the ground electrode. In contrast, negligible spatial charge buildup is observed in the bulk region of the material.
The influence of temperature variation on the charge distribution characteristics is relatively moderate. Specifically, as the temperature decreases, the charge state in the bulk matrix remains essentially unaltered, whereas a marginal elevation in spatial charge density is detected at the material-electrode interfaces.
The distribution of surface charges of epoxy glass fiber samples at different temperatures is shown in Figure 11. At 293 K, positive charges accumulate around the high-voltage electrode and negative charges accumulate around the ground electrode. Within the range of 293 K–213 K, with the decrease of temperature, the charge density at the high-voltage electrode and the ground electrode gradually decreases. However, when the temperature drops below 213 K, the polarity of the accumulated charges near the electrode reverses, that is, negative charges accumulate around the high-voltage electrode and positive charges accumulate around the ground electrode. At the same time, with the decrease of the overall temperature, the charge density gradually increases. On the whole, under different temperatures, the surface charge distribution is symmetric. Compared with 293 K, the maximum charge density at 193 K increases by about 30%, and the polarity reverses when the temperature decreases, but the overall surface charge density is low.
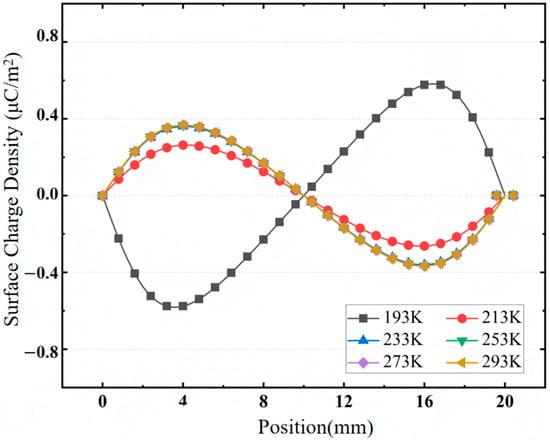
Figure 11.
Surface charge distribution of epoxy glass fiber samples at different temperatures.
Existing studies have shown that charged particles inside solid insulating materials and in the gas atmosphere will move along the electric field lines to the gas solid interface under the action of the electric field, and finally lead to charge accumulation [20]. In this process, solid-side conduction and gas-side conduction of charges exist simultaneously. When the relative change between solid-side conductivity and gas-side conductivity occurs, the dominant factor affecting material surface charge accumulation will change [5].
For the simulation model established in this chapter, at 293 K, due to the high ambient temperature, the conductivity of epoxy glass fiber is greater than the gas-side conductivity, so bulk conduction dominates the surface charge accumulation process. It can be seen that on the high-voltage electrode side, at the gas solid interface, the direction of the electric field forms an acute angle with the interface, and the normal component of the electric field points from the dielectric side to the gas side (the normal electric field distribution shown in Figure 12 is positive). Since bulk conduction dominates the surface charge accumulation process at this time, the positive particles in the body move from the solid side to the gas solid interface under the action of the electric field and accumulate on the surface of the solid dielectric, resulting in the accumulation of positive charges on the high-voltage electrode side. Similarly, at the ground electrode, the normal electric field points from the gas side to the solid side, and the negative particles inside the solid dielectric move to the gas solid interface under the action of the electric field, so negative charges accumulate at the ground electrode.
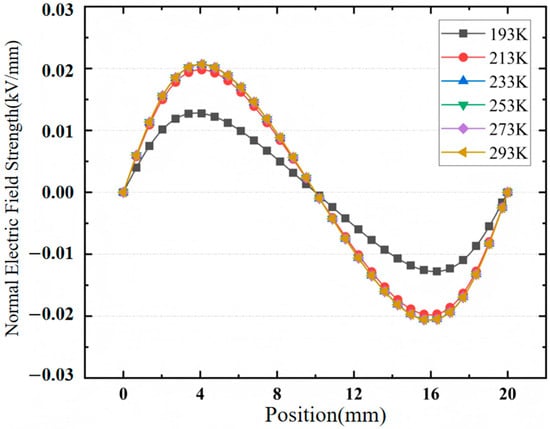
Figure 12.
Distribution of normal electric field on the surface of epoxy glass fiber samples at different temperatures.
However, with the decrease of temperature, the conductivity of the epoxy glass fiber sample decreases, and the factor affecting surface charge accumulation becomes gas-side dominated. Under the condition of 193 K, the electric field distribution of epoxy glass fiber is similar to that at 293 K. At the high-voltage electrode, the direction of the electric field forms an acute angle with the solid dielectric, and the direction of the normal electric field strength is positive. Since gas-side charge accumulation dominates at this time, the negative particles in the gas atmosphere move towards the solid dielectric side under the action of the electric field and are finally deposited at the gas solid interface, resulting in the accumulation of negative charges around the high-voltage electrode. Similarly, near the ground electrode, the positive particles in the gas move to the dielectric surface under the action of the electric field and are deposited at the gas solid interface, resulting in the accumulation of positive charges.
When the overall temperature of the sample changes between 193 K and 213 K, the polarity of the charges accumulated on the surface reverses. To explore the specific temperature at which polarity reversal occurs, it can be found by narrowing the temperature gradient range that when the overall temperature of the sample is less than 205 K, negative charges begin to accumulate on the sample surface. That is to say, when the temperature is less than 205 K, due to the decrease of the conductivity of the epoxy glass fiber, the dominant factor in the charge accumulation process is gas-side conduction, and the dominant mode of charge accumulation changes.
Through the numerical calculation of the charge behavior simulation model under low-temperature gradient established earlier, the sample electric field and charge behavior characteristics under different low-temperature gradient conditions are obtained. The influence mechanism of charge behavior on the surface flashover of epoxy glass fiber under low-temperature gradient is summarized by analyzing the electric field and charge characteristics under low-temperature gradient.
Since the length of the sample is set to a fixed value of 20 mm, the steady-state temperature distribution on the surface of the epoxy glass fiber sample under different temperature gradients can be obtained only by changing the input temperature of the high-voltage electrode, as shown in Figure 13. The temperature in the figure annotation is the ground electrode temperature. It can be seen that when the temperatures of the high-voltage electrode and the ground electrode are different, a temperature gradient distribution is formed on the surface of the epoxy glass fiber sample. Considering the material heat conduction and natural air convection, the material surface temperature shows a non-linear distribution from the high-voltage end to the ground electrode, with the highest temperature gradient of ΔT = 100 K.
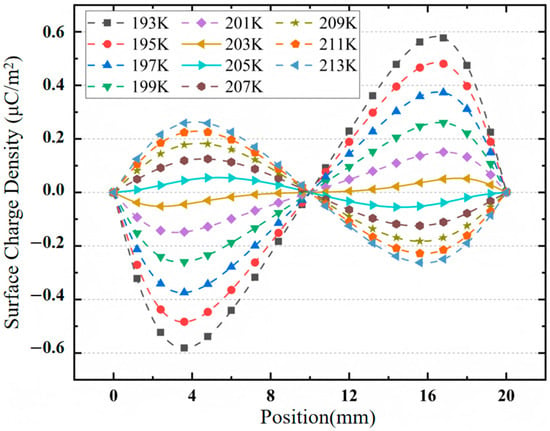
Figure 13.
Surface charge distribution at 193 K–213 K.
Since the conductivity of epoxy glass fiber material is a temperature-dependent parameter, when a temperature gradient appears inside the epoxy glass fiber, a non-linear distribution of conductivity will also appear inside the material. The conductivity distribution inside the material under temperature gradient is shown in Figure 14.
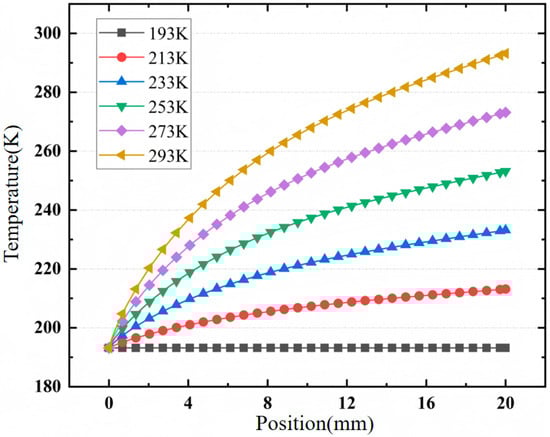
Figure 14.
Surface temperature distribution diagram of epoxy glass fiber sample.
The surface charge distribution of epoxy glass fiber under different temperature gradients is shown in Figure 15. It can be seen that when the sample is overall at low temperature, negative charges accumulate at the high-voltage end of the epoxy glass fiber material surface, and positive charges accumulate at the ground electrode. The positive and negative charges are nearly uniformly distributed and have symmetry. With the increase of the ground electrode temperature, positive charges accumulate at the high-voltage electrode. When the temperature difference between the two ends of the sample increases from ΔT = 0 K to ΔT = 100 K, the maximum absolute value of the surface charge density increases from 0.81 μC/m2 to 68.68 μC/m2. The larger the temperature gradient, the greater the charge accumulation density. Under the action of a 100 K temperature difference, the surface charge density increases by about 85 times. It can be seen that the existence of a low-temperature gradient causes severe surface charge accumulation.
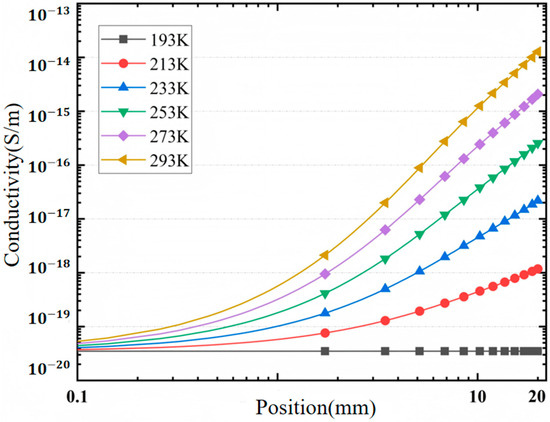
Figure 15.
Conductivity distribution diagram of epoxy glass fiber sample.
The surface electric field strength distribution of epoxy glass fiber samples under different temperature gradients is shown in Figure 16. It can be seen that when there is no temperature gradient, the surface electric field of the epoxy glass fiber sample is symmetrically distributed. With the decrease of the ground electrode temperature, the sample surface electric field is distorted.
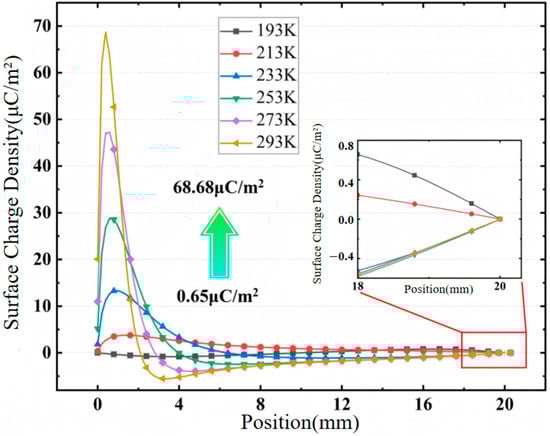
Figure 16.
Surface charge density distribution of epoxy glass fiber sample.
It can be seen from Figure 17 that with the increase of the temperature gradient, the electric field near the high-voltage electrode increases sharply. When the ground electrode temperature rises from 193 K to 293 K, the surface electric field strength increases from 0.19 kV/mm to 1.89 kV/mm, the maximum electric field strength increases by about 10 times, and the electric field non-uniformity coefficient increases from 1.19 to 12.60, an increase of about 11 times. Under the action of a 100 K temperature difference, the electric field becomes an extremely non-uniform field, and the surface electric field strength distortion is very serious.
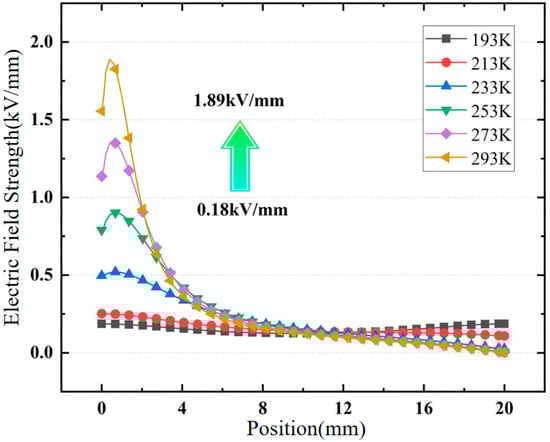
Figure 17.
Surface electric field strength distribution diagram of epoxy glass fiber sample.
5. Conclusions
This study systematically investigates the dynamic surface charge characteristics and trap distribution laws of glass fiber-reinforced epoxy (GFRP) in low-temperature gradient environments using the isothermal surface potential decay (ISPD) method combined with finite element simulation. The microscopic mechanism by which temperature gradients regulate GFRP charge accumulation and electric field distortion is clarified, with the main research conclusions as follows:
Low temperature significantly inhibits the surface potential decay of GFRP through the dual effects of strong trap capture and weak dissipation paths. At 193 K, GFRP is dominated by deep traps (central energy level 0.68 eV, density 1.63 × 10²⁰ m−3·eV), leading to weakened thermal-assisted detrapping effects and enhanced charge binding. Meanwhile, the bulk and surface conductivities of GFRP decrease significantly, hindering charge conduction and dissipation. Ultimately, the residual potential at 193 K after 5000 s reaches 81.32% of the initial value, compared to only 3.51% at 293 K, with deep trap charges becoming the core for maintaining surface potential. This regularity is consistent with the research conclusions of Zhou et al. [5] and Shen et al. [11] regarding the regulation of charge transport and trap characteristics by temperature.
At 293 K, the traps of GFRP exhibit a bimodal distribution of shallow traps (0.92 eV) and deep traps (0.98 eV). The higher probability of charge detrapping results in rapid surface potential decay and limited charge accumulation. This difference in trap distribution reveals the regulatory effect of temperature on the trap energy level structure of GFRP, providing a microscopic basis for explaining the differences in insulation performance at different temperatures.
Temperature gradients disrupt the balance of charge distribution, causing severe charge enrichment and electric field distortion at the high-voltage end (low-temperature region). As the temperature difference increases from 0 K to 100 K, the surface charge density rises from 0.81 μC/m2 to 68.68 μC/m2 (an 85-fold increase), and the electric field non-uniformity coefficient increases from 1.19 to 12.60 (an 11-fold increase), with 80.67% of the voltage drop concentrated in the 2 mm range at the high-voltage end. This phenomenon stems from the spatial heterogeneity of conductivity induced by temperature gradients: the low conductivity at the high-voltage end hinders charge migration, and the superimposition of the additional electric field generated by accumulated charges ultimately causes the local electric field strength to exceed the limit, resulting in a 24.62% decrease in the partial discharge inception voltage. This mechanism is consistent with the research results of Luo et al. [6] and Yin et al. [4] on temperature gradient-induced uneven conductivity and electric field redistribution.
The innovations of this study are as follows: it is the first time the ISPD method has been used to reveal the evolution law of GFRP trap distribution under low-temperature gradients, establishing a correlation between trap parameters and macro flashover characteristics; it quantifies the regulatory effect of temperature gradients on charge accumulation and electric field distortion, clarifying the key role of deep trap charge stability in low-temperature insulation failure. The research results provide a solid theoretical basis for the targeted modification of low-temperature insulating materials for superconducting terminations and are of great engineering significance for improving the safe and stable operation level of superconducting power transmission systems.
Future research can further expand the temperature gradient range to explore the trap evolution and charge behavior of GFRP under extreme low-temperature conditions; meanwhile, combined with material modification technology, it can optimize trap distribution to suppress charge accumulation under low-temperature gradients, providing a new path for the development of high-performance insulating materials for superconducting terminations.
Author Contributions
Conceptualization, Y.F. and S.P.; methodology, J.Y.; software, A.J.; validation, Y.B., Z.L. and X.T.; formal analysis, Y.Y.; investigation, Y.F.; resources, S.P.; data curation, J.Y.; writing—original draft preparation, A.J. and S.P.; writing—review and editing, Y.B.; visualization, Z.L.; supervision, X.T.; project administration, Y.Y.; funding acquisition, Y.F. All authors have read and agreed to the published version of the manuscript.
Funding
2025 Science and Technology Program Project of Inner Mongolia Power Company, No. 2025-3-13, Supported by the Science and Technology Project of Inner Mongolia Power (Group) Co., Ltd. (Document No.: NDP Science and Technology Innovation [2025] No. 5).
Data Availability Statement
All data included in this study are available upon request by contact with the corresponding author.
Conflicts of Interest
Yongqiang Fan, Jianzhong Yang, Aoqi Jia, Yun Bai, Zhihui Li, Xiaoyun Tian, Yonggang Yue were employed by Inner Mongolia Power (Group) Co., Ltd. The remaining authors declare that the research was conducted in the absence of any commercial or financial relationships that could be construed as a potential conflict of interest.
Abbreviations
The following abbreviations are used in this manuscript:
| GFRP | Glass fiber reinforced epoxy |
| ISPD | Isothermal surface potential decay |
| IRC | Isothermal relaxation current |
References
- Li, Q.; Wang, Y.; Zhang, L.; Yu, D.; Liu, P.; Zhang, Z. Study on Surface Charge Accumulation Mechanism of Dc-Gil Insulator Based on Charge Behavior. In Proceedings of the 2020 IEEE International Conference on High Voltage Engineering and Application (ICHVE), Beijing, China, 6–10 September 2020. [Google Scholar]
- Du, B.X.; Dong, J.N.; Li, J.; Liang, H.C.; Kong, X.X. Gas Convection Affecting Surface Charge and Electric Field Distribution Around Tri-Post Insulators in ±800 Kv Gil. IEEE Trans. Dielectr. Electr. Insul. 2021, 28, 1372–1379. [Google Scholar] [CrossRef]
- Shhnonosono, T.; Nagaya, S.; Masuda, T.; Isojima, S. Development of a Termination for the 77 kv-Class High Tc Superconducting Power Cable. IEEE Power Eng. Rev. 1997, 17, 37–38. [Google Scholar] [CrossRef]
- Yin, L.; Yang, W.; Wang, K.; Yan, B.Y.; Chen, Y.; Chen, X.; Zhang, C. Temperature Coefficient of Conductivity Dependent Electric Field Distribution in Gfrp Based Sfcl Bushing. IEEE Trans. Appl. Supercond. 2021, 31, 0604403. [Google Scholar] [CrossRef]
- Zhou, H.Y.; Ma, G.M.; Li, C.R.; Shi, C.; Qin, S.C. Impact of Temperature on Surface Charges Accumulation on Insulators in Sf6-Filled Dc-Gil. IEEE Trans. Dielectr. Electr. Insul. 2017, 24, 601–610. [Google Scholar] [CrossRef]
- Luo, Y.; Tang, J.; Pan, Z.; Pan, C. How Temperature and Pressure Affect the Electric Field Distribution in Hvdc Gis/Gil: A Numerical Study. IEEE Trans. Dielectr. Electr. Insul. 2021, 28, 1334–1342. [Google Scholar] [CrossRef]
- Cooke, C.M. Charging of Insulator Surfaces by Ionization and Transport in Gases. IEEE Trans. Electr. Insul. EI 1982, 17, 172–178. [Google Scholar] [CrossRef]
- Fujinami, H.; Takuma, T.; Yashima, M.; Kawamoto, T. Mechanism and Effect of Dc Charge Accumulation on Sf6 Gas Insulated Spacers. IEEE Power Eng. Rev. 1989, 9, 62. [Google Scholar] [CrossRef]
- Straumann, U.; Schuller, M.; Franck, C.M. Theoretical Investigation of Hvdc Disc Spacer Charging in Sf6 Gas Insulated Systems. IEEE Trans. Dielectr. Electr. Insul. 2012, 19, 2196–2205. [Google Scholar] [CrossRef]
- Zhang, B.; Qi, Z.; Zhang, G. Thermal Gradient Effects on Surface Charge of Hvdc Spacer in Gas Insulated System. In Proceedings of the 2016 IEEE Conference on Electrical Insulation and Dielectric Phenomena (CEIDP), Toronto, ON, Canada, 16–19 October 2016. [Google Scholar]
- Shen, W.; Mu, H.; Zhang, G.; Deng, J.; Tu, D. Identification of Electron and Hole Trap Based on Isothermal Surface Potential Decay Model. J. Appl. Phys. 2013, 113, 83706. [Google Scholar] [CrossRef]
- Zhou, T.; Chen, G.; Liao, R.; Xu, Z. Charge Trapping and Detrapping in Polymeric Materials: Trapping Parameters. J. Appl. Phys. 2011, 110, 43724. [Google Scholar] [CrossRef]
- Du, B.X.; Li, Z.L.; Yang, Z.R. Field-Dependent Conductivity and Space Charge Behavior of Silicone Rubber/Sic Composites. IEEE Trans. Dielectr. Electr. Insul. 2016, 23, 3108–3116. [Google Scholar] [CrossRef]
- Zhang, Z.; Ren, M.; Song, B.; Yu, B.; Fan, W.; Dong, M. Surface Discharge Aging Characteristics of Gfrp at Low Temperatures. In Proceedings of the 22nd International Symposium on High Voltage Engineering (ISH 2021), Xi’an, China, 21–26 November 2021. [Google Scholar]
- Li, Z.; Han, C.; Li, W.; Du, B. Trap Distribution Characteristics of Graphene Oxide/Low-Density Polyethylene Nanocomposites Based on Isothermal Surface Potential Decay Method. High Volt. Eng. 2017, 43, 3583–3590. [Google Scholar]
- Winter, A.; Kindersberger, J. Transient Field Distribution in Gas-Solid Insulation Systems under Dc Voltages. IEEE Trans. Dielectr. Electr. Insul. 2014, 21, 116–128. [Google Scholar] [CrossRef]
- Okabe, S. Phenomena and Mechanism of Electric Charges on Spacers in Gas Insulated Switchgears. IEEE Trans. Dielectr. Electr. Insul. 2007, 14, 46–52. [Google Scholar] [CrossRef]
- Wiegart, N.; Niemeyer, L.; Pinnekamp, F.; Kindersberger, J.; Morrow, R.; Zaengl, W.; Zwicky, M.; Gallimberti, I.; Boggs, S.A. Inhomogeneous Field Breakdown in Gis-the Prediction of Breakdown Probabilities and Voltages. I. Overview of a Theory for Inhomogeneous Field Breakdown in Sf/Sub 6. IEEE Trans. Power Deliv. 1988, 3, 923–930. [Google Scholar] [CrossRef]
- Shirshak, K.D. Transient Behavior of Drift and Ionization in Atmospheric Pressure Nitrogen Discharge. Plasma Sources Sci. Technol. 2022, 31, 25014. [Google Scholar] [CrossRef]
- Song, B.; Ren, M.; Zhang, Z.; Zhuang, T.; Zhang, C.; Dong, M. Excess Conduction Induced by Partial Discharge in Polymer. J. Phys. D Appl. Phys. 2020, 53, 485302. [Google Scholar] [CrossRef]
Disclaimer/Publisher’s Note: The statements, opinions and data contained in all publications are solely those of the individual author(s) and contributor(s) and not of MDPI and/or the editor(s). MDPI and/or the editor(s) disclaim responsibility for any injury to people or property resulting from any ideas, methods, instructions or products referred to in the content. |
© 2026 by the authors. Licensee MDPI, Basel, Switzerland. This article is an open access article distributed under the terms and conditions of the Creative Commons Attribution (CC BY) license.