Abstract
The nominal compositions of Fe65Co10−xNi10−xCr15Si2x (x = 1, 2, and 3 at.%) medium-entropy alloys (MEAs) were designed and fabricated by vacuum arc melting. Their microstructure, hardness, and mechanical properties were systematically characterized. Corrosion behavior was evaluated in 3.5 wt.% NaCl solution by potentiodynamic polarization and electrochemical impedance spectroscopy. The investigated MEAs exhibit a dual-phase microstructure composed of face-centered cubic (FCC) and body-centered-cubic (BCC) phases. With increasing Si content, yield strength and ultimate tensile strength increase, while uniform elongation decreases. Hardness also increases with increasing Si content. For the x = 3 MEA, the yield strength, ultimate tensile strength, and hardness of are ~518 MPa, ~1053 MPa, and 262 ± 4.8 HV, respectively. The observed strengthening can be primarily attributed to solid solution strengthening effect by Si. Polarization curves indicate that the x = 3 MEA exhibits the best corrosion resistance with the lowest corrosion current density ((0.401 ± 0.19) × 10−6 A × cm−2) and corrosion rate ((4.65 ± 0.19) × 10–2 μm × year−1)). Equivalent electric circuit analysis suggests the formation of a stable passive oxide film on the MEAs. This conclusion is supported by the capacitive behavior, high impedance values (> 104 Ω cm2) at low frequencies, and phase angles within a narrow window of 80.05°~80.64° in the medium-frequency region. The passive-film thickness was calculated and the corrosion morphology was analyzed by SEM. These results provide a reference for developing high-strength, corrosion-resistant, medium-entropy alloys.
1. Introduction
Entropy-stabilized alloys, particularly high- and medium-entropy alloys (HEAs and MEAs), have attracted significant attention in materials science and engineering because of their combination of high strength, thermal stability, and improved corrosion resistance [1,2,3]. Compared with conventional alloys dominated by one or two principal elements, HEAs/MEAs composed of multiple principal elements tend to form simple solid solution phases, most commonly body-centered cubic (BCC) and face-centered cubic (FCC) structures [4,5]. Particularly, MEAs containing two to four principal elements represent a distinct class of materials notable for their superior mechanical properties [6]. Various MEA systems have been successfully designed and fabricated. A notable example is the dual-phase Fe65Co6Ni6Cr15Si8 MEA, which combines low cost with ultrahigh strength and demonstrates exceptional mechanical performance at both room temperature and liquid-nitrogen temperature [7]. Specifically, this MEA exhibits yield strengths of 902 MPa and 1140 MPa, ultimate tensile strengths of 1214 MPa and 1938 MPa, and uniform elongations of 26% and 31% at 298 K and 77 K, respectively. These characteristics enhance the alloy’s suitability for practical applications.
Corrosion is a critical parameter influencing the durability and performance in practical applications, and the corrosion resistance and behavior of MEAs have been investigated in chloride environments [8,9,10]. Cheng et al. [11] found that a Co-free Fe37Ni37Cr20Al3Ti3 MEA, composed of an FCC phase, a Ti-rich HCP phase, and an Al-rich monoclinic phase, presents excellent corrosion resistance in 3.5 wt.% NaCl solution. Sequential passivation of these phases, induced by microgalvanic corrosion effect, was identified as the principal mechanism. Wang et al. [12] reported that a novel CrFeNiB0.03Si0.03 MEA coating with B and Si additions displayed improved corrosion behavior compared to conventional CrFeNi MEA. This enhanced corrosion resistance was attributed to an increased fraction of Cr2O3 in the corrosion layer and the development of a SiO2 network, which prevents cracks and holes in the passive film, producing a denser protective layer. Furthermore, Si atoms dissolve into the FCC phase as a solid solution, and the combined of B and Si were reported to enhance corrosion resistance as well as hardness and wear resistance. Yuan et al. [13] prepared an FeCrNiSi0.4 MEA coating by laser cladding on a Q235 steel substrate and attributed its superior corrosion performance in 3.5 wt.% NaCl to the formation of multiple oxide species, such as NiO, Fe2O3, Cr2O3, and SiOx (x < 2), within the passive film. Based on the above research findings, these studies demonstrate that the corrosion behavior of MEAs is highly sensitive to their composition, microstructural features, and processing methods. Consequently, further investigations into the corrosion resistance and behavior of MEAs are needed.
The Fe–Co–Ni–Cr medium-entropy alloy provides a cost-effective balance of strength, ductility, and corrosion resistance, and further enables the tailoring of a tunable FCC + BCC dual-phase microstructure. Si additions have been shown to lower the stacking-fault energy of FCC phases, thereby enhancing mechanical properties [7,14]. Furthermore, the Fe–Si phase diagram and steel design practice suggest that Si additions reduce the melting temperature, increase fluidity, and improve castability [7]. However, the effect of Si content on the combined mechanical properties and corrosion behavior of FCC-based MEAs remains insufficiently understood.
In this study, the nominal composition Fe65Co10−xNi10−xCr15Si2x (x = 1, 2, and 3 at.%) MEAs with varying Si doping contents were fabricated by vacuum arc melting. Previous studies have demonstrated that the minor addition of Si as a solution-strengthening element can modify crystalline structure and phase distribution, thereby enhancing the mechanical properties of alloys [15,16]. Si content also significantly affects the corrosion behavior. The aim of this work is to systematically investigate the influence of Si content on hardness, tensile mechanical behavior, and corrosion properties in 3.5 wt.% NaCl solution. The results might provide valuable insights into modifying mechanical properties and corrosion resistance, and promoting the application of MEAs with excellent performance.
2. Materials and Methods
Alloy ingots with nominal compositions of Fe65Co10−xNi10−xCr15Si2x (x = 1, 2, and 3 at.%), labeled as Si2, Si4, and Si6 alloy, respectively, were prepared by arc-melting mixtures of pure metals (purity > 99.9 wt.%) in a Ti-gettered high-purity argon atmosphere. Each ingot was re-melted five times with electromagnetic stirring, and then drop-cast into a water-cooled Cu mold (40 mm × 10 mm × 10 mm). The remaining 10 mm thick plates were cold rolled to a final thickness of 1.5 mm, an ~85% reduction. Cold-rolled sheets without obvious side cracks were annealed at 1073 K for 10 min, and then water quenched immediately.
Vickers microhardness (HV) was measured using a 136° diamond pyramid under a 500 g load for 10 s (Beijing Woway Technology Co., Ltd., Beijing, China). For each sample, HV measurements were conducted on ten different locations. Dog-bone-shaped tensile samples with a cross section of 2.4 mm × 1.4 mm and a gauge length of 10 mm were cut from the sheets by wire electrical discharge machining (WEDM). To eliminate machining marks introduced by WEDM, the specimens were ground sequentially using SiC sandpapers up to 1500 grit, followed by final polishing with 0.5 μm diamond paste. Tensile tests were performed on a screw-driven SUNS UTM 5105 at a crosshead speed of 0.5 mm × min−1 (Shenzhen SUNS Technology Stock Co., Ltd., Shenzhen, China). For each alloy composition, at least four independent samples were tested. Strain was monitored with a 10 mm extensometer. Phase identification was performed by X-ray diffraction (XRD, Malvern Panalytical Co., Ltd., Almelo, The Netherlands) using Cu-Kα radiation (Empyrean). Diffraction patterns were obtained in the 2θ range of 20°~80° using a step size of 0.02° and a scanning rate of 10° × min−1. Morphology and microstructure were examined by scanning electron microscopy (SEM, Carl Zeiss Microscopy GmbH, Jena, Germany) equipped with energy dispersive spectrometer (EDS, Bruker Nano GmbH, Berlin, Germany), and electron back-scattering diffraction (EBSD, Helios G4 CX, Oxford Instruments NanoAnalysis, Oxford, UK). EBSD specimens were prepared by mechanical polishing followed by electrochemical polishing in a solution of 92 vol.% CH3COOH and 8 vol.% HClO4 at 25 V. The step size was 75 nm.
Electrochemical measurements were performed on a Zahner ZenniumPro electrochemical workstation (Zahner-elektrik GmbH&Co. KG, Kronach, Germany). Calibration of the electrochemical workstation was performed by the manufacturer. A three-electrode system was employed, consisting of a saturated calomel reference electrode, a platinum counter electrode, and the sample as the working electrode. The open circuit potential (OCP) was monitored for 3600 s to ensure it reached a steady state. Potentiodynamic polarization scans were conducted from −1.5 V and +1.0 V at a scan rate of 5 mV × s−1, initiated after OCP stabilization. The initial potential was set below the steady-state ECOP. Electrochemical impedance spectroscopy (EIS) measurements were carried out with an excitation signal of ±10 mV and a frequency range from 100 kHz to 0.01 Hz at the respective OCP. Tests were performed in a 3.5 wt.% NaCl solution and each polarization test was conducted in three times under identical conditions. EIS data were then analyzed, and an optimized electrical equivalent circuit (EEC) model was fitted using Zahner Analysis software (Version3.2.4, Zahner-Elektrik GmbH & Co. KG, Kronach, Germany). The samples for electrochemical measurement tests were ground with SiC papers and polished to a mirror finish. These samples were ultrasonically cleaned in deionized water for 15 min, dried, and then cleaned in acetone for 15 min before final drying. A copper wire was attached to each specimen by soldering, and all non-exposed areas were sealed with epoxy resin so that only the working surface was exposed to the electrolyte.
3. Results and Discussions
3.1. Analysis of Phase
The crystal structures and phase compositions of Fe65Co10−xNi10−xCr15Si2x (x = 1, 2, and 3 at.%) MEAs annealed at 1073 K for 10 min were characterized by XRD, and the results are shown in Figure 1. It can be observed that a distinct set of sharp diffraction peaks is present in the MEAs. The diffraction peaks can be indexed to FCC and BCC phases. With increasing Si content, the intensity of FCC reflections decreases while the intensity of BCC reflections increases, indicating a rise in the BCC phase volume fraction. The observed phase constitution of the studied MEAs can be rationalized by the valence electron concentration (VEC) theory, which correlates the stability of different phases based on VEC values. The VEC can be calculated as follows:
where n represents the number of constituent elements and Ci denotes the atomic percentage of the ith element. Based on the previous reported [17], FCC phases are stable at high VEC (>8), whereas BCC phases are stable at lower VEC (<6.87). When the VEC ranges from 6.87 to 8, a dual-phase structure consisting of both FCC and BCC phases is typically formed. This suggests that a lower VEC is favored for the formation of the BCC phase. In the present alloys, the VEC values of Si, Co, and Ni elements are 4, 9, and 10, respectively. The substitutions of Co and Ni with Si can reduce the overall VEC of the present MEAs and thereby increase the tendency to form the BCC phase. The calculated VEC values for Si2, Si4, and Si6 MEAs are 7.89, 7.78, and 7.67, respectively. These values indicate that the phase formations of the studied MEAs conform to the VEC prediction theory.
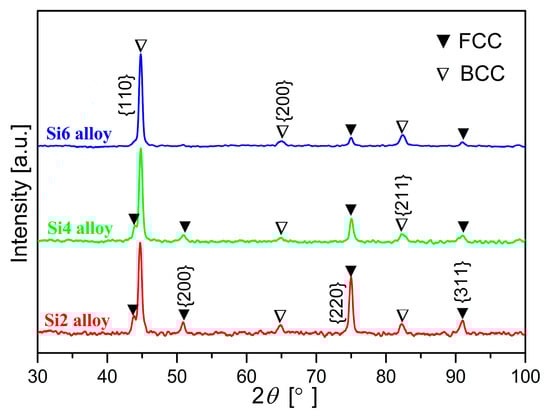
Figure 1.
X-ray diffraction patterns of Fe65Co10−xNi10−xCr15Si2x (x = 1, 2, and 3 at.%) MEAs annealed at 1073 K for 10 min.
3.2. Microstructure
The typical microstructures of Fe65Co10−xNi10−xCr15Si2x (x = 1, 2, and 3 at.%) MEAs, as determined from EBSD phase maps, are shown in Figure 2. It indicates that the studied MEAs exhibit a dual-phase microstructure composed of FCC and BCC phases. With increasing Si content, the phase volume fractions of the FCC and BCC phase change markedly. Specifically, the BCC phase fraction of the Si2, Si4, and Si6 alloys increases from 20.2% to 47.7% and 79.1%, respectively, while the FCC phase fraction correspondingly decreases from 79.8% to 52.3% and 20.9%. These results indicate that Si addition promotes formation of the BCC phase. This phase-transformation behavior is expected to strongly influence mechanical properties. An increased BCC fraction typically enhances strength and hardness at the expense of ductility [18]. Therefore, Si concentration is an effective parameter for tailoring the phase constitution and the resultant mechanical performance of these medium-entropy alloys.
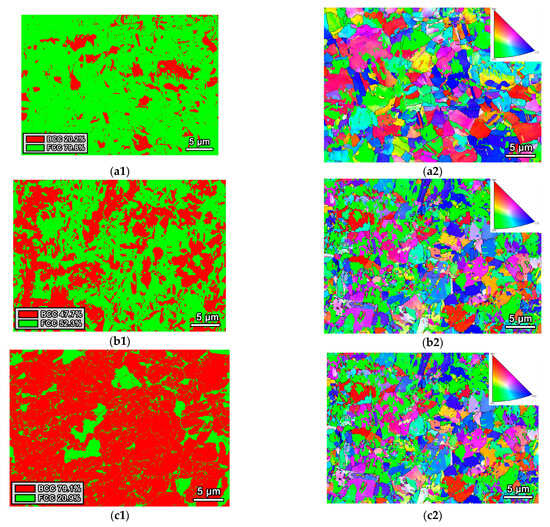
Figure 2.
(a1) and (b1), (a2) and (b2), (c1) and (c2) are phase distributions maps and IPF maps of Fe65Co10−xNi10−xCr15Si2x (x = 1, 2, and 3 at.%) MEAs, respectively.
3.3. Mechanical Properties
The representative tensile stress–strain curves of Fe65Co10−xNi10−xCr15Si2x (x = 1, 2, and 3 at.%) MEAs tested at room temperature are shown in Figure 3. Figure 3a shows the engineering stress–strain curves, and Figure 3b presents the correlation between the values of the main mechanical properties and Si content. The stress–strain curves reveal a prolonged plastic deformation stage, accompanied by significant work hardening, especially for alloys with higher Si content. This observation suggests that the mechanical properties are strongly dependent on the Si content.
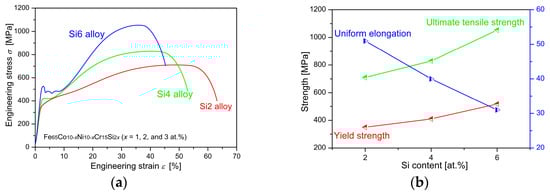
Figure 3.
The results of representative tensile tests of Fe65Co10−xNi10−xCr15Si2x (x = 1, 2, and 3 at.%) MEAs tested at room temperature. (a) The engineering stress–strain curves; (b) the relationship between mechanical properties and Si content.
As Si content increases from 2 at.% to 6 at.%, both yield strength and ultimate tensile strength exhibit a significant increase, while ductility decreases. The Si2 alloy exhibits a yield strength of ~350 MPa, an ultimate tensile strength of ~710 MPa, and a maximum plastic strain of ~51%, indicating the great deformation ability. The Si4 alloy shows a higher yield strength of ~410 MPa and a significantly greater ultimate tensile strength of ~829 MPa. However, its maximum plastic strain is slightly lower at ~40%, indicating a trade-off between strength and plastic deformation capability. The Si6 alloy displays the highest yield strength of ~518 MPa and an ultimate tensile strength of ~1053 MPa, with a maximum plastic strain of ~35%, indicating that the enhanced strength is achieved at the expense of ductility. In addition, a distinct yield tooth appears in the stress–strain curve of the Si6 alloy, which can be ascribed to Lüders-type deformation [19,20]. This behavior can be rationalized by the segregation of solute Si atoms to dislocation cores during annealing, where they form Cottrell atmospheres that immobilize dislocations. As a result, a higher applied stress is required to overcome the pinning, leading to a yield-drop phenomenon followed by localized deformation in the form of Lüders bands. These bands subsequently propagate through the gauge section while adjacent regions remain elastically strained, thereby prolonging the yield plateau. Notably, these alloys display a good combination of high strength and ductility at room temperature.
Additionally, the yield strength increases approximately linearly with Si content, which can be described as follows [21]:
where σy is the yield strength, and c is the Si content (in at.%). K represents the linear coefficient and can be calculated as 42 MPa × (at.%)−1, and σ0 is the yield strength of the Si-free alloy. Based on the yield strength of the studied MEAs, the yield strength of the Si-free alloy is approximately 266 MPa. The coefficient of determination is R2 = 0.947, which indicates a strong linear correlation.
The observed improvement in mechanical properties is attributed to Si-induced solid solution strengthening. Unlike the transition-metal constituents, Si is a metalloid with distinct atomic size, crystal structure, electronic structure, and physical properties [22]. The atomic radii are rSi = 1.32 Å, rFe = 1.24 Å, rCo = 1.25 Å, rCr = 1.40 Å, and rNi = 1.24 Å. Si has a larger atomic radius than those of Fe, Co, and Ni, but smaller than Cr, which results in lattice distortion within alloy systems. This distortion enhances strength via solid solution strengthening [23]. The extent of this effect is largely dependent on Si concentration, as higher Si content leads to greater distortion. Therefore, precise control of Si content is crucial for optimizing lattice-distortion-induced solid solution strengthening and to tailor the alloy’s mechanical properties.
The hardness of the studied alloys was measured to assess the influence of Si content, as shown in Figure 4. With an increase in Si content, the MEAs exhibit a hardness improvement. The hardness values of Si2, Si4, and Si6 alloys are 208 ± 5.0 HV, 229 ± 4.5 HV, and 262 ± 4.8 HV, respectively. Higher Si content increases the material’s resistance to localized deformation. These results indicate that the substitution Si for Co and Ni produces a solid solution strengthening effect. Additionally, in high-entropy alloys, a single BCC phase typically provides high strength but limited plasticity, whereas an FCC phase offers excellent ductility at the expense of strength [18]. As a result, the enhanced yield strength and ultimate tensile strength of the studied MEAs can be attributed to the increased volume fraction of the BCC phase and Si-induced solid solution strengthening.
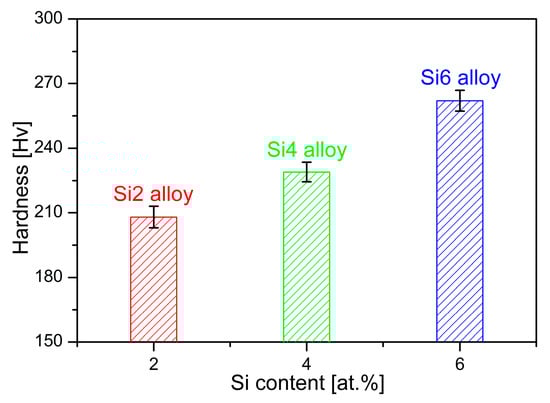
Figure 4.
Hardness test results for Fe65Co10−xNi10−xCr15Si2x (x = 1, 2, and 3 at.%) MEAs with different Si contents.
3.4. Corrosion Resistance
The OCP curves for Fe65Co10−xNi10−xCr15Si2x (x = 1, 2, and 3 at.%) MEAs with different Si contents are shown in Figure 5. Surface stability was evaluated by monitoring the OCP for 3600 s in 3.5 wt % NaCl. Although all curves eventually stabilized in the NaCl solution, the final stabilization potentials exhibit distinct differences, indicating that Si content significantly influences corrosion potential. The stabilized EOCP values for the Si2, Si4, and Si6 alloys are −141.86, −180.18, and −107.85 mV/SCE, respectively. Notably, the OCP value decreases as Si increases from 2 at.% to 4 at.%, and subsequently increases at 6 at.%. A more positive EOCP generally reflects greater electrochemical stability of the passive film and a reduced thermodynamic driving force for corrosion [18,24]. In particular, Si6 exhibits the most positive potential EOCP, indicating the most stable passive film among the compositions. Therefore, Si content substantially affects the corrosion performance of these MEAs. A similar non-monotonic trend in stabilized EOCP with Si content was reported for AlZrNbTiSix HEAs with increasing Si content [16]. However, EOCP is a mixed potential governed by the balance between anodic and cathodic reactions; thus, it cannot be used as the sole indicator of corrosion resistance. The observed non-monotonic trend suggests a complex influence of Si on corrosion potential, possibly involving variations in the kinetics and stability of passive film formation. The actual corrosion is further analyzed in the subsequent sections.
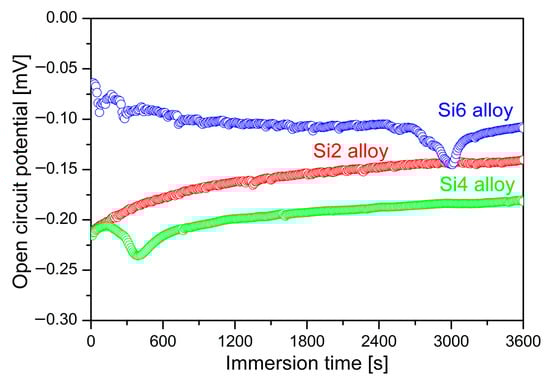
Figure 5.
OCP curves of Fe65Co10−xNi10−xCr15Si2x (x = 1, 2, and 3 at.%) MEAs in 3.5 wt.% NaCl solution.
Representative potentiodynamic polarization curves for Fe65Co10−xNi10−xCr15Si2x (x = 1, 2, and 3 at.%) MEAs in a 3.5 wt.% NaCl solution are shown in Figure 6. All curves display similar electrochemical behaviors, and can be divided into four distinct regions: (i) cathodic polarization, (ii) active dissolution, (iii) passivation, and (iv) transpassivation. With increasing Si content, the transition from the Tafel region to a stable passivation plateau indicates spontaneous passivation in the solution and formation of compact passive films. In the cathodic polarization region, pronounced Tafel characteristics indicate hydrogen evolution reaction, whereas the anodic plateau confirms passive-film formation. A steep slope in the current density denotes passive-film breakdown and a concomitant rise in corrosion rate. Moreover, the polarization curves shift towards lower current densities as Si content increases. This suggests that both the anodic dissolution reaction and the cathodic hydrogen evolution reaction are suppressed, contributing to improved corrosion resistance.
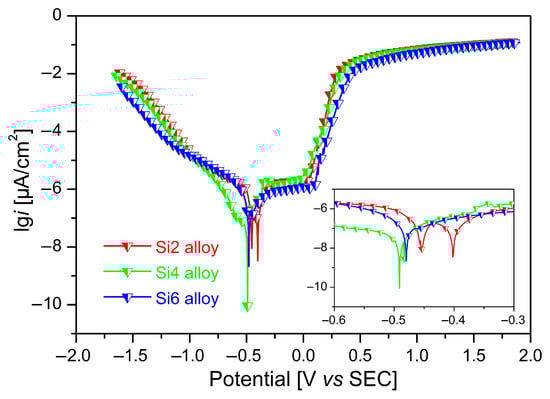
Figure 6.
Potentiodynamic dynamic polarization curves of Fe65Co10−xNi10−xCr15Si2x (x = 1, 2, and 3 at.%) MEAs in 3.5 wt.% NaCl solution.
The Tafel extrapolation method was used to extract the electrochemical parameters from both the cathodic and anodic branches of the polarization curves. The determined corrosion potential (Ecorr), corrosion current density (Icorr), and corrosion rate values are listed in Table 1. Ecorr reflects the thermodynamic tendency to corrode, where a more positive Ecorr generally indicates greater corrosion resistance [25]. Icorr represents the corrosion rate per unit area. A lower Icorr indicates improved corrosion resistance. The Si6 alloy exhibits a significantly reduced corrosion rate compared with Si2 and Si4 alloy, indicating superior corrosion resistance. Ecorr becomes more negative with increasing Si content, decreasing from −0.480 ± 0.05 V for the Si2 alloy to −0.371 ± 0.02 V for the Si4 alloy, and then to −0.650 ± 0.03 V for the Si6 alloy. The corresponding Icorr are (1.21 ± 0.02) × 10−6, (0.709 ± 0.03) × 10−6, and (0.401 + 0.19) × 10−6 A × cm−2, respectively. Although a more negative Ecorr generally indicates a higher thermodynamic tendency to corrode, corrosion behavior depends on both Ecorr and Icorr. Si6 shows the most negative Ecorr and the lowest Icorr, resulting in the lowest corrosion rate. The calculated corrosion rates decrease from approximately ~14.1 ± 0.10 μm·year−1 for the Si2 alloy to ~8.07 ± 0.27 μm × year−1 for the Si4 alloy, and to ~4.65 ± 0.19 μm × year−1 for the Si6 alloy. These results indicate that increasing Si content in these MEAs substantially could reduce Icorr and the corrosion rate, thereby suppressing anodic dissolution and cathodic hydrogen-evolution reactions.

Table 1.
Electrochemical parameters obtained from polarization tests of Fe65Co10−xNi10−xCr15Si2x (x = 1, 2, and 3 at.%) MEAs in 3.5 wt.% NaCl solution.
To investigate the effect of Si addition on the corrosion resistance, electrochemical impedance spectroscopy (EIS) measurements were carried out at OCP in a 3.5 wt.% NaCl solution. The EIS results are presented in Figure 7. The Nyquist plots are shown in Figure 7a. All MEAs display similar characteristics, as characterized by capacitive arcs in their Nyquist plots. This capacitive response indicates that the passive film exhibits predominantly capacitive behavior and the corrosion reaction is controlled by the process of charge transfer in a 3.5 wt.% NaCl solution. The diameter of the capacitive arc in the Nyquist plot reflects the polarization resistance, and an increase in arc diameter corresponds to an increase in polarization resistance. The Si6 alloy exhibits a larger capacitive arc diameter than Si2 and Si4, confirming an increase in polarization resistance. Therefore, the Nyquist plots confirm that higher Si content promotes formation of a more stable and protective passive film on the alloy surface in a 3.5 wt.% NaCl solution.
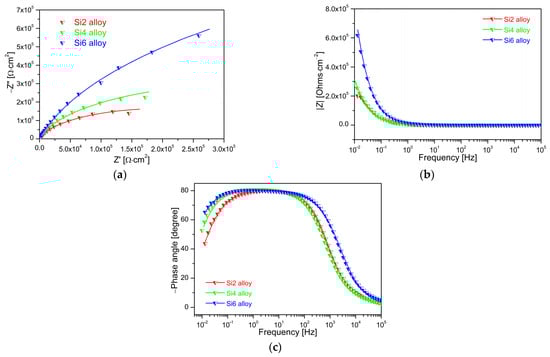
Figure 7.
EIS diagram of Fe65Co10−xNi10−xCr15Si2x (x = 1, 2, and 3 at.%) MEAs in 3.5 wt.% NaCl solution. (a) Nyquist plots; (b) Bode magnitude; (c) phase angle plots. The solid lines indicate the fitted curves.
The Bode magnitude plot is shown in Figure 7b. Two relaxation time constants are observed, corresponding to medium- and low-frequency capacitive responses. In the high- region and medium-frequency regime, the Bode magnitude exhibits a constant |Z| value (horizontal line) with a phase angle near 0°, which corresponds to the electrolyte resistance (Rs). From the low- to medium-frequency region, the impedance magnitude of the Si2 and Si4 MEAs decreases approximately linearly with an angular slope of ~50°, while the Si6 alloy exhibits a markedly larger decline of around 73°. An impedance modulus exceeding 104 Ω × cm2 at the lowest frequency is indicative of a highly stable passive film [26]. For the MEAs, the impedance value |Z| of Si6 at the lowest frequency exceeds 104 Ω × cm2, consistent with formation of a highly stable passive film. Figure 7c shows the phase-angle plot, which exhibits a broad peak. The phase angles of the MEAs are confined within a narrow window of 80.05°~80.64° in the medium-frequency region, suggesting non-ideal capacitance behavior due to surface heterogeneity. The similar phase angles among the MEAs indicate their comparable capacitive behavior and the protective passive film.
The equivalent electron circuit model used to fit the EIS data with two constant phase elements CPEs is shown in Figure 8, and the simulation comprises two time constants. The corresponding fitting parameters are listed in Table 2. In this model, Rs, Rf, and Rct correspond to the solution resistance, the resistance of passive film, and the interfacial charge transfer resistance between the passive film and the substrate, respectively. The constant phase element (CPE) accounts for deviation from an ideal capacitor, and can be defined as follows [27]:
where Q denotes the admittance of CPE, j represents an imaginary number (), ω is angular frequency (ω = 2πf, f is the frequency), and n is the exponent for quantifying surface non-uniformity (0 ≤ n ≤ 1). When the exponent n = 1, the CPE exhibits the behavior of an ideal capacitor; when 0.5 < n < 1, it exhibits a non-ideal capacitor; when n = 0.5, it corresponds to a Warburg impedance with diffusion character; when n = 0, it acts as a pure resistor [28].
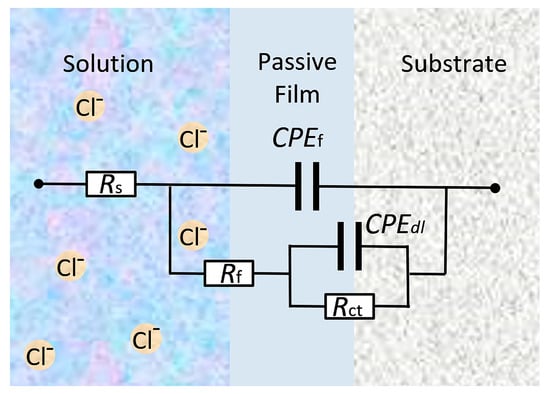
Figure 8.
Equivalent circuit models for interpreting EIS data of Fe65Co10−xNi10−xCr15Si2x (x = 1, 2, and 3 at.%) MEAs in 3.5 wt.% NaCl solution.
Table 2.
Equivalent circuit parameters for the fitting EIS data of Fe65Co10−xNi10−xCr15Si2x (x = 1, 2, and 3 at.%) MEAs in 3.5 wt.% NaCl solution at room temperature.
The equivalent electron circuit model comprises a solution resistance inside the pore resistance Rs in series with two parallel resistor–constant phase element (R–CPE) combinations. In this model, CPEf represents the capacitance associated with the solution/passive-film interface, while CPEdl denotes the electric double-layer capacitance. The dispersion exponents n1 and n2 (Table 3) approach 1 for all MEAs, indicating that the passive films exhibit capacitive characteristics similar to those of a smooth, uniform interface. For all samples, the fitted charge-transfer resistance Rct is substantially larger than the corresponding passive-film resistance Rf. Consequently, the corrosion resistance is highly dependent on the charge transfer resistance Rct. The Si6 alloy displays the largest Rct (7.05 × 10⁵ Ω⋅cm2), consistent with the slowest corrosion rate and the most stable passive film in a 3.5 wt.% NaCl solution. In contrast, Si4 exhibits the smallest Rct (2.66 × 10⁵ Ω⋅cm2). Consequently, Rct decreases from the Si2 to the Si4 alloy and then increases from the Si4 to the Si6 alloy with increasing Si content. In general, a larger Rct suggests a slower corrosion rate [29]. This trend reflects a higher energy barrier for charge transfer.
Table 3.
Chemical compositions of Fe65Co10−xNi10−xCr15Si2x (x = 1, 2, and 3 at.%) MEAs after electrochemical tests in a 3.5 wt.% NaCl solution.
The passive film thickness dfilm can be further estimated by the fitted EIS values, as shown in the following equation [30]:
Here, ε denotes the relative dielectric constant of the passivation film. In agreement with previous studies, ε for the passive film on HEAs was assumed to be 12 [31]. The vacuum dielectric constant ε0 was taken as 8.8542 × 10 F × cm−1 in the present calculation. S stands for the geometric area. The effective area used for calculations is defined as two times the geometric area in this study [31,32]. In the case of a surface layer with a normal time constant distribution, the effective capacitance derived from the CPE parameters is obtained by assessing the characteristic time constant corresponding to each impedance segment [33]. The effective capacitance Ceff associated with the CPE and the oxide passive film was calculated according to Equation (5), while the double-layer capacitance Cdl was obtained from Brug’s formula, as Equation (6). The calculations are presented as follows [33,34]:
The parameter values used for the calculations and the corresponding Ceff results are listed in Table 3. The oxide passive film thickness dfilm and the double-layer capacitance thickness ddl are also presented. For each alloy, Rs shows no significant variation. However, Rct is roughly four orders of magnitude higher than Rs. This observation indicates that the inner barrier layer forms a stable, compact film that plays a significant role in preventing corrosion in NaCl solution. With increasing Si content, the passive film thickness initially increases and then decreases. The total passivation thickness dtotal of Si4 alloy (21.67 nm) is more than twice that of the Si6 alloy (6.80 nm). It should be noted that corrosion performance depends not only on film thickness but also on intrinsic characteristics such as density, integrity, and electrochemical characteristics. For Si6, the significantly higher film resistance (Rf) and lower double-layer capacitance (Cdl) indicate that its passive film is denser, more continuous. This provides enhanced protection against corrosive media, despite its reduced thickness.
The calculated passive film thicknesses are comparable to those reported for some HEAs in a 3.5 wt.% NaCl solution at OCP conditions [16].
3.5. Corrosion Morphology
To further examine the corrosion characteristics, the surface morphologies of the Fe65Co10−xNi10−xCr15Si2x MEAs after potentiodynamic polarization tests are shown in Figure 9, with high-magnification views in the insets. The alloy surfaces display similar inhomogeneous corrosion morphologies composed of corroded and non-corroded regions. The non-corroded areas remain relatively smooth and covered by an intact oxide layer, whereas the corroded zones exhibit pronounced pitting corrosion. Such spatially inhomogeneous features are characteristic of localized pitting corrosion, which involves pitting initiation and its subsequent stable growth in a NaCl 3.5wt.% solution. During potentiodynamic polarization, pits nucleate at locations where the passive film is locally removed.
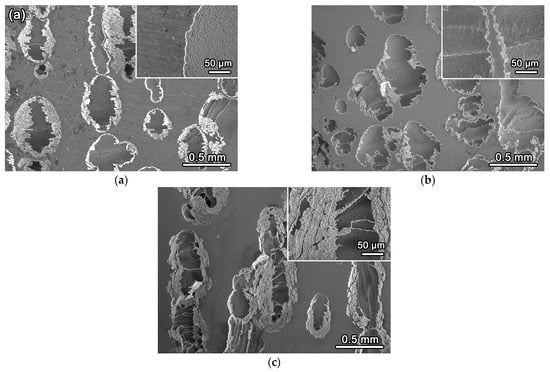
Figure 9.
Surface morphologies of Fe65Co10−xNi10−xCr15Si2x (x = 1, 2, and 3 at.%) MEAs after electrochemical tests, and the insets show high-magnification views. (a) Si2 alloy; (b) Si4 alloy; (c) Si6 alloy.
Anodic polarization, therefore, results in a site-specific breakdown of the protective oxide layer rather than homogeneous dissolution. The insets indicate that oxidation products offer substantial protection to the substrate in the non-corroded regions, whereas this protective is substantially reduced within pit sites. The observed heterogeneity in pit morphology and distribution indicates that both phase composition and microstructure significantly influence localized corrosion behavior and passive-film stability in chloride ion environments. Consequently, the corrosion resistance of these MEAs is critically dependent on the integrity and chemistry of the locally formed passive film. EBSD analysis (Section 3.2) reveals that increasing Si content markedly facilitates the development of the BCC phase, as evidenced by the increase in its volume fraction from 20.2 % in Si2 to 79.1 % in Si6. A higher BCC fraction leads to a more continuous microstructural network and fewer phase boundaries, which are preferential breakdown sites, favor the formation of a uniform, defect-poor passive film. This alteration in microstructural morphology, together with the stabilizing effect of Si on the passive oxide layer, correlates strongly with the superior corrosion resistance exhibited by the Si6 alloy.
Atomic compositions of both the corroded and non-corroded regions were determined by EDS, and the results are listed in Table 3. Both corroded and non-corroded regions exhibit significant deviations from their nominal compositions. As the nominal Si content increases from 2 to 6 at.%, the measured Si contents in the corroded regions are 1.38, 3.73, and 4.25 at.%, respectively, which are substantially lower than those in the corresponding non-corroded regions (2.31, 4.11, and 6.09 at.%). Overall oxygen content decreases with increasing Si content, and corroded areas exhibit significantly lower oxygen levels than non-corroded regions. Notably, EDS analysis revealed no quantitative oxygen signal in either the corroded or non-corroded regions of the Si6 alloy, suggesting the absence of a detectable oxide layer under the examined conditions. The absence of an oxygen signal does not imply that no oxide film formed. Instead, it is most likely due to the low sensitivity of EDS to light elements and the extremely thin, compact passive film on Si6, as indicated by its highest Rf and Rct values and lowest Cdl in the EIS measurements. In such cases, the incident electron beam can penetrate the nanoscale oxide and excite the metallic substrate. This interaction reduces the oxygen signal to below the detection threshold. Therefore, the limited direct O detection for Si6, together with the enrichment of Si and Cr in non-corroded regions and superior electrochemical parameters, strongly supports the presence of a dense Si- and Cr-rich oxide barrier layer.
By contrast, the contents of Fe, Cr, Co, and Ni in the corrosion regions exhibit no significant change. Pitting corrosion primarily involves the localized breakdown of the passive film rather than a selective dissolution of specific elements [35,36]. With increasing potential, pit initiation occurs, and the affected area may expand rapidly before developing steadily [37]. The results indicate that increasing Si content improves pitting resistance in non-corroded regions by strengthening the passive film, but this beneficial effect is limited where localized film breakdown already occurs.
Based on the dynamic polarization curves and EDS results, the oxidation process at anodic sites induces ionization of MEA atoms, releasing electrons and generating metal cations. Driven by local potential gradients, the resulting metal cations subsequently become solvated in the electrolyte, ultimately culminating in anodic dissolution. The anodic reaction can be concluded as follows:
where M denotes the different alloying elements, such as Fe, Co, Cr, Ni, and Si. n is defined as the number of valence electrons of the cations present. At the cathode, electrons facilitate the reduction of water, generating hydroxide ions that subsequently react with metal cations to form metal hydroxides. Upon dehydration, these hydroxides are converted into metal oxides. The overall cathodic and subsequent precipitation reactions can be represented as follows:
M → Mn+
Mn+ + nOH− → M(OH)n
M(OH)n → MO + nH2O
Electrochemical, compositional, and morphological evidence reveals the passive film formation mechanism in these MEAs. In 3.5 wt.% NaCl solution, anodic dissolution liberates Fe, Co, Cr, Ni, and Si cations (reaction 7), which hydrolyze at cathodic sites to form metal hydroxides (reaction 8) and subsequently dehydrate to oxides (reaction 9). The passive film consists of a Cr2O3 and SiO2 compact barrier layer, providing high chemical stability and low ionic conductivity. EDS analysis reveals preferential enrichment of Si and Cr in non-corroded regions, underscoring their incorporation into the barrier layer. Si-based oxides enhance passivity in chloride-containing media by lowering point defect density, hindering Cl− ingress, and stabilizing the passive film structure.
Electrochemical impedance spectroscopy reveals that, although the Si6 alloy possesses the thinnest passive film (~6.80 nm), it exhibits the highest Rf and Rct and the lowest Cdl among the tested alloys, indicating a thin but dense and defect-poor barrier that effectively suppresses anodic dissolution and cathodic hydrogen evolution. This phenomenon is attributable to the fact that Si6, although possessing the most negative Ecorr, exhibits the lowest Icorr and corrosion rate. By contrast, although Si4 exhibits the largest total film thickness, its comparatively lower Rct and higher Cdl suggest higher defect density and lower compactness in the barrier layer, thereby reducing its protective effectiveness. These results confirm that an optimal Si content of approximately 6 at.% promotes the formation of a Cr- and Si-rich passive barrier film with superior protective quality, which significantly enhances both pitting and general corrosion resistance in chloride environments.
4. Conclusions
In this work, the influence of Si additions on the microstructure, hardness, and mechanical behavior of Fe65Co10−xNi10−xCr15Si2x (x = 1, 2, and 3 at.%) MEAs were investigated systematically. Corrosion properties were also evaluated in 3.5 wt.% NaCl solution. Based on the analysis, the main conclusions are summarized as follows:
- (1)
- Microstructural characterization indicates that all Si-containing MEAs exhibit a dual-phase microstructure composed of FCC and BCC phases. Increasing Si content increases the volume fraction of the BCC phase and correspondingly decreases that of the FCC phase.
- (2)
- Both hardness and yield strength increase with Si content. Yield strength shows an approximately linear dependence on Si concentration. The strengthening is primarily attributed to Si-induced solid solution strengthening.
- (3)
- Electrochemical measurements in 3.5 wt.% NaCl indicate that the MEA with the highest Si content (Si6) has the best corrosion resistance among the compositions studied. Localized pitting was identified as the dominant corrosion mechanism.
Author Contributions
S.Y.: Supervision, writing—review and editing, funding acquisition. R.W.: Supervision, writing—review and editing, funding acquisition. X.W.: Formal analysis, data curation. J.C. and J.R.: Investigation. All authors have read and agreed to the published version of the manuscript.
Funding
This work was supported by the Shaanxi Innovation Capacity Support Program (Science and Technology Innovation Team, 2025RS-CXTD-027) and Youth Innovation Team Project of Shaanxi Universities (23JP073).
Institutional Review Board Statement
Not applicable.
Informed Consent Statement
Not applicable.
Data Availability Statement
The raw/processed data required to reproduce these findings are available on request from the corresponding author.
Conflicts of Interest
The authors declare no conflicts of interest.
References
- Wang, J.; Li, W.; Yang, H.; Huang, H.; Ji, S.; Ruan, J.; Liu, Z. Corrosion behavior of CoCrNi medium-entropy alloy compared with 304 stainless steel in H2SO4 and NaOH solutions. Corros. Sci. 2020, 177, 108973. [Google Scholar] [CrossRef]
- George, E.P.; Curtin, W.A.; Tasan, C.C. High Entropy Alloys: A Focused Review of Mechanical Properties and Deformation Mechanisms. Acta Mater. 2020, 188, 435–474. [Google Scholar] [CrossRef]
- Song, B.; Zhou, C.; Wei, J.; Hua, Y.; Zhou, W.; Song, Z.; Qian, D.; Li, W. The incorporation of Cr in enhancing the corrosion resistance, mechanical property and thermal stability of NbMoTaCrx coatings. J. Mater. Res. Technol. 2025, 36, 5890–5898. [Google Scholar] [CrossRef]
- Ma, E. Unusual dislocation behavior in high-entropy alloys. Scr. Mater. 2020, 181, 127–133. [Google Scholar] [CrossRef]
- Zhang, Y.; Zuo, T.T.; Tang, Z.; Gao, M.C.; Dahmen, K.A.; Liaw, P.K.; Lu, Z.P. Microstructures and properties of high-entropy alloys. Prog. Mater. Sci. 2014, 61, 1–93. [Google Scholar] [CrossRef]
- Zhou, Y.; Zhou, D.; Jin, X.; Zhang, L.; Du, X.; Li, B. Design of non-equiatomic medium-entropy alloys. Sci. Rep. 2018, 8, 1–9. [Google Scholar] [CrossRef]
- Gao, Q.; Feng, S.; Wei, R.; Chen, W.; Zhu, W.; Li, F. A novel low-cost and ultrahigh strength FeCoNiCrSi ferrous medium-entropy alloy at room and liquid nitrogen temperatures. Mater. Lett. 2022, 328, 133119. [Google Scholar] [CrossRef]
- Pan, Z.; Luo, H.; Zhao, Q.; Cheng, H.; Wei, Y.; Wang, X.; Zhang, B.; Li, X. Tailoring microstructure and corrosion behavior of CoNiVAlx medium entropy alloys via Al addition. Corros. Sci. 2022, 207, 110570. [Google Scholar] [CrossRef]
- Mohamed, O.; Hassan, M.; Egilmez, M.; Abuzaid, W.; Ibrahim, T.; Khamis, M. Corrosion behavior of CoCrNi/mild steel medium entropy alloy thin films. Mater. Today Commun. 2022, 30, 103015. [Google Scholar] [CrossRef]
- Zhou, Z.; Liu, B.; Guo, W.; Fu, A.; Duan, H.; Li, W. Corrosion behavior and mechanism of FeCrNi medium entropy alloy prepared by powder metallurgy. J. Alloys Compd. 2021, 867, 159094. [Google Scholar] [CrossRef]
- Cheng, J.; Ma, Y.; Wang, X.; Cheng, L.; Cao, Z. Excellent corrosion resistance of Fe37Ni37Cr20Al3Ti3 medium entropy alloy induced by sequential passivation strategy. J. Alloys Compd. 2025, 1034, 181437. [Google Scholar] [CrossRef]
- Wang, T.; Zhang, J.; Zhang, Y.; Chen, S.; Luo, Z.; Wu, J.; Zhu, L.; Lei, J. Improving wear and corrosion resistance of LDEDed CrFeNi MEA through addition of B and Si. J. Alloys Compd. 2023, 968, 172223. [Google Scholar] [CrossRef]
- Yuan, S.; Wu, S.; Chen, T.; Fu, Q.; Wei, R.; Chen, C.; Wang, T.; Cai, Y.; Li, F. Microstructure and corrosion behavior of Co-free FeCrNiSi0.4 medium entropy alloy coating fabricated by laser cladding. Intermetallics 2023, 162, 108024. [Google Scholar] [CrossRef]
- Jo, Y.H.; Yang, J.; Choi, W.M.; Doh, K.Y.; Lee, D.; Kim, H.S.; Lee, B.J.; Sohn, S.S.; Lee, S. Body-centered-cubic martensite and the role on room-temperature tensile properties in Si-added SiVCrMnFeCo high-entropy alloys. J. Mater. Sci. Technol. 2021, 76, 222–230. [Google Scholar] [CrossRef]
- Liu, B.; Li, J.; Peterlechner, M.; Zhang, H.; Wu, Y.; Wilde, G.; Ye, F. Microstructure and mechanical properties of Si micro-alloyed (Ti28Zr40Al20Nb12)100−xSix (x = 0, 0.1, 0.2, 0.5) high entropy alloys. Intermetallics 2023, 161, 107959. [Google Scholar] [CrossRef]
- Chang, Y.; Cheng, H.; Jin, X.; Li, Z.; Zhao, Q.; Wang, X.; Luo, H. Effect of Si on the corrosion resistance of AlZrNbTi lightweight refractory high-entropy alloys in acidic environment. Corros. Sci. 2024, 238, 112377. [Google Scholar] [CrossRef]
- Guo, S.; Ng, C.; Lu, J.; Liu, C.T. Effect of valence electron concentration on stability of fcc or bcc phase in high entropy alloys. J. Appl. Phys. 2011, 109, 103505. [Google Scholar] [CrossRef]
- Zhang, H.L.; Sun, X.; Lu, S.; Dong, Z.H.; Ding, X.D.; Wang, Y.Z.; Vitos, L. Elastic properties of AlxCrMnFeCoNi (0 ≤ x ≤ 5) high-entropy alloys from ab initio theory. Acta Mater. 2018, 155, 12–22. [Google Scholar] [CrossRef]
- Asmaa, A.A.; Lajos, D.; László, Z.T.; Irina, V.K.; Yuriy, I.C.; Dezső, L.B. Acoustic emission during Lüders-band type martensitic transformation and thermal recovery in Cr20Mn20Fe20Co34.4Ni5.6 high entropy shape memory single crystals. J. Alloys Compd. 2025, 1027, 180507. [Google Scholar] [CrossRef]
- Tian, Y.; Gao, S.; Zhao, L.; Lu, S.; Pippan, R.; Zhang, Z.; Tsuji, N. Remarkable transitions of yield behavior and Lüders deformation in pure Cu by changing grain sizes. Scr. Mater. 2018, 142, 88–91. [Google Scholar] [CrossRef]
- Yang, K.; Wang, Y.; Guo, M.; Wang, H.; Mo, Y.; Dong, X.; Lou, H. Recent development of advanced precipitation-strengthened Cu alloys with high strength and conductivity: A review. Prog. Mater. Sci. 2023, 138. [Google Scholar] [CrossRef]
- Wei, D.; Wang, L.; Zhang, Y.; Gong, W.; Tsuru, T.; Lobzenko, I.; Jiang, J.; Harjo, S.; Kawasaki, T.; Bae, J.W.; et al. Metalloid substitution elevates simultaneously the strength and ductility of face-centered-cubic high-entropy alloys. Acta Mater. 2022, 225, 117571. [Google Scholar] [CrossRef]
- Hu, Y.; Wang, X.; Ma, Y.; Chen, J.; Zhao, X.; Cheng, J.; Xu, T.; Zhao, W.; Song, X.; Wu, S.; et al. Strong solid solution strengthening caused by severe lattice distortion in body-centered cubic refractory high-entropy alloys. Scr. Mater. 2025, 263, 116671. [Google Scholar] [CrossRef]
- Wang, J.; Zhang, Z.; Dai, H.; Fujiwara, H.; Chen, X.; Ameyama, K. Enhanced corrosion resistance of CoCrFeMnNi high entropy alloy using heterogeneous structure design. Corros. Sci. 2022, 209, 110761. [Google Scholar] [CrossRef]
- Liu, J.; Cheng, Y.; Zhang, J.; Chen, C.; Zheng, C.; Ju, D.; Wu, Z.; Che, L.; Li, X.; Lv, Z. Effect of phosphorus on the corrosion resistance of CrMnFeCoNi high-entropy alloys prepared by hot isostatic pressing. J. Alloys Compd. 2025, 1039, 183157. [Google Scholar] [CrossRef]
- Su, B.; Luo, L.; Wang, B.; Su, Y.; Wang, L.; Ritchie, R.O.; Guo, E.; Li, T.; Yang, H.; Huang, H.; et al. Annealed microstructure dependent corrosion behavior of Ti-6Al-3Nb-2Zr-1Mo alloy. J. Mater. Sci. Technol. 2021, 62, 234–248. [Google Scholar] [CrossRef]
- Wang, J.; Jiang, H.; Chang, X.; Zhang, L.; Wang, H.; Zhu, L.; Qin, S. Effect of Cu content on the microstructure and corrosion resistance of AlCrFeNi3Cux high entropy alloys. Corros. Sci. 2023, 221, 111313. [Google Scholar] [CrossRef]
- Rai, P.K.; Shekhar, S.; Mondal, K. Development of gradient microstructure in mild steel and grain size dependence of its electrochemical response. Corros. Sci. 2018, 138, 85–95. [Google Scholar] [CrossRef]
- Song, D.; Ma, A.; Sun, W.; Jiang, J.; Jiang, J.; Yang, D.; Guo, G. Improved corrosion resistance in simulated concrete pore solution of surface nanocrystallized rebar fabricated by wire-brushing. Corros. Sci. 2014, 82, 437–441. [Google Scholar] [CrossRef]
- Mohammadi, F.; Nickchi, T.; Attar, M.; Alfantazi, A. EIS study of potentiostatically formed passive film on 304 stainless steel. Electrochim. Acta 2011, 56, 8727–8733. [Google Scholar] [CrossRef]
- Feng, L.; Yang, Y.; Zhao, Y.; Ma, K.; Cui, J. Corrosion behaviors and mechanism of AlxCrFeMnCu high-entropy alloys in a 3.5 wt% NaCl solution. Corros. Sci. 2024, 233, 112087. [Google Scholar] [CrossRef]
- Wallinder, D.; Pan, J.; Leygraf, C.; Delblanc-Bauer, A. Eis and XPS study of surface modification of 316LVM stainless steel after passivation. Corros. Sci. 1998, 41, 275–289. [Google Scholar] [CrossRef]
- Hirschorn, B.; Orazem, M.E.; Tribollet, B.; Vivier, V.; Frateur, I.; Musiani, M. Determination of effective capacitance and film thickness from constant-phase-element parameters. Electrochim. Acta 2010, 55, 6218–6227. [Google Scholar] [CrossRef]
- Yao, J.Y.; Serrano, L.B.; Santos, S.F.; Cardoso, K.R. Microstructure and corrosion behavior of the Ti-V-Cr-Nb high-entropy alloys in 3.5 wt% NaCl solution. Corros. Sci. 2023, 218, 111149. [Google Scholar] [CrossRef]
- Frankel, G.S. Pitting Corrosion of Metals: A Review of the Critical Factors. J. Electrochem. Soc. 1998, 145, 2186–2198. [Google Scholar] [CrossRef]
- Qiu, Y.; Thomas, S.; Fabijanic, D.; Barlow, A.J.; Fraser, H.L.; Birbilis, N. Microstructural evolution, electrochemical and cor-rosion properties of AlxCoCrFeNiTiy high entropy alloys. Mater. Des. 2019, 170, 107698. [Google Scholar] [CrossRef]
- Wang, Y.Q.; Hao, S.; Li, N.; Xiong, Y.H.; Jing, H.M. Effect of Sigma Phase Precipitation on the Pitting Corrosion Mechanism of Duplex Stainless Steels. Int. J. Electrochem. Sci. 2018, 13, 9868–9887. [Google Scholar] [CrossRef]
Disclaimer/Publisher’s Note: The statements, opinions and data contained in all publications are solely those of the individual author(s) and contributor(s) and not of MDPI and/or the editor(s). MDPI and/or the editor(s) disclaim responsibility for any injury to people or property resulting from any ideas, methods, instructions or products referred to in the content. |
© 2025 by the authors. Licensee MDPI, Basel, Switzerland. This article is an open access article distributed under the terms and conditions of the Creative Commons Attribution (CC BY) license (https://creativecommons.org/licenses/by/4.0/).