Article

Organic Patinas on Small Historical Bronzes: From Mock-Ups to Actual Artworks

1
OPD, Opificio delle Pietre Dure, via Alfani 78, 50129 Florence, Italy
2
CNR-INO, National Research Council, Istituto Nazionale di Ottica, Largo Fermi 6, 50125 Florence, Italy
*
Author to whom correspondence should be addressed.
Coatings 2024, 14(2), 212; https://doi.org/10.3390/coatings14020212
Submission received: 29 December 2023 / Revised: 25 January 2024 / Accepted: 2 February 2024 / Published: 6 February 2024
(This article belongs to the Special Issue Functional Coatings for Cultural Heritage Conservation)

Abstract

:
This paper deals with the study of organic coatings (patinas) on historical bronzes, specifically those applied on small-size statues in Renaissance workshops. These coatings, often transparent and translucent, contain a mixture of organic and inorganic components and may be still preserved in hidden parts of statues in indoor displays. However, the complexity of the original varnishes, their degradation and alteration over time, and the coexistence of materials added for conservation and maintenance purposes are challenging for their characterization. The often well-preserved surface of varnished bronzes and their small size make it mandatory to make the most of using noninvasive techniques for their investigation. To this end, to simulate the actual historical coatings, we prepared a set of mock-ups following ancient recipes and using materials that were available in the Renaissance. We used the samples to assess to what extent it is possible to disclose the formulation (binders, colourants, and other additives) and the thickness of a Renaissance patina with noninvasive methods. Microprofilometry (MP), optical coherence tomography (OCT), and eddy current (EC) gauge were tested on the samples and the results were combined with reflectance Fourier transform infrared (FT-IR) spectroscopy. The analyses performed on the mock-ups set the ground for investigating a Renaissance bronze featuring reddish semi-transparent varnish layers. The achievements are discussed in this paper, along with the limitations of the use of a noninvasive approach.

Graphical Abstract

1. Introduction

Organic varnishes were often applied on small historical bronze statues, typically made for private collections in Renaissance times, with the aim to not only protect the surface and enhance the beauty of the finished sculpture but also to hide defects from the casting process. This organic coating, called patina or patination, is coloured and frequently translucent; it might contain a mixture of organic and inorganic components such as resins, oils, gums, dyestuffs, and pigments, often in a very small amount [1]. Over time, the original patinas may alter due to the environmental conditions of either the museum, the gallery, or, generally speaking, the space for the display of the artwork. Later on, conservation treatments can be carried out by applying a variety of organic varnishes both to prevent the development of corrosion and for aesthetic reasons. Since the early 2000s, the translucent patinas on small-size bronze statues have become the focus of interest of many research groups [2,3,4,5,6,7,8,9]. For instance, at the Frick Collection in New York, a systematic study of their bronze collection has recently started, and in 2017, the symposium “Organic Coatings and Patina on Bronzes Study Day” was organized, where experts from around the world shared their knowledge and experience on this topic.
At the Opificio delle Pietre Dure (OPD), a variety of analyses of coatings are carried out as part of the conservation project; indeed, the characterization of the composition of organic materials on the statues’ surface has a remarkable impact on both the conservation/preservation actions and the understanding of the technologies and materials used by the different workshops. However, the complexity of the original blends, their degradation and alteration over time, as well as the coexistence of materials added for conservation and maintenance purposes, make their identification a challenging goal [2]. As far as small-scale objects exhibiting very well-preserved surfaces are concerned, even an extremely small scrape for taking samples results in a visually impacting flaw. Moreover, their small size makes it difficult to find a region suitable for sampling, thus restricting the use of techniques such as gas chromatography–mass spectrometry (GC-MS) [3,4].
A few years ago, in the framework of a thesis carried out at the OPD School of Conservation on the study of organic coatings on indoor Renaissance bronzes, a set of mock-ups was specifically prepared using commercial materials and following the recipes described in Renaissance sources to simulate the possible sequences used for varnish coatings in the past [10]. The materials were used either on their own or in mixtures and were laid in different sequences. Although incomplete and only partially compliant with the ancient materials, the mock-ups are aimed at investigating the historical procedures to ascertain the use of the different agents and the effects achieved thereafter and are the starting point for generating a reference database for the analysis of coatings.
The work presented in the current paper is therefore part of a broader project that involves the preparation of more samples by varying both ingredients and treatments. The goal of the work is twofold: (a) to help understand the historical procedures of patination and the visual effect achieved on bronze surfaces and (b) to build up and enlarge an analytical database of organic coatings on bronze supports to study the correlation among the thickness, colour, spectral features, and texture of the coating. Furthermore, the samples will undergo accelerated and natural ageing, cleaning tests, and restoration interventions consisting of the application of a new patina. The final and challenging aim of the general project is the ascertainment of the composition and morphology of the original patina when the latter is covered by deposits or materials due to restoration. In the framework of the project, other noninvasive methods for the in situ thickness evaluation of coatings will be considered (e.g., portable X-ray fluorescence, ellipsometry, and interferometry), and other techniques such as GC-MS and Raman spectroscopy will be included for the compositional analysis.
The subset of mock-ups discussed in this work is meant to be the starting point for building a collection of reference materials and related analytical data to be shared among researchers working on this subject. The samples have been characterized by means of a set of noninvasive techniques, i.e., reflectance FTIR (r-FTIR), eddy currents (EC), optical coherence tomography (OCT), and micro-profilometry (MP) for analysing the composition, thickness, evenness, and topography of the various varnishes.
Comprehensive information about the surface morphology and the composing materials is fundamental when choosing proper conservation treatments; old layers of superimposed wax or varnishes with embedded dust often obscure the appearance of the surface, and their cautious and selective removal is necessary to achieve the shine of the original surface. Mapping the materials and thicknesses across the surface is also fundamental when selecting the areas where a limited number of meaningful samples can be taken by scraping, whenever the invasive analysis is needed to provide more insights. A similar approach has been proposed for the study of the varnish layers on musical instruments such as violins [6].
Tests performed on the mock-ups have set the precedent for a more aware use of these techniques. As a proof of concept of the multi-analytical approach presented herein, the results obtained on a Renaissance relief from the National Museum of Bargello in Florence (Italy), featuring a reddish semi-transparent varnish layer, are discussed.

2. Materials and Methods

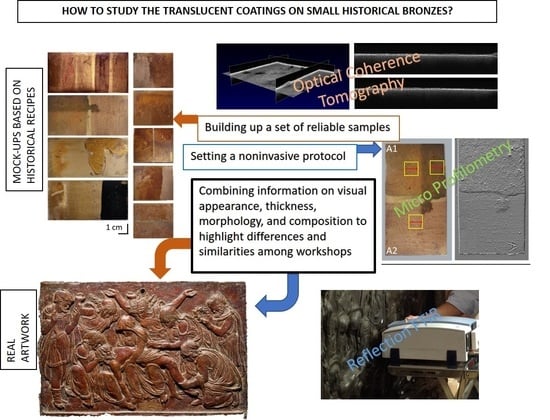
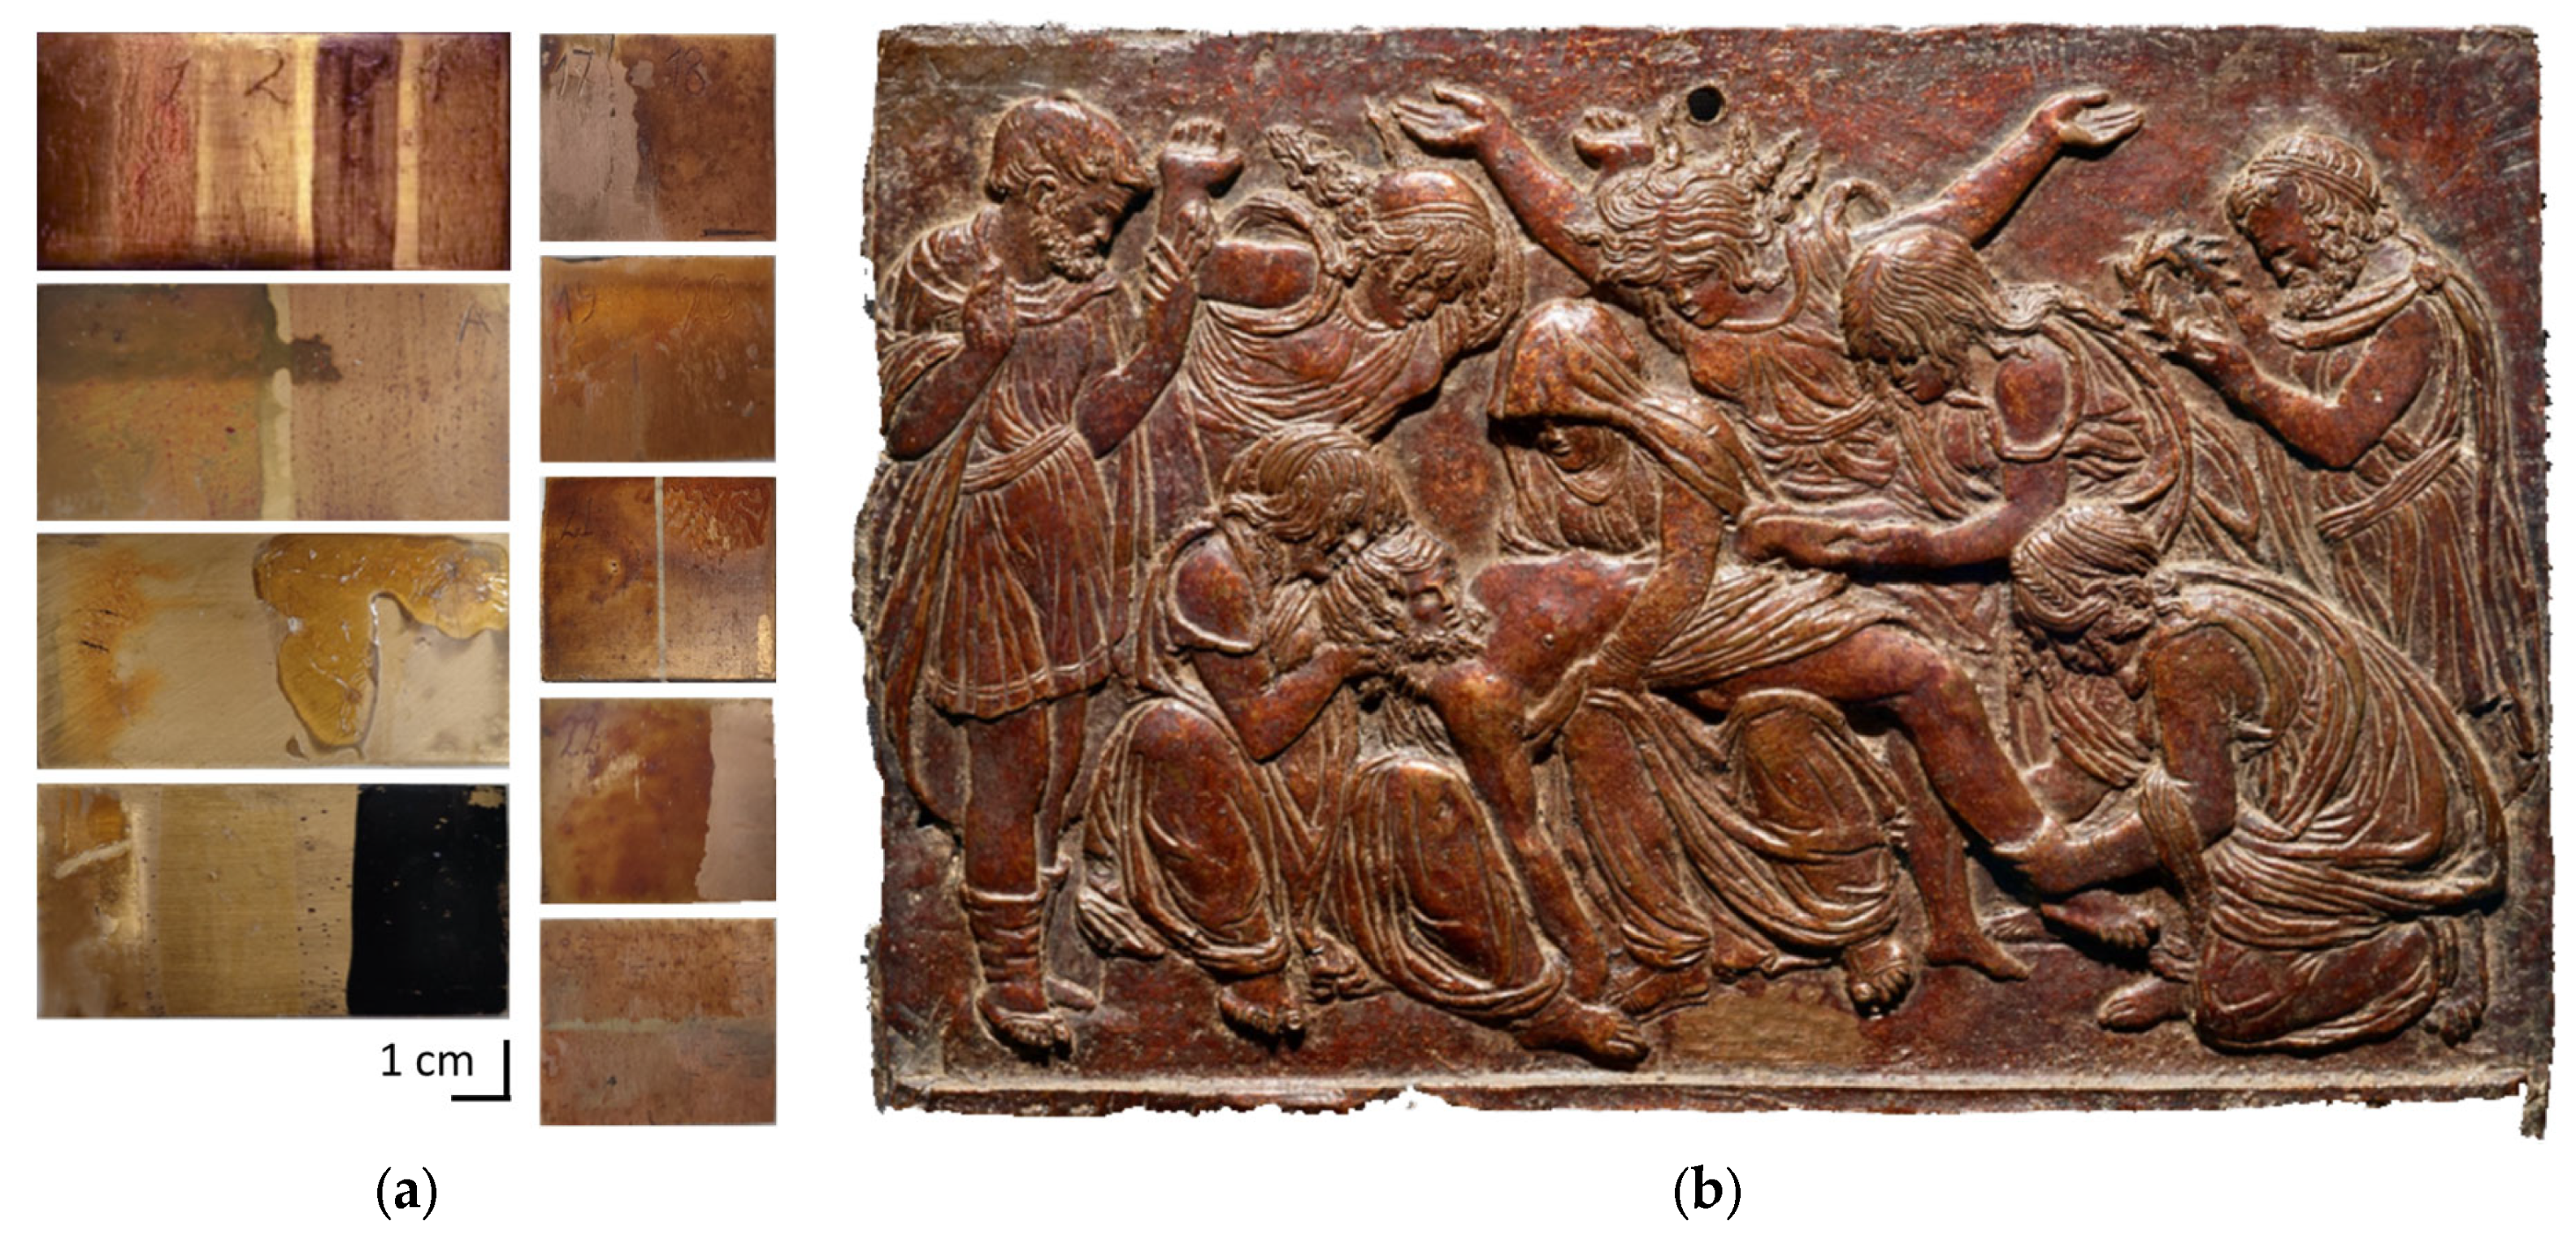
2.1. Mock-Ups Simulating Historical Reconstructions and Renaissance Relief

The first aim of the mock-ups simulating historical patinated bronzes was to check the visual effect of various blends on the metal surface and to test how far varying ingredients and application processes may impact the final result in terms of spreadability, appearance, and evenness of the varnish layer. Although several recipes for colouring copper alloys were applied on the metal coupons to produce the mock-ups, the range of options is so wide that reproducing all the possible real cases is impossible. The choice of patination methods and mixtures was based on old handbooks and historical treatises [11,12,13,14,15]. Since the case study presented herein is a reddish-coloured relief, in this paper, we focused on the varnishes imitating the red tone surfaces of many Renaissance bronzes. For reproducing the red coatings, valuable indications are provided by the pioneering work of Stone [1], who tested the effect of adding red lake and other colourants to transparent varnishes. He suggested that also burgundy pitch, a resin extracted from spruce trees (Picea species), might have a key role in the achievement of the final tone. As an implementation of the work of Stone, we prepared some samples where iron-based pigments were added to the transparent varnish. This practice is suggested by Massimiliano Soldani Benzi (1656–1740) [16] who asserted that pigments containing iron are very important to bring about a red hue.
Many variables have an impact on the final appearance of the coated bronze; the most remarkable ones include the following:
(1) The alloy composition. It is reported that since ancient times, the choice of alloy composition for statuary was based not only on workability and castability but also on colour [17]. Apart from their colour, the distinct alloys react differently to hot or cold treatments. The coupons of our project were produced by Fonderia Battaglia (Milano, Italy), according to two formulations: a quaternary alloy (Cu 88%, Sn 6%, Zn 4%, Pb 2%) and a 90–10 bronze (Cu 90 wt %, Sn 10%). Both compositions are quite representative of Renaissance alloys, though several variations (in terms of lead content and the presence of trace elements such as arsenic, antimony, and iron) are found, depending on the period, the workshop, and the artist’s evolution. All the coupons tested for this work belong to the quaternary alloy group; the composition of the naked coupons was checked by portable X-ray fluorescence;
(2) The mechanical refinement (chiselling, filing, abrasion) of the metal substrate. These procedures affect the surface morphology, which in turn may change the adhesion of the coating and its reflectance properties. The surfaces of our coupons were degreased with acetone and smoothed with fine abrasive paper (grit 220), and no other refinement was applied in order to limit/restrict the number of variables;
(3) Pre-patination treatments with heat or chemicals (acidic and alkaline). In this case, the combinations that could have a considerable effect are cold or warm substrates treated with either cold or warm solutions. We tested the effect of the application of warm solutions as well as the effect of post-heating on the patinated coupons. We also applied a 5% caustic soda solution on some coupons before laying the coating.
The list of the recipes tested in this work (a subset of a more comprehensive one) is reported in Table A1 in the Appendix A, along with the methods for preparing the substrate. More information on the procedures is given in Appendix A.
A 1 cm2 square fragment was cut from five samples, embedded in polyester resin, and polished to prepare reference cross-sections for scanning electron microscopy (SEM) for cross-comparison with the other techniques.
After analysing all the mock-ups (Figure 1a), we have investigated a bronze relief (20 cm × 13.5 cm) depicting the Lamentation over the Dead Christ (Compianto, Figure 1b) and featuring a transparent patination layer with a reddish hue. The artwork was made in 1470 by Bertoldo di Giovanni, Donatello’s pupil, and is on display at the National Museum of Bargello (Firenze, Italy).

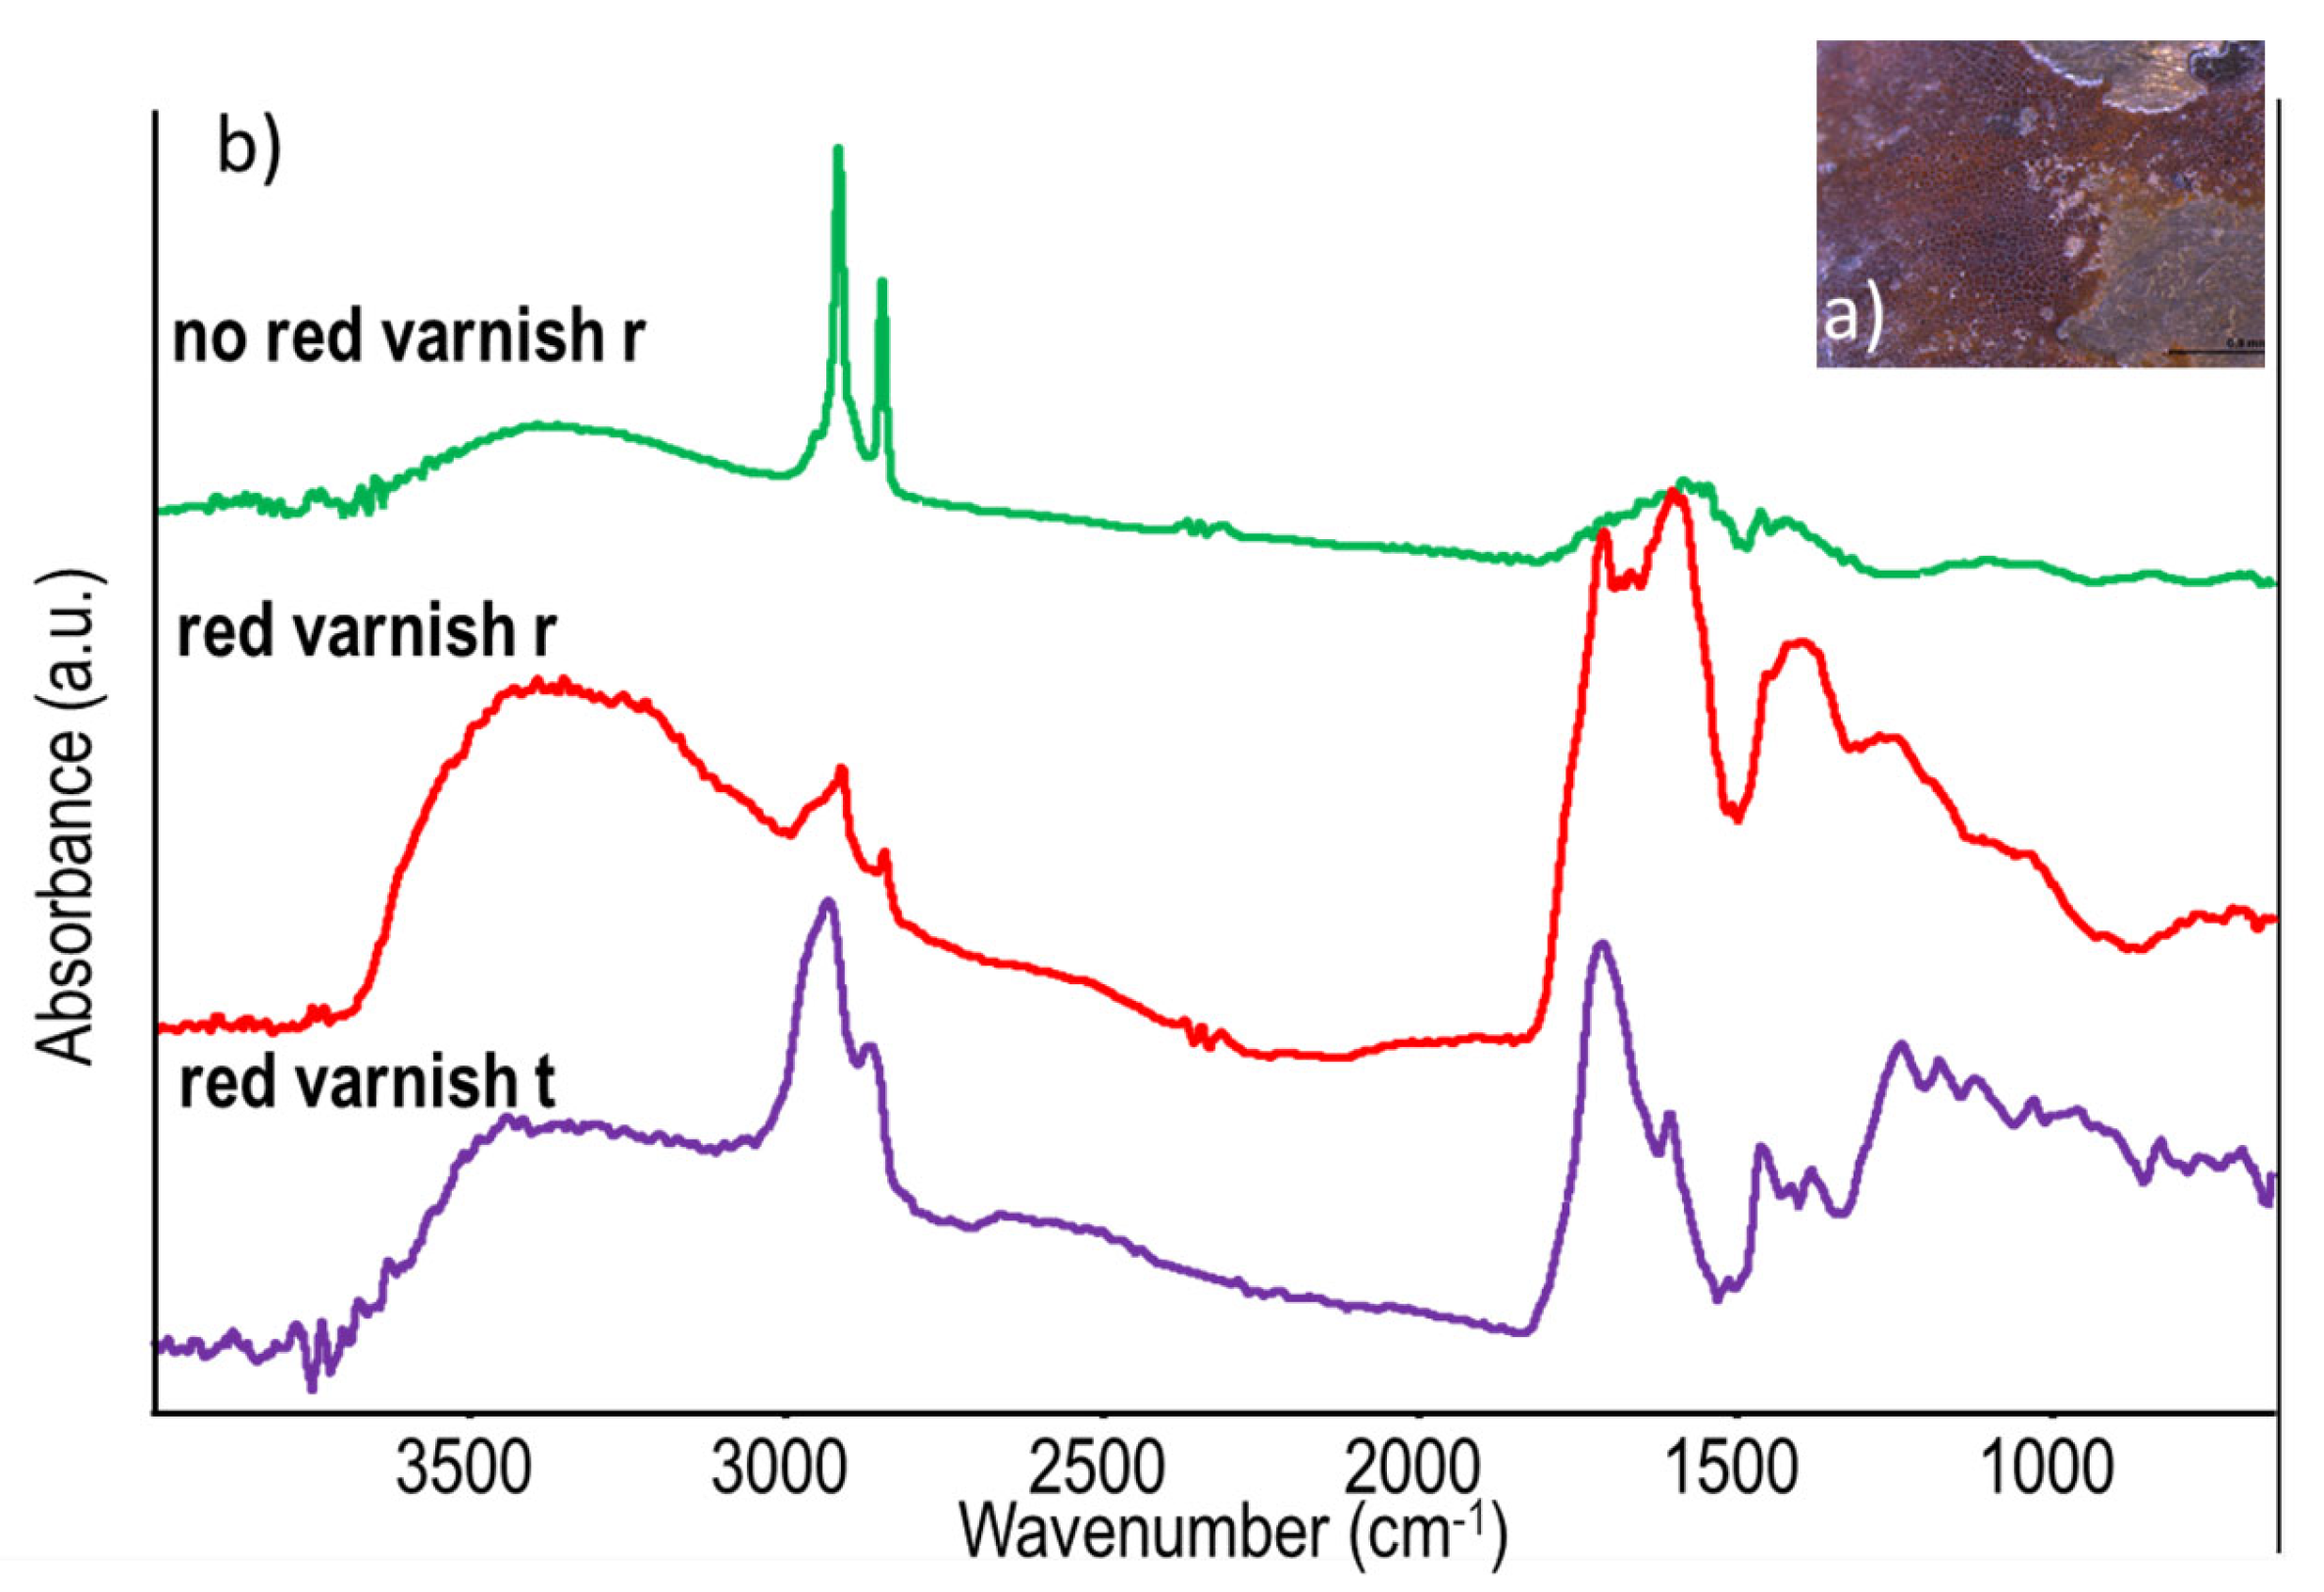
2.2. Fourier Transform Infrared Spectroscopy (FTIR)

The instrument used for reflectance Fourier transform infrared spectroscopy (FTIR or r-FTIR) was an Alpha FTIR Spectrometer (Bruker Optics, Ettlingen, Gemany) equipped with a module for external (specular + diffuse) reflection with an angle of incidence of 25°. The spectral range is 400–4000 cm−1 with 4 cm−1 resolution. Background spectra were recorded using the reference cap with a gold-coated mirror.
In order to probe the homogeneity of the varnish layers, on each sample, three areas of 5 mm diameter were analysed by acquiring 100 scans for both the background and sample spectra. Spectral analysis was made with the OPUS software (8.8 release).
FTIR measurements in transmission (t-FTIR) mode were also performed by means of a Thermo Nicolet NEXUS spectrometer. Scrapings from the surface of the mock-ups were homogenously ground in a mortar with KBr to make pellets. The spectral range is 400–4000 cm−1 at 4 cm−1 resolution. Spectra were acquired using 128 scans. Chips or drops of raw materials were analysed with t-FTIR to check their composition and to use them as a reference. In order to be able to focus on small regions of interest, the IR Continuum microscope in reflection mode was used to measure Bertoldo’s relief in the range of 600–4000 cm−1. Owing to the weathering of the materials and the small size of the analysed area (square of ≤50 µm side), acquisitions of up to 356 scans were necessary to obtain a good signal-to-noise ratio. Spectral analysis was made with the OMNIC Specta software (2.2.43 release).
The acquired spectra have been plotted either as absorbance A or pseudo-absorbance A′, where A′ = log (1/R), for t-FTIR and r-FTIR spectra, respectively, without normalization or baseline corrections. A smoothing filter was applied to the microtransmission spectra. Transmission spectra of raw materials (not reported) were also acquired and compared to the reference spectra reported in the literature and those of the in-house and online databases.

2.3. Optical Coherence Tomography (OCT)

Optical coherence tomography is a noninvasive interferometric method for the noncontact imaging of the internal microstructure of semi-transparent or transparent materials. It provides high-resolution cross-sectional tomograms of samples, which moderately scatter and/or absorb the probing light. In recent years, OCT has been used for the study of artworks [18,19,20,21,22,23] for the visualization of low-scattering varnish and semi-transparent paints, sometimes enabling the visualization of underdrawings.
A spectral-domain OCT device (Telesto-II by Thorlabs, Newton, NJ, USA) was used, operating at 1300 nm centre wavelength, with a 3.5 mm maximum imaging depth, 5.5 μm axial resolution in air, and 13 μm lateral resolution. In this study, an average refractive index of 1.5 was considered for the organic varnish layers.

2.4. Microprofilometry (MP)

Microprofilometry is an incoherent-light interferometric technique allowing for distance and multidimensional measurements at the micrometric level [24,25]. The microprofilometer used is a custom-made device developed by the Heritage Science Group of CNR-INO. The instrument is based on a commercial probe, composed of a laser diode at λ = 655 nm and a birefringent crystal sandwiched between two circular polarizers, mounted on two motorized high-precision linear stages for horizontal and vertical displacements. For the present application, the probe was equipped with a 50 mm lens, which sets a stand-off distance of 4 cm with 8 mm dynamic range and 1 μm axial and 20 μm lateral resolution [26].

2.5. Eddy Currents (EC) Gauge

A thickness gauge (LEPTOSKOPE by Karl Deutsch, Wuppertal, Germany), based on the Eddy Currents (EC) method, was used for evaluating the coating thickness; the measurement area is 1 mm diameter, and the zero calibration procedure was performed on uncoated portions of the samples. The calibration of the instrument was checked on the uncoated parts using plastic foils of known thickness. On each sample, 10 evenly distributed measurements were taken and averaged. The main advantages of the EC device are the portability (it is a hand-held device), ease of working, and fast response. However, its use has some drawbacks: it is a contact and point-wise probe, it is unable to take measurements near the edges, and good planarity of the measured surface is required. Surface roughness, defects not visible to the naked eye, and pores cannot be reliably measured. Since the zeroing needs to be carried out on the same substrate, a free (uncoated) area of the surface is needed. Reliable measurements are not achievable for thicknesses below 3–5 μm [27,28].

2.6. Scanning Electron Microscopy (SEM)

Scanning electron microscopy was performed with an EVO ® MA 25 microscope (Zeiss, Oberkochen, Germany) operating at variable pressure. Square fragments cut from the patinated samples have been gold sputtered prior to embedding them in polyester resin. After drying, the resin blocks were polished with abrasive paper and carbon-coated. The gold coating makes the organic film visible in the cross-section and allows us to check that the polishing phase does not affect the varnish film continuity [29]. Images were acquired in high vacuum conditions using 20 kV voltage and 200 pA beam current, with a backscattered (BSE) and secondary (SE) electron detector. Elemental analysis was performed with the energy-dispersive probe X-MAX 80 mm2 (Oxford, High Wycombe, UK). AZTEC® software (version 4.0) was used for acquisition and image processing.

3. Results and Discussion

3.1. Mock-Ups

An example of the results obtained with the combined use of MP, SEM, and OCT is shown in Figure 2 for mock-ups A1–A2. The samples were prepared with a basic mixture of linseed oil and mastic resin in spirit of turpentine (1 part of oil: 1 part of mastic varnish) (see Appendix A), with the addition of either madder lake or hematite grains (sample A1 and A2, top and bottom of the coupon, respectively). In both cases, the varnish applied showed a reddish tone; nonetheless, the diverse viscosity of the two mixtures produced coatings with significantly different characteristics: the different hue is clearly discernible in the visible image (Figure 2a); the different morphology appears in the raking light image from the MP (Figure 2b) and the distinct thickness in the differently treated areas is visible in both SEM and tomographic images (Figure 2c–g).
The varnish thickness measured with the eddy current gauge, reported in Table 1, is the mean over ten values acquired in the areas highlighted in yellow in Figure 2a and is equal to 54.6 ± 2.0 μm, 101.0 ± 6.0 μm, and 13.8 ± 2.2 μm for sample A1 left, A1 right, and A2, respectively, and the error is the standard deviation of the values’ distribution. The three cross-sections were acquired by OCT along the red arrows in Figure 2a. In the first two images, the thickness appears rather inhomogeneous on the micrometric scale: layer A1, with madder lake, has a thickness in the range of 38.9–71.2 μm and 78.0–123.6 μm for the left and right halves, respectively (Figure 2e–g). Sample A2, with hematite, is thinner than A1, having a thickness ranging from 12.1 to 16.6 μm. The mean thickness values measured with OCT are in good agreement with the EC ones (Table 1). The OCT standard deviation accounts for the variability of the thickness along the tomographic cross-sections; huge standard deviation values are found whenever the thickness coating is highly uneven or bubbles or gaps are present, whereas small standard deviation values indicate an even layer. Due to the great variability of the thicknesses over the tomocubes, in Table 1, the thickness range measured with OCT is reported for each area, in addition to the mean value and the standard deviation.
The MP raking light image (Figure 2b) enhances the different morphology of the two samples: in both cases, the pigment grains are clearly visible, being thinner in sample A2 than A1. In the same figure (Figure 2c,d), SEM images of the cross-sections of the fragments taken from the varnished coupons are reported. Thickness values for both layers match those measured with OCT (Figure 2d), spanning the 10–20 μm range for the mixture with hematite and the 40–70 μm range for the recipe with madder lake. Moreover, it is clear that pigment grains affect the morphology of the varnish layer, in agreement with the MP image. Madder grains, on the other hand, are more embedded in the thicker layer of sample A1, which shows a greater surface smoothness.
At large, we cannot detect the surface of a transparent material by microprofilometry, whereas the morphology of a coloured material, such as in this case, is measurable. From MP topographic maps, it is possible to extract the profile along any direction; therefore, the coating thickness of sample A can be determined by the difference between two adjacent areas but not in an absolute way. As the main goal of the present work is identifying a noninvasive measure of the coating thickness of a historic bronze relief, the results from eddy current, optical coherence tomography, and FT-IR are compared; MP is applied on the artwork to show the overall morphology both as a colour scale and a simulated raking light image.
Figure 2. Samples A1 and A2. From left to right: visible (a,b) MP-simulated raking light image; (c,d) backscattered electron images of cross-sections; (eg) OCT tomograms (9 mm × 0.7 mm). Yellow squares show areas tested by the Eddy Current and OCT probes, while the red arrows indicate the OCT scan line.
Coatings 14 00212 g002
Both A samples were compositionally investigated with reflectance FTIR, and transmission FTIR spectra on scraped powder were recorded for comparison. Figure 3 shows the r- and t-FTIR spectra for sample A2 with hematite. It should be pointed out that the mixture underwent a heating process upon application on the metal substrate (Table 1): the thermal treatment at 130 °C may have led to some chemical changes compared to a fresh mixture. The spectra of sample A2 are dominated by the linseed oil features. Specifically, the C=O stretching signal in the transmission mode is centred at 1740 cm−1, with only a minor broadening at ~1715 cm−1 (C=O vibration for triterpenoid resin), while the C–H stretching band is peaked at 2930 cm−1, with a faint broadening on the higher wavenumber side (the same vibration for mastic is at 2948 cm−1). The presence of resin in the mixture is made evident by the C-H bending band at 1380 cm−1 (dotted line in Figure 3) [30,31].
Weighed linear combinations of the absorption spectra of the pure linseed oil and the mastic resin were tested (using an option of OMNIC software) to obtain synthetic transmission spectra of mixtures with various percentages. Although the filtration of the mastic dissolved in turpentine filtered off a small amount as residue, the weight percentage of resin in the varnish can be estimated as 10%. The processed spectra showed that the minimum content of mastic resin in the mixture with linseed oil that can be undoubtedly identified is 10% [32]. This evaluation refers to nonweathered mixtures, without modifications due to the heating process. As for the pigment addition, in the transmission spectrum of Figure 3, the absorption bands of hematite (sample A2) are clearly detected in the low-frequency region at ca. 470 cm−1 and 540 cm−1 [33].
Compared to the transmission one, the reflection spectrum of this sample, reported in the same figure, shows enhanced signal intensity and only minor changes in band shape. For varnishes on highly reflective surfaces, such as metals, the sensitivity in reflectance is greater than in transmittance, owing to the twofold path of the IR beam through the organic layer (transflection). Reflection IR spectra of films on highly reflective metal surfaces bear a close resemblance to IR absorption spectra of the film materials, thus making them straightforward to interpret. However, band distortions are only absent if the conditions d/λ << 1 and n(λ) >> k(λ) are fulfilled and the dispersion of n(λ) is small, where d is the film thickness and n(λ) and k(λ) are the refraction index and extinction coefficient of the material of the coating. In the case of organic molecules, such as the constituents of varnishes on bronzes, the n(λ) >> k(λ) condition is usually met [34,35]. Where film thickness is concerned, layers in the 5–70 µm range are far from the above condition (λ in the mid-infrared region spans from 2.5 to 25 µm). Furthermore, the actual surfaces of bronze or brass artefacts are not mirror-like, since a certain extent of roughness is introduced by surface finishing, cold work, or oxidation. Thus, in the investigation of bronze artefacts, the spectra of organic patination obtained with the reflection method may be distorted, losing the resemblance to the absorption spectra of the varnish materials.
The more intense the bands are, the sooner they vary in shape and position with increasing thickness. Distortions may lead to misleading interpretations: for example, the change in band shape may be interpreted as the onset of a shoulder of the main absorption band. In spite of film thickness not matching the d/λ << 1 condition, relatively undistorted spectra may be obtained from thicker films on metal surfaces. In the reflection spectrum of Figure 3, the stronger bands at 2928, 2856, 1740, and 1166 cm−1 show moderate shape distortion, namely broadening, the onset of a shoulder at 1715 cm−1, and a shift to higher wavenumbers. The same applies to the hematite bands. The 1460, 1380, 1245, 1101, and ab. 722 cm−1 bands, the latter three assigned to linseed oil, show either no or very low distortion. Features like the C-H rocking at 722 cm−1 and the 980 cm−1 one (out-of-plane C-H bending in not conjugated or conjugated trans double bonds) are more intense in the reflection spectrum than in the transmission one, owing to the deeper penetration of the beam at higher wavelengths. Given the higher thickness, the reflection spectrum of sample A1 (oil-resin with madder lake), shown in Figure 3, is obviously distorted with intensity reduction, major broadening, and band shape changes. The C-H rocking at 722 cm−1 of oil (little k), however, is still undistorted.
Figure 3. Reflectance FTIR spectra of samples A1 (A1 r) and A2 (A2 r), showing huge and small distortions, respectively. Transmittance spectrum of A2 (A2 t) is shown for comparison.
Coatings 14 00212 g003
Sample B1, different from the basic oil–mastic varnish described in Appendix A, was prepared by mixing the finely grounded mastic with linseed oil and heating the blend up to 130 °C for 30 min, with a weight ratio of the two components of 50:50. The t-FTIR spectrum (Figure 4) shows the C=O stretching band of the oil at ~1740 cm−1 with a shoulder peak at 1715 cm−1 assigned to the mastic resin (dotted line), while in the reflection spectrum, both peaks are distorted and the maxima appear shifted to higher wavenumbers. In the same figure, the spectrum of sample G a2 is plotted: in this case, as the recipe does not include any resin, the fake shoulder at 1715 cm−1 is produced by the distortion of the C=O stretching band of the oil at ~1740 cm−1, which may mislead the spectrum interpretation. The reflectance spectra of B1 and G a2 are differentiated in the 1320–1450 cm−1 range, where the position, shape, and relative intensities of the three bands allow assessing of the presence of the terpenic resin in the blend for B1.
In Figure 5, the results on sample C1 (Venetian turpentine + dragon’s blood, heated; thickness in the 73–148 μm range) are shown: the r-FTIR spectrum is compared to spectra of pure heated Venetian turpentine and dragon’s blood in transmission mode. A broad band with a sharp downhill centred at ~1705 cm−1 arises from the superimposition of the C=O stretching bands of both turpentine and dragon’s blood [36,37]. The broadening on the high wavenumber side could be due to the heating process of the resin. The characteristic band of diterpenic resins at 827 cm−1 is displayed undistorted [37]. In spite of evident distortions, characteristic bands of dragon’s blood are displayed in the spectrum (C=C aromatic stretching at 1603 and 1450 cm−1) [36].
In Table 1, the thickness, as measured with the ED gauge and OCT, is reported for all samples. Comparing thickness values with the total reflection FTIR spectra, it is evident that, for varnish thickness above 10 µm, the spectral features show significant distortions, independently from the composition of the blend. In the range of thickness from 10 to ca.25 µm, the signals show minor to major distortions, especially affecting the C–H and C=O stretching bands, respectively, at 2938 and 1730 cm−1, while in the case of higher thickness, severe distortions of all the bands appear, making the interpretation very challenging.
Figure 5. Reflectance FTIR spectrum of sample C1 compared to the transmittance spectra of the ingredients of the blend, dragon’s blood (DB tr) and heated Venetian turpentine (VT tr).
Coatings 14 00212 g005

3.2. Bertoldo’s Relief

The relief, described in Section 2.1, features a reddish varnish with substantial craquelure. The 3D model was acquired by MP: a 50 μm sampling step was set for both X and Y scanning directions, and the resultant topographic map in colour scale is shown together with the raking light image produced from the 3D map in Figure 6a and Figure 6b, respectively. The term relief comes from the Latin relevare, ‘to lift’: creating a sculpture in relief means in fact giving the impression that the sculpted material has been lifted above the background plane. The coloured-scale map emphasizes the relief method where the sculpted elements stick to a solid base of the same material. Therefore, on the background plane at zero height, appearing in a blue shade in Figure 6a, a set of figures is superimposed at nearly 6 mm from the background, with the emerging central group (Christ and female mourners with outstretched arms) lifted in the range 7-10 mm from the background. The raking light image highlights the unevenness of the surface: the folds of the garments, the hair, and the veil are a shining example of relief and inlaid decoration. The lack of a flat surface and the presence of areas in relief with curved edges delimiting the characters did not allow for reliable EC measurements. Therefore, the only way for evaluating the varnish thickness was OCT: eleven ROIs (regions of interest) were selected to capture surface areas with different characteristics, from very smooth to very rough, from concave to convex regions, which are highlighted in red in the raking light image (Figure 6b). OCT measurements were then performed on eleven gauge volumes of size 4 × 4 × 1 mm3.
In Figure 7, the OCT results on ROI 4, 8, and 10 are reported, which were chosen as representative of the different surface morphology to evaluate possible differences in the patina layering. The charge-coupled device (CCD) camera snapshot shows the appearance of the surface under white light lighting, where the gauge volume analysed with OCT is highlighted in white. The 3D rendering shows the upper surface (xy section) of the acquired tomocube, where some characteristic markings such as small craters are recognizable. For each ROI, three cross-sections, highlighted in red, are then reported to show the huge variability in the patina characteristics. ROI 4 (Figure 7a), on Christ’s chest, although showing a smooth surface, is characterized by an uneven patina with a thickness in the 16–24 μm range, with regions reaching 32–48 μm where material accumulation is present. ROI 8 (Figure 7b), on the background between the faces of the two women holding Christ’s body, is characterized by an imperfectly smooth surface whose patina thickness ranges from 17 to 25 μm. At furrows, the thickness ranges from 44 to 83 μm. ROI 10 (Figure 7c), on the forearm of the woman holding Christ’s legs, has the most corrugated surface: the three cross-sections show the patina filling the holes as well as a nearly uniform layer (13–28 μm) covering the surrounding surface. In some craters, the OCT signal shows the presence of a highly scattering material, probably due to a mixture of patina, dirt, and metal corrosion products. Although the overall shape of the analysed surfaces is far from flat, OCT measurements were performed in a noninvasive and noncontact way, allowing the thickness of the patina to be determined at any point in the bronze relief. The imaging of the cross-section outlines the unevenness of the surface organic layer. In some limited portions of the cross-sectional tomograms (e.g., Figure 7c, slice 3), it is possible to see a second, very thin layer superimposed on the first one. This noticeable feature of the tomogram is worth exploring more deeply since it paves the way to noninvasive stratigraphic imaging of bronzes.
Given the small size of the artefact and its translucent surface, any scraping would be highly visible; therefore, it was mandatory to limit the use of sampling as much as possible. The relief was placed on the FTIR microscope stage for the analysis, which allows it to focus on smaller areas than the portable instrument. More micro-areas were analysed inside the ROIs of OCT. First, a spectrum was recorded on a gap of the reddish varnish, which is shown in Figure 8, along with the spectrum of the red patina layer on the background (OCT ROI 8) and the transmission spectrum of a single grain of the red patina taken with a needle below the external wax layer. As for the unvarnished area, undistorted CH stretching at 2920 and 2850 cm−1 and CH2 scissoring at ca. 1460 cm−1 are the only features present in the spectrum. Their shape and position are indicative of the presence of paraffinic wax [31], probably applied during a past restoration intervention. The presence of the wax wholly or partly covering the surface of the relief might account for the double transparent layer detected in some areas with OCT. The regular treatment with wax includes a final phase of polishing, which makes the wax layer extremely thin. This is in agreement with the barely distorted bands in the FTIR spectrum and with the fact that in most of the areas tested, the thickness may be below the detection limit of OCT. Reflectance spectra of areas with the patina show a peak in the carbonyl region at 1715 cm−1, which can be ascribed to an aged triterpenoid resin (dammar, mastic) [30] with a shoulder at a higher wavenumber, which could be related to the C=O stretching band of a lipid. The C-H stretching bands peaked at 2920 and 2850 cm−1, matching the band position of the wax on the unvarnished area, and showed a broadening on the higher wavenumber side, which is further evidence of the presence of the resin. Also, the weak band at ab. 1690 cm−1 may indicate the C=O stretching vibration of a diterpenoid resin, such as Venetian turpentine, sandarac, or colophony [31,32]. Compared to the transmittance spectrum in the same figure, the reflectance one exhibits very broad and unresolved bands, even though it is not affected very much by changes in the shape and position: even though the OCT results in this ROI indicate a patina thickness varying from 19 to 83 μm, the 0°/0° geometry of the FTIR microscope may account for less distorted bands in the spectra than those recorded with the portable instrument, given the shorter optical path in the layer. In particular, in the transmittance spectrum, the bands at 1715, 1460, and 1380 cm−1 allow the identification of a terpenoid resin, while the signals at ca. 1605 and ca. 1510 cm−1 can be assigned to aromatic C=C symmetric stretching and C=O stretching in long-chain metal carboxylates, respectively. Aromatic bonds could indicate that either a natural dye containing flavonoids was added to the varnish or a terpenoid resin was present that underwent a heating treatment [37].
The relief was then put into the SEM chamber, operating in low vacuum conditions, to investigate the presence of inorganic fillers or pigments in the patination layer. EDS spectra of an area without the varnish show the elements of the alloy (Cu, Sn, Pb, Ni), while on the varnish layer, silicon, aluminium, iron, magnesium, potassium, titanium, calcium, sulphur, and phosphorous were detected. Apart from calcium and sulphur, which can be related to calcium sulphate (gypsum), characteristic elements of Fe-bearing aluminium silicate are present. The latter may be indicative of the addition of a clay-based red pigment. To the best of our knowledge, no other evidence of the presence of a red pigment in varnishes of Renaissance bronzes is reported: this is a very intriguing clue on how the reddish tone so popular in the Florentine Renaissance bronzes was achieved.

4. Conclusions

In this paper, we present the preliminary results of a broad project aimed at investigating organic coatings on indoor historical bronzes. A multi-analytical approach, based on a set of noninvasive techniques, was applied to study the composition, thickness, and morphology of both a series of mock-ups and a real artwork, a Renaissance bronze relief. The samples were made according to ancient recipes to simulate the translucent reddish hue of Giambologna’s workshop and the dark coating typical of workshops located in Veneto (Northern Italy). The results of all the measurements carried out in this work have proven useful in drawing and validating a protocol for the scientific investigation of organic coatings on bronze statues, which is the leitmotif of this paper. A sum-up of the operating features and sample shape requirements for each noninvasive method is shown in Table 2.
The homogeneity of the coating surface was explored with micro-profilometry, whereas thickness measurements were performed with OCT and eddy current gauge. Despite the easiness of use of the eddy current device, the lack of flat surfaces on the bronze relief and the difficulty in performing the zeroing procedure prevent its application in the case study. Conversely, OCT has proven suitable for the survey of objects with complex morphology, providing cross-sections that in some cases allowed for differentiating superimposed layers.
Since the mock-ups were prepared with the aim of reproducing the characteristic aspects of real artworks, the morphology and thickness of the patina may be considered a reliable approximation of the actual surface of Renaissance small bronzes. Therefore, the use of total reflection FTIR in real cases must be considered with caution, since only the spectra acquired on the mock-ups with a thickness up to ca. 10 μm band shape show little distortion. A threshold of about 10% in weight was confirmed for a reliable detection of resin in an oil–resin mixture with r-FTIR, in agreement with the data reported in the literature [31]. Ageing of materials, high thickness, and superposition of nonoriginal layers in real artworks may lead to shifted, distorted, and not resolved bands in r-FTIR spectra, thus hampering their interpretation. However, noticeable information was obtained on a small Renaissance bronze relief, confirmed by the results of FTIR in transmission mode on a tiny particle sampled on the patina.

Author Contributions

Conceptualization, S.P., A.C. and R.F.; Methodology, A.D.F.; Investigation, M.G., S.P., C.B. and A.D.F.; Data curation, M.G., A.D.F. and R.F.; Writing—original draft, M.G. and A.D.F.; Writing—review & editing, R.F.; Visualization, M.B. All authors have read and agreed to the published version of the manuscript.

Funding

This research was partly carried out within the project IPERION CH funded by the European Union program H2020-INFRAIA- 2014-2015 (grant agreement No. 654028) and PNRR H2IOSC (Humanities and Cultural Heritage Italian Open Science Cloud) Project (IR0000029), CUP_B63C22000730005, funded by Next Generation EU. The contents reflect only the authors’ view and the European Commission is not responsible for any use that may be made of the information it contains.

Institutional Review Board Statement

Not applicable.

Informed Consent Statement

Not applicable.

Data Availability Statement

Data are contained within the article.

Acknowledgments

The authors would like to acknowledge Barbara Salvadori (ICVBC-CNR), Ilaria Ciseri (Ministry of Culture-Museo Nazionale del Bargello), and Stefania Agnoletti (OPD).

Conflicts of Interest

The authors declare no conflict of interest.

Appendix A. Materials and Methods for the Preparation of the Mock-Ups

Experienced conservators of the Department of Conservation of Metals and Bronzes of the OPD were in charge of the preparation of the blends and the treatment of the coupons. For time reasons, commercial raw materials were used for the mock-up preparation. They all have previously been checked with FTIR in transmission mode, upon grinding and preparation as KBr pellets and/or with SEM-EDS. Hematite (C1100), red chalk (0097), red oxide (C0158), litharge (0100), dragon’s blood (0001 E), benzoin (2280), mastic (2230), and Venetian turpentine (3241) were supplied by Zecchi® (Florence, Italy), which still produces and trades traditional painting materials. Pigments, either of natural origin (hematite, red chalk) or manufactured (litharge, red oxide), were in the form of powder or in pieces, while resins were supplied as raw grains or tears extracted from plants. Burgundy pitch (60320) was supplied by Kremer (Aichstetten, Germany) as pieces extracted from a European pine. The solvent Turpentine spirit was supplied by Fidea (Matelica, Italy).
Linseed oil (5816650 supplied by Maimeri®, Milan, Italy) is an industrially squeezed oil from linseeds.
Madder lake was prepared in the laboratory from Rubia Tinctoria roots (provided by Bizzarri, Florence, Italy), rock alum, and potassium carbonate, according to the process described in Kyrby et al. [38].
A common base for many varnishes is the oil–mastic mixture, reported in several ancient treatises. It was prepared by grinding mastic tears and dissolving them in spirit of turpentine: after 4 weeks under sunshine, the liquid was filtered and a nearly colourless solution was obtained. The solution was prepared with 25 wt % of mastic, but the proportion might be slightly diminished after filtration. The manufacturing of the varnish for practical use introduced some approximation to the ingredients’ proportions. The oil–resin mixture was then prepared by mixing one part of linseed oil with one part of mastic varnish.
A description of the individual varnishes’ preparation is reported in Table 2 [10].
Varnishes were applied by brush. All samples were left to dry adequately for a few months before the analysis.
FTIR and EDX spectra of all materials (not reported here) were found to match those reported in the literature as references.
Table A1. Ingredients and process for the fabrication of the mock-ups.
NameIngredientsPreparationNotes and Comments
0Linseed oil; Mastic; Spirit of turpentineSee Appendix A
1Linseed oil; Mastic; Spirit of turpentine; Madder lake; Rock alum; Potassium carbonate 0.2 g of madder lake prepared as in [38] in about 10 mL of oil–mastic varnish (Appendix A)
4Linseed oil; Mastic; Spirit of turpentine; Hematite0.2 g of hematite in 2 mL of oil–mastic varnish (Appendix A)
A1Linseed oil; Mastic; Spirit of turpentine; Madder lake; Rock alum; Potassium carbonate 0.2 g of madder lake prepared as in [38] in about 10 mL of oil–mastic varnish (Appendix A)30 min of heating in a ventilated oven at 130 °C
A2Linseed oil; Mastic; Spirit of turpentine; Hematite0.2 g of hematite in 2 mL of oil–mastic varnish (Appendix A)30 min heating in a ventilated oven at 130 °C
B1Linseed oil; MasticFinely ground mastic mixed with linseed oil (50:50 ratio); the blend was heated up to 130 °C for 30 min
B2Venetian turpentineThe resin was gently warmed for better application30 min heating in a ventilated oven at 130 °C
C1Venetian turpentine; Dragon’s blood1 g of dragon’s blood in 4 g of turpentine, warmed in a water bath and stirred until dissolvedSince the application of the varnish on the cold surface turned out not fluent, the metal was gently heated
C2Venetian turpentine; Dragon’s blood; Spirit of turpentine1 g of dragon’s blood in 4 g of turpentine, addition of spirit of turpentine until the dissolution of the dragon’s bloodSince the application of the varnish on the cold surface turned out not fluent, the metal was gently heated
E2Linseed oil; Hematite28 wt % of hematite was added to linseed oilFirst coat applied with circular brushes; second coat made with pure linseed oil (without hematite)
F1Linseed oil; Mastic; Spirit of turpentine; Madder lake0.2 g of madder lake [38] were added to 10 mL of oil–mastic varnish (Appendix A)The sample was let dry in a vented oven for 3 h at 130 °C. However, it was not completely dry after this time
F2Linseed oil; Mastic; Spirit of turpentine; Madder lake; Burgundy pitchBurgundy pitch was added to the mixture of sample F1 as 2 wt % and dissolved upon gentle warming in water bath. The varnish was brushed warm on the metalBurgundy pitch was suggested by Stone [1] based on analytical evidence on real objects; historical references to this resin are found in De la maniere de graverà l’eau forte et au burin, et de la gravure en manière noire (1645) by Abraham Bosse [13], in the “Vernice dura” recipe.
The sample was dried at 130 °C in a ventilated oven for 3 h. The addition of burgundy pitch affected the drying rate and the final compactness and shininess of the film
G a1Linseed oil; HematiteAbout 2 wt % of hematite was dispersed in linseed oil. Three coats: first one applied with circular brushstrokes, two further applied with crisscrossed brushstrokesThe substrate was filed and ground, then treated with a 5% caustic soda solution applied with cotton swabs, rinsed with demineralized water, and air-dried (common process in the Florentine craft tradition). Subsequent application of the swabs turned the surface colour from yellow to blue shades
G a2Linseed oil; HematiteAbout 2 wt % of hematite was dispersed in linseed oil. One coat applied with a small brush and little circular brushstrokes
G b1Linseed oil; HematiteAbout 2 wt % of hematite was dispersed in linseed oil. One coat applied with tight brushstrokes in order to obtain a thin layer
G b2Linseed oil; Hematite; LithargeAbout 2 wt % of hematite and 20 wt % of litharge were dispersed in linseed oil. One coat applied with tight brushstrokes in order to obtain a thin layer

References

  1. Stone, R. Organic patinas on small bronzes of the Italian Renaissance. Metrop. Mus. J. 2010, 45, 107–124. [Google Scholar] [CrossRef]
  2. Pitthard, V.; Stone, R.; Stanek, S.; Griesser, M.; Gersch, C.; Hanzer, H. Organic patinas on Renaissance and Baroque bronzes–Interpretation of compositions of the original patination by using a set of simulated varnished bronze coupons. J. Cult. Herit. 2011, 12, 44–53. [Google Scholar] [CrossRef]
  3. Stone, R.E.; White, R.; Indictor, N. Surface composition of some Italian Renaissance bronzes. In Proceedings of the ICOM, 9th Triennial Meeting, Dresden, Germany, 26–31 August 1990; ICOM Committee for Conservation: Los Angeles, CA, USA, 1999; pp. 568–573. [Google Scholar]
  4. Pitthard, V.; Stanek, S.; Griesser, M.; Hanzer, H.; Kryza-Gersch, C. Comprehensive investigation of the ‘organic patina’ on Renaissance and Baroque indoor bronze sculptures from the collection of the Kunsthistorisches Museum, Vienna. In Proceedings of the Conservation Science 2007, Milan, Italy, 10–11 May 2007; Archetype Publications: London, UK, 2008; pp. 49–55. [Google Scholar]
  5. Basso, E.; Pozzi, F.; Day, J.; Borsch, L. Unmasking a wild man: Scientific analysis of Bertoldo di Giovanni’s Shield Bearer in the Frick Collection. Herit. Sci. 2020, 8, 109. [Google Scholar] [CrossRef]
  6. Invernizzi, C.; Fiocco, G.; Iwanicka, M.; Kowalska, M.; Targowski, P.; Blümich, B.; Rehorn, C.; Gabrielli, V.; Bersani, D.; Licchelli, M.; et al. Non-invasive mobile technology to study the stratigraphy of ancient Cremonese violins: OCT, NMR-MOUSE, XRF and reflection FT-IR spectroscopy. Microchem. J. 2020, 155, 104754. [Google Scholar] [CrossRef]
  7. Boon, J.; Van Langh, R. Comprehensive studies of patinas on Renaissance bronze statuettes with laboratory, synchrotron and neutron-aided techniques. In Proceedings of the ICOM-CC 17th Triennial Conference Preprints, Melbourne, Australia, 15–19 September 2014; pp. 1–7. [Google Scholar]
  8. Handwerker, P. Untersuchung und Konzepterstellung zur Oberflächengestaltung des Reliefs “Grablegung Christi” von. Giambologna. Dissertation, thesis at Technische Universität of München, Germany. WS 2017/2018 (Ms.).
  9. Grosso, P.; Bongiorno, V.; Piccardo, P.; Magnani, L. Virtues of Giambologna from Grimaldi Chapel archaeometrical characterization. J. Miner. Met. Mater. Soc. 2014, 66, 802–807. [Google Scholar] [CrossRef]
  10. Baruffetti, M.; Agnoletti, S.; Galeotti, M. L’intervento su due bronzetti tardorinascimentali: Studio del soggetto, della tecnica di realizzazione e spunti di ricerca sulle finiture superficiali come linee-guida per la comprensione e il restauro. In Proceedings of the XIV Congresso Nazionale IGIIC—Lo Stato dell’Arte—Accademia Di Belle Arti di L’Aquila, L’Aquila, Italy, 20–22 October 2016; pp. 311–318. [Google Scholar]
  11. Ronchetti, G. Manuale per i Dilettanti di Pittura a Olio, Acquarello, Miniatura, Guazzo, Tempera, Encausto, Pastello, Fotopittura ecc.; Hoepli Editore: Milano, Italy, 1970. [Google Scholar]
  12. Van de Graaf, J.A. Het De Mayerne Manuscript Als Bron Voor de Schildertechniek van de Barok; British Museum: Sloane, UK, 1958. [Google Scholar]
  13. Bosse, A. De la Maniere de Graver à L’eau Forte et au Burin, et de la Gravure en Manière Noire: Avec la Façon de Construire les Presses Modernes, et D’imprimer en Taille-Douce;A Paris, rue Dauphine; Chez Charles-Antoine Jombert: Parigi, France, 1758. [Google Scholar]
  14. Masschelein-Kleiner, L. Ancient Binding Media, Varnishes and Adhesives; ICCROM: Roma, Italy, 1995. [Google Scholar]
  15. Lenormand, L.S.; Molard, F.É.; Francœur, L.B.; Payen, M.A.; Robiquet, P. Nuovo Dizionario Universale Tecnologico o di arti e mestieri e della economia industriale e commerciante; Giuseppe Antonelli Editore: Venezia, Italy, 1830; pp. 1831–1859. [Google Scholar]
  16. Scott, D.A. Copper and Bronze in Art: Corrosion, Colorants, Conservation; Getty Publications: Los Angeles, CA, USA, 2002; p. 331. [Google Scholar]
  17. Giumlia-Mair, A. Colouring treatments on ancient copper-alloys. Rev. Métall. 2001, 98, 767–776. [Google Scholar] [CrossRef]
  18. Targowski, P.; Rouba, B.; Wojtkowski, M.; Kowalczyk, A. The application of optical coherence tomography to non destructive examination of museum objects. Stud. Conserv. 2004, 49, 107–114. [Google Scholar] [CrossRef]
  19. Liang, H.; Cid, M.G.; Cucu, R.G.; Dobre, G.M.; Podoleanu, A.G.; Pedro, J.; Saunders, D. Enface optical coherence tomography—A novel application of non-invasive imaging to art conservation. Opt. Express 2005, 13, 6133–6144. [Google Scholar] [CrossRef]
  20. Callewaert, T.; Guo, J.; Harteveld, G.; Vandivere, A.; Eisemann, E.; Dik, J.; Kalkman, J. Multi-scale optical coherence tomography imaging and visualization of Vermeer’s Girl with a Pearl Earring. Opt. Express 2020, 28, 26239–26256. [Google Scholar] [CrossRef]
  21. Targowski, P.; Iwanicka, M.; Tyminska-Widmer, L.; Sylwestrzak, M.; Kwiatkowska, E.A. Structural examination of easel paintings with optical coherence tomography. Acc. Chem. Res. 2010, 43, 826–836. [Google Scholar] [CrossRef]
  22. Targowski, P.; Gòra, M.; Wojtkowski, M. Optical coherence tomography for artwork diagnostics. Laser Chem. 2006, 35373. [Google Scholar] [CrossRef]
  23. Liang, H.; Mari, M.; Cheung, C.S.; Kogou, S.; Johnson, P.; Filippidis, G. Optical coherence tomography and non-linear microscopy for paintings–a study of the complementary capabilities and laser degradation effects. Opt. Express 2017, 25, 19640–19653. [Google Scholar] [CrossRef]
  24. Daffara, C.; Mazzocato, S.; Marchioro, G. Multiscale roughness analysis by microprofilometry based on conoscopic holography: A new tool for treatment monitoring in highly reflective metal artworks. Eur. Phys. J. Plus 2022, 137, 430. [Google Scholar] [CrossRef]
  25. Mazzocato, S.; Daffara, C. A Method for Spatially Registered Microprofilometry Combining Intensity-Height Datasets from Interferometric Sensors. Sensors 2023, 23, 4144. [Google Scholar] [CrossRef] [PubMed]
  26. Fontana, R.; Fovo, A.D.; Striova, J.; Pezzati, L.; Pampaloni, E.; Raffaelli, M.; Barucci, M. Application of noninvasive optical monitoring methodologies to follow and record painting cleaning processe. Appl. Phys. A 2015, 121, 957–966. [Google Scholar] [CrossRef]
  27. Eddy Current Testing at Level 2. Manual for the Syllabi. Contained in IAEA-Tec Doc-628. rev.2, Training Guidelines for Non-Destructive Testing Techniques; Training course series 48; IAEA Training Course Series; International Atomic Energy Agency: Venezia, Italy, 2011. [Google Scholar]
  28. Barra, V.; Daffara, C.; Porcinai, S.; Galeotti, M. Application of Coatings on Silver Studied with Punctual and Imaging Techniques: From Specimens to Real Cases; IOP Conference Series: Materials Science and Engineering; IOP Publishing: Bristol, UK, 2018. [Google Scholar]
  29. Texier, A.; Geffroy, A.M.; Syvilay, D.; Brocard-Rosa, T. Les cires microcristallines dans la protection de la statuaire en cuivre et alliages de cuivre exposée en extérieur. In Métal à Ciel Ouvert: La Sculpture Métallique D’extérieur du XIXe au Début du XXe Siècle: Identification, Conservation, Restauration; International Institute for Conservation of Historic and Artistic Works; Section Française: Champs-sur-Marne, France, 2014; pp. 163–175. ISBN 9782905430182. [Google Scholar]
  30. Ciofini, D.; Striova, J.; Camaiti, M.; Siano, S. Photo-oxidative kinetics of solvent and oil-based terpenoid varnishes. Polym. Degrad. Stab. 2015, 123, 47–61. [Google Scholar] [CrossRef]
  31. Invernizzi, C.; Rovetta, T.; Licchelli, M.; Malagodi, M. Mid and Near-Infrared Reflection database of natural organic materials in the cultural heritage field. Int. J. Anal. Chem. 2018, 2018, 7823248. [Google Scholar] [CrossRef]
  32. Daher, C.; Pimenta, V.; Bellot-Gurlet, L. Towards a non-invasive quantitative analysis of the organic components in museum objects varnishes by vibrational spectroscopies: Methodological approach. Talanta 2014, 129, 336–345. [Google Scholar] [CrossRef]
  33. Salama, W.; El Aref, M.; Gaupp, R. Spectroscopic characterization of iron ores formed in different geological environments using FTIR, XPS, Mössbauer spectroscopy and thermoanalyses. Spectrochim. Acta Part A Mol. Biomol. Spectrosc. 2015, 136, 1816–1826. [Google Scholar] [CrossRef]
  34. Suëtaka, W. Surface Infrared and Raman Spectroscopy: Methods and Applications; Springer Science + Business Media: New York, NY, USA, 1995. [Google Scholar]
  35. Griffiths, P.R.; De Haseth, J.A. Fourier Transform Infrared Spectrometry; John Wiley & Sons: Hoboken, NJ, USA, 2007. [Google Scholar]
  36. Koperska, M.; Łojewski, T.; Łojewska, J. Vibrational spectroscopy to study degradation of natural dyes. Assessment of oxygen-free cassette for safe exposition of artefacts. Anal. Bioanal. Chem. 2011, 399, 3271–3283. [Google Scholar] [CrossRef]
  37. Font, J.; Salvadò, N.; Butì, E.J. Fourier transform infrared spectroscopy as a suitable technique in the study of the materials used in waterproofing of archeological amphorae. Anal. Chim. Acta 2007, 598, 119–127. [Google Scholar] [CrossRef]
  38. Kirby, J.; Van Bommel, M.; Verthecken, A. Natural Colorant for Dyeing and Lake Pigments: Practical Recipes and Their Theoric Sources; Archetype Publications: London, UK, 2014. [Google Scholar]
Figure 1. (a) Set of mock-ups made following historical recipes of organic coatings on copper-based alloy, and (b) Lamentation on Dead Christ, Bertoldo di Giovanni, bronze relief, 20 cm × 13.5 cm, Museo Nazionale del Bargello, Firenze.
Coatings 14 00212 g001
Figure 4. Reflectance and transmittance FTIR spectra of sample B1 (B1 r and B1 t) and reflectance spectrum of sample G a2 (G a2 r). For sample B1, the oil/mastic weight ratio is 50:50, whereas sample G a2 was prepared with a mixture of oil and hematite.
Coatings 14 00212 g004
Figure 6. Topographic map in colour scale and raking light image produced from the 3D model by microprofilometry. ROI measured by OCT are highlighted in red.
Coatings 14 00212 g006
Figure 7. ROI (a) 4, (b) 8, and (c) 10. Image from the CCD camera with the measured tomocube highlighted in white; tomocube rendering with the three cross-sections highlighted in red; cross-sections with thickness values highlighted in yellow.
Coatings 14 00212 g007
Figure 8. Detail of the reddish patina of Bertoldo’s relief (a), and (b) micro reflectance-FTIR spectra of areas with no varnish (top) and with varnish (middle). Reflectance spectra are reported together with microtransmittance spectrum (bottom) of a grain of the varnish. All spectra are normalized.
Coatings 14 00212 g008
Table 1. Thickness value as measured with the EC gauge and OCT. The measurement areas are highlighted in yellow.
SampleRegion of Interest (ROI)Thickness (μm)
0Coatings 14 00212 i001EC19.7 ± 0.9
OCT19.6 ± 6.8
Range OCT8.1–24.6
1Coatings 14 00212 i002EC35.9 ± 3.0
OCT41.2 ± 18.2
Range OCT18.5–71.1
3Coatings 14 00212 i003EC19.7 ± 1.0
OCT13.8 ± 6.1
Range OCT7.5–20.3
4Coatings 14 00212 i004EC25.1 ± 2.5
OCT26.8 ± 6.9
Range OCT18.3–35.3
A1 leftCoatings 14 00212 i005EC54.6 ± 2.0
OCT55.8 ± 14.9
Range OCT38.9–71.2
A1 rightCoatings 14 00212 i006EC101.0 ± 6.0
OCT99.3 ± 18.0
Range OCT78.0–123.6
A2Coatings 14 00212 i007EC13.8 ± 2.2
OCT14.35 ± 3.2
Range OCT12.1–16.6
B1Coatings 14 00212 i008EC33.8 ± 2.3
OCT34.7 ± 10.5
Range OCT21.9– 49.3
B2Coatings 14 00212 i009EC257.0 ± 8.0
OCT257.1 ± 12.2
Range OCT245.9–276.3
B2 bisCoatings 14 00212 i010EC39.7 ± 1.0
OCT38.5 ± 3.6
Range OCT35.1–42.0
C0Coatings 14 00212 i011EC180.0 ± 3.0
OCT179.9 ± 2.5
Range OCT174.3–182.6
C1Coatings 14 00212 i012EC151.3 ± 9.5
OCT125.5 ± 18.3
Range OCT73.3–148.0
C2Coatings 14 00212 i013EC40.4 ± 1.6
OCT42.8 ± 6.2
Range OCT30.2–48.6
18 up
(E2)
Coatings 14 00212 i014EC21.9 ± 2.2
OCT20.4 ± 5.3
Range OCT12.9–25.6
18 down
(E2)
Coatings 14 00212 i015EC18.6 ± 1.6
OCT19.1 ± 3.7 *
Range OCT16.8–21.4
19 up (F1)Coatings 14 00212 i016EC176.6 ± 1.3
OCT173.8 ± 12.7
Range OCT146.4–189.1
19 down (F1)Coatings 14 00212 i017EC49.4 ± 4.6
OCT41.1 ± 7.3
Range OCT35.3–49.3
20
(F2)
Coatings 14 00212 i018EC66.7 ± 2.5
OCT66.3 ± 4.4
Range OCT64.0–67.9
21 sx
(G-a1)
Coatings 14 00212 i019EC24.3 ± 1.1
OCT26.1 ± 8.5
Range OCT15.8–40.5
21 dx
(G-a1)
Coatings 14 00212 i020EC24.4 ± 1.4
OCT25.6 ± 6.2
Range OCT18.8–37.6
22
(G-a2)
Coatings 14 00212 i021EC30.9 ± 0.7
OCT28.5 ± 9.8
Range OCT17.5–48.0
23 bottom
(G-b2)
Coatings 14 00212 i022EC23.6 ± 2.9
OCT25.2 ± 9.7
Range OCT13.7–46.0
23 up
(G-b2)
Coatings 14 00212 i023EC24.3 ± 1.6
OCT30.6 ± 18.0
Range OCT12.8–61.0
* (125.0 microns on the bubble).
Table 2. Characteristics of the instruments and sample requirements for each technique used for the noninvasive investigation.
TechniqueTypeNoncontactSpot Size Ø (mm)Working Distance
(mm)
Thickness Resolution
(μm)
Sample Shape Requirements
r-FTIRpointwise5-<10//
ECpointwise103–5Flat over 1 cm2
OCTimaging0.013255.5 in air *Max gauge volume **
10 × 10 × 3.5 mm3
MPimaging0.02043~1Max gauge volume ***
300 × 300 × 8 mm3
* to be divided by the medium refractive index. When not known, the n = 1.5 average value is considered. ** 10 × 10 mm2 is the maximum scanning area, with a focal depth of 3.5 mm. *** 300 × 300 mm2 is the maximum scanning area, with a focal depth of 8 mm.
Disclaimer/Publisher’s Note: The statements, opinions and data contained in all publications are solely those of the individual author(s) and contributor(s) and not of MDPI and/or the editor(s). MDPI and/or the editor(s) disclaim responsibility for any injury to people or property resulting from any ideas, methods, instructions or products referred to in the content.

