1. Introduction
Currently, there is an increasing demand for high-performance structural materials with reduced weight, enhanced vibration damping, corrosion resistance, and lower production costs. Bonded structures, which serve as supplements to traditional mechanical connections, exhibit high specific modulus, lightweight design, uniform stress distribution, and excellent vibration damping. Bonded structures have been widely used in aerospace, military, pipeline, construction, machinery manufacturing, and other fields [
1,
2,
3]. Presently, the most common non-destructive testing (NDT) methods for assessing or characterizing the adhesion of bonded structures include radiography, infrared thermography, eddy current testing, ultrasonic testing, etc. [
4]. Compared with other NDT methods, ultrasound technology is particularly sensitive to the characteristics of interfacial adhesion and has the advantages of operational simplicity, strong penetration, high sensitivity, and wide applicability [
5,
6].
Ultrasonic methods can be categorized as either bulk wave [
7,
8] or guided wave [
9,
10] techniques based on how ultrasound interacts with defects and the mechanics of wave modes. These methods can also be further classified as linear or nonlinear [
11,
12,
13]. Conventional bulk wave detection is limited to the area scanned by the acoustic beam below the transducer, whereas guided wave detection can cover a wide area of the component under test. Ultrasonic-guided waves offer a wider detection range, longer propagation distance, and higher detection efficiency than conventional ultrasound [
14,
15,
16,
17]. Due to its extreme sensitivity to microstructure, nonlinear ultrasonic technology has garnered significant attention recently.
Numerous studies have shown that nonlinear ultrasound techniques can effectively monitor and detect the generation and development of early material degradation [
18,
19,
20]. Brotherhood et al. [
21] investigated the sensitivity of three ultrasonic inspection techniques to weakly bonded interfaces at different contact pressures. They found that the acoustic nonlinear technique had the highest sensitivity for the detection of weakly bonded interfaces at low compressive loads. However, the sensitivity decreased rapidly with increasing load. Soleimanpour et al. [
22] examined the use of nonlinear guided waves to identify ply separation damage in composite laminated beams. Suitable excitation and reception methods can detect high harmonic signals under various damage conditions, enabling ply damage measurement and localization in laminated beams without reference signals. Li et al. [
23] conducted a systematic investigation of the propagation of Lamb waves in bonded joints with randomly distributed micro-cracks. Nonlinear Lamb waves have been proven to be an effective means of characterizing the micro-crack damage within the bonding layer of bonded joints. Solodov et al. [
24] investigated the anastomosis identification of aluminum lap joints that are relevant to the automotive industry. The acoustic nonlinear method was compared with linear ultrasonic testing to experimentally localize anastomotic bonds manufactured in adhesive lap joints. Allen et al. [
25] investigated the debonding problem in bonded joints using the nonlinear frequency-mixing Lamb wave technique. The high-frequency harmonics induced by contact acoustic nonlinearity can effectively characterize the debonding defects. Numerous studies have shown that nonlinear ultrasonic NDT methods can quantitatively assess fatigue, delamination, debonding, and other bonding quality issues. With suitable algorithms or signal processing, accurate defect morphology and location information can be obtained [
26,
27,
28,
29].
Current research on pipeline cladding inspection is almost focused on the polyethylene corrosion protection layer of the pipeline. Hong et al. [
30] employed a nonlinear ultrasonic guided wave approach to identify delamination damage in lined corrosion-resistant pipelines. They further established a correlation between the extent of damage and the nonlinear coefficient of the second and third orders. Liu et al. [
31] investigated an ultrasonic inspection technique for detecting anti-corrosion coatings by positioning a transmitting probe and a receiving probe on the inner wall of a pipeline. This methodology not only located the anti-corrosion coating layer but also quantified the length of peeling. Additionally, Hong et al. [
32] introduced a non-contact ultrasonic imaging technique aimed at detecting damage to the external corrosion protective layer of underwater metal pipelines. The pipe-patched anti-corrosion layer represents one of the most crucial yet vulnerable components within the entire pipeline corrosion protection system [
33]. However, there is a notable lack of NDT studies focusing on the quality of pipeline heat-shrinkable tape bonding.
This study conducts a theoretical investigation to determine the optimal detection modes and excitation frequencies, considering the combination of wave structures with guided wave phase velocity dispersion curves. Both traditional and nonlinear guided wave detection methods are employed to assess the bonding strength of pipeline cladding structures, with the aim of identifying a suitable evaluation approach. A correlation between the acoustic nonlinear coefficient and bonding strength is established, incorporating the second-order acoustic nonlinear coefficient into the pipeline cladding bonding strength evaluation system. The acoustic nonlinear coefficient effectively demonstrates its validity and superiority in characterizing bonding strength.
2. Modal and Frequency Optimization
2.1. Numerical Modelling
This section demonstrates how to calculate the dispersion curves of circumferential guided waves in a multilayered annular structure using Floquet boundary condition in the finite element software COMSOL Multiphysics
®5.5. Drawing inspiration from the study conducted by Zhang et al. [
34], a multilayered annular structure has been modeled utilizing the Floquet boundary condition. The theory simplifies the problem by reducing the entire model to a divided cell for computation. By using Floquet periodic boundaries, theoretical results can be obtained without the need for cumbersome coding. Floquet boundary conditions can be implemented in the commercial software COMSOL to facilitate the dispersion calculation of orthotropic annulus.
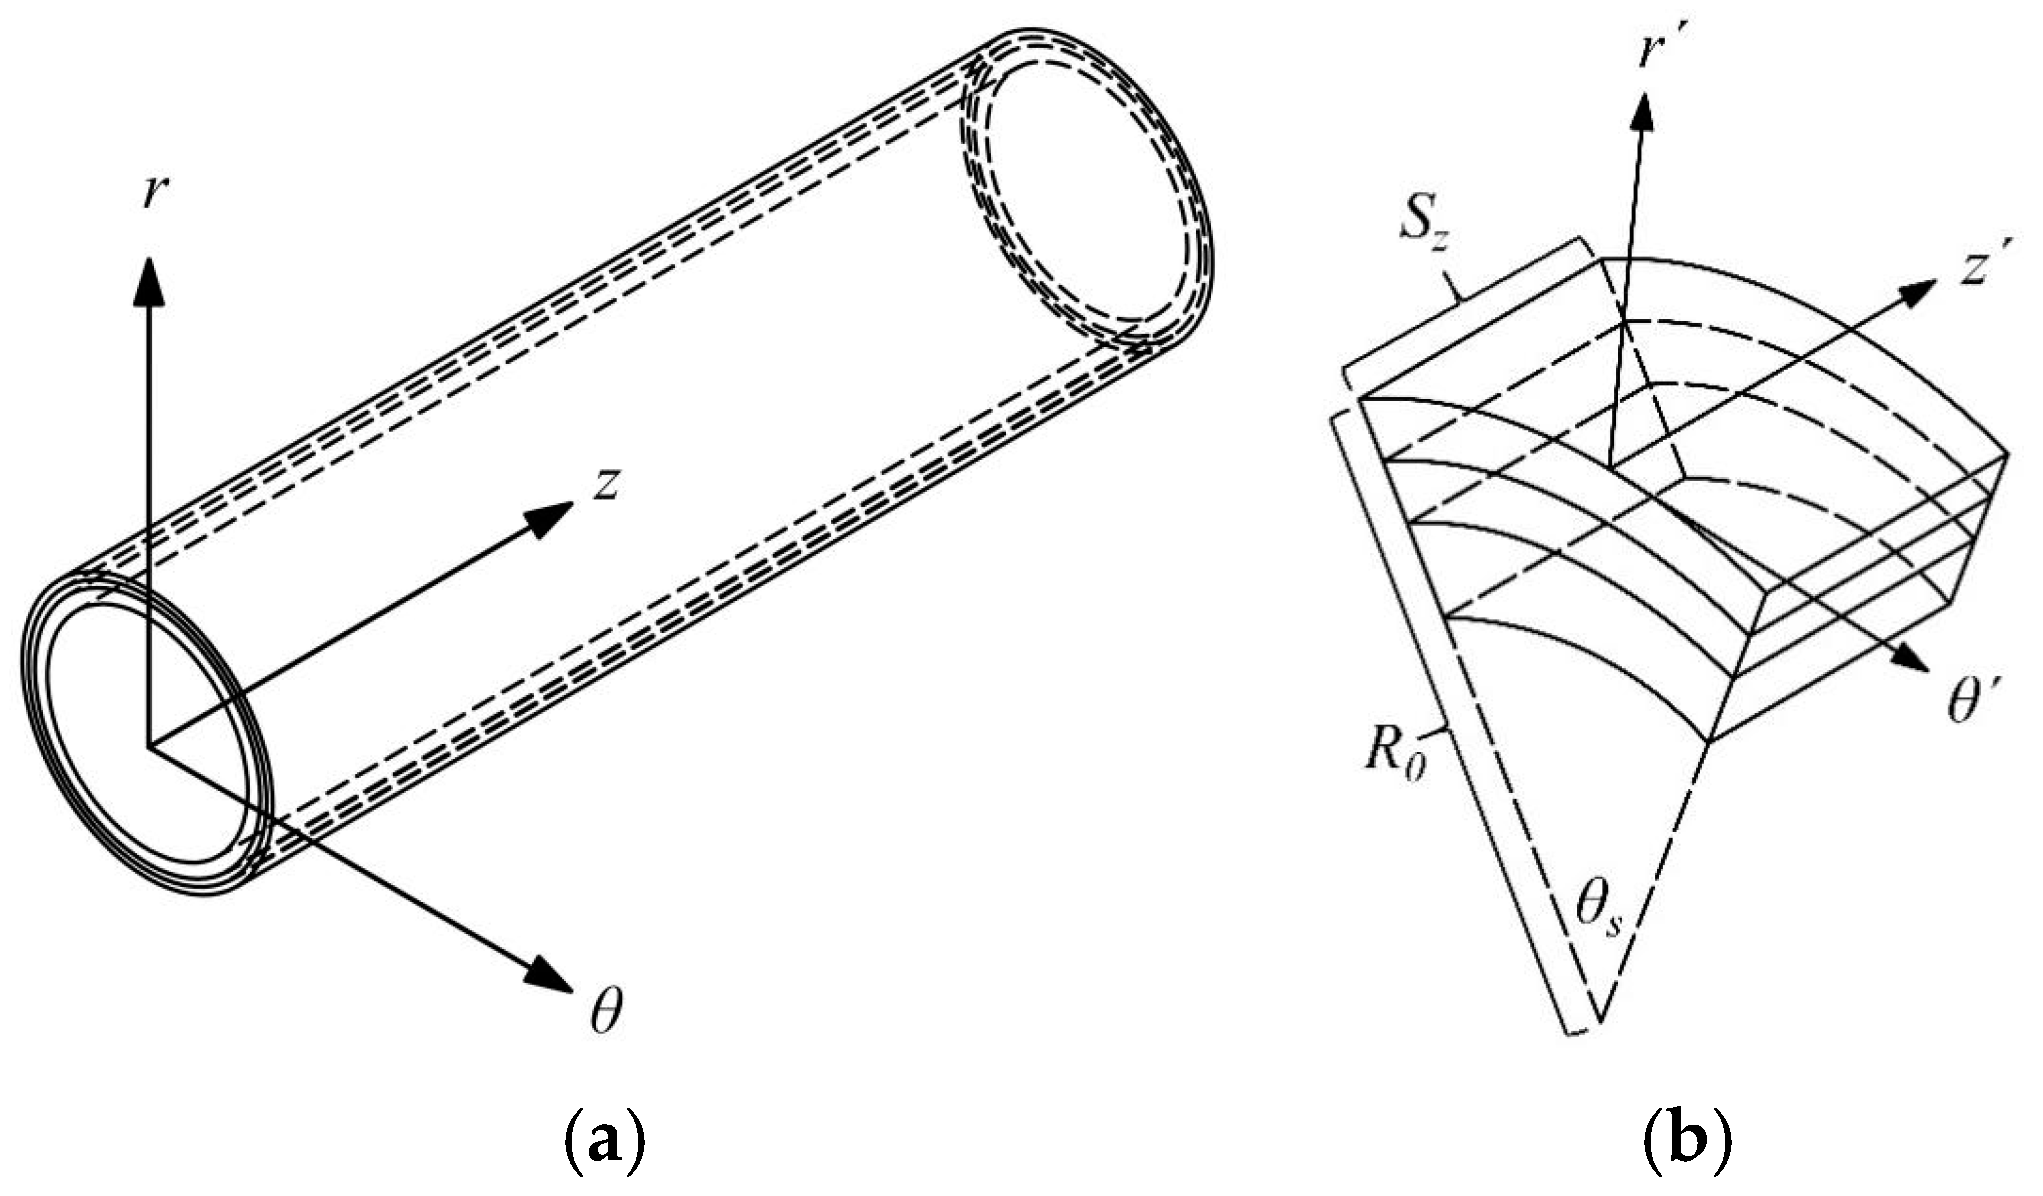
Figure 1b depicts a cell within a ring, assumed to extend infinitely in its axial direction. In COMSOL, the cell research model is established, and the boundary conditions are specified as follows: Floquet boundary conditions are applied to the surfaces perpendicular to the circumference, periodic boundary conditions are applied to the surfaces perpendicular to the axis, and the remaining surfaces are set to no-traction conditions. The underlying principle involves parameterizing the wave number within the Brillouin zone using the finite element method to obtain the relationship between the wave number and frequency.
The investigated physical models are shown in
Figure 1.
Figure 1a shows the investigated infinite-length multilayer annular waveguide structure, and
Figure 1b shows the unit cell based on Floquet boundary conditions.
The requisite material parameters for the simulation calculations of all material layers are identified through the ultrasonic bulk wave velocity measurements [
35]. These parameters are presented in
Table 1.
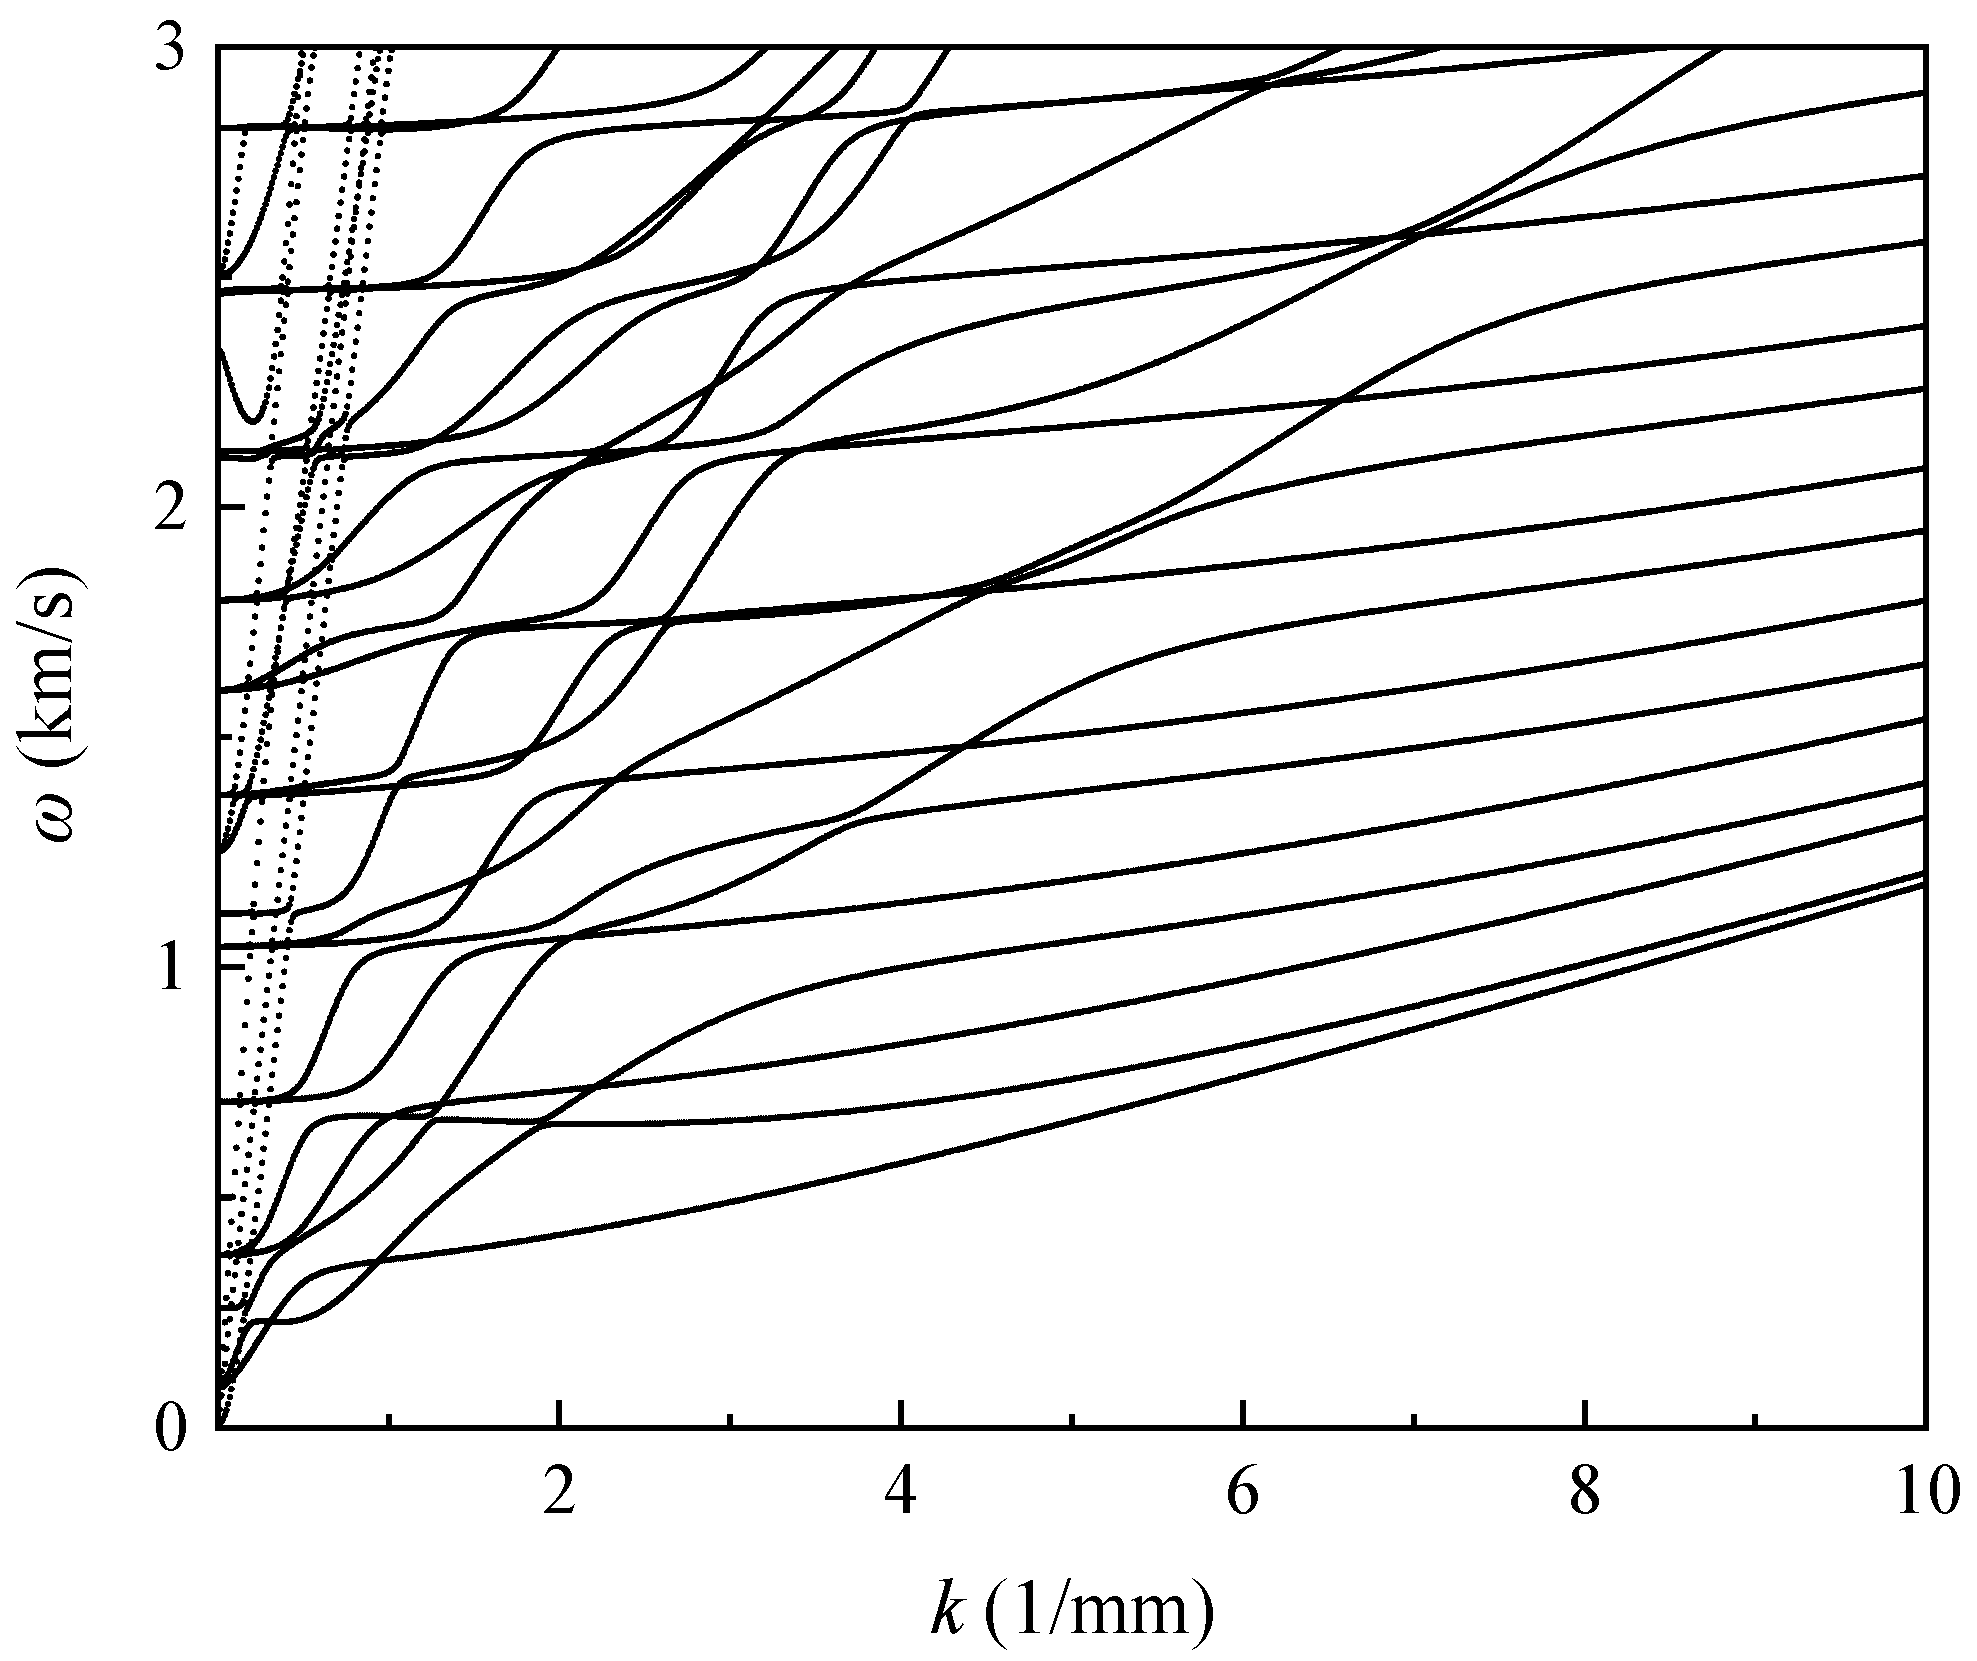
The wavenumber–frequency data can be obtained directly from COMSOL, and the wavenumber–frequency curves plotted from the data are shown in
Figure 2. It can be used to select the frequency effective interval to avoid band folding. Lin et al. [
36] demonstrated that
θs and
Sz affect the effective range of
k–
f. For the pipes with a large diameter involved in this study, minimizing the values of
θs and
Sz will expand the effective range of
k–
f and decrease the time required for the solution. The experimental model has a circumferential dimension
θs of 0.03° and an axial dimension
Sz of 0.2 mm.
From the frequency-wave number data, the angular frequency
ω can be calculated first:
Then, the phase velocity
cp can be calculated as follows:
where
f is the frequency,
kθ is the wavenumber.
The CSH (Circumferential Shear Horizontal Wave) wave exhibits only axial displacement, with zero radial and circumferential displacements. In contrast, the CLT (Circumferential Lamb Type Wave) wave has two displacement directions: in-plane and perpendicular to the in-plane. The CLT wave exhibits radial and circumferential displacements with zero axial displacements because its in-plane displacement direction is parallel to the path of wave propagation. The direction of the displacement of the CLT wave determines its higher detection sensitivity for bonded structures. Therefore, only the CLT waves are considered in the subsequent parts of the study.
2.2. Wave Dispersion Curves
The excitation signal of an ultrasonic-guided wave is a sine wave in a specific frequency range. A phase velocity curve is a curve that describes the relationship between phase velocity and frequency propagating through a medium. This is helpful in selecting the frequency interval with a flat phase velocity curve to stimulate the signal and avoid errors. The plotted CLT wave phase velocity dispersion curves are displayed in
Figure 3. A significant number of low-frequency conducting modes persist due to the low Young’s modulus of the EVA hot melt adhesive layer and the high attenuation in the adhesive and polyethylene layers. The modes of guided waves are distinguished by incremental numbering because the pipe cladding construction lacks mid-plane symmetry [
37]. The challenge of the nonlinear ultrasonic inspection of interfacial bonding strength is exciting the second harmonic. The red box in
Figure 3 is used to select the area where the phase velocity varies more gently, with a frequency range of 50 kHz to 300 kHz. It is beneficial to attempt to align the fundamental and second harmonic frequencies with the boxed frequency range, as this facilitates the excitation of the second harmonic. Therefore, the optimal excitation frequency range is determined to be 50 kHz to 150 kHz.
Considering various operating conditions, numerous types of heat-shrinkable tapes exist. As the most crucial component of these materials, EVA hot-melt adhesive may undergo significant fluctuations in its mechanical properties after undergoing the processes of heating for installation and cooling to a static state. This study explores the impact of Poisson’s ratio and elastic modulus of the EVA layer on the dispersion curves of CLT wave phase velocities, with the aim of identifying an optimal frequency range.
Figure 4 presents the phase velocity dispersion curves for EVA hot-melt adhesive layers with different Poisson’s ratios. At frequencies below 0.3 MHz, the mode selected in the small box is used as a reference. As the Poisson’s ratio of the adhesive layer increases, the modes on the left side of the box undergo almost no change, while the modes on the right side shift to the right. However, the region with gentle phase velocity variation after this shift is conducive to the matching of phase velocities at the fundamental and second harmonic frequencies. Although changes in the Poisson’s ratio of the adhesive layer have a certain impact on the dispersion characteristics, these effects are conducive to the conduct of nonlinear ultrasonic guided wave detection experiments.
Figure 5 displays the phase velocity dispersion curves for an EVA hot melt adhesive layer with varying elastic moduli. The variation in the elastic modulus of the adhesive layer significantly influences the phase velocity dispersion curve of the multilayered annular structure. Generally, as the elastic modulus of the adhesive layer increases, the dispersion curve of the CLT wave shifts rapidly to the right and upward, indicating a gradual increase in the phase velocity of a single mode at a constant frequency. The number of modes within a fixed frequency interval decreases continuously, and the flat region of the phase velocity expands correspondingly. These changes are advantageous for the excitation of second harmonics. Analysis reveals that most of the phase velocity flat regions are primarily concentrated between 50 kHz and 250 kHz. The optimal excitation frequency range (50 kHz to 150 kHz) falls within this span.
2.3. Wave Structure Analysis
The main difficulty in applying the CLT wave to a real-world guided wave detection problem is determining which mode and frequency combination will yield the best fault sensitivity. In addition, it is best to excite the fewest possible modes in the structure in order to streamline the process of interpreting the experimental results. The use of a low frequency can effectively mitigate the rapid attenuation of guided waves within the thermal contraction band. However, an appropriately high excitation frequency also is necessary to achieve optimal resolution.
A selection of four guided wave modes, namely CLT
5, CLT
6, CLT
8, and CLT
9, has been proposed for further investigation. The four guided wave modes exhibit stationary phase velocity regions, ideal for detection, as highlighted in the red box in
Figure 3. As shown in
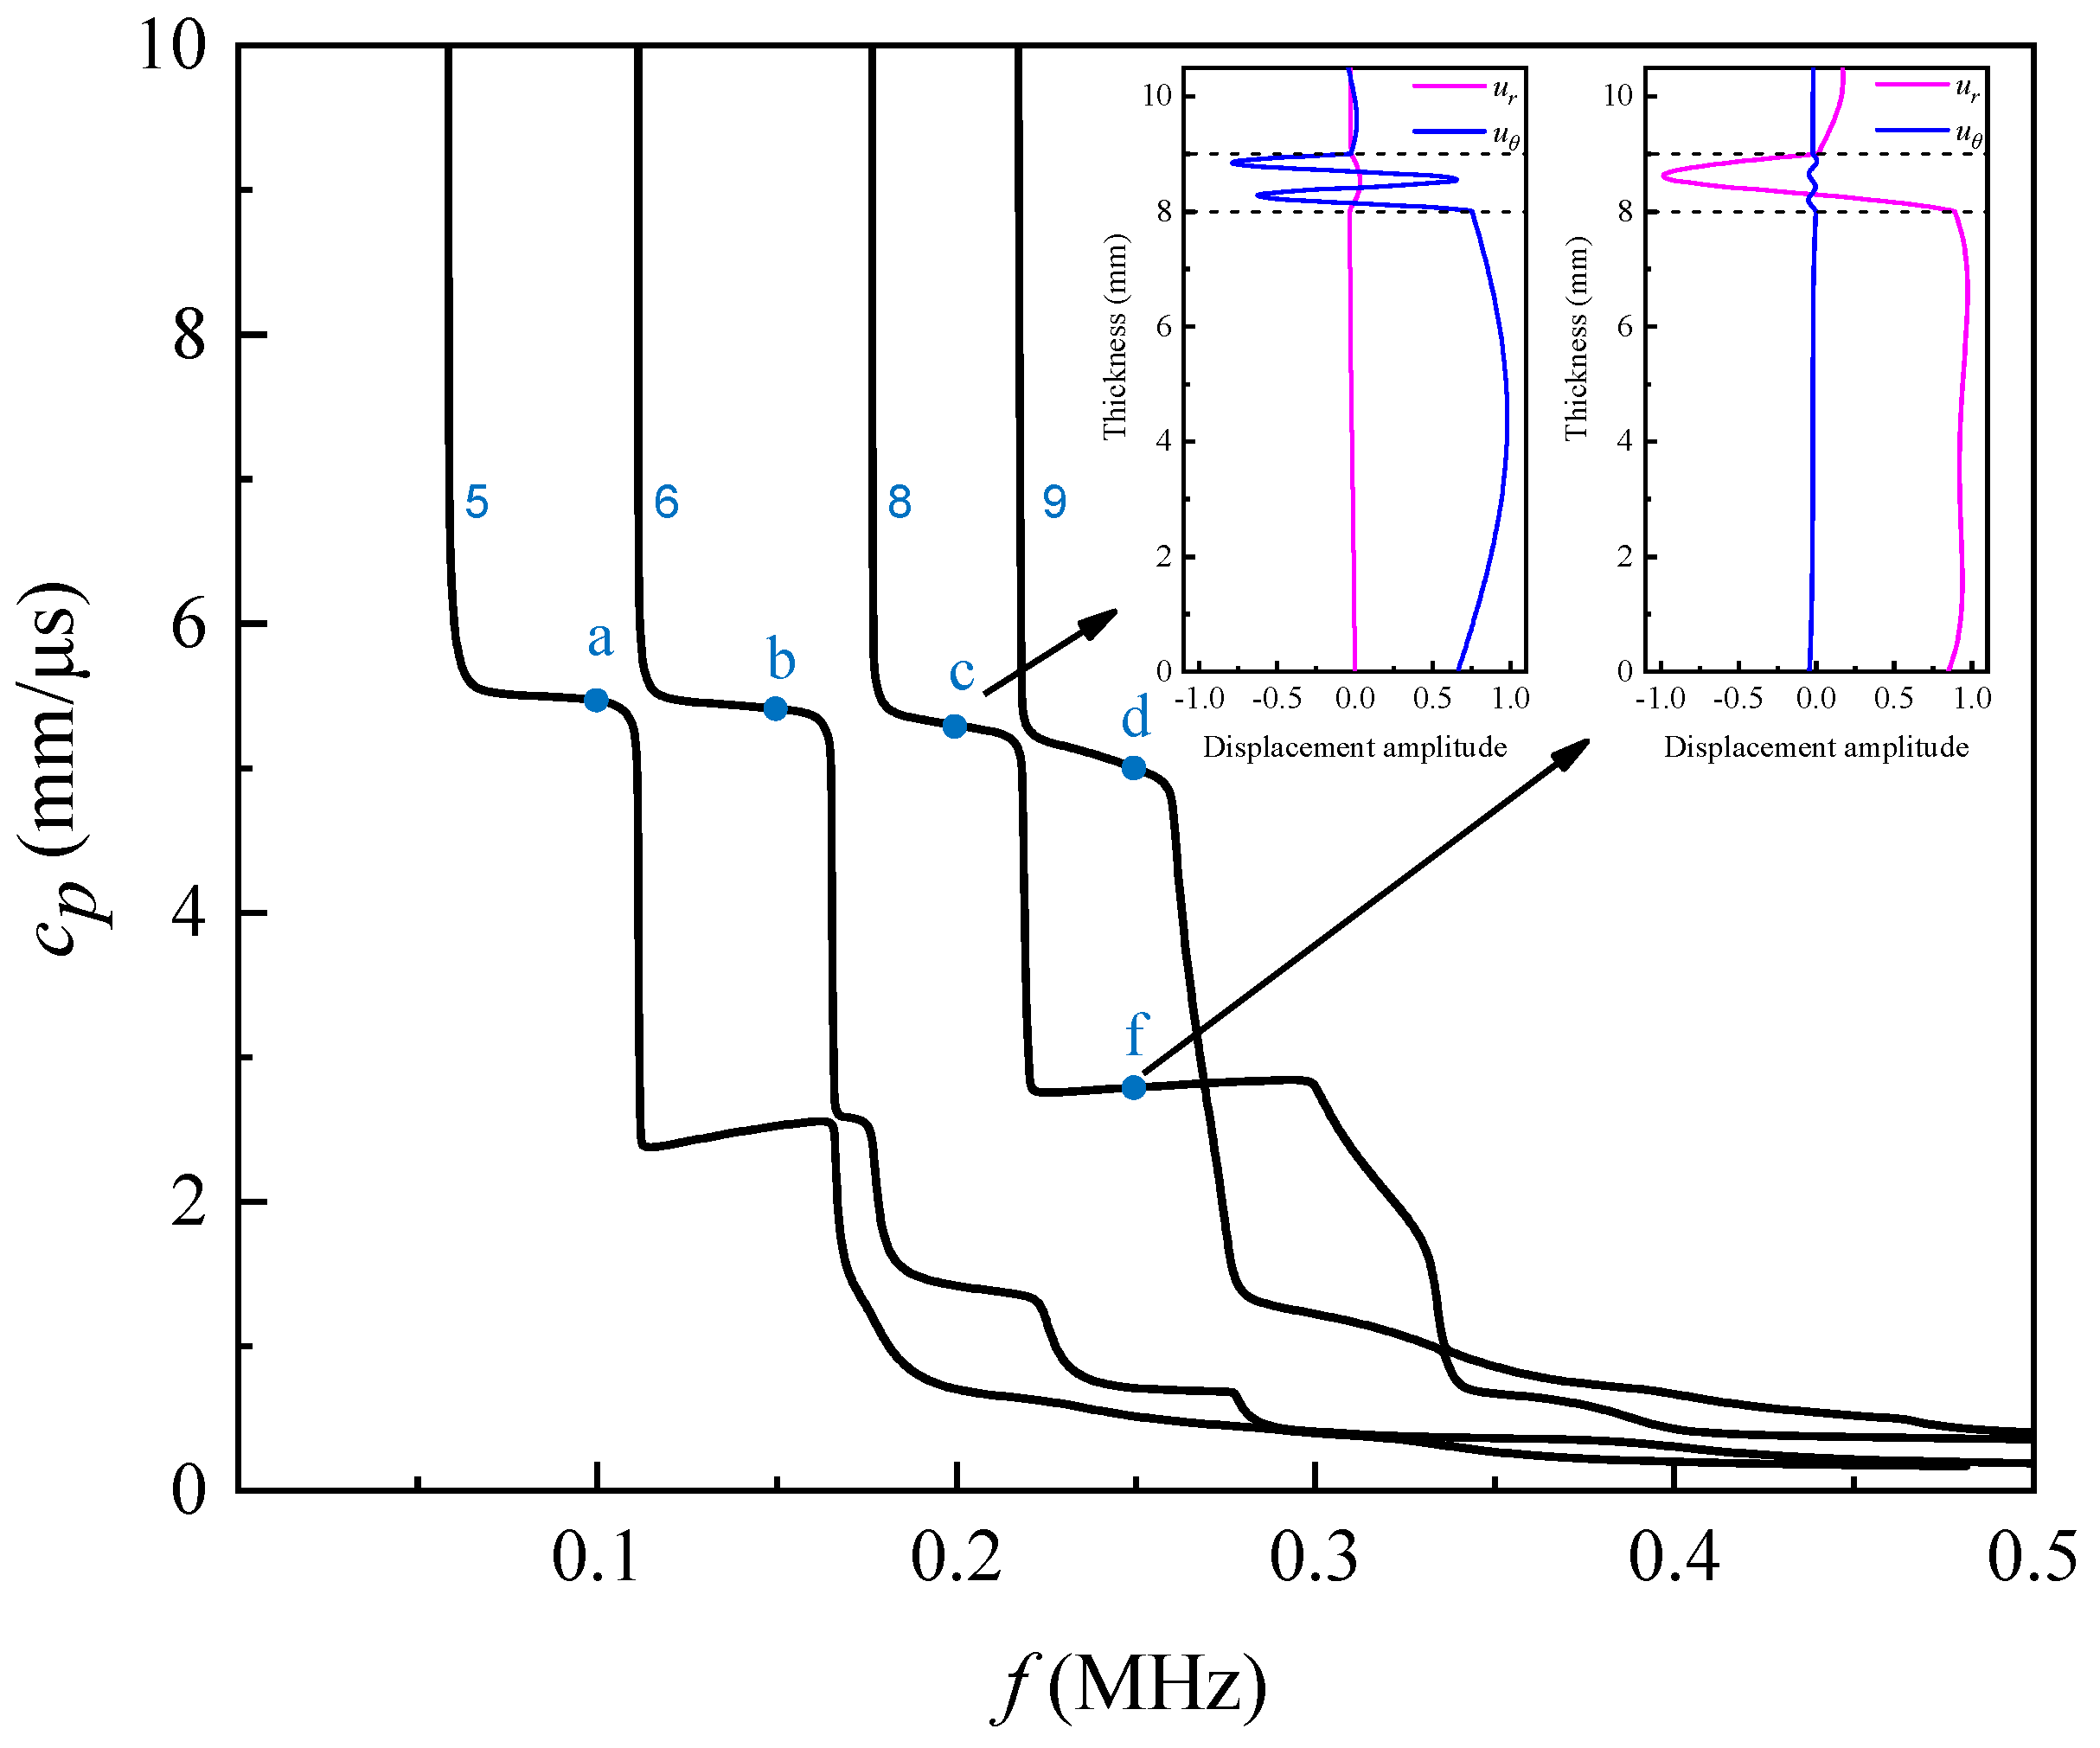
Figure 6, an increase in frequency causes a shift from a dominant role of the circumferential displacement to a dominant role played by the radial displacement.
The wave structure map serves as an indicator of the sensitivity level and energy concentration associated with guided wave modes. Specifically, an increased displacement within this map signifies a heightened sensitivity of the mode and a more concentrated energy distribution. Consequently, during the optimization of guided wave modes, a mode exhibiting a larger displacement is desirable. The normalized displacement wave structures at points with frequencies of 100 kHz, 150 kHz, 200 kHz, and 250 kHz on modes CLT
5, CLT
6, CLT
8, and CLT
9 are shown in
Figure 7.
ur and
uθ indicate radial and circumferential displacements, respectively. And the phase velocity of each mode is around 5.3 km/s. It should be noted that the radial displacements of all four modes are relatively minor. In order to illustrate the variations in their structure more effectively, it is necessary to magnify the radial displacements by a factor of ten. The different material layers are indicated by the dotted lines. The EVA melt is indicated within the dotted line, with steel located beneath the dotted frame and polyethylene situated above it. The significant in-plane displacement at the steel-EVA hot melt adhesive interface can be clearly observed. Furthermore, the CLT
8 mode exhibits greater radial displacement compared to the other modes. Therefore, the CLT
8 mode at the frequency of 200 kHz is used as the excitation signal in the experiments.
2.4. Theoretical Fundamental of Nonlinear Ultrasonic
A contact acoustic nonlinear interaction mechanism exists between surfaces exhibiting weak bonding and cracking [
38,
39]. In the one-dimensional case, the nonlinear stress—strain relationship derived from the classical nonlinear elastic theory can be represented as follows [
5]:
where
σxx is the stress,
E0 is the linear elastic modulus of materials,
εxx is the strain, and
β is the second-order classical nonlinearity parameter.
The fluctuation equation’s simple harmonic solution is as follows:
where
A1 is the amplitude of the fundamental frequency wave.
One dimensional nonlinear wave motion equation of longitudinal waves can be obtained by combining the wave motion equation with Equation (4). Furthermore, the second-order acoustic nonlinear coefficient can be expressed using the amplitude of the second harmonic and the fundamental frequency wave.
where
A2 is the amplitude of the second harmonic.
The second-order acoustic nonlinear coefficient is proportional to the ratio of the second-harmonic amplitude to the squared amplitude of the fundamental frequency wave, given a constant propagation distance of the acoustic wave. Thus, it is feasible to simplify the nonlinear coefficient of the classical nonlinear effect as
In addition, contact acoustic nonlinearity arising from weak bonding surfaces and fissures is not the same as classical acoustic nonlinearity. The contact acoustic nonlinearity has been explained by several theories and models, including the bilinear stiffness model and the hysteretic model. Zhao et al. [
40] investigated the fluctuation characteristics of ultrasonic waves in structures containing microcracks based on a bilinear stiffness model. The non-classical acoustic nonlinear coefficient of ultrasonic waves propagating in microcracked structures is given as follows:
In contrast to classical nonlinear theory, non-classical nonlinearity primarily focuses on the hysteresis effects within the stress–strain curves and variations in contact surface stiffness attributed to contact nonlinearity. The acoustic nonlinear coefficient can be defined as the ratio of the fundamental amplitude to the amplitude of the second harmonic. The definition of this nonlinear coefficient can be employed for the investigation of non-classical nonlinear problems, such as contact. The content of this paper is related to the contact nonlinear problem. Thus, the nonlinear behavior of guided waves is investigated employing this definition of the nonlinear coefficient.
4. Experimental Results and Analysis
4.1. Linear Ultrasonic Guided Wave Testing
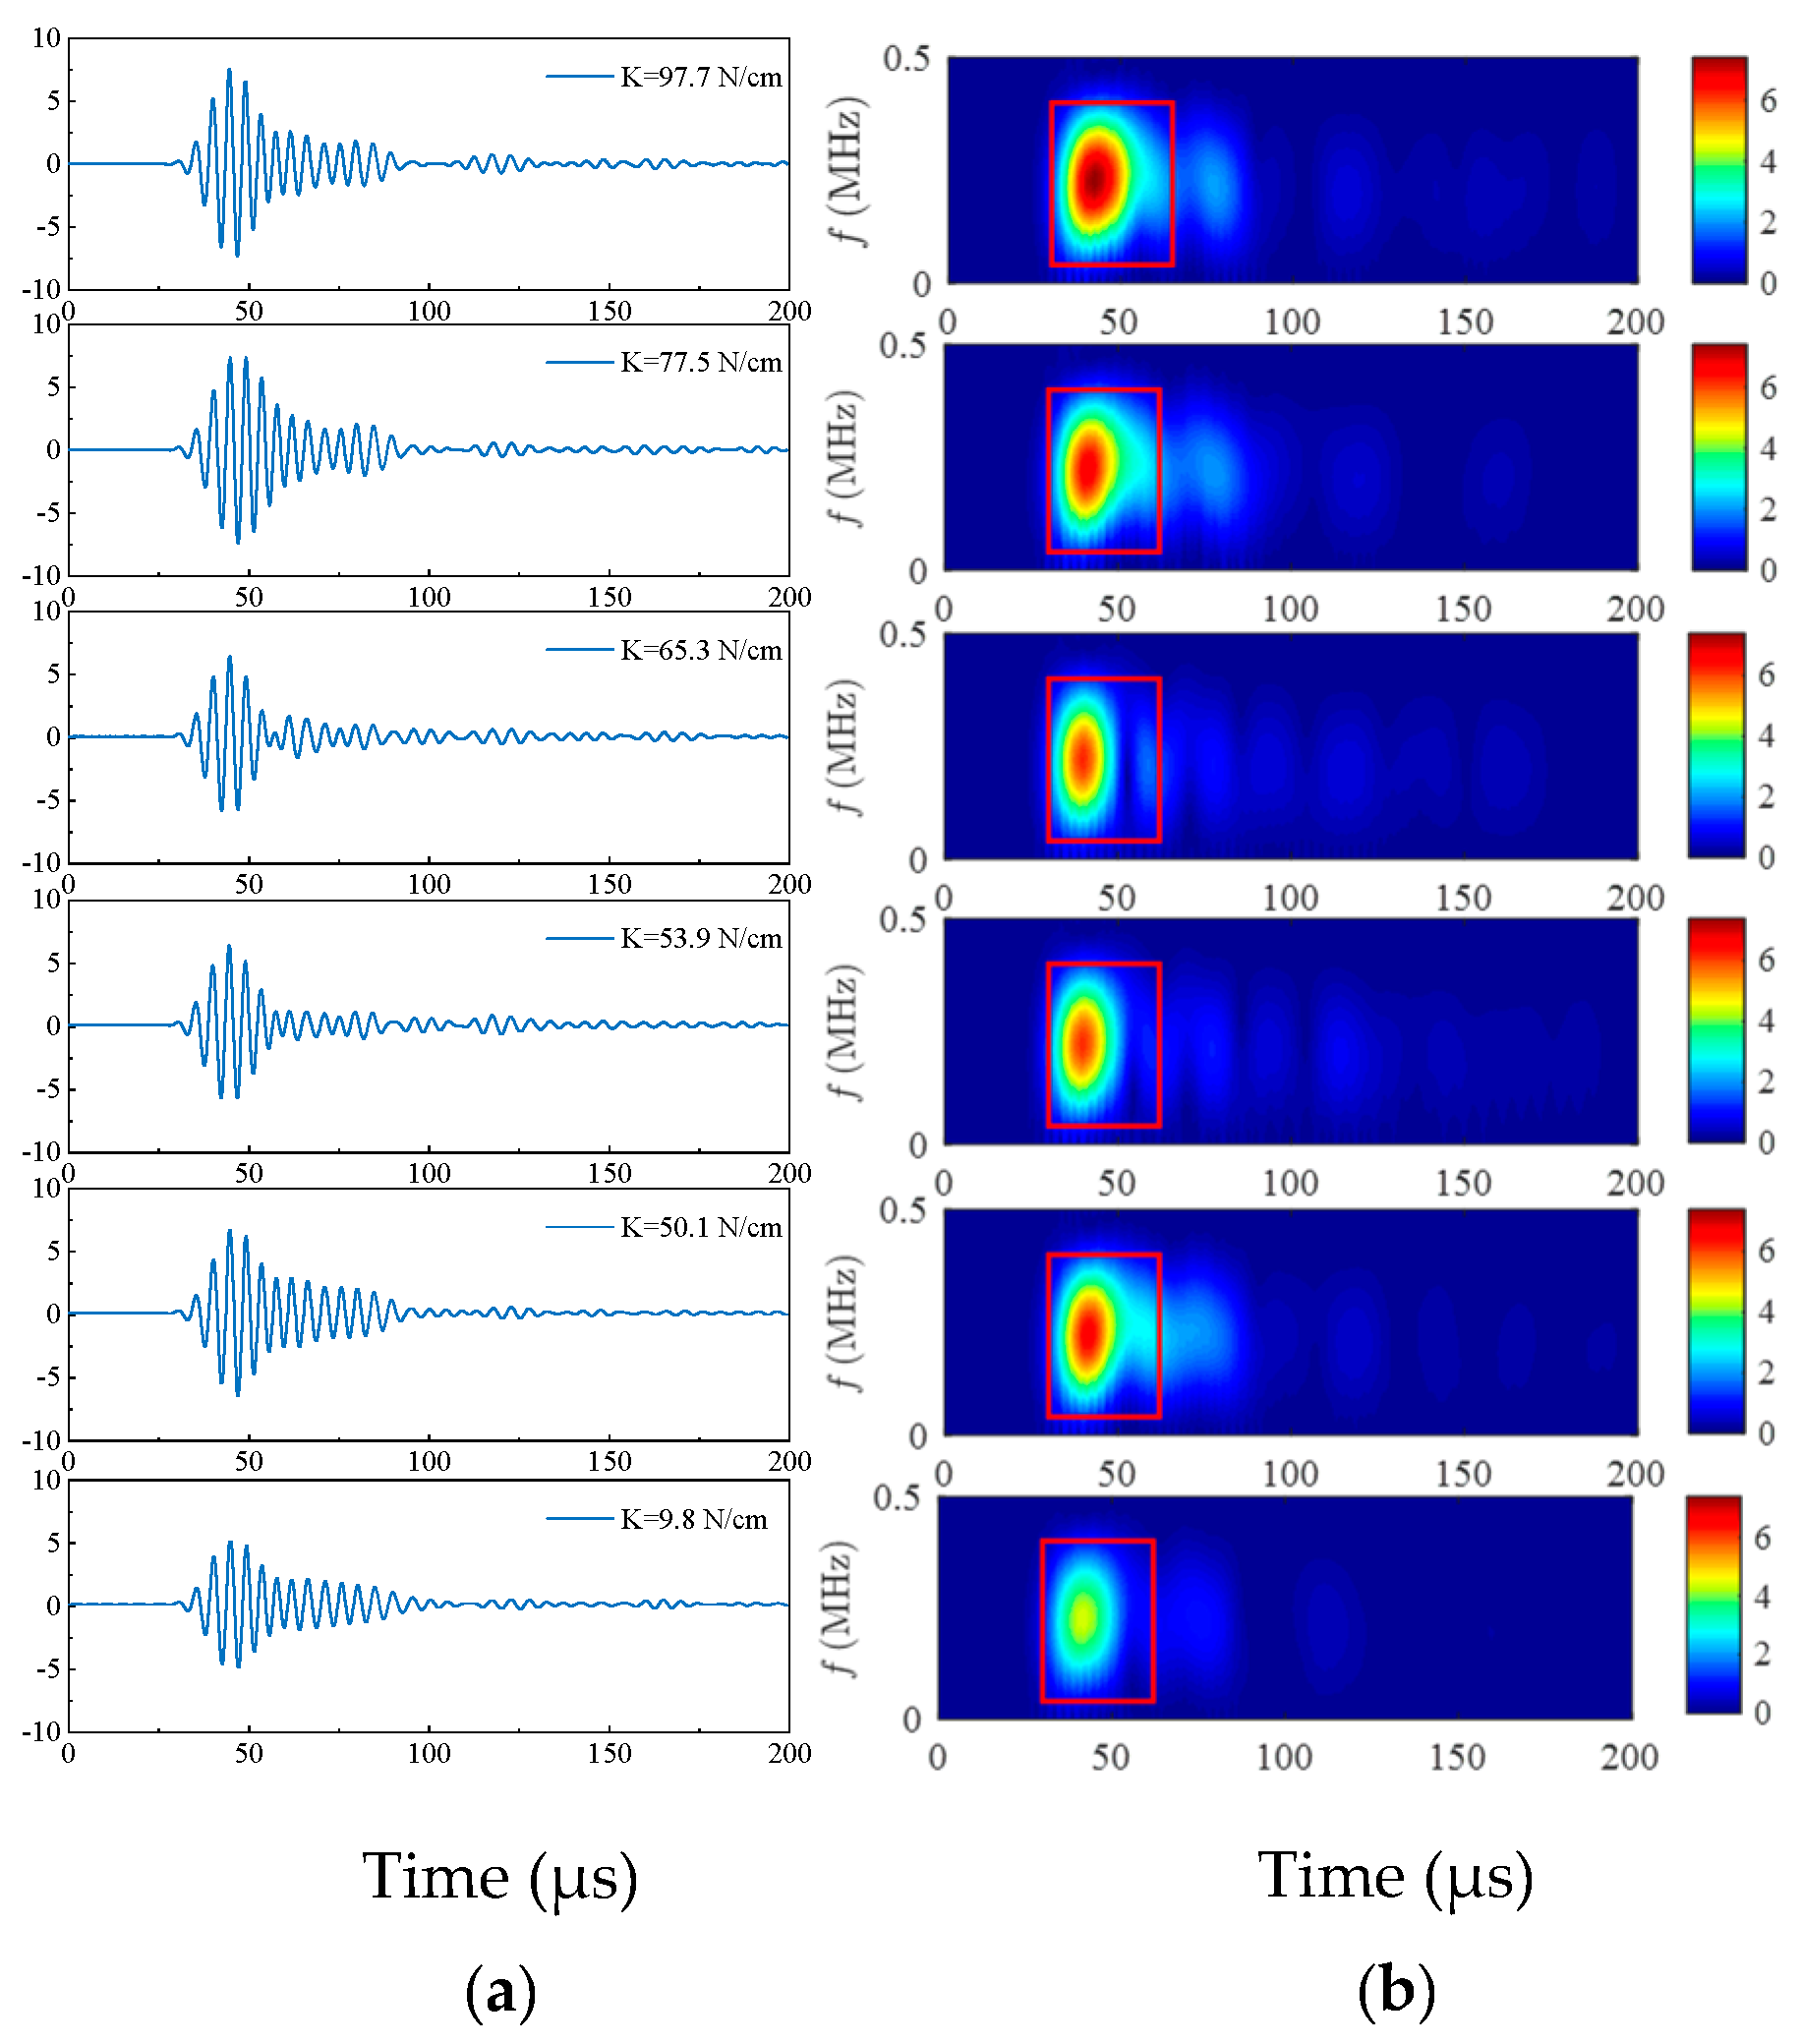
The quality of interfacial bonding can be assessed using linear ultrasonic-guided wave techniques, which are primarily distinguished by amplitude, propagation time, and frequency. However, the limited detection distance in this test makes it difficult to distinguish between interfaces with different bonding strengths based solely on propagation time. Consequently, only amplitude and frequency are employed for the analyses. A larger periodic number may improve modal selectivity. To prevent the stimulation of adjacent modes and account for slight fluctuations in adhesive layer thickness, the excitation signal should be a 5-cycle sinusoidal pulse signal modulated by a Hanning window. The time-domain and frequency-domain signals collected from specimens with varying bonding strengths are displayed in
Figure 12. The frequency-domain spectrum was obtained using the short-time fast Fourier transform (STFFT).
It is found that the weakening of the bonding strength would appear as a decrease in the amplitude of circumferential guided waves. Furthermore, it is established that the absorption effects of different bonding strength interfaces on signal frequency vary.
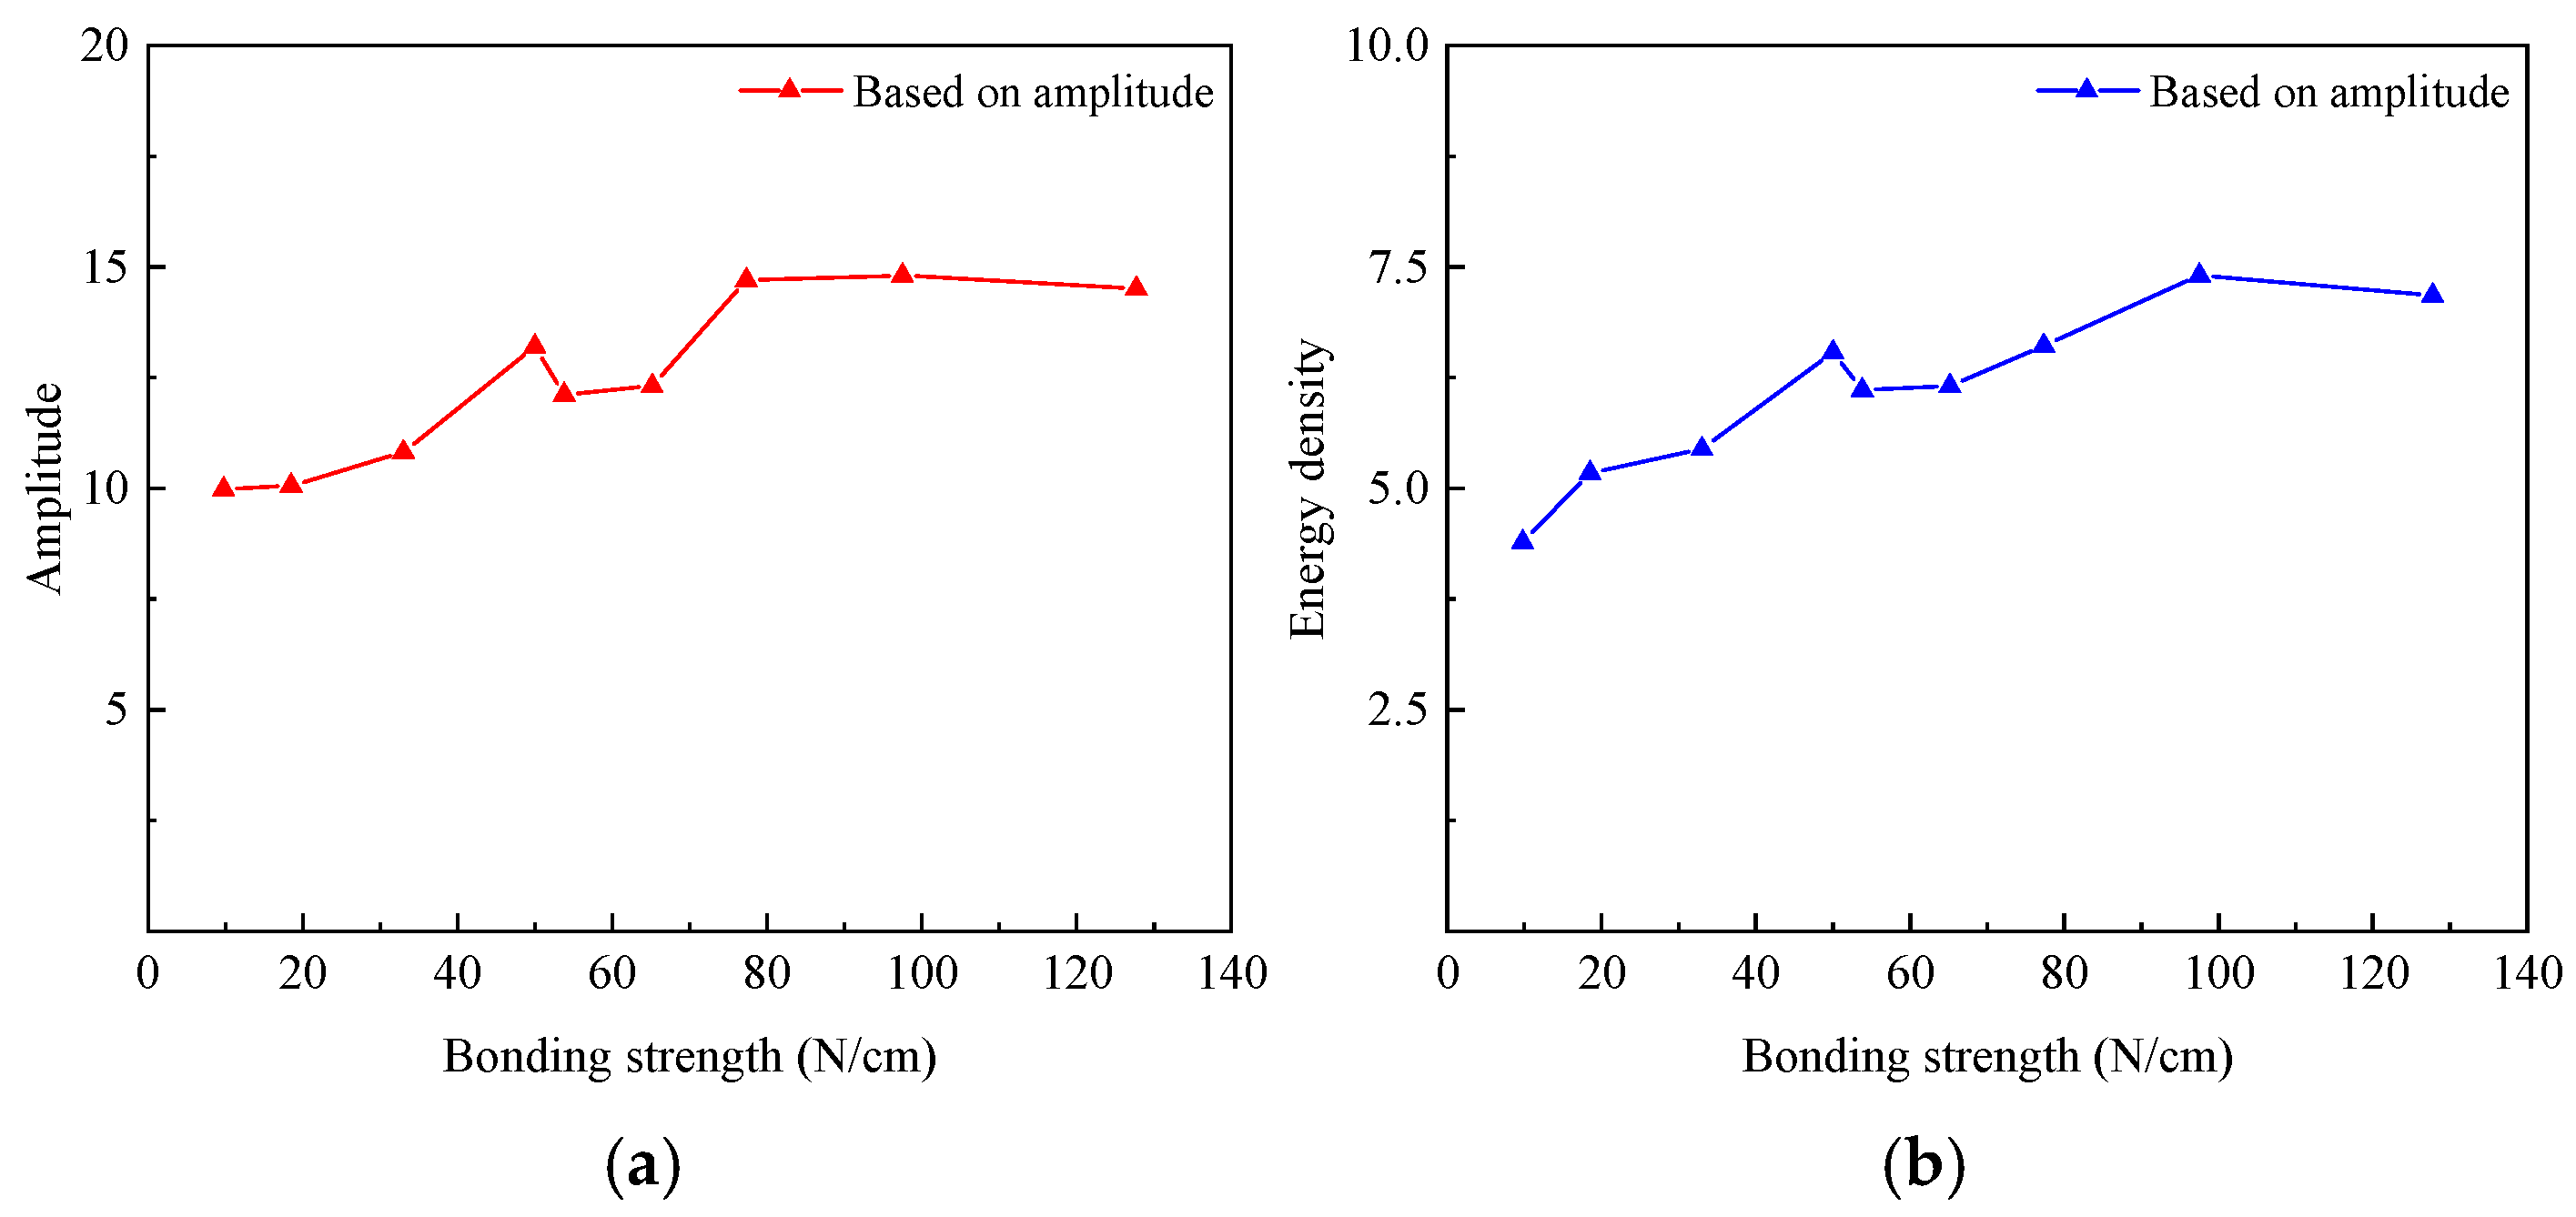
Figure 13a shows the time-domain signal amplitude corresponding to the bonding strengths of the heat-shrinkable test specimens. It is concluded that the amplitude of the time-domain signals tends to increase as the bonding strength increases. Based on the amplitude, it is possible to accurately screen out specimens with tightly non-bonding interfaces, which have only 40%~55% of the amplitude of others. However, the method cannot distinguish between weak bonding and good bonding specimens. The images show no significant change in amplitude between the two types of samples despite the large difference in binding strength. Considering the multifaceted factors that can influence the magnitude of a time-domain signal, it is noteworthy that the lower bonding strengths occasionally demonstrate higher amplitudes in the spectrogram.
By observing the spectrograms in
Figure 12, it can be found that there are some differences among the three types of typical bonding interfaces. However, analyzing interfacial bonding strength solely based on visual inspection of images is inherently subjective. Therefore, we also extracted the maximal energy density from the spectrograms. The maximum energy density of the spectrograms corresponding to the bonding strengths of the shrinkable test specimens is shown in
Figure 13b. The results show that the trend of the energy density in the spectra is comparable to the trend of the amplitude. A combination of peak density analysis and spectrographic inspection allows a distinction among three types of typical interfacial conditions. It can help to identify the specimens with good or poor bonding conditions, but the method is not ideal for distinguishing the bonding strengths within the range of 40 N/cm to 80 N/cm.
Although frequency-based evaluation methods are demonstrably superior to amplitude methods, it is challenging to quantify the bonding strength using linear guided wave detection techniques. This is because the scale of defects detected by the conventional linear ultrasonic detection technique is comparable to the wavelength. To overcome the attenuation and achieve the objective of wide-range sweeping, the detection frequency uses lower frequencies for detection. In the transition interval between weak and good bonding strengths, the scale of internal defects, cracks, and weak joint interfaces diminishes progressively. It is difficult to detect and evaluate the bonding strength based on linear characteristics such as reflection, scattering, and absorption of ultrasonic energy.
4.2. Nonlinear Ultrasonic Guided Wave Testing
A good bonding interface has a bonding layer that is tightly bonded to the pipe, with weaker interfacial interactions that produce a lower second harmonic. As the bonding strength decreases, a subtle peeling phenomenon emerges at the bonded interface, accompanied by an enhanced interfacial interaction, which subsequently results in a rapid buildup of nonlinear effects. In order to satisfy the phase velocity matching and non-zero power fluxes under fundamental and doubled frequency conditions, the excitation frequency was initially determined to be 50 kHz to 150 kHz. Due to the limitation of process technology, the lowest center frequency of the transducer is 100 kHz, and the bandwidth range is ±40%. Therefore, we can stimulate the signals sequentially between 60 kHz–140 kHz, with a step size of 10 kHz, and observe whether there is a second harmonic generation by plotting the frequency-domain diagram. A 20-cycle sinusoidal pulse signal modified by a Hanning window serves as the excitation signal. A higher number of cycles is chosen, as an increase in the number of cycles of the excitation signal narrows the spectrum of the signal and concentrates its energy. This makes it easier to extract and analyze the second harmonic signal.
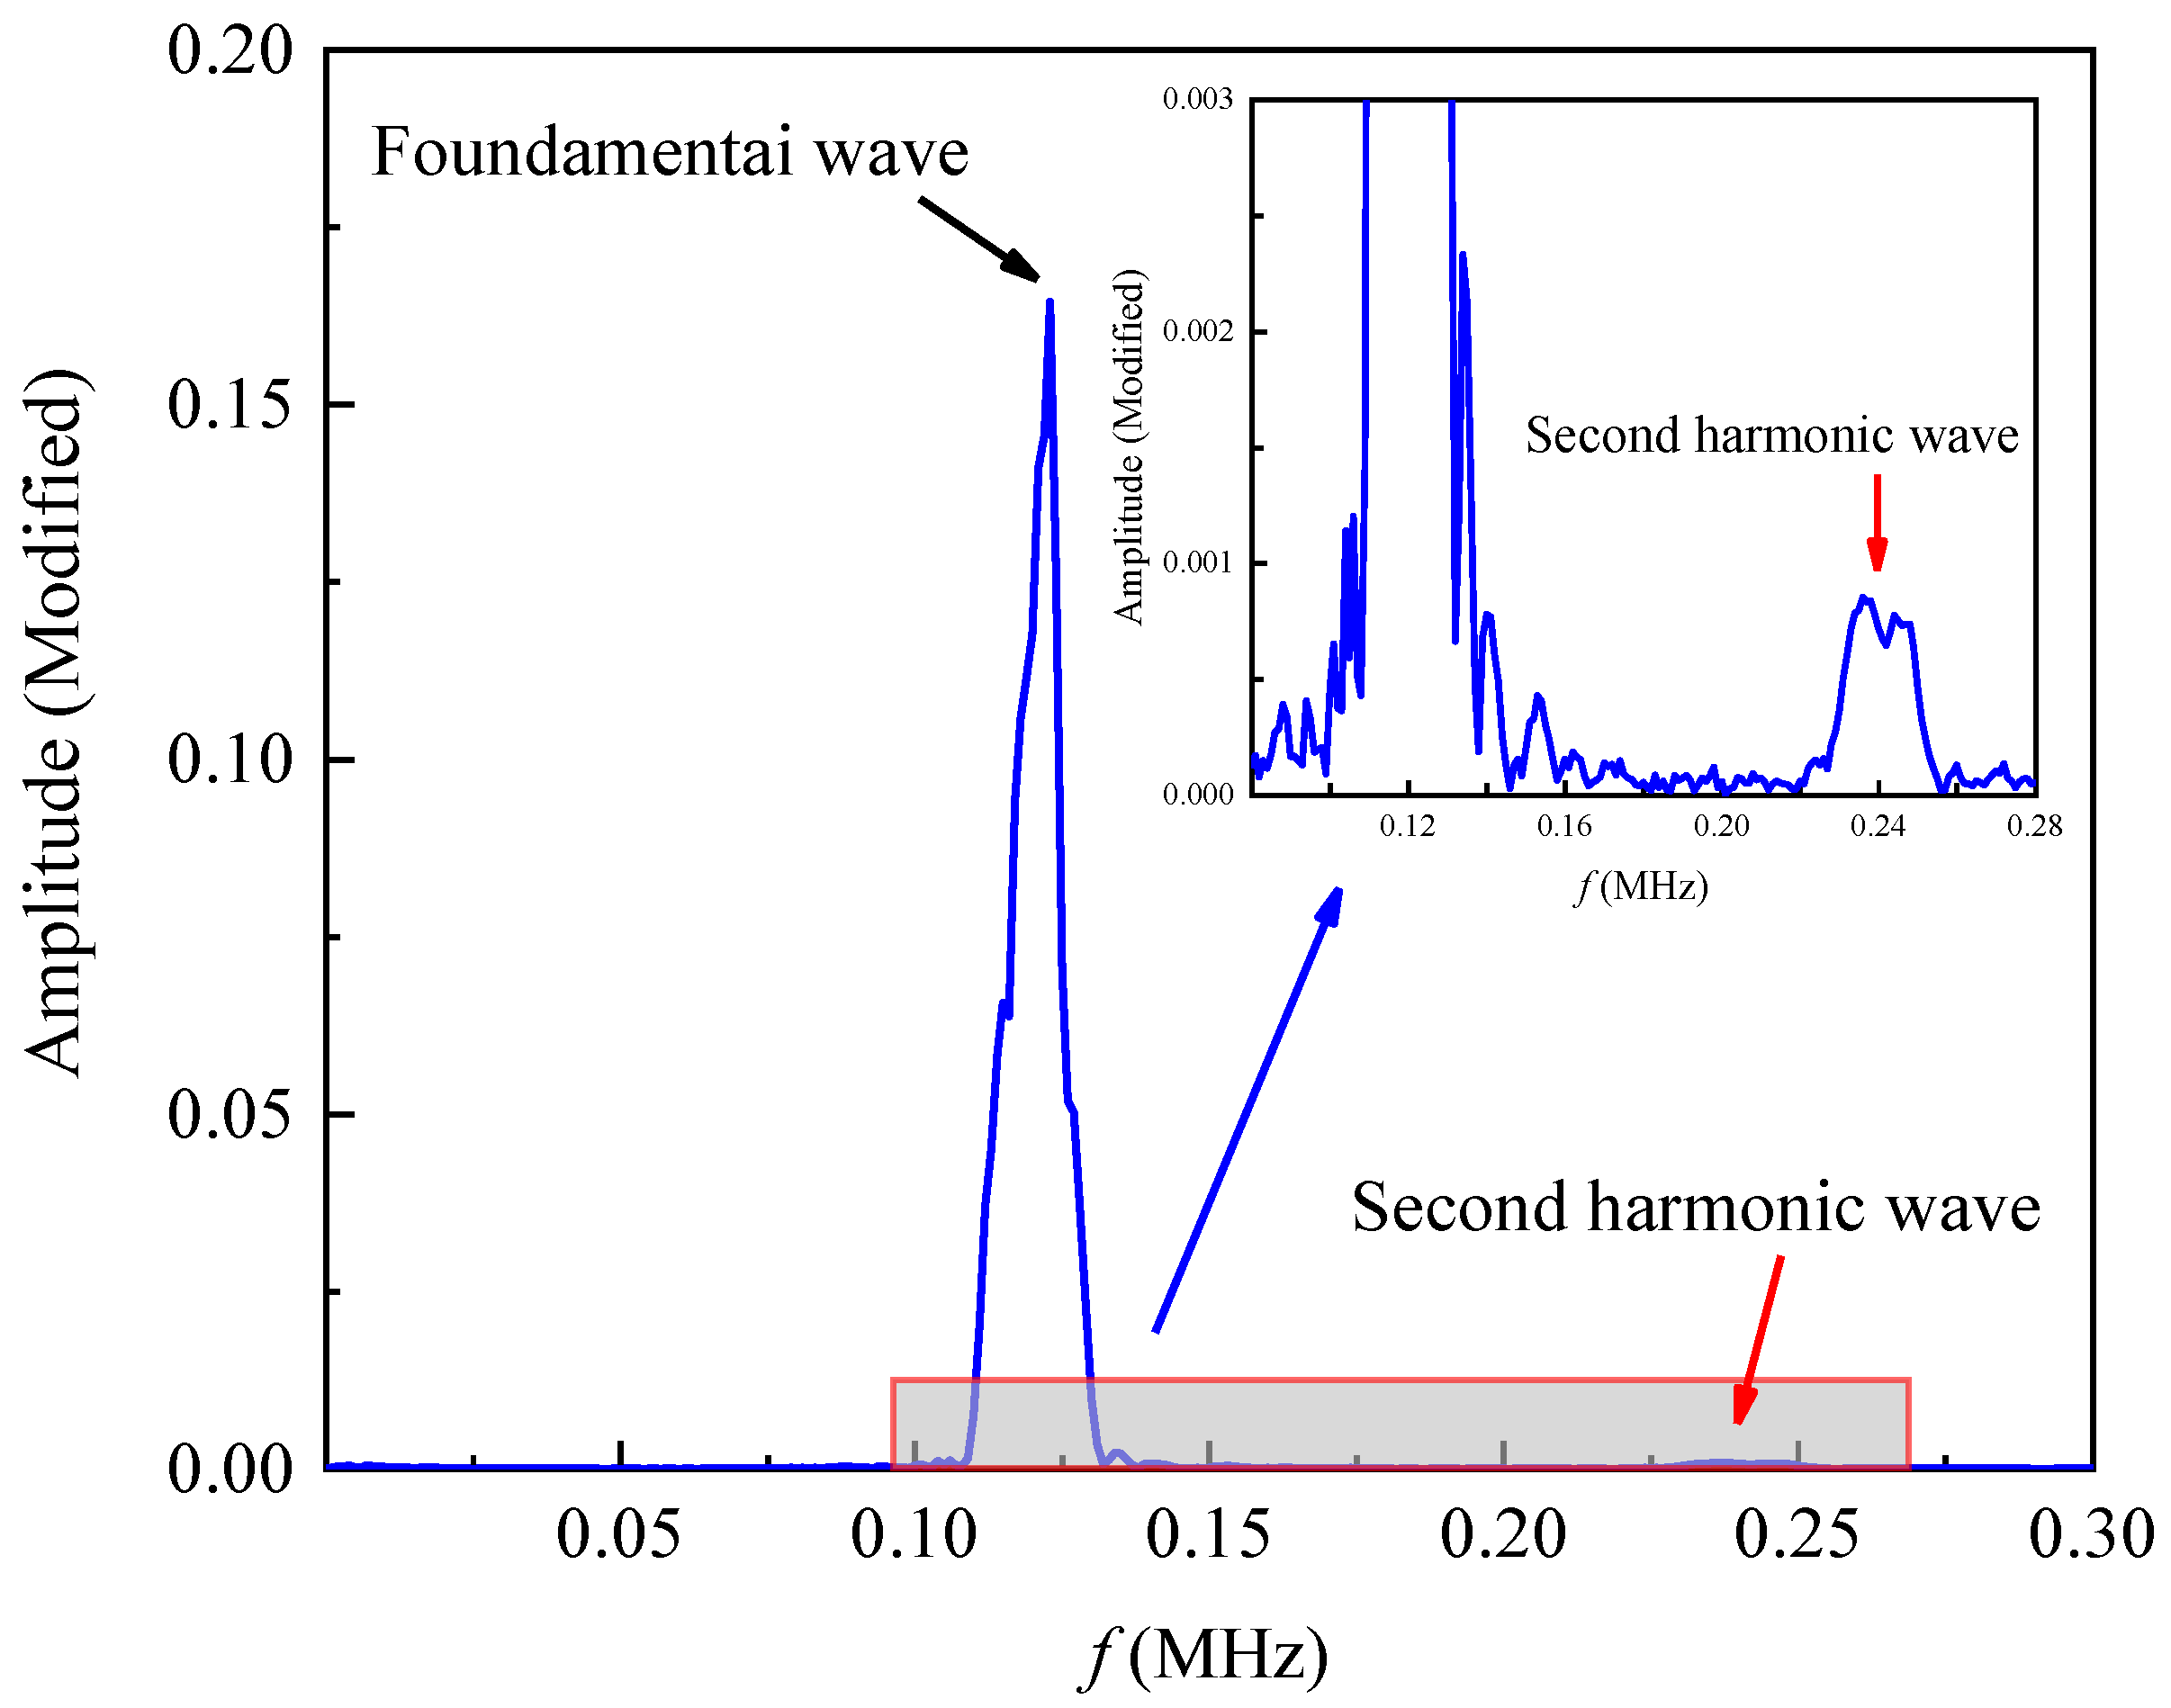
Following several tests, the transducer’s center frequency is settled at 120 kHz. The time-domain signal is next subjected to a fast Fourier transform (FFT), producing the frequency-domain curve depicted in
Figure 14. The second harmonic generated at 240 kHz is clearly visible in the local zoom-in diagram, although its amplitude is not as great as the fundamental wave’s.
The material parameters of heat-shrinkable tapes produced by different manufacturers exhibit considerable variability due to differences in usage scenarios and installation methods. Another important consideration is that the EVA hot melt layer undergoes changes in material parameters and mechanical properties after heating and cooling compared to its original state. These elements affect the structure’s wave propagation properties, resulting in a deviation from the previously obtained dispersion curves. Due to these significant influences, the phase velocity of the second harmonic and the fundamental frequency wave are not perfectly aligned. The nonlinear coefficient does not consistently increase linearly as the detection distance increases. The relationship between different detection distances and the acoustic nonlinear coefficient is experimentally analyzed to determine the optimum range of detection distances. The correlation between the acoustic nonlinear coefficient and the detection distance for four different bonding strengths of samples is displayed in
Figure 15. The acoustic nonlinearity coefficient tends to rise and then fall with increasing detection distance. At a detection distance of 5 to 7 cm, there is a good reaction from both the fundamental wave and the second harmonic. The nonlinear coefficient is only slightly affected by the high attenuation properties of the material. In the next tests, the detection distance is adjusted at 5 cm in order to improve detection efficiency and ensure a smooth transition to the next experiment.
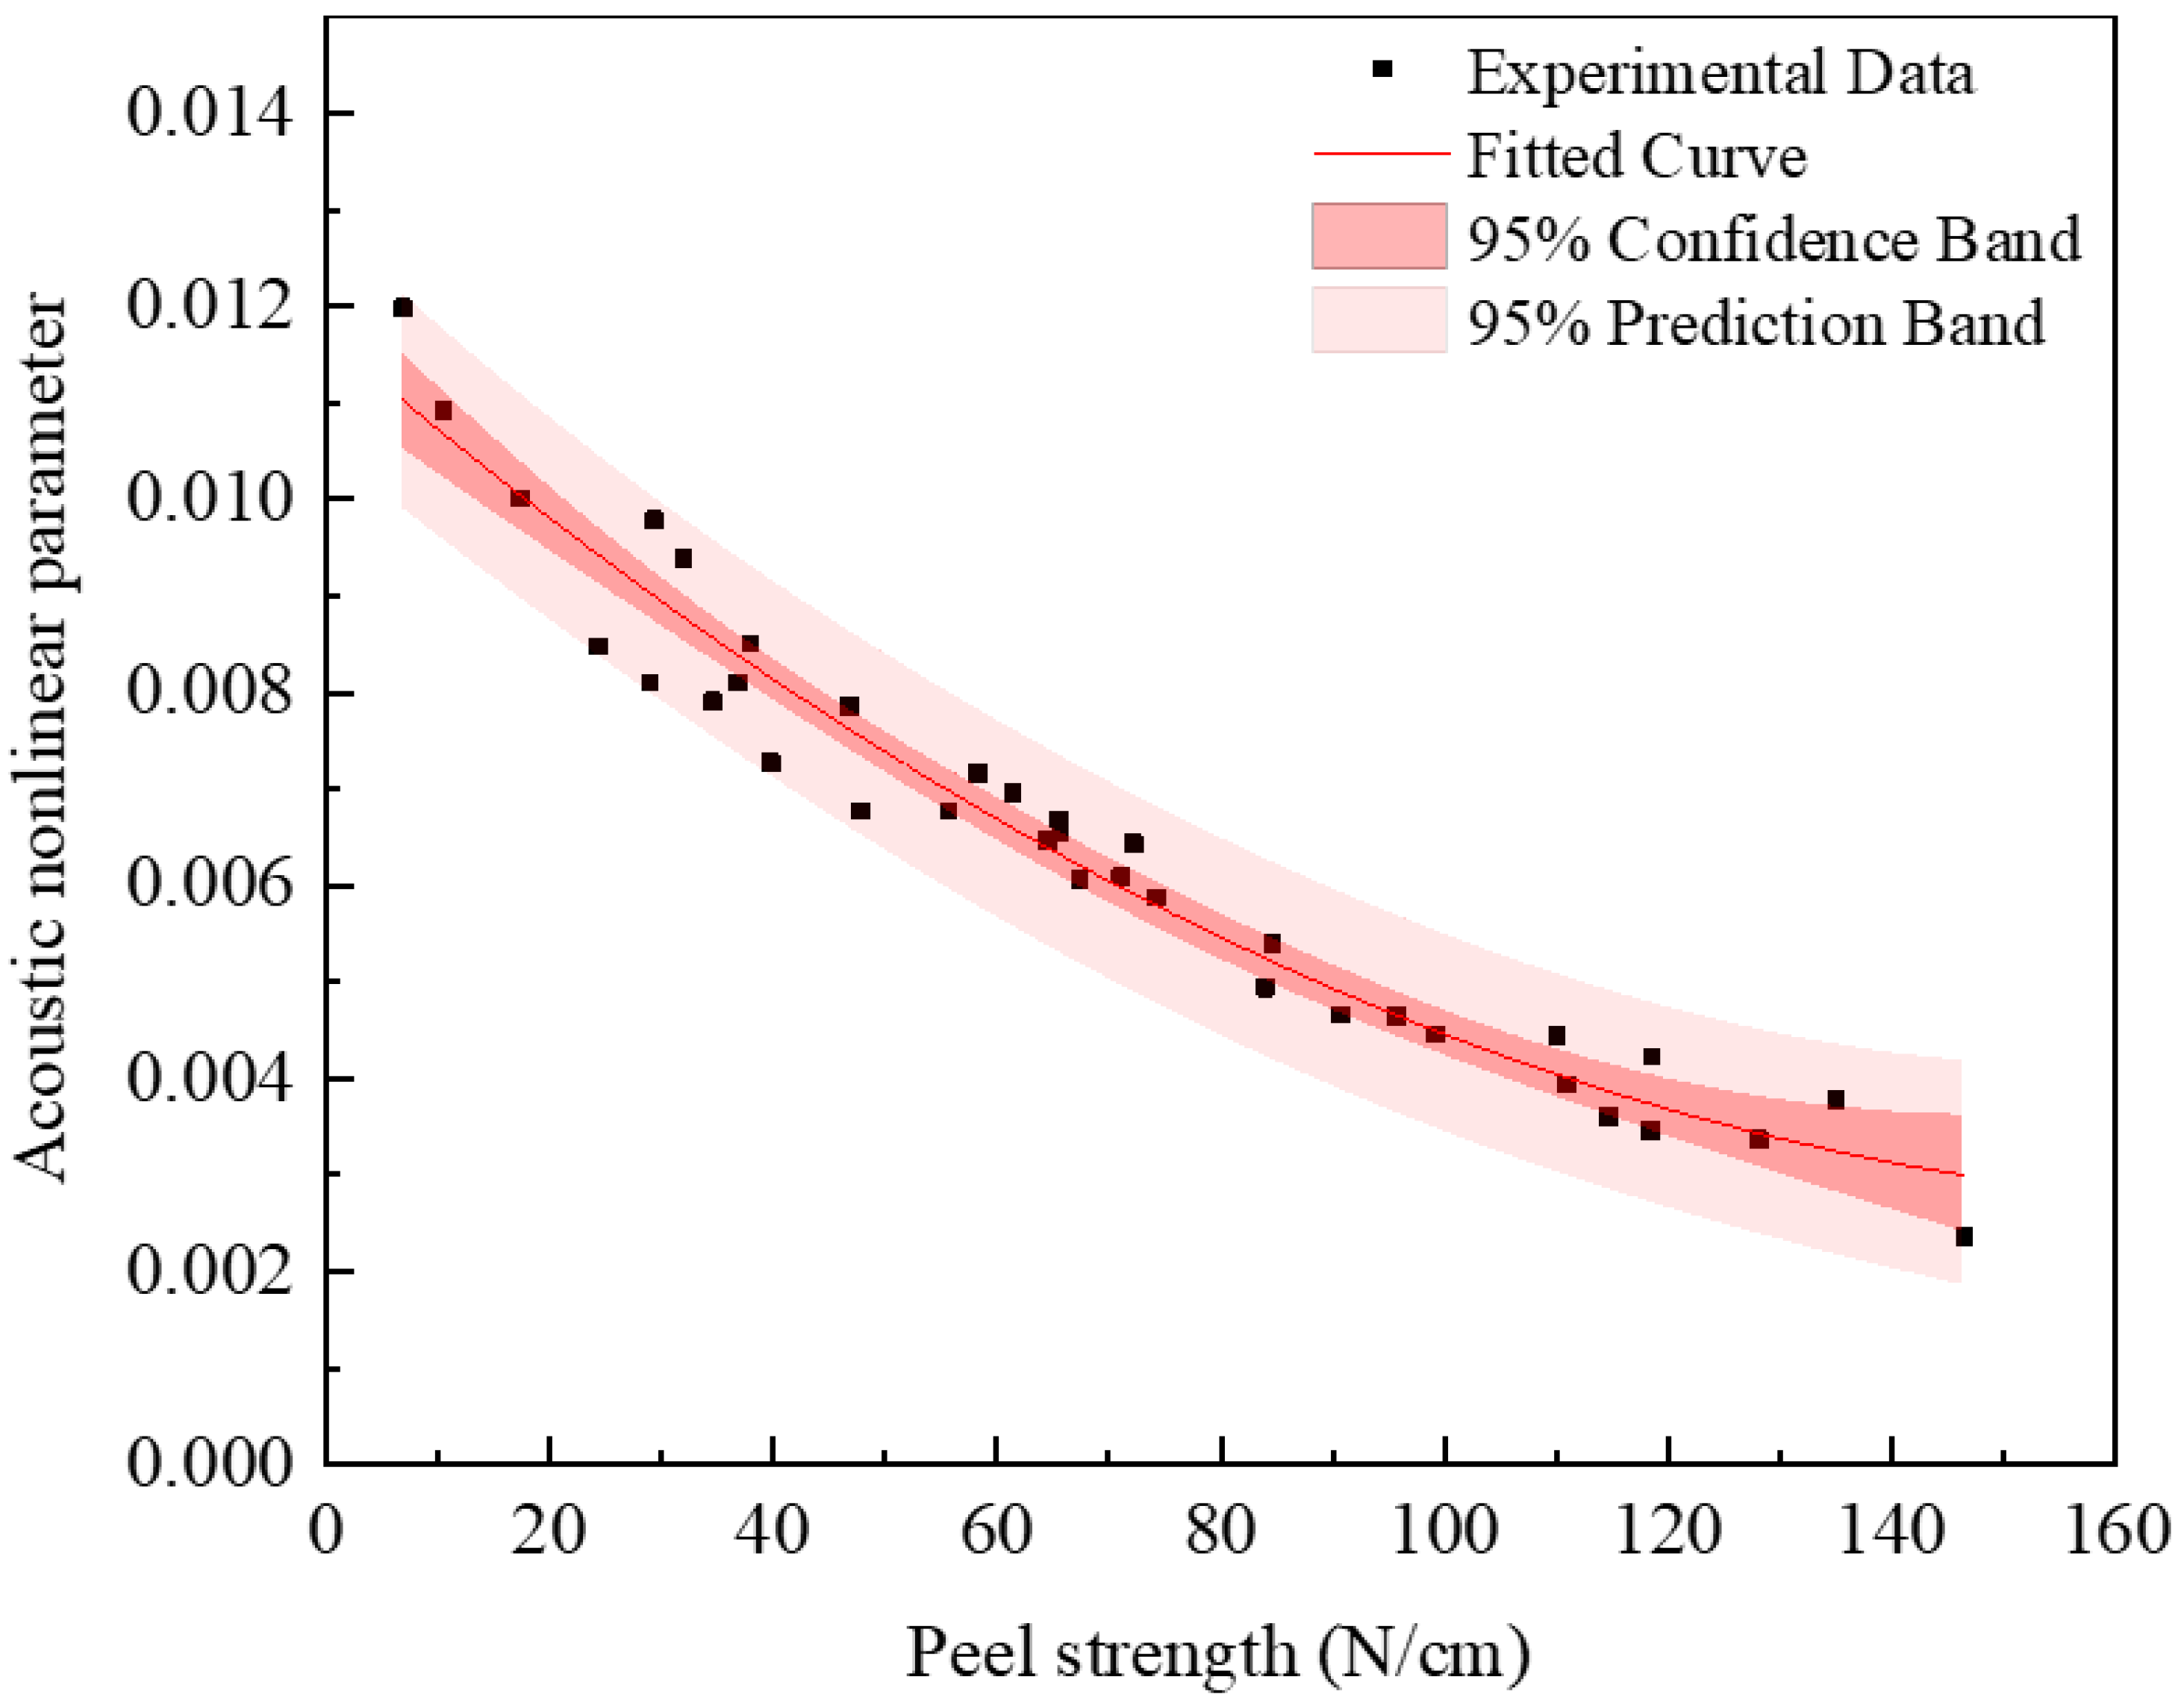
Subsequent experiments are conducted to analyze samples with varying bonding quality and to distinguish between weak and good bonding interfaces. The correlation between peel strength and the acoustic nonlinear coefficient is shown in
Figure 16. The nonlinear coefficient is higher in areas with weaker bonding and lower in areas with stronger bonding. In addition, a polynomial fit curve of peel strength versus acoustic nonlinear coefficient is calculated, accompanied by 95% confidence bands and 95% prediction bands. There is a clear downward trend in the nonlinear coefficient as the bonding strength increases. The curve displaying the polynomial fit of peel strength to the acoustic nonlinear coefficient is presented below.
Through experiment, the relationship between the specimens’ nonlinear coefficient and bonding strength is established. It is shown that as the bonding strength increases, the acoustic nonlinear coefficient drops roughly linearly. This phenomenon underscores the good bonding between the hot-melt adhesive and the pipe at an optimal interface characterized by minimal interfacial interaction. Consequently, this good bonding leads to a decrease in second harmonic intensity and a smaller acoustic nonlinear coefficient. As the bonding strength weakens, a slight peeling phenomenon emerges between the hot-melt adhesive and the pipe surface, accompanied by increased interfacial interaction. This results in an amplification of the second harmonic amplitude and a rapid increase in the acoustic nonlinear coefficient. The acoustic nonlinear coefficient can more accurately reflect the specimen bonding strength changes in the range of 0 N/cm~150 N/cm. Hence, assessing the bonding strength using an acoustic nonlinear coefficient offers a high degree of reliability.


