Abstract
Bearings are usually used at high-speed and high-load conditions, so the bearing sleeve must be able to withstand large contact stress, which requires heat treatment. However, during the quenching process of the bearing sleeve, a vapor film is formed on the surface. Since the vapor film is not uniform along the axial direction during the process of boiling and breaking, it will cause uneven distortion of the bearing sleeve. This uneven distortion will cause the outer ring of the bearing to have elliptical distortion after heat treatment. However, the mechanism of this problem and how to reduce the elliptical distortion has not been completely solved. In this paper, two points on the inner wall and outer wall of the bearing sleeve in the orthogonal direction are measured by means of experiments, and the mechanism of the ellipticity distortion during the quenching process is revealed. Additionally, through its horizontal placement, oblique placement, and vertical placement, the cooling curve and cooling rate curve changes in the process of entering the quenching agent are studied; based on the cooling curve, the heat transfer coefficient of the bearing sleeve during quenching is obtained by the heat transfer equation. Input the heat transfer coefficient into the CAE heat treatment simulation software COSMAP, according to the Metallo-Thermo-Mechanics theory and the method of multi-field coupling, simulating the quenching process of GCr15 and 16MnCr5 materials. By comparison, the ellipticity value of the bearing placed at a 45° angle is smaller than that of the horizontally and vertically placed bearings, with the 16MnCr5 material having the smallest ellipticity value of 0.00016. The simulation results verified the distortion mechanism of the bearing sleeve during the quenching process and how to reduce the solution of elliptical distortion.
1. Introduction
Bearings as an important part of mechanical equipment; usually, bearings need to be used under high speed and high load conditions. In particular, the performance and machining accuracy of the shaft collar has a great influence on the use of the bearing. For example, the roundness machining error of the bearing sleeve alone has an important influence on the bearing installation, the reduction in vibration and noise during the operation of the bearing, and the service life of the bearing. Therefore, it is one of the important indicators to evaluate the performance and quality of the bearing sleeve [1,2]. With the rapid development of aerospace, high-precision lithography, and new energy vehicles in recent years, the performance requirements of bearings are also increasing. Additionally, bearings to achieve this high performance and the high-life heat treatment quenching technology are indispensable. The purpose of quenching is to make subcooled austenite martensite or bainite transformation, the formation of martensite or bainite structure, and improve the hardness and fatigue resistance, to achieve high precision and high wear resistance of bearings important process [3]. Generally, in the quenching process, water or oil is mostly used as the cooling medium during quenching. However, when thin-walled parts, for example bearing rings, are quenched, they may be subject to uneven distortion caused by non-uniform cooling and non-uniform phase transition organization [4,5]. When the bearing is quenched in the coolant, the nucleation boiling phenomenon occurs initially because of the large temperature difference between the bearing and the coolant. The bubbles generated in nucleation boiling are gradually decomposed to form small bubbles and adsorbed on the bearing surface as a vapor film. This vapor film hinders heat transfer and causes the heat transfer rate to slow down. Later, as the bearing temperature decreases, the surface tension of the vapor film reaches a critical value, and the vapor film will film crack and bring about the phenomenon of film boiling [6]. In this study, visualization of the bearing quenching process reveals that film boiling and vapor film rupture are not uniform in the circumferential direction. We believe that this is most likely the reason why the bearings are prone to elliptical distortion. Additionally, this uneven distortion, even if it is eliminated to some extent during the subsequent machining process, will cause the problem of uneven hardness distribution on the bearing surface, which will reduce the strength and wear resistance of the bearing surface [7]. In order to solve the problem of non-uniform distortion of bearings, J Thomas Lubben et al. proposed the use of multi-directional water spray to reduce the ellipticity of bearings. Such a method does result in a relatively uniform temperature distribution and cooling rate in the circumferential direction of the bearing rings [7]. However, this method is only meaningful for quenching a single-bearing outer ring; it is difficult to achieve when multiple-bearing outer rings are quenched simultaneously. Other researchers have inserted thermocouples into the end face of the bearing outer ring and used this method to measure the cooling profile inside the bearing outer ring and to calculate the heat transfer coefficient around the bearing outer ring end face [8]. However, this method is only applicable to the heat transfer at the end face and cannot reveal the heat transfer phenomenon in the bearing annulus, nor can it predict the non-uniform distortion mechanism in the bearing annulus.
In order to predict the diffusion, heat transfer, phase change behavior, and inelastic stress/strain behavior during carburizing quenching by numerical simulation, Inoue and Ju proposed the metallo-thermo-mechanics theory and a numerical simulation method based on multi-field coupling [9,10,11,12,13,14,15]. The theory and the numerical simulation method provide the basis for the prediction of quench distortion. However, further detailed study of the heat transfer mechanism during bearing quenching is required to predict the pattern of bearing non-uniform distortion more finely and accurately and ultimately to find solutions to reduce quenching distortion and control quenching distortion. In particular, the corresponding heat transfer coefficients are calculated for the heat transfer inhomogeneities to improve the accuracy of the simulation of quenching distortion. In order to find a solution method to reduce the non-uniform distortion and ellipticity of the bearing, in this paper, three forms of horizontal, tilted, and vertical placement of the bearing are used to study the effect of these three forms on the cooling curve and cold rate curve of the bearing quenching during nucleation boiling, membrane boiling and subsequent heat convection. Additionally, according to the visualization observation, thermocouples were inserted at different positions on the inner and outer circumferential surfaces of the bearing sleeve to measure the temperature profiles and cold number profiles at the corresponding points, respectively. Finally, the heat capacity inverse calculation method is used to calculate the heat transfer coefficient up to each corresponding point. The comparison of the simulation results with the experimental measurements further verifies the distortion mechanism of the bearing that produces non-uniform distortion (proposed elliptical distortion) during the quenching process. A reliable basis for improving the accuracy of the multi-field coupled heat treatment simulation is presented. By comparing the simulation results of GCr15 and 16MnCr5 materials, a basis has been provided for achieving smaller ellipticity.
2. Experimental Methods and Theoretical Models
2.1. Experimental Equipment and Sample
In Figure 1, the equipment is mainly composed of a control box, a heating furnace, and a cooling device. The control box can control the temperature of the bearing heating and the rapid lifting of the guide rod. The heating furnace adopts a vertical tube furnace with a maximum temperature of 1200 °C. During heating, argon or other protective gases can be introduced. The cooling device consists of a quenching tank and a pre-heating tank in which a heater and mixer are placed. The quenching tank is connected to the pre-heating tank by an oil pump and oil circuit. Additionally, a channel is connected in the middle of the lower end of the quenching tank, so that coolant can be sprayed into the quenching tank from the bottom by an oil pump according to the required flow through. The quenching tank is then returned to the pre-heating tank from the middle and upper part of the quenching tank through the oil circuit so that the coolant can be circulated to ensure that the temperature of the coolant in the quenching tank (except near the sample) can be controlled at the experimentally set temperature value. The measurement resolution of the cooling curve can reach 1/1000 s.
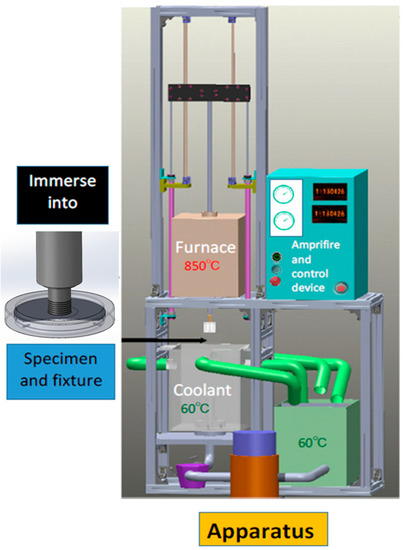
Figure 1.
Experimental equipment.
2.2. Measurement of Cooling Curves
Figure 2 shows the schematic diagram of bearing quenching, in which Figure 2a shows the dimensions of the bearing sleeve, Figure 2b shows the schematic diagram of the measurement points on the inner wall of the bearing sleeve, Figure 2c is a schematic diagram of the measurement points on the outer wall of the bearing sleeve, and Figure 2d shows a partially enlarged view. In order to more accurately measure the cooling curve, a K-type thermocouple with a diameter of 1 mm is used. Take two measurement points as an example, among which the thermocouple inserted at point A is represented as Ch1, and the thermocouple inserted at point B is represented as Ch2 and soldered the thermocouple to the bottom of the hole with silver clay. The bearing sleeve is fixed on the lifting rod through the fixture. The height of the lifting rod can be adjusted freely so that the bearing rings can be heated at the best position in the heating furnace and quenched at a suitable position in the quenching tank. As shown in Figure 3, there are three ways of fixing the bearing sleeve.
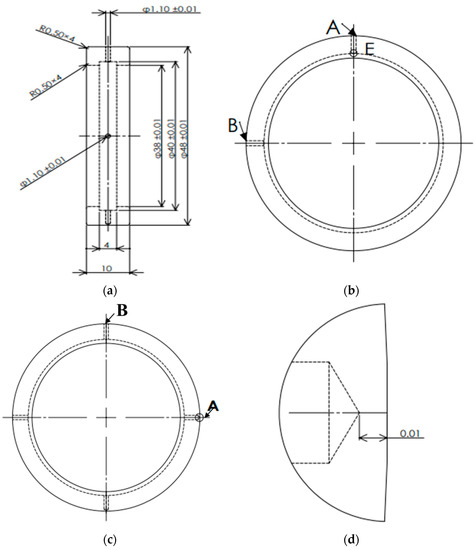
Figure 2.
Sample. (a) The dimensions of the bearing sleeve; (b) The schematic diagram of the measurement points on the inner wall of the bearing sleeve; (c) The schematic diagram of the measurement points on the outer wall of the bearing sleeve; (d) The partially enlarged view.
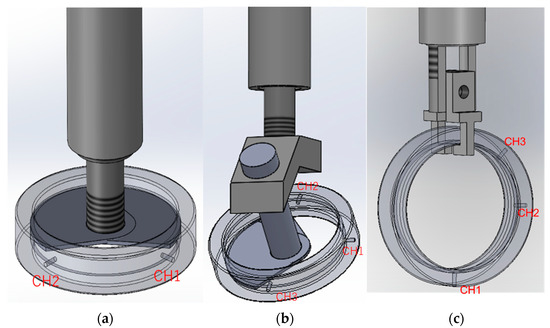
Figure 3.
Three ways of fixing the bearing rings. (a) The bearing sleeve placed horizontally; (b) The bearing sleeve placed at an inclination of 45°; (c) The bearing sleeve placed vertically.
Figure 3a shows the schematic diagram of the bearing sleeve horizontally placed during quenching, in which the angle between points CH1 and CH2 is 90°. Figure 3b shows the schematic diagram of the bearing sleeve placed at a 45-degree angle during quenching, the angle between points CH1 and CH2, as well as CH3, is 90-degree. Figure 3c shows the schematic diagram of the bearing sleeve vertically placed during quenching, in which the angle between CH2 and CH1 is 90 degrees, and the angle between CH3 and CH1 is 135 degrees.
Figure 4 shows the bearing ring heat-treatment process flowchart. Heat LP Hi-Temp 80 M bright quench oil to 60 °C and keep it constant. Argon gas is introduced into the furnace as a protective gas. Heat the stationary bearing in the furnace to 850 °C, and this process takes approximately 20 min. After the bearing test point temperature reaches 850 °C, hold the bearing for 20 min to obtain uniform austenite. Finally, the thermocouple temperature test software is turned on, and the bearing is heat treated.
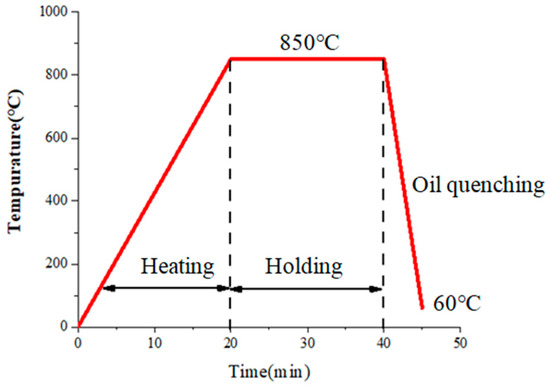
Figure 4.
Process conditions.
2.3. Experimental Results
In order to ensure the accuracy of the experiment, we conducted three cooling curve tests for each placement method under the same process conditions and calculated the cooling speed curve according to the cooling curve.
From the resulting chart of Figure 5 for horizontal placement, the cooling curves and cooling rate curves of points CH1 and CH2 on the inner wall of the bearing are quite close, while the cooling curves and cooling rate curves of the outer wall are completely different. The experimental results show a high reproducibility of cooling curves and cooling rate curves.
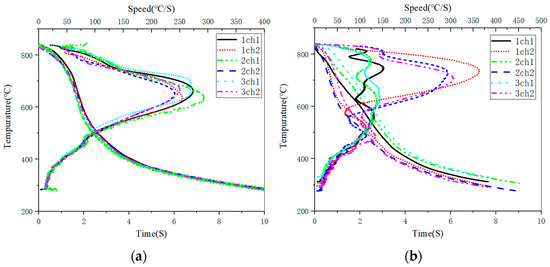
Figure 5.
Fixing method of an intruding quenching agent by horizontal placement. (a) The inner wall of the bearing; (b) The outer wall of the bearing.
From the resulting chart of Figure 6 for inclined placement, the cooling curves and cooling rate curves of points CH1, CH2, and CH3 on the inner wall of the bearing are slightly different. The results show a high reproducibility of the cooling curves, while the reproducibility of the cooling rate curves has a slight deviation. The cooling curves and cooling rate curves of points CH1 and CH2 on the outer wall of the bearing are slightly different, and the cooling rate curve of point CH3 is completely different from those of points CH1 and CH2, with a noticeably higher cooling rate than points CH1 and CH2. The experimental results show a high reproducibility of cooling curves and cooling rate curves.
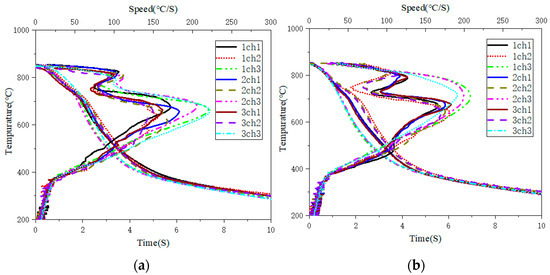
Figure 6.
Fixing method of intruding quench oil by 45° inclination. (a) The inner wall of the bearing; (b) The outer wall of the bearing.
From the resulting chart of Figure 7 for vertical placement. The cooling curves and cooling rate curves of points CH1 and CH2 on the inner wall of the bearing are the same, while the cooling rate of point CH3 is significantly lower than that of points CH1 and CH2. The cooling curves and cooling rate curves of points CH1, CH2, and CH3 on the outer wall of the bearing are different, and it can be clearly seen from the cooling rate curves that CH1 is greater than CH2, and CH2 is greater than CH3. The experimental results show a high reproducibility of cooling curves and cooling rate curves.
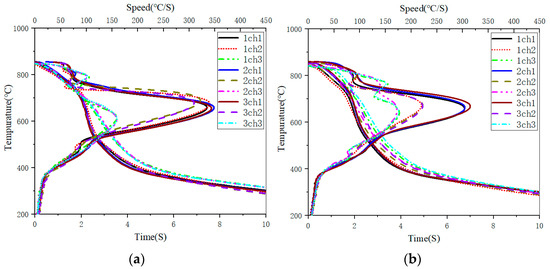
Figure 7.
Fixing method of intruding quench oil by 90° vertically. (a) The inner wall of the bearing; (b) The outer wall of the bearing.
From the measured cooling curves and calculated cooling rate curves, due to the complex phenomena of the heated fluid during the quenching process, the axial cooling rate of the bearing has significant differences, resulting in different heat transfers on the bearing ring surface. From the experimental results, it can be inferred that the uneven heat transfer of the bearing sleeve is the main cause of the elliptical distortion after bearing quenching.
2.4. Identification of Heat Transfer Coefficient
When a flowing fluid is in contact with the surface of a solid, the rate of heat transfer from the solid body to the fluid is proportional to the surface area of the solid in contact with the fluid and the temperature difference between them. The convective heat transfer coefficient can be expressed by an equation called Newton’s law of cooling, as shown in Equation (1). The heat transfer coefficient is a mathematical explanation of the temperature difference between the fluid and the solid surface due to fluid motion [7].
where Q is the heat transfer rate, h is the convective heat coefficient, A is the surface area of the solid, is the temperature of the solid surface, and is the temperature of the fluid.
Although it is difficult to measure the heat transfer coefficient h of the rapidly cooling bearing surface, the heat transfer coefficient can be obtained by substituting the measured cooling curve and cooling rate into Equation (2); this method is the concentrated heat capacity method.
where is density, C is specific heat, V is the volume of the test specimen.
Since the temperature-time curves measured in the bearing quenching experiments reflect the temperatures measured by thermocouples at fixed locations, it is, therefore, difficult to assess quantitatively the differences in the cooling state of different surfaces from this point of the cooling curve alone and to use it in the simulation. However, the heat transfer coefficient reflects the surface heat transfer rate. Compared to the cooling curve, the heat transfer coefficient is a more intuitive reflection of the variation in the quenching capacity of the medium and is one of the most influential process conditions on the numerical quenching simulation results. Due to the difference in time and temperature between the contact surface of the quenching oil and the solid, assuming that there is a time difference between the quenching process and the rupture of the oil film in contact with each surface. There is a certain time difference for the peak temperature of the maximum heat transfer coefficient. For different forms of heat transfer, a numerical simulation work program has been developed [3,9,10].
2.5. Numerical Simulation Theoretical Model
In order to explore the principle of elliptical distortion of quenched bearing sleeve, the “Metallo-Thermo-Mechanics” theory and multi-field coupled simulation method has been used to verify the principle of elliptical distortion of bearing sleeve during quenching. The elliptical distortion mechanism of the bearing sleeve after quenching is analyzed by the developed COSMAP finite element analysis software [12,14]. This paper focuses on the heat transfer equation.
Based on the first law of thermodynamics, according to the law of conservation of energy, the increment of internal energy is equal to the sum of the thermal energy transferred by the phase change, the work done, and the latent heat of the phase change [13,15]. The physical Equation can be expressed as Equation (3):
where ρ, c denotes the density and the specific heat. are the stress and the plastic strain. , and are the density of I constituent, latent heat produced by constituent, and the volume fraction of the I constituent. The sum of the volume fractions of the constituent (pearlite and bainite phases, martensite, and retained austenite) is 1 [8,10].
Based on Fourier’s law of heat conduction, as shown in Equation (4).
In Equation (5), λ, T and are the coefficient of heat conduction, the temperature, and the properties of the I constituents. The is the direction vector of heat transfer. Consider the convective heat transfer boundary between the part and the quenching process. The boundary conditions are listed as follows [8,10].
In the formula, the h, T, and are the heat transfer coefficient, real-time part temperatures, and the temperature of the coolant in quenching, respectively.
3. Material Properties
3.1. Results of GCr15 Steel
The chemical composition of the sample is shown in Table 1. Figure 8 is a schematic diagram showing the cooling curves of points Ch1 and Ch2 for the three placement methods imported into the CCT (Continuous Cooling Transformation) curves of GCr15 material. According to the cooling curve of the bearing sleeve imported into the CCT of GCr15 material and the temperature-strain diagram of the GCr15 steel, during the cooling phase of the GCr15 material, its bainitic phase transformation occurs at around 500 °C, while its martensitic phase transformation occurs at around 400 °C. Therefore, two different cooling rates had to be experimented with in order to measure the phase transformation plastic distortion of bainite and martensite in materials during the phase transformation growth process.

Table 1.
Chemical composition of GCr15 steel (wt.%).
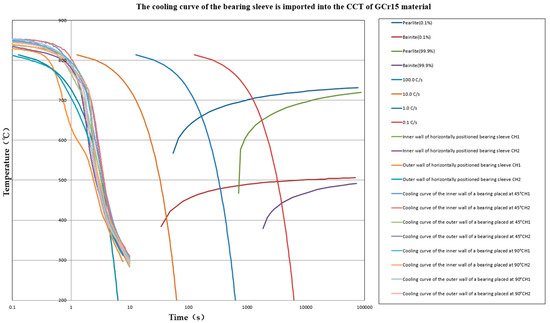
Figure 8.
The cooling curve of the bearing sleeve is imported into the continuous cooling transformation of GCr15 material.
The results of these two experiments are shown in Figure 9. The transformation plasticity coefficients of the bainitic and martensitic phases transformation for the materials are 9.952 × 10⁻⁵ [MPa−1] and 7.519 × 10⁻⁵ [MPa−1], respectively.
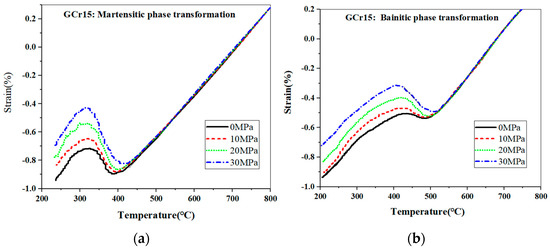
Figure 9.
Temperature–strain diagrams of the GCr15 steel. (a) Temperature–strain diagram of the martensitic phase; (b) Temperature–strain diagram of the bainitic phase.
3.2. Results of 16MnCr5 Steel
The chemical composition of the sample is shown in Table 2. Figure 10 is a schematic diagram showing the cooling curves of points Ch1 and Ch2 for the three placement methods imported into the CCT (Continuous Cooling Transformation) curves of 16MnCr5 material. According to the cooling curve of the bearing sleeve imported into the CCT of 16MnCr5 material and the temperature-strain diagram of the 16MnCr5 steel, during the cooling phase of the 16MnCr5 material, its bainitic phase transformation occurs at around 625 °C, while its martensitic phase transformation occurs at around 420 °C. Therefore, two different cooling rates had to be experimented with in order to measure the phase transformation plastic distortion of bainite and martensite in materials during the phase transformation growth process.
Table 2.
Chemical composition of 16MnCr5 steel (wt.%).
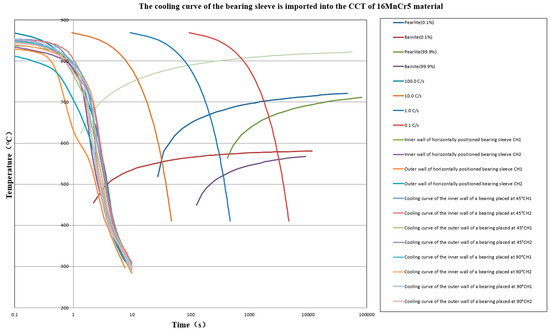
Figure 10.
The cooling curve of the bearing sleeve is imported into the continuous cooling transformation of 16MnCr5 material.
The results of these two experiments are shown in Figure 11. The transformation plasticity coefficients of the bainitic and martensitic phases transformation for the materials are 4.14 × 10⁻⁵ [MPa−1] and 4.45 × 10⁻⁶ [MPa−1], respectively.
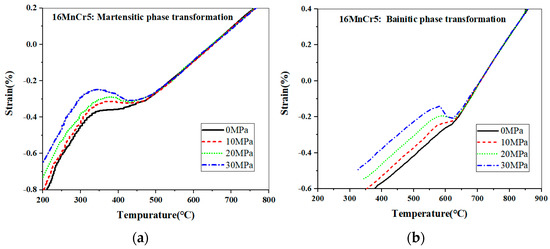
Figure 11.
Temperature–strain diagrams of the 16MnCr5 steel. (a) Temperature–strain diagram of the martensitic phase; (b) Temperature–strain diagram of the bainitic phase.
4. Results of Simulation
In order to compare the results of the three placement methods, we carried out a multi-field coupled numerical simulation for the full process of carburizing and quenching a bearing sleeve. A 3D gear geometry model was first created using GID software with a 3D six-sided element mesh. The total number of nodes in the model was 14,080, and the total number of elements was 12,000. In order to compare the simulation results more accurately, the node positions taken for each simulation result are the same. The node positions are near the thermocouple Ch1, Ch2, and Ch3 measurement points (All three measurement points are on the contact surface of the bearing).
4.1. Bearing Sleeve Heat Treatment Process
GCr15 high carbon steel and 16MnCr15 low carbon steel materials are simulated using different heat treatment processes. The GCr15 material uses the process shown in Figure 12a; the bearing was heated in the furnace for 20 min to reach 850 °C, then held for 20 min, and finally quenched in cooling oil at 60 °C. The 16MnCr5 material uses the process shown in Figure 12b. After the bearing was heated in the furnace for 20 min to reach 900 °C, 1.1% carbon potential was introduced into the heating furnace and held for 150 min. Then, the carbon potential introduced into the furnace was reduced to 1.0%, and the furnace temperature was reduced to 870 °C; after holding at 870 °C for 30 min, it was quenched in cooling oil at 60 °C.
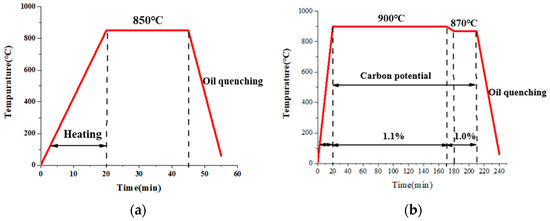
Figure 12.
Process conditions. (a) GCr15 material uses the process; (b) 16MnCr5 material uses the process.
4.2. Simulation Results of Bearing Sleeve Placed Horizontally
4.2.1. Heat Transfer Coefficients and Boundary of Simulation
Based on the experimental results in Figure 5, the heat transfer coefficient of the horizontally placed bearing sleeve is obtained by calculation based on the concentrated heat capacity method, where the black solid line is the heat transfer coefficient curve of the inner wall of the bearing, and the red solid line and red dashed line are the heat transfer coefficient curve of the outer wall of the bearing, as shown in Figure 13a. Therefore, we set the boundary conditions of the bearing to be axially symmetric for the inner wall and orthogonally symmetric for the outer wall, as shown in Figure 13b.
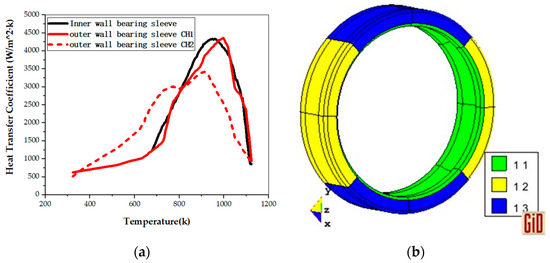
Figure 13.
Heat transfer coefficients and heat transfer boundary condition. (a) Heat transfer coefficients of the bearing sleeve placed horizontally; (b) Boundary surface of the bearing sleeve placed horizontally.
4.2.2. Simulation Results of GCr15 Steel
Figure 14 shows the simulation results of the GCr15 material-bearing sleeve placed horizontally. From Figure 14a, the martensite concentration in the bearing sleeve is uniform, with a martensite concentration of 89.308%. From Figure 14b, the hardness distribution of the bearing sleeve is slightly different, with the maximum hardness value at the measurement point being 741.852 HV. From Figure 14c, the distortion distribution of the bearing sleeve is uneven, with the maximum distortion value being 0.064296 mm and the minimum distortion value being 0.022269 mm. The actual difference is 84.05 μm. From Figure 14d, the equivalent stress distribution of the bearing sleeve is uneven, with the maximum equivalent stress on the contact surface being 27.974 MPa.
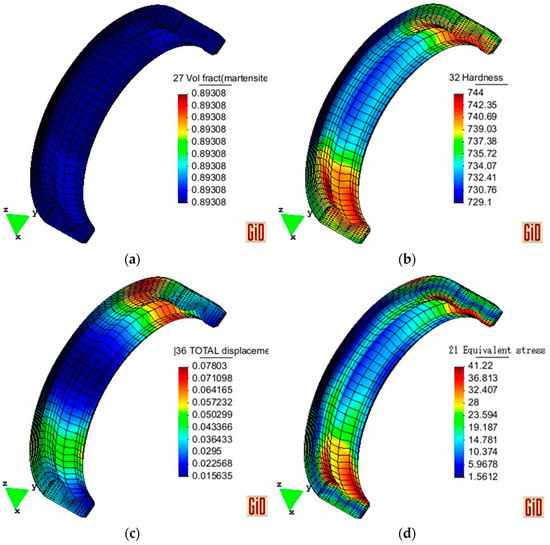
Figure 14.
Simulation results of GCr15 steel. (a) Martensite simulation results of GCr15 material; (b) Hardness simulation results of GCr15 material; (c) Distortion simulation results of GCr15 material; (d) Equivalent stress Simulation results of GCr15 material.
4.2.3. Simulation Results of 16MnCr5 Steel
Figure 15 shows the simulation results of the 16MnCr5 material-bearing sleeve placed horizontally. From Figure 15a, the martensite concentration in the outer wall of the bearing sleeve is higher than that in the core, with a surface martensite concentration of 69.078%. From Figure 15b, the hardness distribution of the bearing sleeve is the same as the martensite concentration distribution, with the maximum hardness value at the measurement point being 658.556 HV. From Figure 15c, the distortion distribution of the bearing sleeve is uneven, with the maximum distortion value being 0.027873 mm and the minimum distortion value being 0.01754 mm. The actual difference is 20.67 μm. From Figure 15d, the equivalent stress distribution of the bearing sleeve is uneven, with the maximum equivalent stress on the contact surface being 269.438 MPa. Gas carburizing is a carburizing operation process in which the workpiece is placed in a sealed carburizing furnace, a gas carburizing agent is introduced, active carbon atoms are decomposed at high temperatures, and the atoms penetrate the workpiece surface to obtain a high-carbon surface layer. As shown in Figure 15e, taking the simulation results of 16MnCr5 material placed horizontally as an example, the carbon concentration distribution is taken at the wall thickness indicated by the arrow. For the sake of accuracy, the carbon concentration values are taken at the grid nodes; the surface carbon concentration after carburizing is 1.0%, whereas the carbon concentration at a carburization layer depth of 1.104 mm is 0.331%.
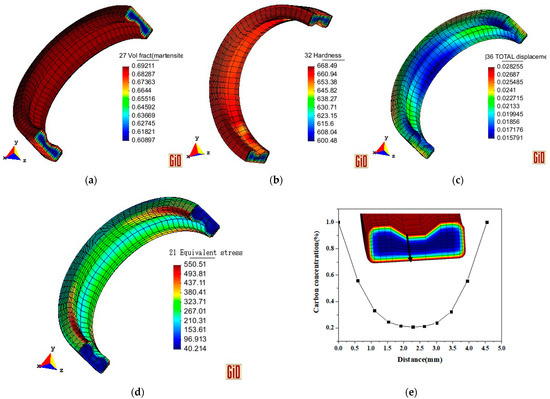
Figure 15.
Simulation results of 16MnCr5 steel. (a) Martensite simulation results of 16MnCr5 material; (b) Hardness simulation results of 16MnCr5 material; (c) Distortion simulation results of 16MnCr5 material; (d) Equivalent stress simulation results of 16MnCr5 material; (e) Carbon concentration distribution diagram.
4.3. Simulation Results of the Bearing Sleeve Placed at an Inclination of 45°
4.3.1. Heat Transfer Coefficients and Boundary of Simulation
Based on the experimental results in Figure 6, the heat transfer coefficient of the bearing sleeve placed at an inclination of 45 degrees is calculated, as shown in Figure 16a, and the boundary conditions are shown in Figure 16b. In this, the green solid line represents the heat transfer coefficient curve of the bearing inner wall measured at points CH1 and CH2, corresponding to the green area set by the boundary conditions. The yellow solid line represents the heat transfer coefficient curve of the bearing outer wall measured at points CH1 and CH2, corresponding to the yellow area set by the boundary conditions. The blue dashed line represents the heat transfer coefficient curve of the bearing inner wall measured at point CH3, corresponding to the blue area set by the boundary conditions. The pink dashed line represents the heat transfer coefficient curve of the bearing outer wall measured at point CH3, corresponding to the pink area set by the boundary conditions.
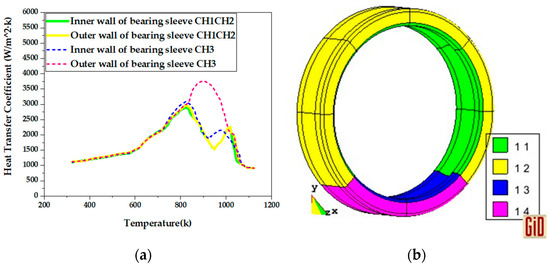
Figure 16.
Heat transfer coefficients and heat transfer boundary condition. (a) Heat transfer coefficients at an inclination of 45 degrees; (b) The boundary surface of the bearing sleeve placed at an inclination of 45 degrees.
4.3.2. Simulation Results of GCr15 Steel
Figure 17 shows the simulation results of the GCr15 material-bearing sleeve placed at an inclination of 45 degrees. From Figure 17a, the martensite concentration in the bearing sleeve is uniform, with a martensite concentration of 89.308%. From Figure 17b, the hardness distribution of the bearing ring is slightly different, with the maximum hardness value at the measurement point being 739.303 HV. From Figure 17c, the distortion distribution of the bearing sleeve is uneven, with the maximum distortion value being 0.040863 mm and the minimum distortion value being 0.017564 mm. The actual difference is 46.60 μm. From Figure 17d, the equivalent stress distribution of the bearing sleeve is uneven, with the maximum equivalent stress on the contact surface being 28.362 MPa.
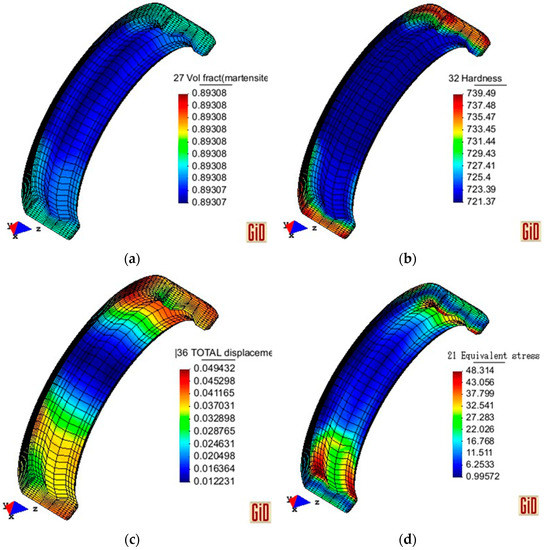
Figure 17.
Simulation results of GCr15 steel. (a) Martensite simulation results of GCr15 material; (b) Hardness simulation results of GCr15 material; (c) Distortion simulation results of GCr15 material; (d) Equivalent stress simulation results of GCr15 material.
4.3.3. Simulation Results of 16MnCr5 Steel
Figure 18 shows the simulation results of the 16MnCr5 material-bearing sleeve placed at an inclination of 45 degrees. From Figure 18a, the martensite concentration in the outer wall of the bearing sleeve is higher than that in the core, with a surface martensite concentration of 69.078%. From Figure 18b, the hardness distribution of the bearing sleeve is the same as the martensite concentration distribution, with the maximum hardness value at the measurement point being 659.246 HV. From Figure 18c, the distortion distribution of the bearing sleeve is uneven, with the maximum distortion value being 0.025237 mm and the minimum distortion value being 0.018781 mm. The actual difference is 12.80 μm. From Figure 18d, the equivalent stress distribution of the bearing sleeve is uneven, with the maximum equivalent stress on the contact surface being 261.214 MPa.
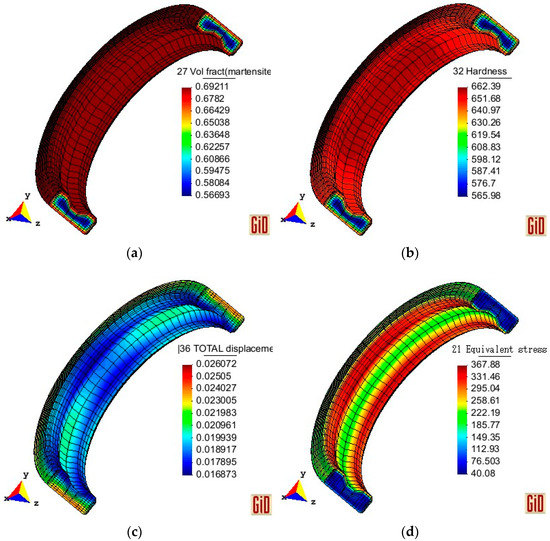
Figure 18.
Simulation results of 16MnCr5 steel. (a) Martensite simulation results of 16MnCr5 material; (b) Hardness simulation results of 16MnCr5 material; (c) Distortion simulation results of 16MnCr5 material; (d) Equivalent stress simulation results of 16MnCr5 material.
4.4. Simulation Results of the Bearing Sleeve Placed Vertically
4.4.1. Heat Transfer Coefficients and Boundary of Simulation
Based on the experimental results in Figure 7, the heat transfer coefficient of the vertically placed bearing sleeve is calculated. As shown in Figure 19a, the boundary conditions are shown in Figure 19b. In this, the blue solid line represents the heat transfer coefficient curve of the bearing inner wall measured at point CH1, corresponding to the blue area set by the boundary conditions. The pink dashed line represents the heat transfer coefficient curve of the bearing outer wall measured at point CH1, corresponding to the pink area set by the boundary conditions. The green solid line represents the heat transfer coefficient curve of the bearing inner wall measured at point CH2, corresponding to the green area set by the boundary conditions. The yellow solid line represents the heat transfer coefficient curve of the bearing outer wall measured at point CH3, corresponding to the yellow area set by the boundary conditions. The light blue solid line represents the heat transfer coefficient curve of the bearing inner wall measured at point CH3, corresponding to the light blue area set by the boundary conditions. The black dashed line represents the heat transfer coefficient curve of the bearing outer wall measured at point CH3, corresponding to the white area set by the boundary conditions.
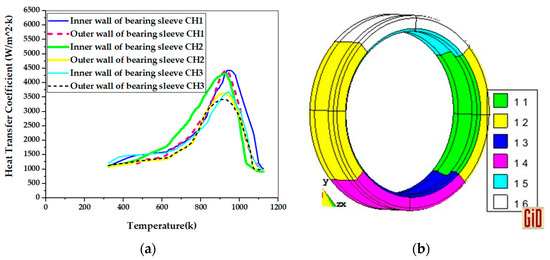
Figure 19.
Heat transfer coefficients and heat transfer boundary condition. (a) Heat transfer coefficients of the bearing sleeve placed vertically; (b) Boundary surface of the bearing sleeve placed vertically.
4.4.2. Simulation Results of GCr15 Steel
Figure 20 shows the simulation results of the GCr15 material-bearing sleeve placed vertically. From Figure 20a, the martensite concentration in the bearing sleeve is uniform, with a martensite concentration of 89.308%. From Figure 20b, the hardness distribution of the bearing sleeve is slightly different, with the maximum hardness value at the measurement point being 735.222 HV. From Figure 20c, the distortion distribution of the bearing sleeve is uneven, with the maximum distortion value being 0.043972 mm and the minimum distortion value being 0.019606 mm. The actual difference is 48.80 μm. From Figure 20d, the equivalent stress distribution of the bearing sleeve is uneven, with the maximum equivalent stress on the contact surface being 18.470 MPa.
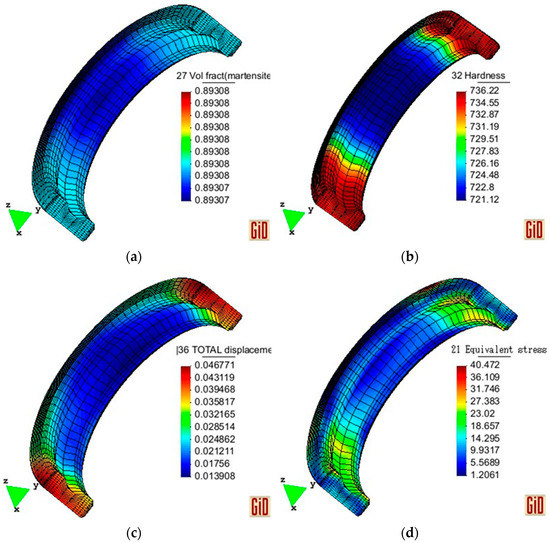
Figure 20.
Simulation results of GCr15 steel. (a) Martensite simulation results of GCr15 material; (b) Hardness simulation results of GCr15 material; (c) Distortion simulation results of GCr15 material; (d) Equivalent stress simulation results of GCr15 material.
4.4.3. Simulation Results of 16MnCr5 Steel
Figure 21 shows the simulation results of the 16MnCr5 material-bearing sleeve placed vertically. From Figure 21a, the martensite concentration in the outer wall of the bearing sleeve is higher than that in the core, with a surface martensite concentration of 69.078%. From Figure 21b, the hardness distribution of the bearing sleeve is the same as the martensite concentration distribution, with the maximum hardness value at the measurement point being 661.552 HV. From Figure 21c, the distortion distribution of the bearing sleeve is uneven, with the maximum distortion value being 0.023121 mm and the minimum distortion value being 0.015117 mm. The actual difference is 16.00 μm. From Figure 21d, the equivalent stress distribution of the bearing sleeve is uneven, with the maximum equivalent stress on the contact surface being 382.940 MPa.
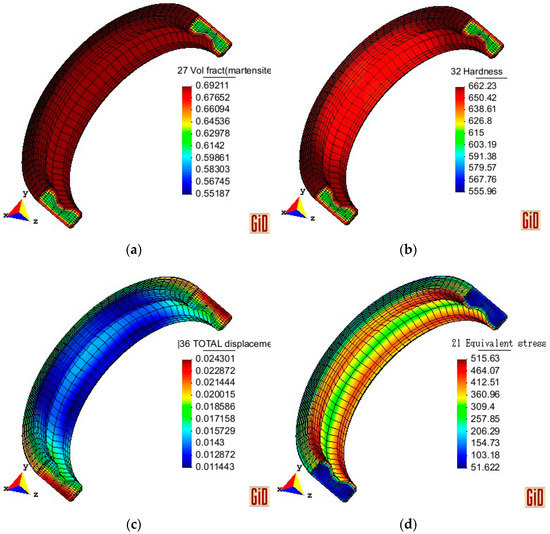
Figure 21.
Simulation results of 16MnCr5 steel. (a) Martensite simulation results of 16MnCr5 material; (b) Hardness simulation results of 16MnCr5 material; (c) Distortion simulation results of 16MnCr5 material; (d) Equivalent stress simulation results of 16MnCr5 material.
4.5. The Experimental Measurement Results of the Hardness and Ellipticity of the GCr15 Material Bearing Sleeve
After quenching the bearing sleeve, the ellipticity of the test pieces was measured using a D913A bearing gauge. The measurement accuracy is 1 micron (The surface roughness of the bearing is no more than 0.8 micrometer, and the range of roughness is less than the measurement accuracy), mainly at one-quarter, half, and three-quarters of the height of the quenched test pieces [10]. The experimental results are shown in Table 3.
Table 3.
Bearing sleeve elliptical distortion measurement results in the experiment (mm).
The formula for calculating ellipticity is shown in Equation (6).
where, is the maximum outer diameter of the bearing ring, and is the minimum outer diameter of the bearing ring.
The hardness of the bearing outer ring before and after quenching was measured using a Shanghai Heng Yi HM500 hardness tester [10]. The hardness results are shown in Table 4.
Table 4.
Bearing sleeve outer surface hardness results in the experiment (HV).
4.6. Summary of Simulation Results
From the measurement point locations shown in Figure 3, the bearing quenching simulation results are obtained, and the maximum values for the bearing sleeve contact surfaces are shown in Table 5.
Table 5.
Results of Simulation.
From the simulation results of the horizontally placed bearings, the martensite concentration, hardness, distortion, and bearing ellipticity of the GCr15 material are higher than those of the 16MnCr5 material, and the equivalent stress of the 16MnCr5 material are higher than those of the GCr15 material. The bearing ellipticity of the GCr15 material is 0.00105, and the bearing ellipticity of the 16MnCr5 material is 0.00026.
From the simulation results of the bearings placed at a 45-degree angle, the martensite concentration, hardness, distortion, and bearing ellipticity of the GCr15 material are higher than those of the 16MnCr5 material, and the equivalent stress of the 16MnCr5 material are higher than those of the GCr15 material. The ellipticity of the GCr15 material is 0.00058, and the bearing ellipticity of the 16MnCr5 material is 0.00016.
From the simulation results of the vertically placed bearings at 90°, the martensite concentration, hardness, distortion, and bearing ellipticity of the GCr15 material are higher than those of the 16MnCr5 material, and the equivalent stress of the 16MnCr5 material are higher than those of the GCr15 material. The bearing ellipticity of the GCr15 material is 0.00061, and the bearing ellipticity of the 16MnCr5 material is 0.00020.
By comparing the simulation results of the GCr15 material in three different placement methods, the martensite concentration in the bearing sleeve is consistent, and the surface hardness and equivalent stress on the contact surface are also very close. The maximum distortion and ellipticity in the horizontal placement are larger than those in the inclined and vertical placements. By comparing the simulation results of the 16MnCr5 material in three different placement methods, the martensite concentration on the bearing sleeve surface is consistent, and the maximum surface hardness is very close. The maximum equivalent stress on the contact surface of the bearing sleeve in the vertical placement is larger than that in the horizontal and inclined placements. The maximum distortion and ellipticity in the horizontal placement are larger than those in the inclined and vertical placements.
5. Conclusions
In this paper, we propose an experimental method for measuring the cooling variation of the bearing sleeve during quenching. Through the experiments, we measured the cooling curves of the bearing sleeve quenched by horizontal placement, inclined at 45° placement, and vertical placement, calculated the cooling rate curves based on the cooling curves, and calculated the heat transfer curves of the three placement methods based on the experimental data. In order to simulate the accuracy of the results, plasticity coefficients of the martensitic and bainitic phase transformation for both GCr15 and 16MnCr5 materials were calculated from the experimental results of the multi-purpose thermo-mechanical Load machine. The calculated heat transfer coefficients and phase change plasticity coefficients were imported into the COSMAP finite element program, and simulations were performed for each of the three quenching methods of GCr15 and 16MnCr5 materials.
- Firstly, the cooling curve measurement method proposed in this paper gives results with good reproducibility. By comparing the cooling curves, cooling rate curves, and heat transfer coefficients of the three placement methods for bearing sleeves, we found that the axial heat transfer of the bearing sleeve is uneven. Among them, the bearing sleeves placed at a 45-degree and vertically at 90 degrees have more uniform axial heat transfer during the quenching process compared to the horizontally placed bearing sleeves.
- Through the simulation, the results of martensite concentration, hardness, equivalent force, and distortion of the bearing sleeve after quenching were obtained, and the ellipticity values of the bearing sleeve after quenching were obtained according to the distortion results to verify the distortion mechanism of the bearing sleeve during the quenching process. Compared with the experimental results of GCr15 material in Table 3, the distortion amounts of GCr15 material placed at 45° and 90° are much smaller than the experimental measurements. In addition, the comparison of the ellipticity results shows that the ellipticity of 16MnCr5 material obtained under the quenching process after surface carburizing is less than that of the GCr15 material quenched with oil coolant. The ellipticity value of the 16MnCr5 material placed at a 45° angle is the smallest, at 0.00016.
- To further examine the results of residual stress, the results of maximum tensile residual stress and maximum compressive residual stress obtained for the two materials under the three quenching conditions are shown in Table 6. From this result, the 16MnCr5 material will generate a large compressive stress on the inner surface of the bearing collar after surface carburizing and then quenching, which has a good effect on the inner surface of the bearing collar and the bearing ball or ball between due to rolling friction and is also beneficial to improve the fatigue life of the bearing.
Table 6. Comparison of residual stress simulation results between the two materials.
Author Contributions
Methodology, D.J. and X.L.; Software, X.L. and K.I.; Validation, X.L. and D.J.; Formal analysis, D.J. and X.L.; Investigation, D.J. and X.L.; Data collation, D.J., J.C. and X.L.; Writing, D.J. and X.L.; Writing and editing, D.J. and J.C.; Visualization, D.J.; Supervision, D.J.; Project management, D.J.; Funding acquisition, D.J. All authors have read and agreed to the published version of the manuscript.
Funding
This research was funded by the National Key R&D Program of China (2018YFE0207000).
Institutional Review Board Statement
Not applicable.
Informed Consent Statement
Not applicable.
Data Availability Statement
Not applicable.
Conflicts of Interest
The authors declare no conflict of interest.
References
- Viitala, R.; Widmaier, T.; Kuosmanen, P. Subcritical vibrations of a large flexible rotor efficiently reduced by modifying the bearing inner ring roundness profile. Mech. Syst. Signal Process. 2018, 110, 42–58. [Google Scholar] [CrossRef]
- Shao, Y.Y.; Peng, W.F.; Chen, S.Q. Effect of cold treatment process on roundness of bearing ring. Mater. Res. Express 2022, 9, 026513. [Google Scholar] [CrossRef]
- Hasan, H.; Peet, M.; Jalil, J.; Bhadeshia, H. Heat transfer coefficients during quenching of steels. Heat Mass Transf. 2011, 47, 315–321. [Google Scholar] [CrossRef]
- Samuel, A.; Prabhu, K.N. Residual Stress and Distortion during Quench Hardening of Steels. J. Mater. Eng. Perform. 2022, 31, 5161–5188. [Google Scholar] [CrossRef]
- MacKenzie, D.S.; Lambert, D. Effect of quenching variables on distortion and residual stresses. In Heat Treating and Surface Engineering; ASM International: Almere, The Netherlands, 2003; pp. 184–191. [Google Scholar]
- THart, T.; Korecki, M. Advanced Distortion Control for Heat Treated Components. In Proceedings of the Heat Treat 2019: Proceedings of the 30th ASM Heat Treating Society Conference, Detroit, MI, USA, 15–17 October 2019. [Google Scholar]
- Lübben, T.; Frerichs, F. Influence of Rewetting Behavior on the Distortion of Bearing Races. J. Mater. Eng. Perform. 2013, 22, 2323–2330. [Google Scholar] [CrossRef]
- Kizawa, K. Analysis of Distortion Machanism of Rolling Rings in Normal Quenching and Carburized Quenching. In JTEKT Engineering Journal English Edition; No. 1009E; JTEKT ENGINEERING JOURNAL: Japan, Aichi, 2012; pp. 100–107. [Google Scholar]
- Kanamori, H.; Ju, D.Y. Identification of Heat Transfer Coefficients and Simulation of Quenching Distortions on Disk Probe. Mater. Trans. 2020, 6, 884–892. [Google Scholar] [CrossRef]
- Liu, Q.; Ju, D.Y.; Li, X.S.; Ishikawa, K.; Lv, R.; Lian, W.F.; Zhang, M. Verification of the Non-Axisymmetric Deformation Mechanism of Bearing Rings after Quenched in a Multi-Field Coupled Simulation. Coatings 2022, 12, 676. [Google Scholar] [CrossRef]
- Maniruzzaman, M.; Sisson, R., Jr. Heat transfer coefficients for quenching process simulation. J. De Phys. IV (Proc.) 2004, 120, 269–276. [Google Scholar]
- Ju, D.; Sahashi, M.; Omori, T.; Inoue, T. Simulation of quenching-tempering process based on metallo-thermo-mechanical. ZAIRYO (J. Soc. Mater. Sci. Jpn.) 1996, 45, 643–649. [Google Scholar] [CrossRef]
- Deng, X.H.; Ju, D.Y. Modeling and simulation of quenching and tempering process in steels. Phys. Procedia 2013, 50, 368–374. [Google Scholar] [CrossRef]
- Ju, D.Y.; Mukai, R.; Sakamaki, T. Development and application of computer simulation code COSMAP on induction heat treatment process. Int. Heat Treat. Surf. Eng. 2011, 5, 65–68. [Google Scholar] [CrossRef]
- Watanabe, Y.; Ju, D.Y. Cooperative research to optimize heat treating process condition by computer based technology. Heat Treat. Mater. 2006, 118, 349–354. [Google Scholar]


Disclaimer/Publisher’s Note: The statements, opinions and data contained in all publications are solely those of the individual author(s) and contributor(s) and not of MDPI and/or the editor(s). MDPI and/or the editor(s) disclaim responsibility for any injury to people or property resulting from any ideas, methods, instructions or products referred to in the content. |
© 2023 by the authors. Licensee MDPI, Basel, Switzerland. This article is an open access article distributed under the terms and conditions of the Creative Commons Attribution (CC BY) license (https://creativecommons.org/licenses/by/4.0/).